q42014 project finance cover.ppt - …dmi.thomsonreuters.com/...project_finance_review.pdf ·...
TRANSCRIPT

GLOBAL PROJECT FINANCE REVIEWREUTERS / Mark Blinch
GLOBAL PROJECT FINANCE REVIEWMANAGING UNDERWRITERS
Full Year 2014

]
Project Finance Regional Breakdown Jan 1 - Dec 31
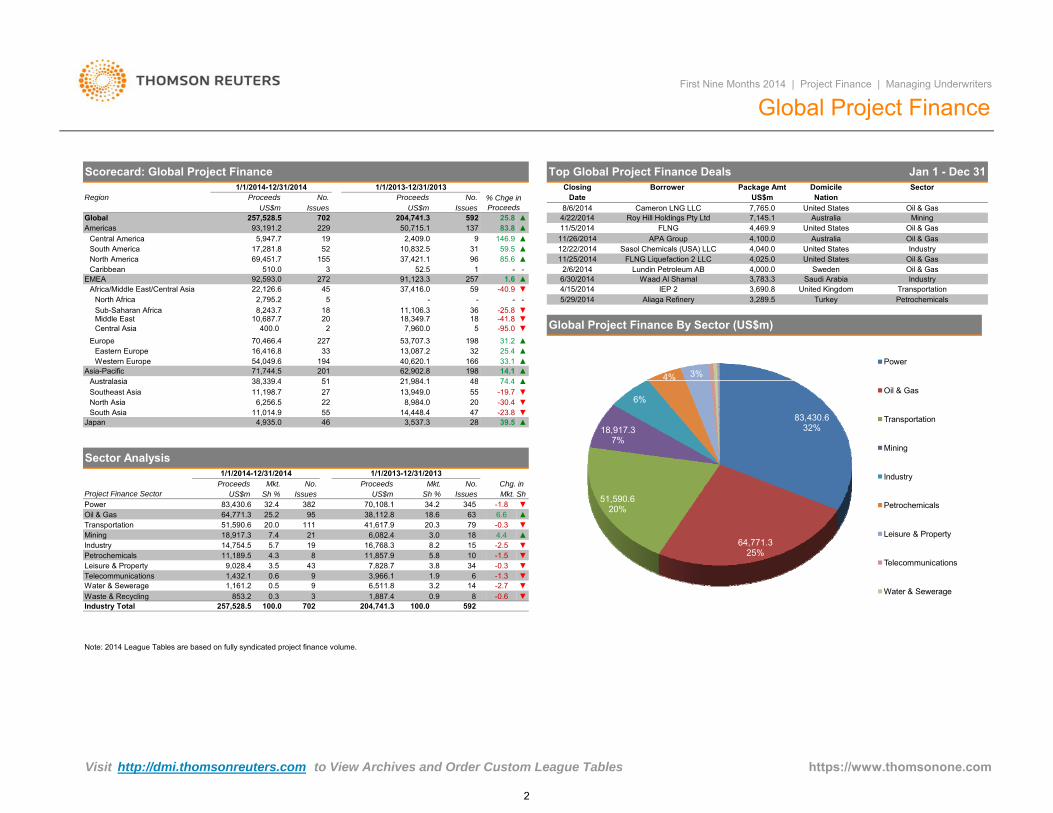
Global Project Finance for 2014 totaled US$257.5 billion, an uptick of 25.8%, to post the highest annual volume onrecord. Power projects dipped 1.8% but was still the main driver, accounting for 32.4% of global activity whichamounted to US$83.4 billion from 382 deals.
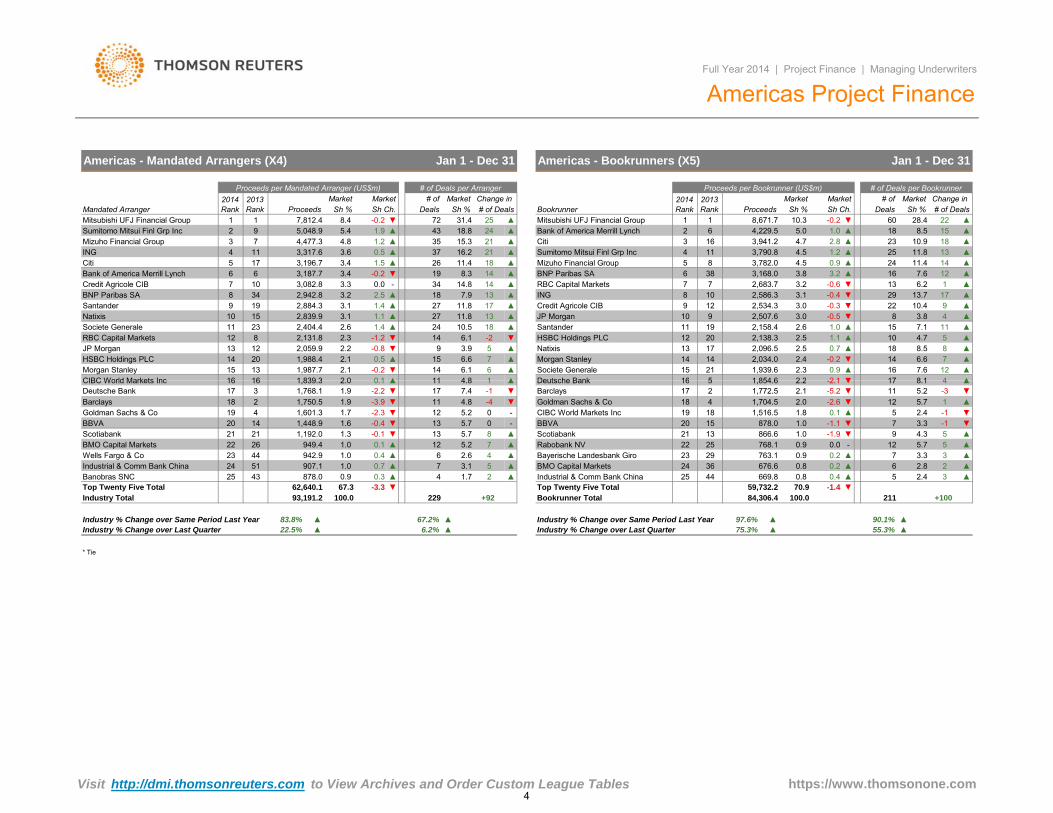
Americas Project Finance in 2014 closed at US$93.2 billion from 229 transactions, an 83.8% increase from 2013. Thefourth quarter of 2014 was the most active fourth quarter on record with US$33.8 billion deals completed, from 69facilities. The Oil & Gas sector grew 8.5% and posted US$32.2 billion from 36 deals.
EMEA 2014 Project Finance totaled US$92.6 billion, slightly up at 1.6% from 2013. Western Europe was the onlyregion with positive growth, with US$70.5 billion, up 31.2% from the previous year. The US$3 billion project financeloan of Det norske oljeselskap ASA is the largest deal completed in the fourth quarter.
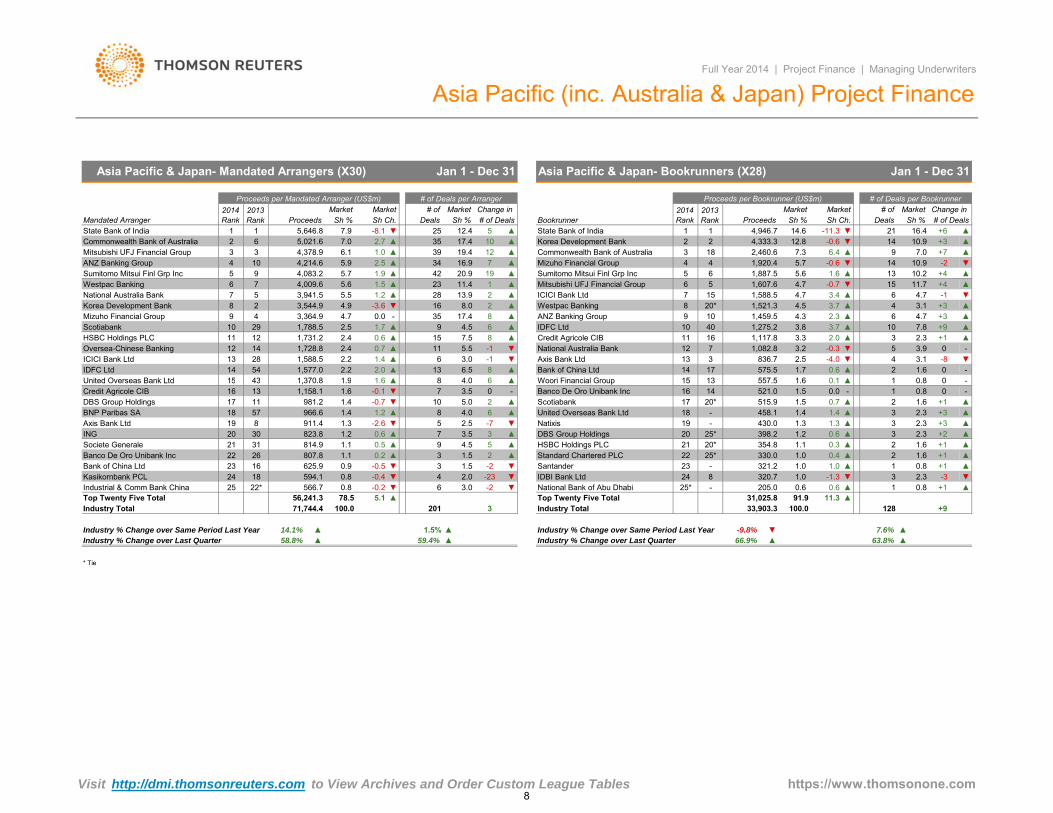
Asia Pacific and Japan reached US$71.7 billion in 2014, up 14.1% from 2013. Transportation doubled in 2014, withtotal deals closed at US$30 billion from 46 deals. The largest Transportation deal, Stella EWL Finance, was completedin October.
Full Year 2014
Global Deals Intelligence
Global Project Finance Up 26% | Americas Highest Growth at 84% I Power Projects - 32% of Market Activity
Global Project Finance ReviewMANAGING UNDERWRITERS
$0
$50
$100
$150
$200
$250
$300
2009 2010 2011 2012 2013 2014
Proc
eeds
(US$
b)
EMEA Americas Asia-Pacific & Japan
* Tie
4
4.1▲
▲
10 ▲
71▼-1
▲
▲
6
-27▲
▲2.3
6▲
▲
▼1.4
121
4
13.9 14
0.8 3
161,912.2
▲
100.0
21.1%40.3%
41.7%Industry % Change over Last Quarter
Top Twenty Five TotalIndustry Total
25.8%
257,528.5 100.0
▲▲18.6%
3.8
▲2.80.1▲9.1▲
702
▲Commonwealth Bank of Australia 14
31
149,084.1 58.01.12,874.4 1
1.952
▼
▲
Standard Chartered PLC
3,139.9
ICICI Bank Ltd
Societe Generale
279
9
18
12
16
1812 34
0.73,582.2
20
12
▲214
2.26.6
▲
2.9▲ 15
1.22,996.5
▲
332.5▲
550.3
▲
17
▲
-7
11
0▲▲
17
‐2,971.3
28
5
17
21
Santander
Barclays▲
1920
3
‐4.4
0.3
1.4 -0.2 3117
4.3 80.31.4
0.2 ▲
26
1.53,738.0 1.5 27
▲
0.4
▼
▲0.8
▲ 3.4
284.1294.0
0.331
224‐
▲
4.4
23
JP Morgan
Deutsche BankMorgan Stanley
▲
▲
▲3.3
34▲▼
7.4
714
0
-1.15
30
▲ 4.8
35▲
0.61.1
▲
Natixis▲▲-2.7
67▲
▲9.57.0
11.1 23
17
3,244.4
1.14,113.2
▲
▼
10.7
2.0
3.1
▲153.71919
8
▲
4.9
1.1
19
▲ 5.03,500.4
2.2
▲
25 3.6 5
34 ▲
63.7 ▲
2.9-1.21.8 ▲ 25
21 4.1▲20 7
▲
▲15244,938.0 ▼
-5.228
17
Korea Development Bank
4,434.5 2.7
4,946.7
4,658.78Citi
State Bank of India
▲ 52
ING 6
HSBC Holdings PLCCommonwealth Bank of Australia
8
▲
78▼
7,832.178
0.5 ▲
Natixis 10Societe Generale 9
87
5 7Credit Agricole CIB
1416
9
1Sumitomo Mitsui Finl Grp Inc
BNP Paribas SA
2 4Mizuho Financial Group 5
4 17 8,972.6
6.1
9,518.05.3
19.8
MarketProceeds15,598.5 0.7 139
790.3
Mandated Arranger1
2013 Rank
Mitsubishi UFJ Financial Group ▲
3
32▲
8.034
11.3 ▲3118 4.7 0.8
▲41▲
11.4 0.4▲ ▲
68.0
▲3.5 10.32.1
4.7▲7,529.5
▲72
11413,565.9▲ 53Mizuho Financial Group
16.23.7
1.4 BNP Paribas SA▲
10,750.013
6,146.0Sumitomo Mitsui Finl Grp Inc
1
6
Mitsubishi UFJ Financial Group 37,658.22 ▲
79 15.4155.5
▲
▲262841
6.6 0.7
3.8
▲▲3.0
7.5
36 7.0▲5 3.1Credit Agricole CIB 5,050.411.1
▲
121.0
4
173.1
7164
6 1
▲
3.0
2.82.7 49
▲1.1 531.0
80
2.25,676.62.5
State Bank of IndiaSantander
7,756.312 7,276.5
2.25,646.8
Citi
ANZ Banking Group
13
Scotiabank
15Korea Development Bank 14
National Australia Bank
1.6
1.9
1.6
1.74,264.3
1112
25
18
15
20
1819
1716
Deutsche Bank 21Bank of America Merrill Lynch
1935
Westpac Banking
KfW IPEX-Bank GmbH
13
23RBC Capital Markets
3,672.2
4,214.6
4,036.7
6,987.26,393.5
6
4,909.22
22
3,783.1
2524Barclays
22
28
23103124
0.50.0
4,447.632 1.0
0.5
4,121.5 26
MarketSh Ch.
# of
1.6
4,119.7 1.6
3.0
0.7
1.7
2223Goldman Sachs & Co
▼RBS
CIBC World Markets Inc
3,560.4
1.2 -0.83,121.9
DNB ASA
20
3.7
20 2.830
15 11
9
13
10Bank of America Merrill Lynch
RBC Capital MarketsHSBC Holdings PLC
ING
Sh %Proceeds Sh Ch.Change in Market
Deals # of DealsDeals2013 Rank
# of# of Deals
# of Deals per ArrangerChange in 2014
RankMarket
Proceeds per Mandated Arranger (US$m)
Sh % Sh %
# of Deals per BookrunnerMarket2014
Rank Sh %
1.1 3.3
Bookrunner
Proceeds per Bookrunner (US$m)Market
1.6▼ 20 3.9▲▲
2.7141.8 -0.1
2,790.59
20
2.3121.7 0.6 ▲
▲
2,757.6 1.8
21▼1.5
1.7 0.3 ▲
2,022.5
▲
2.3▼ 12
2,551.7 1.6 0.8
14 2.7
1,763.8
43
2,034.02,480.5
8 -1.31.31.3 0.3
-0.7
▲1.1
0.6
0.8
0.957 1,521.3
1554
1,588.5-0.6 ▼
▲1.01.11,704.5
512
1.2▲
0.624Westpac Banking
97,878.3 ▲8.525
147
Jan 1 - Dec 31
▲
60.5▲
Top Twenty Five Total
Industry % Change over Same Period Last Year15.2%
37.6% ▲Industry % Change over Same Period Last Year▲
Global - Mandated Arrangers (X2) Global - Bookrunners (X3)Jan 1 - Dec 31
Industry % Change over Last Quarter
Industry Total 110
5.9% ▲ ▲
https://www.thomsonone.comVisit http://dmi.thomsonreuters.com to View Archives and Order Custom League Tables
1
4,025.04,040.0
Sweden
Industry
3,690.8
Oil & GasUnited States
Top Global Project Finance Deals Jan 1 - Dec 31
3,289.5
Saudi Arabia
198 14.1
▼-95.0-41.8
▲
-
Global Project Finance By Sector (US$m)
Petrochemicals5/29/2014-25.8
IEP 2-
85.6 FLNG Liquefaction 2 LLCLundin Petroleum AB
3,783.3▼ 4/15/2014
2/6/20141.6 6/30/2014 Industry
TransportationUnited KingdomAliaga Refinery Turkey
31.2▼▲
33.1▲
▲166
▲38 339 4Asia-Pacific
Western Europe
21 984 1
59
13,087.2
74 4
25.4
-40.937,416.0
3618
11,106.3
54,049.6 194 40,620.1
5
62,902.851
7,960.0198
Eastern Europe
201
32
48
18,349.720
North America
70,466.4
Sub-Saharan AfricaMiddle East
2,795.2Africa/Middle East/Central Asia
Central Asia
8,243.7
22,126.6
Oil & Gas
Scorecard: Global Project FinanceSector
United States
United States▲
Cameron LNG LLC
Oil & Gas204,741.3
146.9Sasol Chemicals (USA) LLC▲
FLNGAPA Group
▲137
37,421.1
▲
83.8
59.596
50,715.1
10,832.5▲
4,000.0
US$mProceeds
Issues
9
Proceeds
229
US$mNo. No.
Issues702 Mining
71,744.5
North Africa
93,191.22,409.0
53,707.3
Australasia
10,687.7
- -
525,947.7
31
Global
2
16,416.8227
272
400.0
69,451.7
33
92,593.0
18
Americas
12/22/2014
45
First Nine Months 2014 | Project Finance | Managing Underwriters
Oil & GasAustralia17,281.8
Australia257,528.5
-
▼
▲
Waad Al Shamal
Global Project Finance
5
155
25752.5
25.84,469.97,145.1Roy Hill Holdings Pty Ltd
11/26/2014
1
592
91,123.3
United States
Closing
4/22/20148/6/2014 7,765.0
RegionOil & Gas
% Chge in Proceeds
NationPackage Amt
US$mDomicileBorrower
Caribbean
1/1/2014-12/31/2014
-
1/1/2013-12/31/2013
4,100.0
Date
11/5/2014
11/25/2014South AmericaCentral America 19
Europe
EMEA510.0 3
4% 3%Power
Mkt.
-2.5
▼32.4
-0.3
▼55
▲
▲
Mkt. Sh
6.6
4,935.0
38,339.4
39.5 ▲
11,198.7
3,537.3
22 ▼8,984.0▼
▼
100.0▼
6,082.4
▼
16,768.3
8 -0.6
▲
▼▼
18 3.0 8.2 15
-1.5
9 1.9 3.8
14 -2.7
11,857.9
4.4
7,828.7▼
-0.310
0.9
▼5.8
6,511.8
100.0
34
257,528.5Industry Total 592
-1.3
702
6 3,966.1
204,741.3
1,432.1Water & Sewerage
11,189.5
64,771.3
Leisure & PropertyTelecommunications
Note: 2014 League Tables are based on fully syndicated project finance volume.
Petrochemicals3.5 0.6
4.3 43
20.0 25.2
46
Project Finance Sector
8
41,617.963
20.3
21,984.1
28
79
Sh %
20
70,108.118.6
1/1/2013-12/31/2013Proceeds
-23.8
-19.7-30.4
38,112.8345 -1.8
Chg. in US$m
14,448.4
74.42751
13,949.0
34.2
48
No.Issues
No.US$m
47556,256.5
1/1/2014-12/31/2014
Japan
Australasia
9,028.4
Industry
51,590.6Mining
5.7 19 21
Transportation18,917.3
111
83,430.6Power95
Mkt.Proceeds
Oil & Gas
IssuesSh %
South Asia
382
Sector Analysis
North Asia11,014.9
Southeast Asia
Waste & Recycling 853.2 0.3 3 1,887.41,161.2 0.5 9 3.2
14,754.57.4
83,430.632%
64,771.325%
51,590.620%
18,917.37%
6%
%Oil & Gas
Transportation
Mining
Industry
Petrochemicals
Leisure & Property
Telecommunications
Water & Sewerage
https://www.thomsonone.comVisit http://dmi.thomsonreuters.com to View Archives and Order Custom League Tables
2

Honduras 274 0 2
-Uruguay 174.5 2 562.9 4 -69.0 ▼Guyana 185.0 1 - - -
▲Panama 986.8 5 71.0 1 1,289.9 ▲Mexico 4,686.9 12 2,338.0 8 100.5
Americas Project Finance Volume
Full Year 2014 | Project Finance | Managing Underwriters
Americas Project FinanceAmericas Up 84% I Highest All Time Fourth Quarter Volume
Oil & GasOil & GasIndustry
Oil & Gas
3/11/2014
10/2/2014 TPF II/Rolling Hills Portfolio Power1/8/2014
MiningPeruUnited States
CanadaRange Resources Corp10/17/2014
United StatesSasol Chemicals (USA) LLC
6/25/2014 NorthWest Redwater Partnership
7,765.0FLNG
Oil & Gas
4,469.9
FLNG Liquefaction 2 LLC
Sociedad Minera Cerro Verde SA
Carrix Inc1,690.0 United States
Petrochemicals
Transportation
146.9
▲▲
225.6 3/10/2014 1,800.0
11/25/20144,040.0
Cameron LNG LLC
Close Domicile
United States3,264.9
8/6/2014
Jan 1 - Dec 31Top Americas Deals
Date
11/5/201412/22/2014
61,545.0 United States
Sudeste Port
Peru 3,842.2 11 120.7 ▲
197.6
Borrower Sector
1,506.1
US$(m)
2,000.0
BrazilTransportation
Package Amt
United States
Proceeds No. Nation
4,025.0
▲▲▲69 93.3
United States
▲59.5
Scorecard: Americas Project Finance1/1/2014-12/31/2014
% Chge in Proceeds
Proceeds No.1/1/2013-12/31/2013
83.893,191.2 229 50,715.1US$m Issues US$m Issues
Americas
Brazil 9,481.9 22 2,912.0
96137
37,421.1123 31,113.0
5
85.6
32 6,308.1
1,740.9
South America9,298.2
North America
27 47.4
69,451.7 155United States of America 60,153.5
52 10,832.517,281.8 31Canada
Central America 5,947.7 19 2,409.0 9 ▲
Chile 1,475.3 9 5,051.7 14 -70.8Colombia 1,101.1 3 370.0 1 ▲
709.0 2 195.0 1 263.6
▼
▲Surinam 312.7 2 - - - -Ecuador
70
80
$30
$35
US$b No of Issues
-Cayman Islands 100.0 1 - - -
-
Barbados 150.0 1 - - - -
Honduras 274.0 2 - - -
3,264.9 3.5 1 1,688.8 3.3 2 0.2 ▲▼Mining 3,919.4 4.2 9
Jan 1 - Dec 31
6.6 160.0
39.9
Sector Analysis
6,155.0
100.0
Petrochemicals4
32,243.9
Proceeds Chg. in
2,290.0
50,715.2
Issues
1/1/2013-12/31/2013
Borrower Industry37,137.4
229 137
Mkt.Mkt. Sh
1/1/2014-12/31/2014
1 6.8
96
12 18 26.1
0.3
▼8.5
-17.3
▲▲
▲
No.
3.124 3,439.56
PowerOil & Gas
No.
Industry Total
Issues US$m147
0.3
Transportation 9,256.4 9.9
US$m Sh %Mkt.Proceeds
36
100.0
13,246.7
6.3
34.6
Americas Project Finance By Sector (US$m) Jan 1 - Dec 3193,191.2
Industry
▲Caribbean 510.0 3 52.5 1 871.4Dominican Republic 260.0 1 - - --
57.2 28,999.7Sh %
2 174.1
4.5 -0.3
Water & Sewerage 487.0 0.5 1 130.0
-1.0Telecommunications 136.2 0.2 2 ▼2 0.0 -1 0.2 ▲
1 586.30.3 1.2
Leisure & Property 280.0 0.3
0
10
20
30
40
50
60
$0
$5
$10
$15
$20
$25
$
1Q09 2Q 3Q 4Q
1Q10 2Q 3Q 4Q
1Q11 2Q 3Q 4Q
1Q12 2Q 3Q 4Q
1Q13 2Q 3Q 4Q
1Q14 2Q 3Q 4Q
# of
Issu
es
Pro
ceed
s (U
S$b
)
37,137.4 40%
32,243.9 35%
9,256.4 10%
6,155.0 7%
3,919.4 4%
PowerOil & GasTransportationIndustryMiningPetrochemicalsWater & SewerageLeisure & PropertyTelecommunications
https://www.thomsonone.comVisit http://dmi.thomsonreuters.com to View Archives and Order Custom League Tables3
Morgan Stanley 14 14
10
21 1,939.6Societe Generale
Americas - Mandated Arrangers (X4) Americas - Bookrunners (X5)
2,034.0
2 10.9 ▲
2 2▲2.3
Deutsche Bank12
5 1 854 616 ▲▼ 17 8 1 416 7.6
0.7 ▲2.52.4 -0.2
15▲▼
18 8.5 8 ▲14 76.6
▲HSBC Holdings PLC 12 20 2,138.3Natixis 13 17 2,096.5
112.5 1.1
1.09 -0.5
▲▲ 10 4.7 515 7.1▲Santander 11 19 2,158.4
-0.3Credit Agricole CIB 93.02.6
128 3.8
▲▲
22 10.44▼JP Morgan
3.13.02,534.3
8 10 2,586.3
2,507.6
ING ▲▼ 29 13.7 179▼
BNP Paribas SA 6 38 3,168.0
-0.4RBC Capital Markets 7 7 2,683.7 3.2
3.23.8▲13 6.2 1-0.6 ▼
11.4 14 ▲▲ 16 7.6 12 ▲
134.5 1.2▲▲
▲ 18▲ 25 11.8
0.9 ▲
18232.8
3,782.03,790.8
244.5
4.7
5 8
4,229.5Citi 3 16 3,941.2
155.0 1.0 ▲ 8.510.9
Sumitomo Mitsui Finl Grp Inc
6241Mitsubishi UFJ Financial Group 12
25 ▲
4 11Mizuho Financial Group
▲ 11 4 8 1 ▲
▲-0.2 ▼ 14
CIBC World Markets Inc 16Morgan Stanley
16 1 839 3 2 0 0 1
JP Morgan ▼ 9
13 1,987.7HSBC Holdings PLC 14
1320 1,988.4
6.112 2,059.9
2.3
2.1▲ 150.5
2.26.6
RBC Capital Markets 12 8 2,131.8
15
3.9-1.2
2.16.1
-0.8
11▲ 27
2315
▼ 14
11.8▲ 24 10.5
1.11.4Societe Generale
▲1.4 ▲ 27
2.6Natixis 10Santander 19
▲ 18 7.9
2,404.4
11.82.53.2
2,839.9 3.13.1
BNP Paribas SA 8 34 2,942.82,884.39
Citi 5-0.20.07 10 3,082.8Credit Agricole CIB
Bank of America Merrill Lynch 6 6 3,187.73.33.4 ▼ 19
- 34
3.4 11.417 3,196.7 1.5 ▲ 26▲ 37 16.23.6 0.5▲1.2 15.34.8
ING 4 11 3,317.63 7 4,477.3
Sh %72
Mizuho Financial Group
1
2013 RankBookrunner ProceedsProceeds
Mitsubishi UFJ Financial Group -0.2 ▼Sumitomo Mitsui Finl Grp Inc 2 9
1 22# of Deals
5,048.9 5.47,812.4
438.4
Sh Ch.
1.9 ▲
5
6
▲
▲-2 ▼
7
▲
14
13
21
14
13
35 21
# of Change in # of
-0.2
▲
▲
10.3# of Deals
▲60 28.4
Jan 1 - Dec 31
Americas Project Finance
MarketMarket Change in 2014 Rank Sh Ch.
2014 Rank
MarketDeals
Full Year 2014 | Project Finance | Managing Underwriters
Mandated Arranger▲
Deals Sh %
18
31.4
▲
MarketSh %Sh %
18.8
Market
17
Jan 1 - Dec 31
Bank of America Merrill Lynch
# of Deals per Bookrunner
▼
# of Deals per Arranger
▲
Proceeds per Mandated Arranger (US$m)
▲
▲
2013 Rank
Market
14.8
8,671.7
▲8.3
18
▲
Proceeds per Bookrunner (US$m)
* Tie
0.4 ▲44 669.8 0.8BMO Capital Markets 24 36 676.6 0.8
29 763.1
Industrial & Comm Bank China 25
Bayerische Landesbank Giro 23
Scotiabank 21
▲▲ 6 2.8 2 ▲
5 2.4 30.20.2 ▲ 7 3.3 3 ▲
- 12 5.7 5 ▲0.9
Rabobank NV 22 25 768.1 0.9 0.0-1.9 ▼ 9 4.3 5 ▲
▼ 7 3.3 -1 ▼13 866.6 1.0
5 2.4 -1BBVA 20 15 878.0 1.0 -1.1
1 ▲CIBC World Markets Inc 19 18 1,516.5 1.8 0.1 ▲ ▼
▼Goldman Sachs & Co 18 4 1,704.5 2.0 -2.6 ▼ 12 5.7
2.1 -5.2 ▼ 11 5.2 -32 1,772.5Barclays 17
211 +10084,306.422993,191.2 100.0
▲
▼
55.3%
Top Twenty Five Total -1.470.959,732.2
75.3% ▲90.1%Industry % Change over Same Period Last Year ▲ Industry % Change over Same Period Last Year
Industry Total 100.0
▲
-2.1
67.2%
2.2Deutsche Bank
Industry % Change over Last Quarter▲
5 1,854.6
Bookrunner Total
16 ▲▼ 17 8.1 4
Industry % Change over Last Quarter ▲
▲▲
62,640.1
0.70.3
Top Twenty Five Total
▲
878.067.3
Banobras SNC 2 ▲1.725907.1
4▼
942.97
43-3.3
0.9
23949.4
Industrial & Comm Bank China 24 3.1 52.6 41.0
1.0510.4
▲-0.1
12 5.2Wells Fargo & Co 44BMO Capital Markets 22 26 0.1
▼ 13 5.7 0
1.0▼ 131.3 5.7
Goldman Sachs & Co-0.4
1.7 5.2
Scotiabank 21 1,192.021BBVA 20 14 1,448.9
-3.9-
▼ 11 4.8 -4 ▼-2.3 ▼ 12
Barclays 18 2 1,750.5 1.919 4 1,601.3
▲ 11 4.8 1 ▲▼ 17 7.4 ▼-2.2Deutsche Bank 1.9
CIBC World Markets Inc 1617 3 1,768.1
16 1,839.3 2.0 0.1
0
-1
▲
7 ▲▲
8 ▲-
83.8%22.5%
97.6%
1.6
6
+92
▲6.2% ▲
Visit http://dmi.thomsonreuters.com to View Archives and Order Custom League Tables https://www.thomsonone.com4

Scorecard: EMEA Project Finance
Det norske oljeselskap ASA
Oil & GasIndustry
Jan 1 - Dec 31Package Amt
Top EMEA Deals
4,000.0
Domicile
2/6/2014
SectorNation
BorrowerClose
Sweden
Transportation
Lundin Petroleum ABUS$mDate
Petrochemicals
United Kingdom
Gemini OffshoreORPIC
PowerPowerPower
TurkeyZambiaNorway
Suomi Power Networks OyOman
EMEA Project Finance by Sector
3,000.0
2,540.9Kemerkoy-Yenikoy Lignite Plant Turkey12/23/2014
5/29/2014Mining
2/19/2014
5/6/201410/10/2014
Kansanshi Expansion Mine
5/14/2014 Netherlands4/30/2014
4/15/2014EMEA
Aliaga Refinery
6/30/20143,690.83,783.3
3,000.03,289.5
IEP 292,592.9
2,851.0
Petrochemicals
Full Year 2014 | Project Finance | Managing Underwriters
EMEA Slight Growth at 2% | Western Europe Accounted for US$54 Billion
Oil & Gas
Europe, Middle East & Africa Project Finance
Waad Al Shamal Saudi Arabia
Power2,879.6
Finland2,535.0
1/1/2014-12/31/2014% Chge in Proceeds
Proceeds No. Proceeds No.US$m Issues US$m Issues
272 91,123.3 257 1.6 ▲Western Europe 54,049.6 194 40,620.1 166 ▲33.1
▼▲
United Kingdom 16,537.9 40 16,589.9 43 -0.3
- - -61 4,353.4 50 57.0
-France 6,835.7
3,035.9 ▲Netherlands 5,332.3Norway 5,896.9 11
102.7
▼Germany 3,380.0 12 -3.516 3,502.5
▲Sweden 4,195.8 2 133.8 2
8 2,631.2 5
1/1/2013-12/31/2013
- -Italy 3,246.9 20 4,839.6 23 -32.9
11 3,199.7 14 -24.3
▼Finland 3,230.4 5 - -
▼Republic of Ireland 1,410.3 5 566.4 4 149.0 ▲Spain 2,421.0
- -Austria 403.2 6 159.9 4 152.2
3 2 349 8 4 88 2
▲Denmark 297.3 1 - -
▼Greece 277 2$30
J 1 2014 D b 31 2014
-Kuwait 56.8 1 1,434.0 1 -96.0 ▼Dem Rep of the Congo 135.0 1 - - -
-
Namibia 137.0 2 150.0 1 -8.7 ▼
Serbia 19.5 1 - - -
-5
-2.4 ▼7 -0.9 ▼
Telecommunications 341.1 0.4 3 2,539.1 2.8 3 Water & Sewerage 360.7 0.4 5 1,220.1 1.3
91,123.3 257 100.0
-1.1
-▲
26 Waste & Recycling 833.9
-Petrochemicals -Leisure & Property 5,796.7
2
4
100.0
7.0
6.3 2.5
272
12
▼0.9
6,400.3 6.9
1,841.924
Industry Total 92,592.9
▲
5 2,205.7 2.4 -
4.6
3,482.3 3.8 -
Mining 6,508.7
1/1/2014-12/31/2014
US$m Sh % Mkt. ShMkt.
11,002.5 12.1
30.0 22.5
Proceeds
27,295.5
1/1/2013-12/31/2013
Industry 6,862.8 7.4 8 -4.733
-9.1
US$m
Oil & Gas
Deals
▼-2.3▼9
127 21,002.9
2.0 7
▲
41
Jan 1 - Dec 31
6.5 ▲Transportation 19,342.5
142 20.9
36
Power
18,705.0
29.6
20,533.4
Chg. in
▼20.2
# ofProceedsBorrower Industry
Sector Analysis
23.1 Deals
27,441.3
Mkt.Sh %
35
# of
Turkey 8,580.2 12 8,505.5 15 0.9Eastern Europe 16,416.8 ▲33 13,087.2 32 25.4
▲1 308.9
5 2,720.2 7 60.8▲433.3
1 -
5 681.2
Bulgaria 125.0
Russian Federation 4,373.4
59 -40.9 ▼
Hungary 1,771.6
45 37,416.0
1
Saudi Arabia 4,458.1 4 6,936.0 -35.7-
United Arab Emirates 2,837.0
-Oman 3,101.0 3 269.0 1
-
5 5,764.0 2 -50.8 ▼
3 2,349.8 4 -88.2 ▼Belgium 240.5 2 2,198.7 2 -89.1 ▼Greece 277.2
-Portugal 211.1 2 95.2 3 121.7
4 5.5
▲Guernsey 133.2 1 - -
▲
-
Romania 553.7 5 385.1 2 43.8 ▲Poland 718.5
1 14.3 1 774.1 ▲Czech Republic 139.3 - - -
-84.0 ▼Georgia 80.0 1 - - -
3 997.0 2 150.8
-
1,052.8 ▲3
▼
Croatia 55.5 1 347.5 2
▲
Africa/Middle East/Central Asia 22,126.6
Zambia 3,212.0
Morocco 2,177.1 2 - - - -Ghana 2,500.0
- -Nigeria 1,378.5 3 4,671.0 6 -70.5
7 606.0 1 -
▼Egypt 618.1 3 - -
-Ivory Coast 213.0 1 462.7 2 -54.0 ▼Jordan 234.8
- -South Africa 208.2 2 2,580.8 2 -91.9
1 6,500.0 2 -96.9
▼Azerbaijan 200.0 1 - -
▼Cape Verde 160.0 1 - - - -Kazakhstan 200.0
-Uganda 160.0 1 - - --Chad 140.0 1 - - -
$0
$5
$10
$15
$20
$25
Proc
eeds
(US$
b)
January 1, 2014 - December 31, 2014
January 1, 2013 - December 31, 2013
Visit http://dmi.thomsonreuters.com to View Archives and Order Custom League Tables https://www.thomsonone.com
5

4▲
-5 ▼
Change in # of Deals per Bookrunner
Market2014 Rank # of Deals
2013 Rank
Europe, Middle East & Africa Project Finance
EMEA - Mandated Arrangers (X15)
1.4
Proceeds per Bookrunner (US$m)Change in # of2013
Rank7 5,063.3
0.7
Jan 1 - Dec 31EMEA - Bookrunners (X16)
# of MarketSh % Sh Ch. Bookrunner
ING 3Credit Agricole CIB
1
4
4,433.82Sumitomo Mitsui Finl Grp Inc 2
DealsMandated Arranger
4.8
2014 Rank
MarketSh %
Jan 1 - Dec 31
Proceeds▲
Full Year 2014 | Project Finance | Managing Underwriters
Proceeds per Mandated Arranger (US$m) # of Deals per Arranger
15 ▲# of Deals Deals
12
Market
16.9
▲29 10.7
BNP Paribas SA 10.3
Market
▲
▼▲
BNP Paribas SA▲
5.5
Market
3.0 ▲
3.9
3,407.268 1.53,614.9
14.3 328
12.534▼-12
46 3
Mitsubishi UFJ Financial Group 53,591.2
-0.1 10.33.733.9 1.4 39
▲HSBC Holdings PLC 6 9 3,267.6 1.13.5 ▲19 7.0 234 12.5 11
Natixis 16.5 8 ▲
▲▲7.0 1
▲13 3.4Societe Generale 7KfW IPEX-Bank GmbH 8 14 2,703.5
3,174.1
2,581.82.9 1.1
9▲
0.5 ▲2.8194519
Santander 11 22 1,768.0 1.9
11RBS 10 16 1,797.1 1.9 7.0▲ 3
24 8.8 121.8 0.6
0.9 ▲0.2
0
-12
Deutsche Bank 12 18 1,681.35 1,675.9Mizuho Financial Group 13 9 3.3
12 4.4▲
24 8.81.8 -0.9-0.7 ▼
▼1.8
UniCredit 14 4 1,626.8Commonwealth Bank of Australia 15 27 1,615.2 0.9 ▲
▲▲ 111.7 12 4.4 4
SEB 16 35 1 596 1 17 6 31 7 1 1
-11
Standard Chartered PLC
DNB ASA
Mizuho Financial GroupNatixis
RBC Capital Markets
▲
-▼
Rand Merchant Bank▲▼
▲
Citi
4 8
65
Societe Generale
-
HSBC Holdings PLC
ING
11
Nordea 7 -
14
3 12
8HSH Nordbank 9 -
6Credit Agricole CIB
SEB
6.9Sh Ch. Sh %
▲Sh %
3.12,126.0 4.91 3 4,490.2 5.52
Proceeds
▲-1.7
▲▲
6 3.5 31,827.1
▼
3.6 ▲▲▲ 43.5 3.0
11 6.4
2.54.2221,586.703
34 19.71.3
-42.3 11,516.8
-0.2 ▼3.21,398.4
3 1.71.7
▲30
▲2.91,266.71,250.2 2.9 ▲2.9
2.9
-2 ▼3
▲3 1.7▲
11 9 995.9
▲
333
0.2-2.1 ▼
12 16 925.2 2.1
4 2.310 4 1,031.72.3 -3
▲1,125.0 2.6 2.6
▼2.4
▲ 5 2.9
1.2 11.1 ▲ 4 2.3 2
▲▲
751.2 1.731
▲
3 ▲▲2
1.2 -22.91.3 5
13 27* 816.8 1.9 1.4
18 1.6717.511 0 6
0.756 650 0
21 5
▲▼1 4 ▲▼
1615
KfW IPEX-Bank GmbH
-2.8 ▼ 8 4.6 -7 ▼▼ 8 4.6 -3 ▼
UniCredit 25 5 376.8 0.9
1 0.6 0 -Nord/LB 24 17 381.5 0.9 -0.1
23 62 450.0 1.0 1.0 ▲0.2 ▲ 3 1.7 -1 ▼
▼ 4 2.3 0 -Sumitomo Mitsui Finl Grp Inc 22 19 467.7 1.1
1 0.6 1 ▲Mitsubishi UFJ Financial Group 21 14 470.7 1.1 -0.2
20 - 534.6 1.2 1.2 ▲
100.0 17343,702.528.061.826,950.3
▲
▲
▲5.8% 28.1%50.0%Industry % Change over Last Quarter
▼
27.5%
▲▲ 11SEB 16 35 1,596.1 17 6.31.7 1.1-612 4.4
11 4.0 8Standard Chartered PLC 17
1.4 1.3-0.8 ▼
▲1.610 1,469.4
1.3DNB ASA 18 123 1,270.6RBC Capital Markets 19 31 1,195.0 10 3.7 5
1,056.2
▲1.3 0.0
0.6 ▲▼
1.1 0.6
Barclays 20 17 1,156.70.7Scotiabank 21 51
Garanti Bank 22 48 1,032.023 47 954.2BBVA
Citi 24▲0.9
19 875.7CaixaBank SA 25 67 826.1
1.0
Industry % Change over Same Period Last Year 1.6% ▲
Top Twenty Five TotalIndustry Total
53,433.73.7
▲
▲1.1
57.7
2.20.6
▼
▲ 3-3
RBS
1.0 0.53
-
-5-0.2 6
▲78 2.9
▲16.010 3 ▲
4▼
Rand Merchant Bank▼
▲
Hypo Real Estate Holding AG
Garanti Bank▼
+15
1.1
Deutsche Bank
92,592.9
Industry % Change over Last Quarter 32.1% ▲ ▲48.5%
100.0 272
13 4.8
-11 0.656 650.0
-0.1 ▼18 13 625.8 2.34
1.5-5 2.9 0▼1.4 ▲
10 628.61.4
1 ▲
1.4 -0.7 ▼-2
Gazprombank 19 - 539.2 1 0.61.2 1.2 ▲
▲▲▲
▲
16
Top Twenty Five TotalIndustry Total +38
Industry % Change over Same Period Last Year 16.8%
17
* Tie
2.6-4
https://www.thomsonone.comVisit http://dmi.thomsonreuters.com to View Archives and Order Custom League Tables
6

-Vietnam 23.0 1 5,000.0 1 -99.5 ▼Myanmar(Burma) 85.0 1 - -
4221 3
1/1/2013-12/31/2013
Astra SLR Finance Pty Ltd Transportation1,384.7
Sun Group Finance Pty Ltd
1,401.4NRT Finance Pty Ltd
IndonesiaDonggi Senoro LNG PT
Roy Hill Holdings Pty LtdAPA Group
Viva Energy Pty Ltd7/25/2014
11/26/201410/1/2014
11/28/2014
Australia
TransportationPower
Stella EWL FInance Pty Ltd 3,070.7
6/20/2014
Australia
South Korea
6/30/20149/24/2014
9/17/201412/18/2014 1,284.8
Top 10 Nation
Thailand2,050.02,205.8
Australia
Australia TransportationOil & Gas
Transportation
Australia
1,529.4
DatePackage Amt
US$m
TransportationOil & Gas
AustraliaAustralia
Nation
4,100.0 Oil & GasMining7,145.14/22/2014
Full Year 2014 | Project Finance | Managing Underwriters
Asia Pacific (inc. Australia & Japan) Project FinanceAsia Pacific & Japan Up 14.1% | Transportation Doubled at US$30 billion
Borrower SectorClosing
1,791.1
Gulf Electric PCL
Youngchun-Sangju Highway Co
DomicileNo. Proceeds No.
62,902.8Issues
Asia-Pacific & Japan 71,744.5
Scorecard: Asia Pacific (inc. Australia & Japan)1/1/2014-12/31/2014
% Chge in Proceeds
Proceeds
21,984.1 4845
US$m Issues US$m
37,548.3 49 20,358.2
201
Southeast Asia 11,198.7 27
Australasia 38,339.4 51Australia
791.2 2New Zealand
▲▲
74.484.4
14.1198
Indonesia 4,268.4
-30.4 ▼
1,596.1 5 167.4 ▲Thailand 2,762.5
South Korea 4,937.5 15 -32.97,363.3
9.3426
-
China 1 119 0
Jan 1 - Dec 31Top Asia Pacific & Japan Project Finance Deals
13,949.0 55 ▼
405 6
▼
▲
North Asia 6,256.5 22 8,984.014
▲
8
7
-19.7
▲▲
-▼
167.2
- - -
2,527.4
20▼
-71.3
-
Singapore 859.9 1 2,997.1 2Philippines 1,879.0 5 703.1 2
592.1 3 1,125.3 3 -47.4728.7 2 - - -Laos
Malaysia
$40January 1, 2014 - December 31, 2014
4,935.0
-4221.3
1
▼▲39.5283,537.346
▼- - -
Waste & Recycling 19.4 - 1 45.5 0.1
3 5,161.8 8.2
1 Agriculture & Forestry 88.7 0.1 1 - -
--23.8-23.8
1/1/2013-12/31/2013Mkt.
6
Sector Analysis
Transportation
-93.9 ▼
Proceeds
Leisure & Property 4.1 2.4
Power32.1
Borrower Industry32
19.3 13,822.411.8
313.4 0.4
7
20,105.4
US$m Sh %
18,852.010,882.9
Industry3
Oil & Gas
46 122
5
22,991.7
Mining 8,489.2
5
6.9
8 -69.0
16.2 8.9
-85.0
-
1/1/2014-12/31/2014
26.3 93
4,172.4
100.0
5,605.81,736.82,951.7
201
Petrochemicals 1,524.2 2.1
Industry Total 71,744.4 100.0
Water & Sewerage
198 62,902.8
-29.38 ▼
10,169.02
4,332.7▲▼
▼13.6 ▲
-57.4
Sh % Deals# of
▲32.0
2.5
▼-6.2
Japan
Deals US$mChg. in Proceeds# of
2 12
Mkt. ShMkt.
▲
23
15
111.3
435.0219.0
6.6
17.3
1,586.7
India 11,014.947
55 14,448.4
China 1,119.0Mongolia 200.0 -
405.6 ▲
47South Asia 11,014.9 55
7
840.7 1.3
▼
Jan 1 - Dec 31
14,448.4
Telecommunications 954.9 1.3 4
$0
$5
$10
$15
$20
$25
$30
$35
Pro
ceed
s (U
S$b
)
January 1, 2014 December 31, 2014
January 1, 2013 - December 31, 2014
https://www.thomsonone.comVisit http://dmi.thomsonreuters.com to View Archives and Order Custom League Tables7
Asia Pacific (inc. Australia & Japan) Project Finance
10
12
4 08
15
United Overseas Bank Ltd
14
Mizuho Financial Group
2.2
State Bank of India
▲
▲ -▼
1.6
▼
1 9
8
1
2
12
▲
29
43 ▲
▲
▲▲
-11.41,728.8
1 370 8
0.7 ▲
Bank of China Ltd▼
Woori Financial Group
Axis Bank Ltd
15 13 0 1557 5 1 6 1▲ 0 8 00
▼214 17
-83.140.6
836.7 2.51.7
-4.0575.5
03.95▼1,082.8 3.2 -3.3 +12.0
▲7.8▲
4.3
-0.3
+9 ▲3 2.3
10 40 1,275.2 3.8 3.7 10▲
2.3 ▲ 4.76
11 1,117.8 ▲16
-1+34
1,459.5
▲
▲▼
+3
▼4.7
1,521.3 4.5 3.7▲ 6 4.73.4▲ 3.1
▲11.7 +4
1,588.5
▲ 13 10.25.6 1.6154.75 1,607.6
+7-0.6 14▼
+4-0.7
7.3+3 ▲
▼Mizuho Financial Group 4 4 1,920.4 5.7 -210.9
12 4,333.3
4,946.7
▲6.4 ▲ 9 7.0
21
1,887.5Mitsubishi UFJ Financial GroupSumitomo Mitsui Finl Grp Inc
2,460.6
5 6
3 18
6
Commonwealth Bank of Australia
15
9 108 20*
ICICI Bank Ltd 7Westpac BankingANZ Banking Group
12 7
6
13 3
Credit Agricole CIB
▲
▲
▲
IDFC Ltd
National Australia Bank3.06.5 8▲
1 62.0 13IDFC Ltd 14 54 1,577.0
152.2
ICICI Bank Ltd 13 1,588.528 6▲
4.5 67.5 8
11 5.5 -1
9▲1,731.2 2.4▲1,788.5
2.4HSBC Holdings PLC 11 12 0.6Oversea-Chinese Banking
2.5Scotiabank 1.7
11.423
Korea Development Bank 8 2 3,544.9National Australia Bank 5
4,009.625.5 28 13.91.2 ▲
17.4354.9
0.08.0
3,364.9 4.7 --3.6 ▼
9 416
5 9▲1.5
3,941.57
ANZ Banking Group 4 103Mitsubishi UFJ Financial Group
5.6
5.94,214.6
Westpac Banking 6Sumitomo Mitsui Finl Grp Inc 4,083.2
7
Change in
1.92.5
5.7▲▲
7.91 1
# of Market
10
Market
2.7 ▲-8.1
Sh %-11.3-0.6Korea Development Bank
+6▼▼
12.8 10.916.4
14▼ 25 ▲12.4
▲5
17.4▲
Sh Ch.Sh %
▲
1# of Deals
14.6
Market# of# of Deals per Bookrunner
Sh % Sh Ch. Deals Proceeds
2
Bookrunner2013 Rank
2013 Rank
Proceeds per Bookrunner (US$m)
Jan 1 - Dec 31
Change in # of DealsMandated Arranger Proceeds
2014 Rank
MarketDeals
Proceeds per Mandated Arranger (US$m) # of Deals per Arranger
Jan 1 - Dec 31
Market
Asia Pacific & Japan- Bookrunners (X28)
Market
Full Year 2014 | Project Finance | Managing Underwriters
Asia Pacific & Japan- Mandated Arrangers (X30)
State Bank of India 5,646.8
2014 Rank Sh %
39 19.435
▲Commonwealth Bank of Australia 2 6 5,021.6
6.1 1.016.9 7 ▲
42 ▲20.9 1934
7.04,378.93
201
57
▼Kasikornbank PCL 0.8 ▼-23566.7
4 -1.3594.1
4.08
IDBI Bank Ltd 24 8
▲
▼ 2.3 -3
56,241.3
320.7 1.025 -0.2
BNP Paribas SA17
United Overseas Bank Ltd
-23
▼
59.4%
▼ 6
1.5%
▼
6
58.8%
Industrial & Comm Bank China
Industry Total
14.1%
5.122*
71,744.4Top Twenty Five Total 78.5
24 18
8
11
Industry % Change over Last Quarter
ING
18DBS Group Holdings
Axis Bank Ltd
▲
19
Credit Agricole CIB
Industry % Change over Same Period Last Year
16 13 1,158.11.9
▲2
431.6
▲
966.6 1.2 ▲
1,370.8
Scotiabank▲
Woori Financial Group
HSBC Holdings PLC
Banco De Oro Unibank Inc
United Overseas Bank Ltd5.0
▲ Industry % Change over Same Period Last Year▲Industry % Change over Last Quarter
Industry Total
▼66.9%▲
▲
-9.8%
3Top Twenty Five Total 31,025.8
▲63.8%
+9
7.6%
128
▲
33,903.311.391.9
100.0
1.0 1.0 1▼
▲1.6 +1 ▲1.6 +10.8 +1 ▲▲Santander 23 -
330.0 1.0321.2
Standard Chartered PLC 0.4 2▲1.1 0.3
22 25*
0.7
3▲21 20*20 25* 1.2
▲ 2+22.30.6
2.3 +33▲
▲2.3 +318 - 1.4
17 20*▲
1.50.0
458.1 1.41.6 +12515.9
3▲▲
16 14 -15 13 0.1557.5
521.01.61.5 -
-11
0▲
0.80.8 0
2▲▲
-2
19
6
5 354.8DBS Group Holdings 398.2
1.3▼▲3
-7 Natixis
▲
▲▲- 1.3430.0
4.02.5
▲100.0
3.00.8-0.4 2.0
▲
1.5▲ 39
0.20.5
-0.516 625.9
5▼1.3 -2.6
3
911.4
0.926
Bank of China Ltd 23807.8
▲
1.5▼
814.931 1.1210.6 7
4.5Banco De Oro Unibank Inc 22
3.5823.820Societe Generale
1.1
30 1.2
10▼981.2 1.4 -0.71.4 8
3.5 -1.6
▼-0.1 7 015
+1 ▲National Bank of Abu Dhabi 25* - 205.0 0.6 0.6 1 0.8▲
* Tie
https://www.thomsonone.comVisit http://dmi.thomsonreuters.com to View Archives and Order Custom League Tables8

-
-
-
-
-
-
-
Asia Pacific:
E-mail: [email protected] Mandated Arranger league tables will give equal credit to the Non-Americas mandated arranger and equal credit to the Americas Tier 1 agent. Incases of consolidation, credit will be givien to the surviving/parent firm
Salvatore Reres
Bookrunner league tables will give full credit to the bookrunner, equal if joint. In cases of consolidation, credit will be given to the surviving/parentfirmEwelina Jarecka
Database coverage includes all loan transactions that have reached General close between January 1, 2014 and December 31, 2014 of whichThomson Reuters has been made aware. All current data and previous year's data is as of 6:00am EST on January 14, 2015.
League tables include limited recourse project finance, non-recourse project finance, and project finance loans and exclude loans with amaturity of less than 90 days from financial close.
Bilateral, self-arranged, commercial and unknown loans are excluded from league tables as well as loans with a maturity of less than 90 days.
All league tables are based on deal proceeds unless otherwise specified.
Regional league tables are based on Domicile Nation.
Tel: +44 207 542 2246
Full Year 2014 | Project Finance | Managing Underwriters
Project Finance Criteria Summary
If you would like to participate in the submissionprocess, receive quarterly press releases, orhave questions about league table criteria pleasecontact:
Europe
Americas
E-mail: [email protected]: +1 646-223-8455
-
-
JapanMegumi KonoTel: +813 6441 1155E-mail: [email protected]
E-mail: [email protected] All league table volumes and rankings are based on general close date instead.
Asia Pacific: Non-US dollar denominated transactions are converted to the US dollar equivalent at the time of pricing.Carina Causon
Tel: +632 459 1566
While Thomson Reuters has used reasonable endeavors to ensure that the information provided in this document is accurate and up to date as at the time of issue, neither Thomson Reuters nor its thirdparty content providers shall be liable for any errors, inaccuracies or delays in the information, nor for any actions taken in reliance thereon, nor does it endorse any views or opinions of any third partycontent provider. Thomson Reuters disclaims all warranties, express or implied, as to the accuracy or completeness of any of the content provided, or as to the fitness of the content for any purpose to theextent permitted by law. The content herein is not appropriate for the purposes of making a decision to carry out a transaction or trade and does not provide any form of advice (investment, tax, legal)amounting to investment advice, nor make any recommendations or solicitations regarding particular financial instruments, investments or products, including the buying or selling of securities. ThomsonReuters has not undertaken any liability or obligation relating to the purchase or sale of securities for or by any person in connection with this document.
© 2015 Thomson Reuters. All rights reserved.
Thomson Reuters and the Thomson Reuters logo are registered trademarks and trademarks of Thomson Reuters and its affiliated companies. Any third party name or mark herein belongs to the relevantthird party.
https://www.thomsonone.com9

© 2014 Thomson Reuters. 1006243 03/14.Thomson Reuters and the Kinesis logo are trademarks of Thomson Reuters.
FOR INFORMATION PROFESSIONALSSDC Platinum is the world’s foremost financial transactions database, covering new issues, M&A, syndicated loans, private equity, project finance, poison pills, and more.
Solution for:• Market Analysis & Trends (Geography, Sector,
Asset Class, Deal Type, Deal Size, etc.)• Deal Origination (Debt Maturity Analysis,
Company Lifecycle including Private Equity)• Pitch Creation (Firm Credentials,
Representative Acquirors)• M&A Targeting (Active Strategic/Sponsor
Acquirors, Target Company Screener)• Negotiation (T&C Benchmarking)
FOR INVESTMENT BANKERSThomson Reuters Eikon is the most intuitive and comprehensive way of staying informed. With natural-language search, you can quickly find global information, news, charts and analytics. Company and industry views provide top-level summaries, and then detailed information is just a click away. Identify new opportunities and gain deep understanding of markets, industries, companies and events.
Thomson Reuters Eikon also includes an Add-In for Microsoft® Office to help you increase your efficiency. From screening and targeting to comparables analysis, building league tables, valuing a company and
developing a client pitch book, you can do all this without leaving Microsoft Office. Search and autosuggest features in Excel make model-building easier.
Solution for:• Managing Client Relationships• Deal Origination• New Issues Pre-Marketing/Roadshows• Financial Modeling• Customized League Tables• Simple Deals screening• Valuation analysis and comparable
deal screening• On-brand pitch book creation
FOR STRATEGY AND PLANNING TEAMSThomson Reuters Deals Business Intelligence enables you to slice and dice our renowned Deals and Fees data to create ad hoc reports, analyze market trends, benchmark your performance and identify opportunities – all within a tool built into your workflow in Excel®, saving you valuable time and giving you a competitive edge.
Solution for:• Conducting market analysis and
identifying trends• Benchmarking your performance and
monitoring competitors• Targeting clients by wallet size and
banking relationship• Allocating resources more effectively by
evaluating and analyzing lost deals
Send us a sales enquiry at: financial.thomsonreuters.com/salesRead more about our products at: financial.thomsonreuters.com/products
To purchase individual Thomson Reuters Deals or League Table reports, please contact our Thomson Reuters On Demand group:
Web: http://financial.thomsonreuters.com/ondemandEmail: [email protected]
Access unique analysis for free anytime using Thomson Reuters Deals Intelligence website and receive regular updates, delivered direct to your inbox.
Go to: dmi.thomsonreuters.com/dealsintelligence
Thomson Reuters Solutions for the Deal Making Community
10