qbe insurance group investor presentation new york september 2005 presenter: neil drabsch, group cfo
TRANSCRIPT

QBE INSURANCE GROUP
INVESTOR PRESENTATION
NEW YORK
SEPTEMBER 2005Presenter:Neil Drabsch, Group CFO

• QBE is an Australian-based general insurance and reinsurance group and one of the world’s 25 largest insurers and reinsurers as measured by net written premium
– Established in 1886– Listed on ASX as QBE in 1973 following merger of three related companies– Operates in 38 countries
• QBE specialises mainly in writing commercial lines in general insurance (80%) and inward reinsurance (20%)
• QBE does not write any material life insurance or generally undertake funds management on behalf of other companies or individuals
• S&P A+ (Stable) insurer financial strength and counterparty credit rating for main insurance subsidiaries.
Company overview

1995 1,336 100.4 8.0 88 2,0451996 1,561 99.3 8.4 101 2,6941997 2,054 99.5 7.2 116 3,1051998 2,409 100.3 7.7 147 3,5051999 2,877 103.9 2.5 56 5,1232000 4,406 102.5 5.4 186 6,9862001 6,793 109.6 (2.6) (119) 8,7242002 7,723 97.7 7.2 406 10,7592003 8,350 93.8 10.4 627 11,1062004 8,766 91.2 13.1 914 14,9752005* 9,500 15.0 to 16.0 >17,000
Gross written premium
A$MCOR
%
Insurance profit ratio
%
Insurance profit A$M
Totalinvestments
A$M
Growth and insurance margin
* targets
Company overview
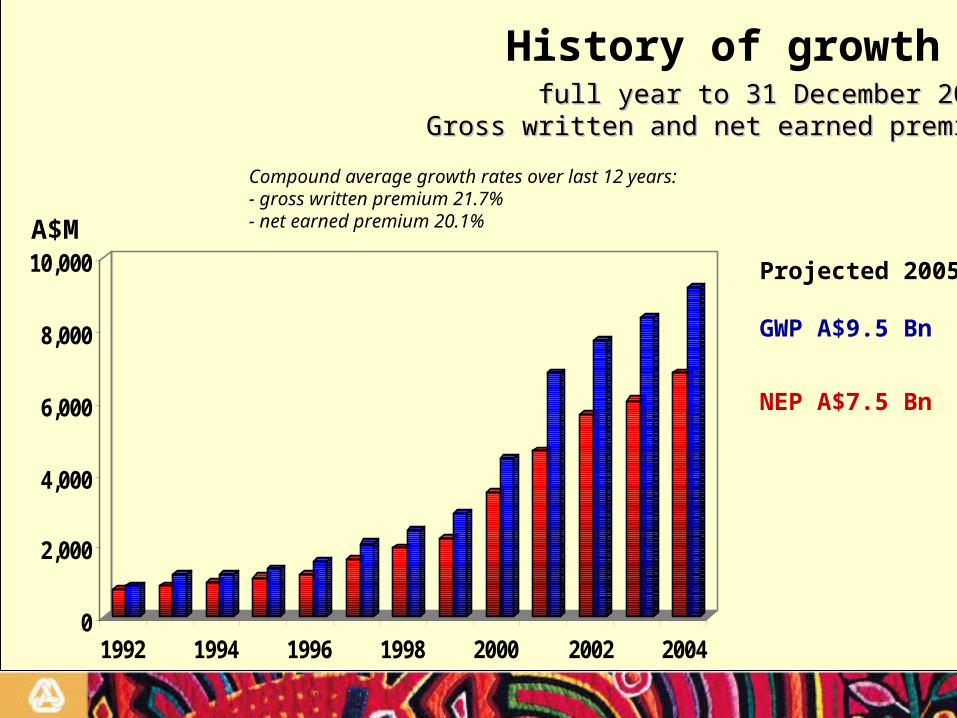
full year to 31 December 2004full year to 31 December 2004Gross written and net earned premiumGross written and net earned premium
Compound average growth rates over last 12 years:- gross written premium 21.7%- net earned premium 20.1%
0
2,000
4,000
6,000
8,000
10,000
1992 1994 1996 1998 2000 2002 2004
Projected 2005
GWP A$9.5 Bn
NEP A$7.5 Bn
A$M
History of growth

• QBE’s underlying business strategy is to maintain operations in the key global insurance markets and to be a lead underwriter for selected lines of business setting rates and conditions in the markets in which it operates
• QBE’s strategy of diversification, by product and geographic exposure, is key to managing our insurance and reinsurance risks and has been a vital ingredient in the Group’s success
• Carefully manage risk for both the asset and liability side of the balance sheet
• Relatively modest insurance net retentions
• Grow the business both organically and through acquisitions of insurance businesses, portfolios and teams of underwriters
• Embed QBE culture throughout the organisation applying proven effective risk management practices and controls
Corporate strategy

Recap half year results to 30 June 2005
• Record operating profit of A$491 million up 43%• Lowest COR in past 30 years - 90.3% (2004: 90.5%)• Record insurance profit margin - 15.8% (2004:13.6%)• Gross and net earned premium up 9% and 13% respectively (despite higher A$)• Prudential margins in outstanding claims slightly in excess of our internal range
at 95% probability of adequacy• Low risk short duration cash and fixed interest investments A$14.3 billion,
benefited from interest rate increases (particularly US$ and A$)• Achieved lower insurance risk profile• Acquisitions in the period will add premium growth of A$500 million to benefit
2006• Achieved further product and geographic diversification• All 38 countries in excellent shape and looking for growth opportunities• Cash flow from operations again strong at A$672 million, although lower than last
year (2004: A$898 million) mainly due to settlement of 2004 catastrophe claims• EPS (diluted) up 32% to 59.2 cents per share• Dividend- interim 33¢ per share 50% franked (2004: 24¢ per share)• Insurance liabilities at 30 June 2005 include a substantial allowance for large
losses and catastrophes in second half of 2005

Worldwide operationsHALF YEAR FULL YEAR
June
2005
June
2004
Dec
2004
Dec
2003***
Gross written premium $M 5,123 4,763 8,766 8,350
Gross earned premium $M 4,331 3,982 8,571 7,816
Net earned premium $M 3,506 3,114 6,781 6,036
Claims ratio % 61.0 61.6 61.3 63.3
Commission ratio% 17.0 16.8 17.5 18.2
Expense ratio %* 12.3 12.1 12.4 12.3
Combined operating ratio % 90.3 90.5 91.2 93.8
Underwriting profit $M 339 297 597 372
Investment income on policyholders’ funds $M** 214 128 317 255
Insurance profit $M 553 425 914 627
Insurance profit % to NEP 15.8 13.6 13.5 10.4
Investment income on shareholders’ funds $M 123 4 187 158
Amortisation (1) - (1) (20)
Net profit before tax $M 675 429 1,100 765* All expenses other than investment expenses, borrowing costs and amortisation of goodwill are allocated to the underwriting result
** Investment yields on average policyholder funds 4.1 % (2004 : 2.9%)
*** Not restated for AIFRS

Workers’ compensation9% (11%) Professional indemnity
9% (9%)
Marine and aviation6% (6%)
Property29% (32%)
Accident and health7% (6%)
Motor and motorcasualty
14% (12%)
Other1% (2%)
Liability23% (19%)
Financial and credit2% (3%)
Worldwide portfolio mixgross earned premiumgross earned premium
half year ended 30 June 2005half year ended 30 June 2005
Short tail 53% (54%), Long tail 47% (46%)
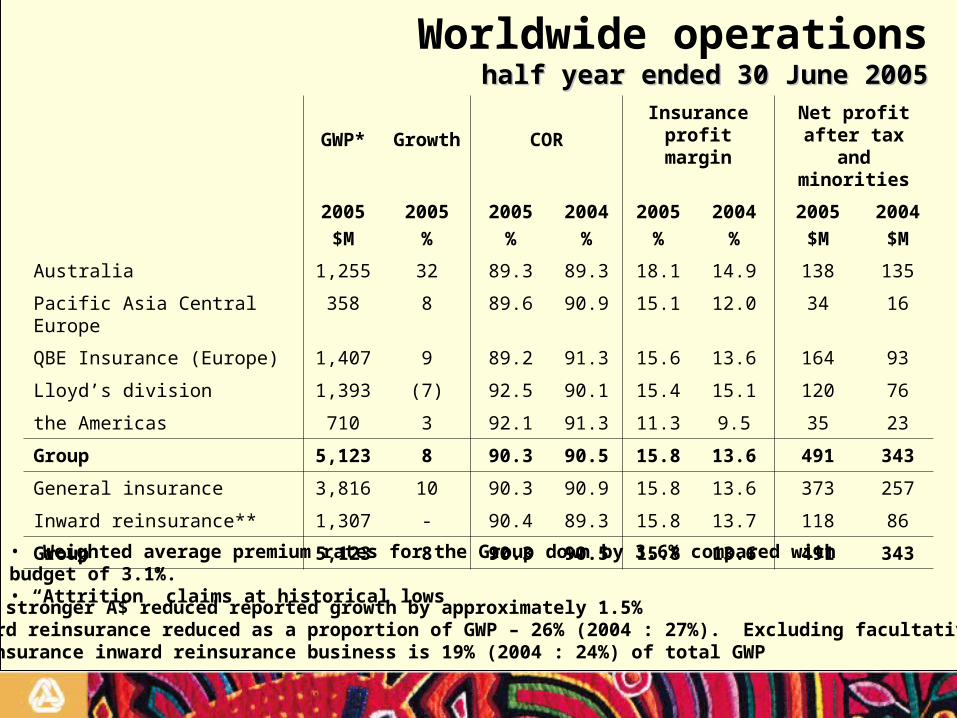
Worldwide operationshalf year ended 30 June 2005half year ended 30 June 2005
GWP* Growth COR
Insurance profit margin
Net profit after tax and
minorities
2005
$M
2005
%
2005
%
2004
%
2005
%
2004
%
2005
$M
2004
$M
Australia 1,255 32 89.3 89.3 18.1 14.9 138 135
Pacific Asia Central Europe 358 8 89.6 90.9 15.1 12.0 34 16
QBE Insurance (Europe) 1,407 9 89.2 91.3 15.6 13.6 164 93
Lloyd’s division 1,393 (7) 92.5 90.1 15.4 15.1 120 76
the Americas 710 3 92.1 91.3 11.3 9.5 35 23
Group 5,123 8 90.3 90.5 15.8 13.6 491 343
General insurance 3,816 10 90.3 90.9 15.8 13.6 373 257
Inward reinsurance** 1,307 - 90.4 89.3 15.8 13.7 118 86
Group 5,123 8 90.3 90.5 15.8 13.6 491 343
• Weighted average premium rates for the Group down by 3.6% compared with budget of 3.1%.• “Attrition” claims at historical lows
* The stronger A$ reduced reported growth by approximately 1.5%** Inward reinsurance reduced as a proportion of GWP – 26% (2004 : 27%). Excluding facultative reinsurance inward reinsurance business is 19% (2004 : 24%) of total GWP

Net invested funds
30 June 2005 31 Dec 2004
$M % $M %
Cash and cash equivalents
Short term money
Fixed interest securities and other
Equities
Property
1,492
5,362
7,492
1,344
31
9.5
34.1
47.7
8.5
0.2
1,121
5,482
6,957
1,383
32
7.5
36.6
46.5
9.2
0.2
Total financial assets and cash (1)
Borrowings (2)
15,721
1,742
100.0 14,975
1,805
100.0
Net invested funds (1) 13,979 13,170
(1) Excludes ABC financial assets and ABC securities(2) Borrowings denoted as “financial liabilities” in financial statements
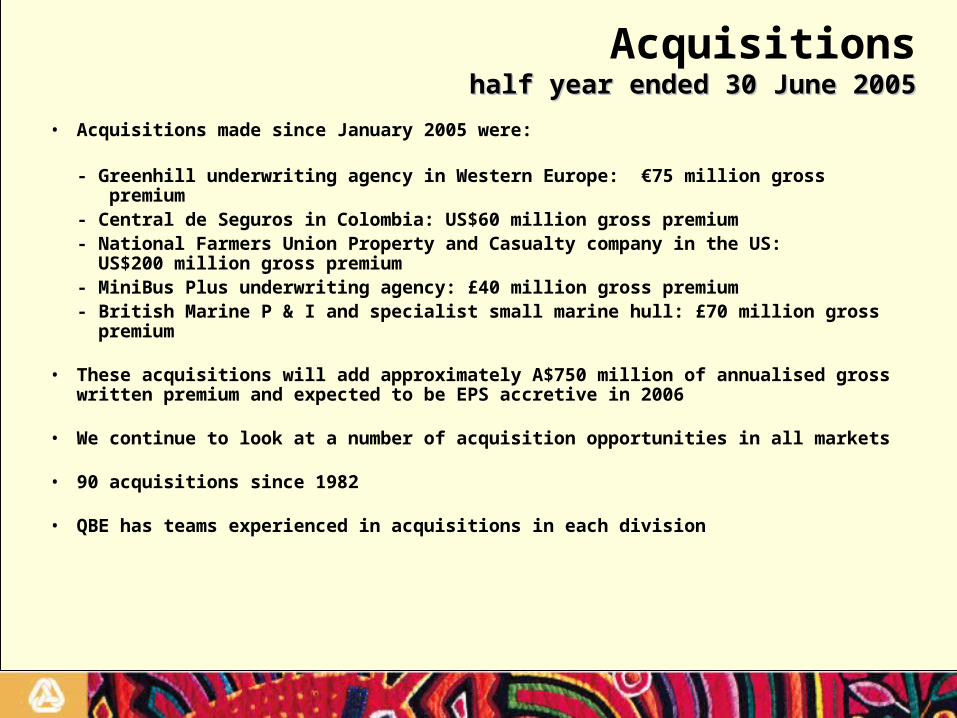
Acquisitionshalf year ended 30 June 2005half year ended 30 June 2005
• Acquisitions made since January 2005 were:
- Greenhill underwriting agency in Western Europe: €75 million gross premium- Central de Seguros in Colombia: US$60 million gross premium- National Farmers Union Property and Casualty company in the US: US$200 million gross premium- MiniBus Plus underwriting agency: £40 million gross premium - British Marine P & I and specialist small marine hull: £70 million gross premium
• These acquisitions will add approximately A$750 million of annualised gross written premium and expected to be EPS accretive in 2006
• We continue to look at a number of acquisition opportunities in all markets
• 90 acquisitions since 1982
• QBE has teams experienced in acquisitions in each division
• 4 years of cumulative premium rate increases for most commercial lines of business
• Significant gains on terms and conditions across all portfolios – e.g. higher deductibles are being retained
• More competition emerging, particularly for larger risks – however not irrational
• Recent US Hurricane Katrina market loss could be as high as US$60 billion. Losses for QBE are within allowances included in insurance liabilities at 30 June 2005
• Losses from Katrina and Rita are expected to generate increased pressure on market capital with likely hardening of property, marine and marine energy premium rates
Market conditions

Managing exposure to catastrophes
• QBE considers information from a wide range of exposure monitoring processes:
– Catastrophe modelling software, such as Risk Management Solutions (RMS) model output
– Probable Maximum Loss (PML) and Maximum Event Retention (MER) analysis
– Realistic Disaster Scenario reporting
• Assessment of potential loss is usually from the ground up, e.g. sums insured, net retentions
• This helps ensure that potential losses from a major catastrophic event are within QBE’s allowances

• RDS reporting forms an integral part of Lloyd’s catastrophe and large loss exposure monitoring processes
• QBE has adopted RDS reporting as best-practice across the whole Group for monitoring exposures to extreme events
• Examples of RDS hurricane events in the US include:– Florida windstorm (2 scenarios)– North-east US windstorm– Gulf of Mexico windstorm– Hurricane Andrew (based on current exposures)
Realistic disaster scenarios (RDS) reporting process
Managing exposure to catastrophes

The following table sets out industry loss scenarios that we apply as a base for purchasing reinsurance protection
Realistic disaster scenario US windstorms
Managing exposure to catastrophes
RDS event
Estimated industry loss
US$Bn Florida WS – Miami Florida WS – Tampa Northeast US WS Gulf of Mexico WS Hurricane Andrew
70 70 60 60* 40**
* $10B off shore energy loss, $50B onshore property loss
** Estimated present value of loss
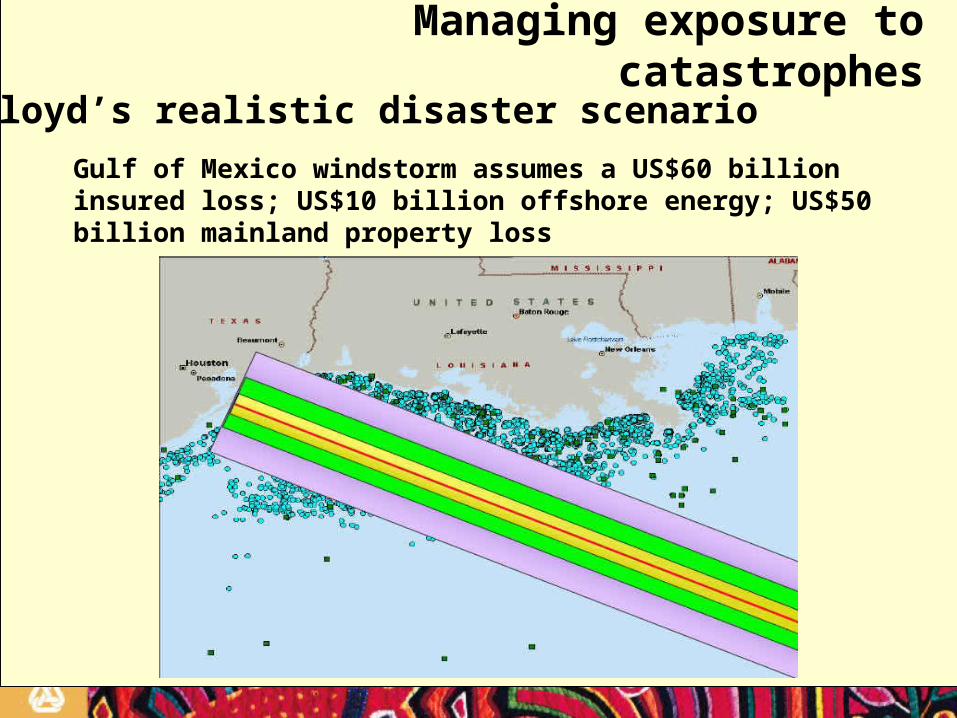
Gulf of Mexico windstorm assumes a US$60 billion insured loss; US$10 billion offshore energy; US$50 billion mainland property loss
Managing exposure to catastrophes
Lloyd’s realistic disaster scenario
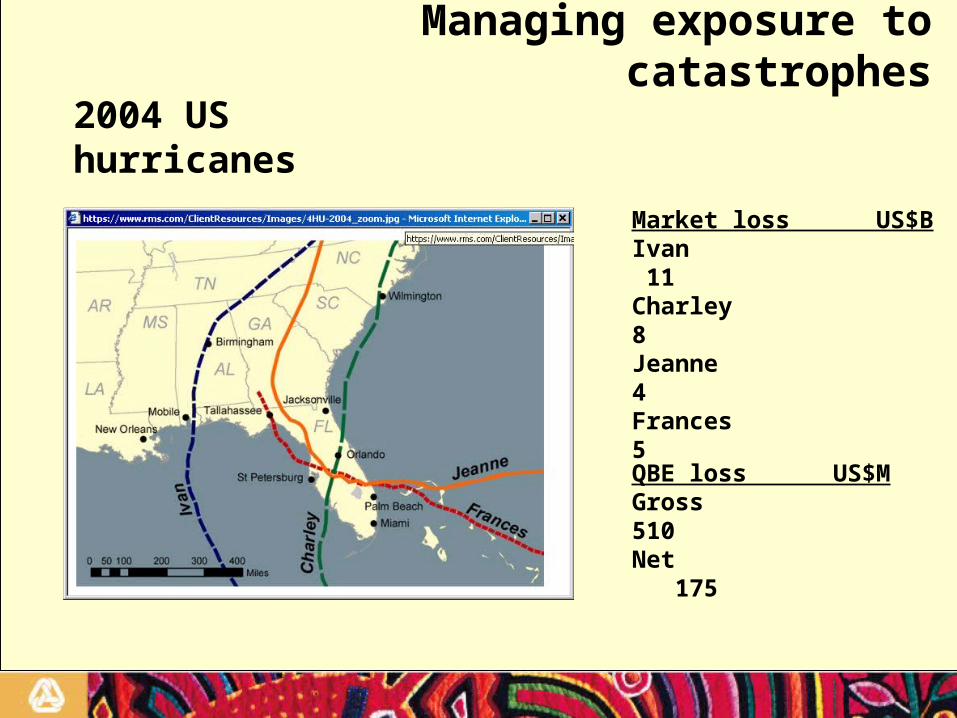
Market loss US$BIvan 11Charley 8Jeanne 4Frances 5
QBE loss US$MGross 510Net 175
2004 US hurricanes
Managing exposure to catastrophes
2005 outlook
• Target range for insurance profit margin upgraded to 15% -16% through 2005 from the previously announced 12.5% to 13.5% range
• Insurance liabilities at 30 June 2005 include a substantial allowance for large losses and catastrophes in second half of 2005
• Current premium rates are adequate to meet profit targets for the substantial majority of our portfolios
• Improved insurance policy terms and conditions are being largely maintained
• Expect to achieve 2005 gross written and net earned premium of $9.5 billion and $7.5 billion respectively
Subject to no material movement in current exchange rates; large losses and catastrophes not exceeding the allowance in our business plans; and no major fall in equity markets or interest rates:
2006 outlook
• Premium rate expectations and the strength of our insurance liabilities give us confidence for continuation of a strong level of insurance profitability
• Premium growth will be mainly driven by “acquisitions” made in 2005, although effect of Katrina and Rita likely to create positive overall premium growth for existing portfolios
• Estimated premium growth for 2006: 10% gross written premium and 12.5% net earned premium
• Large loss and catastrophe margins in premium rates expected to exceed highest experience in past seven years
• Reinsurance rates expected to firm and increase with strict risk and policy conditions retained
• Previously announced synergies from restructures and acquisitions to benefit reinsurance costs and expenses
• Investment yields on cash and fixed interest securities are expected to be higher on an investment portfolio increased by $2 billion in 2005
• Income tax rate expected to be in the range of 27% to 28%

Historical share price performance
An investment in QBE has outperformed the Australian All Ordinaries Index and inflation with a compound average annual growth rate of 17.3% over5 years, 21.1% over 10 years and 22.2% over 20 years
QBE historical share price performance - last 20 years
$0.00
$5.00
$10.00
$15.00
$20.00
$25.00
$30.00
$35.00
Jun-85 Jun-87 Jun-89 Jun-91 Jun-93 Jun-95 Jun-97 Jun-99 Jun-01 Jun-03 Jun-05
QB
E S
har
e P
rice
(A
$)
QBE Share Price Performance
QBE Share Price Performance Including Reinvestment of Dividends
ASX All Ordinaries Accumulation Index