qbe re (eurqpe) limited - bermuda monetary authority full filings class 4/qbe re (e… · qbe re...
TRANSCRIPT

QBE Re (EurQpe) Limited
Annual Report
31 December 2016
Registered Number 1378853

QBE RE (EUROPE) LIMITED
ANNUAL REPORT fort he year ended 31 December 2016
Contents Page
Directors and officers 2
Strategic report 3
Directors' report 8
IndependeDt auditors' report to the Members of QBE Re (Europe) Limited 10
Profit and loss account - technical account - general business 12
Profit and loss account - technical account - long-term business 13
Profit and loss account - non-technical account 14
Statement of other comprehensive income 15
Statement of changes in equity 16
Balance sheet 17
Notes to the financial statements 19
ANNUAL REPORT 31 DECEMBER 2016
QBE RE (EUROPE) LIMITED
DIRECTORS AND OFFICERS
Directors
W-F Au* T CWingram * MGMcCaig * JWParry R V Pryce S W Sinclair* N JD Terry D JWinkett
*non-executive Director
Appointed 19 December 2016
Former Director who served during part of the year
P ADodridge
Company secretary
E Felton Smith
Registered office
Plantation Place 30 Fenchurcb Street London EC3M3BD
Resigned 19 December 2016
Independent auditors
PricewaterhouseCoopers LLP Chartered Accountants and Statutory Auditors 7 More London Riverside London SEI 2RT
ANNUAL REPORT 2 31 DECEMBER 2016

QBE RE (EUROPE) LIMITED
STRATEGIC REPORT
Principal activity
The principal activity of QBE Re (Europe) Limited (the Company) is the transaction of reinsurance business. The Company will continue this activity through the development of its existing lines of business, while actively seelcing new opportunities for expansion and profitable growth.
The Company is a limited company registered in England and Wales with registration number 1378853 . The address of the registered office is given on page 2. The Company is a wholly owned subsidiary of QBE European Operations pic (EO plc), which is the holding company for the European Operations division (QBE EO) of QBE Insurance Group Limited (QBE Group). The Company is managed at the QBE EO division level.
Business review and future developments
The results of the Company for the year are set out in the profit and loss account on pages 12 to 14. The profit after tax for the year was €77 ,452k (2015 €77 ,297k). The Company declared and paid interim dividends tota lling €19,000k on the ordinary shares during the year (20 15 €ni l). The Directors do not recommend the payment of a final dividend (2015 €nil).
The Company continues to write International Property and Casualty business from its Dublin-based branch; European non-life multiline reinsurance and worldwide life business from its Brussels-based branch, and North American Property, International Property and US Casualty business from its Bermuda-based branch.
Key performance indicators
2016
Gross written premium €m 413.3 Gross earned premium Em 379.3 Net earned premium Em 324.8 Claims ratio* % 69.3 Commission ratio % 20.3 Expense ratio % 9.9 Combined operating ratio* % 99.5
* Claims ratio and combined operating ratio are calculated before change in equalisation provision
Premium growth during 2016 was underpinned by new business activity, with the successful execution of growth strategies in the worldwide life business.
In line with the rest of the industry, the Company experienced an increase in large risk and catastrophe claims, patt icularly compared to 2015 which benefitted from relatively benign catastrophe acti vity.
2015
351.8 347.3 301.2
38.4 17.3 11.7 67.4
On the 27 February 2017, the Ministty of Justice announced a change in the di scount rate which is applied to certain lump sum bodily injury claims. The pre-tax impact of this adjusting post balance sheet event is a loss of approximately €40,515k and this is reported within the 2016 financial statements and claims ratio.
Strategy
The strategic ambition ofQBE EO, of which the Company forms a part, is described within the business review section of the Strategic report within EO pic's annual report.
Future outlook of the business environment
Notwithstanding the competitive landscape and impact of political uncertainty, the Company has delivered a strong result and, along with operational improvements, moves into 2017 with positive momentum.
Our commitment to underwriting excellence and preserving profit margins remains central to success. Regardless of market conditions we will not waiver from this principle as it is now more important than ever.
ANNUAL REPORT 3 31 DECEI'viBER 20 16
QBE RE (EUROPE) LIMITED
STRATEGIC REPORT (continued)
Future outlook of tbe business environment (continued)
Following the European Union referendum in June 2016, and the increasingly Likely outcome that the Company can no longer effectively access the European single market from the UK, planning is well advanced to restructure the Company's business.
Principal risks and uncertainties
Risks that could affect the Company's ability to achieve its objectives are identified on a continuous basis through business unit risk and control workshops and the emerging risk process.
The main risks are regularly reported and discussed at the QBE EO Risk and Capital Committee (RCC) through the Own Risk and Solvency Assessment (ORSA). A summary of the main risk categories and risk mitigation techniques is outlined below.
Strategic risk
The Company defines strategic risk as the current and prospective impact on earnings and/or capital arising from strategic business decisions and responsiveness to external change.
The Company manages strategic risk as foUows: Considering strategic options in light of the impact on return volatility and capital requirements of the Company; and Planning and monitoring capital levels of the Company on an ongoing basis, with reference to regulatory, rating agency and economic requirements.
Insurance risk
The Company defines insurance risk as the risk of fluctuations in the timing, frequency and severity of insured events and claims settlements, relative to expectations. Our exposure to insurance risk arises from:
Underwriting/pricing; Insurance concentrations; and Reserving.
The Company manages insurance risk as follows: Analysing histoiical pricing and claims experience; Setting a tolerance to concentration risk; Monitoring and reviewing underwriting performance; and Conducting both an in-house and external actuarial review of our claims provisions, independent of our underwriting teams.
Credit risk
The Company defines credit risk as the risk of not recovering money owed to the Company by third parties, as weU as the loss in value of assets due to deterioration in credit quality. The Company's exposure to credit risk results from financial transactions with securities issuers, debtors, brokers, policyholders, reinsurers and guarantors.
The Company manages credit risk as follows: Regular review of exposure limits and credit quality levels for approved counterparties in relation to deposits and investments; and Maximising the amount of reinsurance placed with highly rated and regarded counterparties, and limiting the concentration of exposures.
ANNUAL REPORT 4 31 DECEMBER 2016

QBE RE (EUROPE) LIMITED
STRATEGIC REPORT (continued)
Principal risks and uncertainties (continued)
Group risk
The Company defi nes group risk as the risk arising specifically from being part of a wider group, including financial impact and loss of support from the QBE Group.
The Company manages group risk as fo llows: CbaUenge and oversight of independent non-executive Directors on the Company Board. Contractual arrangements in place for material services provided by other QBE Group divisions and companies. The QBE Group services framework which governs the procurement, monitoring and review of services provided to the Company by the wider QBE Group.
• Involvement ofQBE EO individuals within all material QBE Group initiatives .
Market risk
The Company defines market risk of adverse impacts on earnings resulting from changes in market factors. Market factors include but are not limited to: interest rates, credit spreads, foreign exchange rates, equity prices and commodity derivatives.
The Company manages market risk as follows: Actively managing investment assets; Perform asset and liability management to actively manage our exposure to yield curve fluctuations; Maintaining a di versified portfolio; and Hedging residual non-functional currency net asset exposures.
Liquidity risk
The Company defines liquidity risk as the risk of holding insufficient liquid assets to meet liabilities as they fall due to policyholders or creditors, or only being able to do so at excessive cost.
The Company manages liquidity risk using the following : Setting minimum levels of liquid, short term money market securities; Stress testing of liquidity relative to major catastrophe events; and Matching assets and liabilities in our major currency positions.
Operational risk
The Company defines operational risk as tbe risk of fi nancial loss resulting from inadequate or failed internal processes, people and systems or from external events. Exposure to operational risk arises from - internal fraud, external fraud, employment practices, improper business practice, technology and infrastructure failures and business and transaction processing.
The Company manages operational risk using the following: Actively monitoring our key processes and systems; Conducting scenario reviews to identify and quantify potential exposures for mitigation; and Maintaining effective segregation of duties, access controls, authorisation and reconciliation procedures.
ANNUAL REPORT 5 3 1 DECEMBER 2016
QBE RE (EUROPE) LIMITED
STRATEGIC REPORT (continued)
Solvency II and capital adequacy
The Company has been applying the Prudential Regulation Authority (PRA) approved internal capital model from 1 January 2016. The internal model is an integrated framework to support its objectives by managing risk and capital across the business. The internal model has broad scope including: capital modelling; risk identification; mitigation; assessment and monitoring, and is used in the day to day operation of the Company.
The internal model is used to help assess our ri sk and calculate the appropriate level of risk-based capital to allocate to risks to which we are exposed. The assessment of risk-based capital enables us to make decisions that involve quantitative risk reward trade-offs. The allocation of risk-based capital helps ensure that the level of risk we take is commensurate with the required returns and is within the approved risk appetite and tolerance.
In December 2016 the Board approved a Capital Adequacy Framework designed to ensure that the Company operates within a target range of capital, which exceeds the regulatory solvency capital requirements.
Corporate governance
The Company' s corporate governance structure has continued to evolve during 2016, reflecting the Boards' commitment to ensuring that it remains efficient, relevant and supportive of the strategic aims of the Company. The structure continues to comply with aU relevant regulatory and legal requirements, including the Lloyd ' s governance standards. As a member of the QBE Group, the Company is not bound by the UK Corporate Governance Code. However, as a matter of best practice, the Company' s Board seeks to comply with the Code, where practical and relevant.
Key changes to the corporate governance structure during the year were: (i) The establishment of a Compliance Management Group to support the RCC in providing co-ordinated oversight and monitoring of the Company's adherence to its Compliance Framework in meeting its legal and regulatory responsibilities;
(ii) The establishment of a Brexit Steering Group to provide oversight, direction and guidance to support the Boards in responding to the United Kingdom's exit from the European Union;
(iii) The disbanding of the Solvency II Steering Group (previously a sub-group of the RCC), the Company having received approval from the PRAto the use of the Internal Model in December 2015 and subsequent work in respect of other Solvency II related matters having been concluded or, where relevant, being now undertaken within other areas of the formal corporate governance structure; and
(iv) The formalisation of the Risk & Capital Group (' RCG ') as a formal sub-group of the RCC. The RCG was establ ished in 2015 to provide executive support, and filter information flow, to the RCC. Given its importance in the structure, in February 2016 it was determined that the RCG should become a formal sub-group of the RCC.
During the year, Committee Terms of Reference and Board Charters were all reviewed by the relevant Committees and Boards, with minor enhancements being made to reflect ongoing assessment of key responsibilities of the Committees and matters reserved to the Boards.
In accordance with appUcable governance standards, in June and July 2016 the Board undertook a Board Effectiveness Review, facil itated by a bespoke software which allowed tailored questionnaires to be completed anonymously by Board and Committee members in respect of the Boards, each of the Committees and independent Director performance. The results of the questionnaires were followed up by the Chairman of the Board in individual meetings with Directors and at Committee meetings by Committee Chairs. A series of minor recommendations to support continuous improvement of effectiveness arising from the review were discussed and agreed by the Boards.
A Board away day was held in May, providing the opportunity for the Boards to focus on strategy (with presentations from senior management) and to meet more informally. We further supported non-executive Director engagement through informal meetings exclusively for QBE EO non-executive Directors and meetings with non-executive Directors from the QBE Group Board.
The main Company' s Board and Board Committees met regularly during the year with strong attendance from all members. The Board of the Company met 8 times during 2016.
ANNUAL REPORT 6 3 1 DECEMBER 201 6
QBE RE (EUROPE) LIMITED
STRATEGIC REPORT (continued)
The Board of QBE Re (Europe) Limited
The Company's Board charter states that the role of t he Board is to provide leadership; to oversee the design and implementation of the Company's strategy and to set a framework of prudent and effective controls which enable risk to be assessed and managed within it. The Board ensures that the necessary resources are in place for the Company to meet its objectives and reviews the performance of management in del ivering on the Company's strategic aims. The Board should set and instil the Company's val ues and culture in the light of those set by QBE Group and ensure that its obl igations to its shareholder and other stakeholders ofQBE Re (Europe) Limited are understood and met.
The Board is chaired by Tim Ingram and comprises four executive Directors and fou r independent non-executive Directors. During the year, Philip Dodridge resigned as an executive Director of the Company and Nigel Terry was appointed as an executive Director of the Company.
The role of the Chairman of the Board is distinct from that of the Chief Executive Officer, and each role is clearly established. The Board considers that the experience and areas of focus which each Board member brings to QBE Re (Europe) Limited results in a strong and balanced leadership team to set and monitor the strategy and values of QBE EO.
In conjunction with QBE Group and supported by the Remuneration and Nomination Committee, succession planning is undertaken in accordance with the world-class talent objective, which forms part of the strategic priorities of both QBE EO and QBE Group.
QBE Re (Europe) Limited bas four non-executive Dlrectors, including the Chairman of the Company, all of whom are members of the Audit Committee. All the non-executive D irectors are considered to be independent of management and free from any relationship that could materially interfere with the exercise of the independent judgement.
Board Committees
The Boards of QBE European Operations pic and the three key regulated companies in QBE EO, including the Company, have jointly constituted Board Committees. The Committees all comprise appropriately skilled members and are supported by attendees as necessary.
QBE EO' s key Committees comprise: • Audit Committee • Executive Management Board • Investment Committee • Remuneration and Nomination Committee • Risk and Capital Committee
Business continuity management
A business continuity management framework ensures that the Company is resi lient and able to respond effectively to incidents that threaten business continuity, including any material failures in significant outsourcing arrangements. It is designed to ensure that the impact of any major disruption is minimised.
The framework includes a set of emergency management plans, department-level business continuity plans and technology recovery plans. It is supported by a range of activities, including staff awareness and testing.
This Strategic report was approved by the Board of Directors on 5 May 2017 and signed on its behalf by:
D J vJINK.ET T Director
ANNUAL REPORT 7 3 1 DECEMBER 2016
QBE RE (EUROPE) LIMITED
DIRECTORS' REPORT
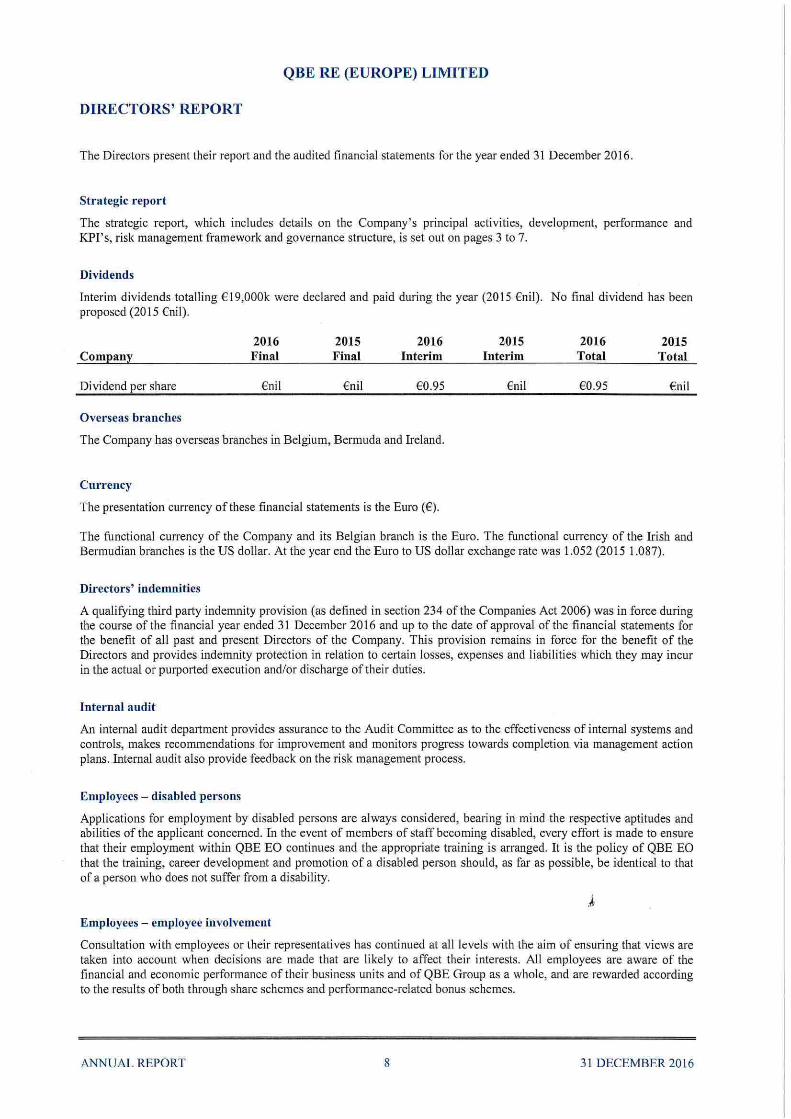
The Directors present their report and the audited financial statements for the year ended 31 December 2016.
Strategic report
The strategic report, which includes detai ls on the Company's principal activities, development, performance and KPI's, risk management framework and governance structure, is set out on pages 3 to 7.
Dividends
lnterim dividends totalling €19,000k were declared and paid during the year (2015 €nil). No final dividend has been proposed (2015 €nil).
Company
Dividend per share
Overseas branches
2016 Final
€ni l
2015 Final
€nil
2016 Interim
€0.95
The Company has overseas branches in Belgium, Bermuda and Ireland.
Currency
The presentation currency of these financial statements is the Euro (€).
2015 Interim
€ni l
2016 Total
€0.95
2015 Total
€ nil
The functional currency of the Company and its Belgian branch is the Euro. The functional currency of the Irish and Bermudian branches is the US dollar. At the year end the Euro to US dollar exchange rate was 1.052 (2015 1.087).
Directors' indemnities
A qualifying third party indemnity provision (as defined in section 234 of the Companies Act 2006) was in force during the course of the financial year ended 31 December 2016 and up to the date of approval of the financial statements for the benefit of all past and present Directors of the Company. This provision remains in force for the benefit of the Directors and provides indemnity protection in relation to certain losses, expenses and liabilities which they may incur in the actual or purported execution and/or discharge of their duties.
Internal audit
An internal audit department provides assurance to the Audit Committee as to the effectiveness of internal systems and controls, makes recommendations for improvement and monitors progress towards completion via management action plans. Internal audit also provide feedback on the risk management process.
Employees- disabled persons
Applications for employment by disabled persons are always considered, bearing in mind the respective aptitudes and abilities of the applicant concerned. In the event of members of staff becoming disabled, every effort is made to ensure that their employment within QBE EO continues and the appropriate training is arranged. It is the policy of QBE EO that the training, career development and promotion of a disabled person should, as far as possible, be identical to that of a person who does not suffer from a disability.
.~
Employees- employee involvement
Consultation with employees or their representatives has continued at all levels with the aim of ensuring that views are taken into account when decisions are made that are likely to affect their interests. All employees are aware of the financial and economic performance of their business units and of QBE Group as a whole, and are rewarded according to the results of both through share schemes and performance-related bonus schemes.
ANNUAL REPORT 8 31 DECEMBER 2016
QBE RE (EUROPE) LIMITED
DIRECTORS' REPORT (continued)
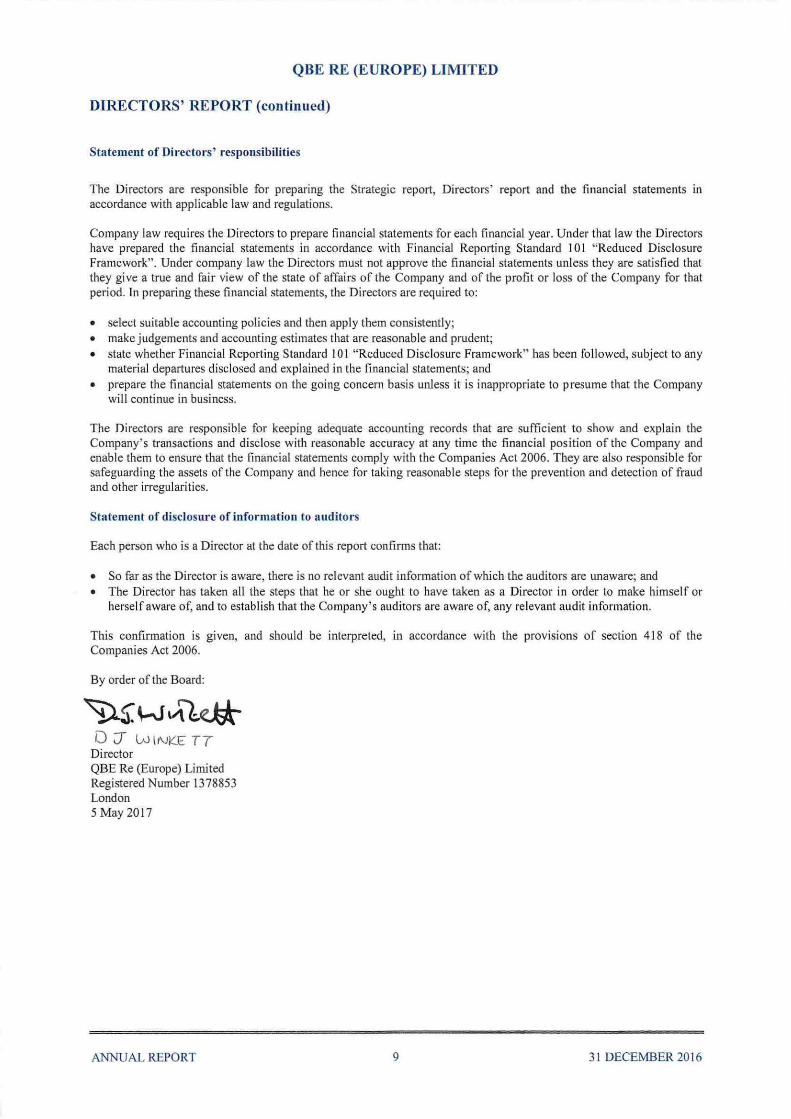
Statement of Directors ' responsibilities
The Directors are responsible for preparing the Strategic report, Directors' report and the financial statements in accordance with applicable law and regulations.
Company law requires the Directors to prepare financial statements for each financial year. Under that law the Directors have prepared the financial statements in accordance with Financial Reporting Standard 10 I "Reduced Disclosure Framework". Under company law the Directors must not approve the financial statements unless they are satisfied that they give a true and fair view of the state of affairs of the Company and of the profit or loss of the Company for that period. In preparing these financial statements, the Directors are required to:
• select suitable accounting policies and then apply them consistently; • make judgements and accounting estimates that are reasonable and prudent; • state whether Financial Reporting Standard I 0 I "Reduced Disclosure Framework" has been followed, subject to any
material departures disclosed and explained in the financial statements; and • prepare the financial statements on the going concern basis unless it is inappropriate to presume that the Company
will continue in business.
The Directors are responsible for keeping adequate accounting records that are sufficient to show and explain the Company's transactions and disclose with reasonable accuracy at any time the financial position of the Company and enable them to ensure that the financial statements comply with the Companies Act 2006. They are also responsible for safeguarding the assets of the Company and hence for taking reasonable steps for the prevention and detection of fraud and other irregularities.
Statement of disclosure of information to auditors
Each person who is a Director at the date of this report confirms that:
• So far as the Director is aware, there is no relevant audit information of which the auditors are unaware; and • The Director has taken all the steps that he or she ought to have taken as a Director in order to make himself or
herself aware of, and to establish that the Company's auditors are aware of, any relevant audit infonnation.
This confirmation is given, and should be interpreted, in accordance with the provisions of section 41 8 of the Companies Act 2006.
By order of the Board:
~~V\'1.~ 0 J Wlr\JK:E TT
Director QBE Re (Europe) Limited Registered Number 1378853 London S May 201 7
ANNUAL REPORT 9 31 DECEMBER 2016

QBE RE (EUROPE) LIMITED
INDEPENDENT AUDITORS' REPORT TO THE MEMBERS OF QBE RE (EUROPE) LIMITED
Report on the fmancial statements
Our opinion
In our opinion, QBE Re (Europe) Limited 's financial statements (the "financial statements"):
• give a true and fair view of the state of the company's affairs as at 3 1 December 2016 and of its profit for the year then ended;
• have been properly prepared in accordance with United Kingdom Generally Accepted Accounting Practice; and
• have been prepared in accordance with the requirements of the Companies Act 2006 .
What we have audited
The financial statements, included within the Annual Report, comprise: • the Balance Sheet as at 31 December 2016;
• the Profit and Loss Account and the Statement of Other Comprehensive Income for the year then ended;
• the Statement of Changes in Equity for the year then ended; and
• the notes to the financial statements, which include a summary of significant accounting policies and other explanatory information.
The financial reporting framework that has been applied in the preparation of the financial statements is United Kingdom Accounting Standards, comprising FRS 101 "Reduced Disclosure Framework", and applicable law (United Kingdom Generally Accepted Accounting Practice).
In applying the financial reporting framework, the directors have made a number of subjective judgements, for example in respect of significant accounting estimates. In making such estimates, they have made assumptions and considered future events.
Opinion on other matter prescribed by the Companies Act 2006
In ouT opinion, based on the work undertaken in the course of the audit: • the information given in the Strategic Report and the Directors' Rep01t for the financia l year for which the
financial statements are prepared is consistent with the financial statements; and
• the Strategic Report and the Directors' Report have been prepared in accordance with applicable legal requirements.
In addition, in light of the knowledge and understanding of the company and its environment obtained in the course of the audit, we are required to report if we have identified any material misstatements in the Strategic Report and the Directors' Report. We have nothing to report in this respect.
Other matters on which we are required to report by exception
Adequacy of accounting records and information and explanations received
Under the Companies Act 2006 we are required to report to you if, in our opinion: • we have not received all the information and explanations we require for our audit; or
• adequate accounting records have not been kept, or returns adequate for our audit have not been received from branches not visited by us; or
• the financial statements are not in agreement with the accounting records and returns.
We have no exceptions to report arising from this responsibility.
ANNUAL REPORT 10 31 DECEMBER 2016

QBE RE (EUROPE) LIMITED
INDEPENDENT AUDITORS' REPORT TO THE MEMBERS OF QBE RE (EUROPE) LIMlTED (continued)
Directors ' remuneration
Under the Companies Act 2006 we are required to report to you if, in our opinion, certain disclosures of directors' remuneration specified by law are not made. We have no exceptions to report arising from this responsibility.
Responsibilities for the financial statements and the audit
Our responsibilities and those of the directors
As explained more fully in the Statement of directors' responsibil ities set out on page 9, the directors are responsible for the preparation of the financial statements and for being satisfied that they give a true and fair view.
Our responsibility is to audit and express an opinion on the financial statements in accordance with applicable law and International Standards on Auditing (UK and Ireland) ("ISAs (VK & [reland)"). Those standards require us to comply with the Auditing Practices Board 's Ethical Standards for Auditors.
This report, including the opinions, has been prepared for and only for the company's members as a body in accordance with Chapter 3 of Part 16 of the Companies Act 2006 and for no other purpose. We do not, in giving these opinions, accept or assume responsibility for any other purpose or to any other person to whom this report is shown or into whose hands it may come save where expressly agreed by our prior consent in writing.
What an audit of financial statements involves
We conducted our audit in accordance with ISAs (UK & Ireland). An audit involves obtaining evidence about the amounts and disclosures in the financial statements sufficient to give reasonable assurance that the financial statements are free from material misstatement, whether caused by fraud or error. This includes an assessment of:
• whether the accounting policies are appropriate to the company' s circumstances and have been consistently applied and adequately disclosed;
• the reasonableness of significant accounting estimates made by the directors; and
• the overall presentation of the financial statements.
We primari ly focus our work in these areas by assessi ng the directors' judgements against avai lable evidence, forming our own judgements, and evaluating the disclosures in the financia l statements.
We test and examine information, using sampling and other auditing techniques, to the extent we consider necessary to provide a reasonable basis for us to draw conclusions. We obtain audit evidence through testing the effectiveness of controls, substantive procedures or a combination of both.
In addition, we read all the financial and non-financial information in the Annual Report to identify matelial inconsistencies with the audited financial statements and to identify any information that is apparently materially incorrect based on, or matelially inconsistent with, the knowledge acquired by us in the course of perf01ming the audit. If we become aware of any apparent material misstatements or inconsistencies we consider the implications for our report. With respect to the Strategic Report and Directors' Report, we consider whether those reports include the disclosures required by applicable legal requirements.
Andrew Moore (Senior Statutory Auditor) for and on behalf ofPricewaterhouseCoopers LLP Chartered Accountants and Statutory Auditors London 5 May 2017
ANNUAL REPORT II 3 1 DECEMBER 20 16

QBE RE (EUROPE) LIMITED
PROFIT AND LOSS ACCOUNT -TECHNICAL ACCOUNT- GENERAL BUSINESS for the year ended 31 December 2016
2016 2015 Note €'000 €'000 €'000 €'000
Continuing operations
Earned premiums, net of reinsurance Gross premiums written 4 376,936 328,853 Outward reinsurance 2remiums (46,892) (52,138)
Net premiums written 330,044 276,715
Change in the gross provision for unearned premiums (33,949) (4,469) Change in the provision for unearned premi ums, reinsurers' share (5,114) 7,790
Change in the net 2rovision for unearned 2remiums (39,063) 3,321
Earned Eremiums, net of reinsurance 290,981 280,036
Claims incurred, net of reinsurance Claims paid
Gross amount (167,630) (158,896) Reinsurers ' share 24,402 21,660
Net claims Eaid (143,228) (137,236)
Change in the provision for claims Gross amount (45,858) 38,264 Reinsurers' share (11 ,536) (3,703)
Change in the net J:!rovision for claims {57,3942 34,561
Claims incurred, net of reinsurance (200,622) (102,675)
Net operating expenses 5 (90,258) (82,072)
Change in the equalisation J:!rovision 6 48,688 (11,025)
Balance on the technical account for general business 48,789 84,264
The notes set out on pages 19 to 45 form an integral part of these financial statements
ANNUAL REPORT 12 3 L DECEMBER 2016

QBE RE (EUROPE) LIMITED
PROFIT AND LOSS ACCOUNT-TECHNICAL ACCOUNT- LONG-TERM BUSINESS for the year ended 31 December 2016
2016 2015 Note €'000 €'000 €'000 €'000
Continuing operations
Earned premiums, net of reinsurance Gross premiums written 4 36,353 22,959 Outward reinsurance Eremiums (2,528) (1,8122
Net Eremiums written 33,825 21,147
Investment income 385 1,238
34,2 10 22,385
Cla ims incurred, net of reinsurance Claims paid
Gross amount (18,580) (15,889) Reinsurers' share 136 54
Net claims ~aid {18,444} {15,835}
Change in provision for claims, net of reinsurance Long-term business provision, net of reinsurance
Gross amount (7,779) 2,990 Reinsurers' share 1,609 (168)
Change in the net Erovision for claims (6, 170) 2,822
(24,614} (13,0132
Net operating expenses 5 (7,632) (5,451) Investment expenses and charges (771) (439) Unrealised losses on investments 585 (2882
Balance on tbe teclmical account for long-term business 1,778 3,194
The notes set out on pages 19 to 45 form an integral part of these financial statements
ANNUAL REPORT 13 3 1 DECEMBER 2016

QBE RE (EUROPE) LIMITED
PROFIT AND LOSS ACCOUNT NON-TECHNICAL ACCOUNT for the year ended 31 December 2016
Balance on the general business technical account
Balance on the long-term business technical account
Note
Investment income 8(a) Unrealised gains I (losses) on investments Investment expe11ses and charges 8(b) Allocated investment retum transferred to the long-term business technical account
Profit on ordinary activities before tax 9
Tax on profit on ordinary activities 10
Profit for the frnancial year
The results above are derived from continuing operations.
Restated 2016 2015
€'000 €'000
48,789 84,264
1,778 3,194
29,665 22,856 9,670 (5,657)
(12,369) (5,438)
(199) (511)
77,334 98,708
118 (21,411)
77,452 77,297
Neither gains nor losses arising on the holding or disposal of investments; nor the effect of fair value accounting for financial instruments are required to be included in a note of historical profit and losses. There are no other differences between the profit on ordinary activities after tax or the profit for the financial year stated above and their historical cost equivalents.
The notes set out on pages 19 to 45 form an integral part of these financial statements
ANNUAL REPORT 14 31 DECEMBER 2016
QBE RE (EUROPE) LIMITED
STATEMENTOFOTHER COMPREHENS~INCOME
for the year ended 31 December 2016
2016 2015 Note €'000 €'000
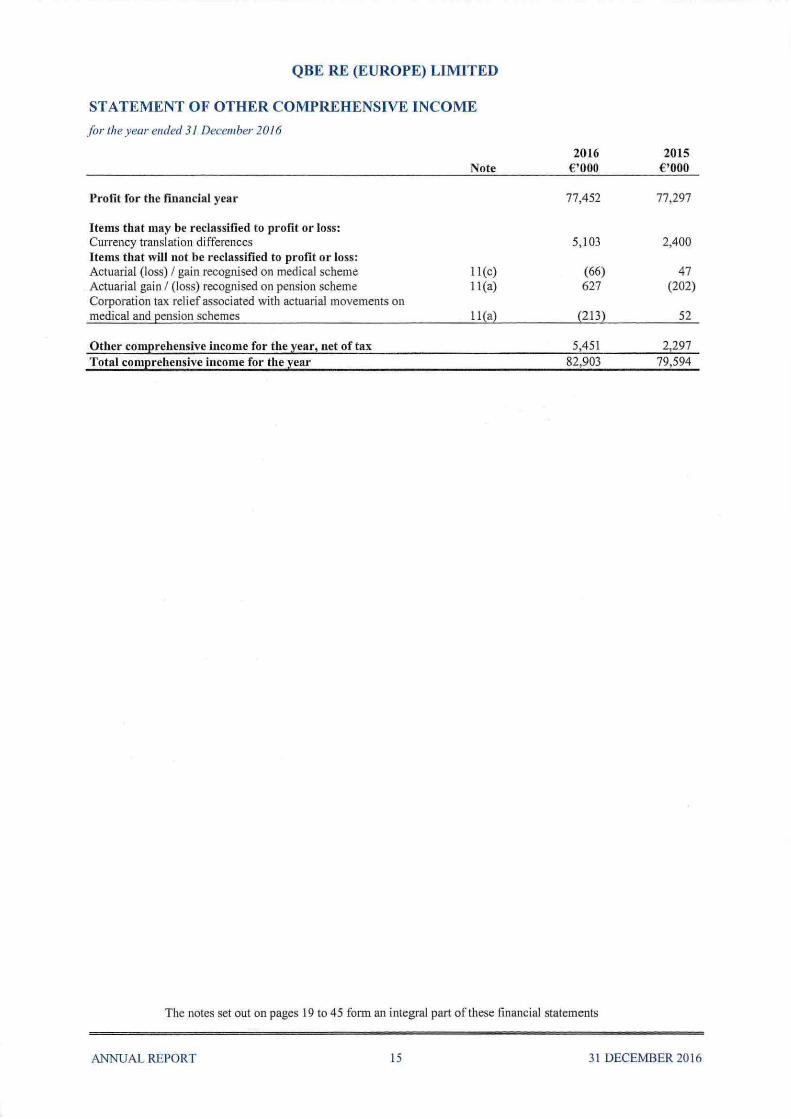
Profit for the financial year 77,452 77,297
Items that may be reclassified to profit or loss: Currency translation differences 5,103 2,400 Hems that will not be reclassified to profit or loss: Actuarial (loss) I gain recognised on medical scheme ll (c) (66) 47 Actuarial gain I (loss) recognised on pension scheme 1 1 (a) 627 (202) Corporation tax relief associated with actuarial movements on medical and pension schemes 11{a) (213) 52
Other com~rehensive income for the ~ear2 net of tax 5,451 2,297 Total comErehensive income for the ~ear 82,903 79,594
The notes set out on pages 19 to 45 form an integral part of these financial statements
ANNUAL REPORT 15 31 DECEMBER2016
QBE RE (EUROPE) LIMITED
STATEMENT OF CHANGES IN EQUITY for the year ended 31 December 2016
Called up Share Profit Total share premium and loss Other shareholders'
2016 capital account account reserves funds €'000 €'000 €'000 €'000 €'000
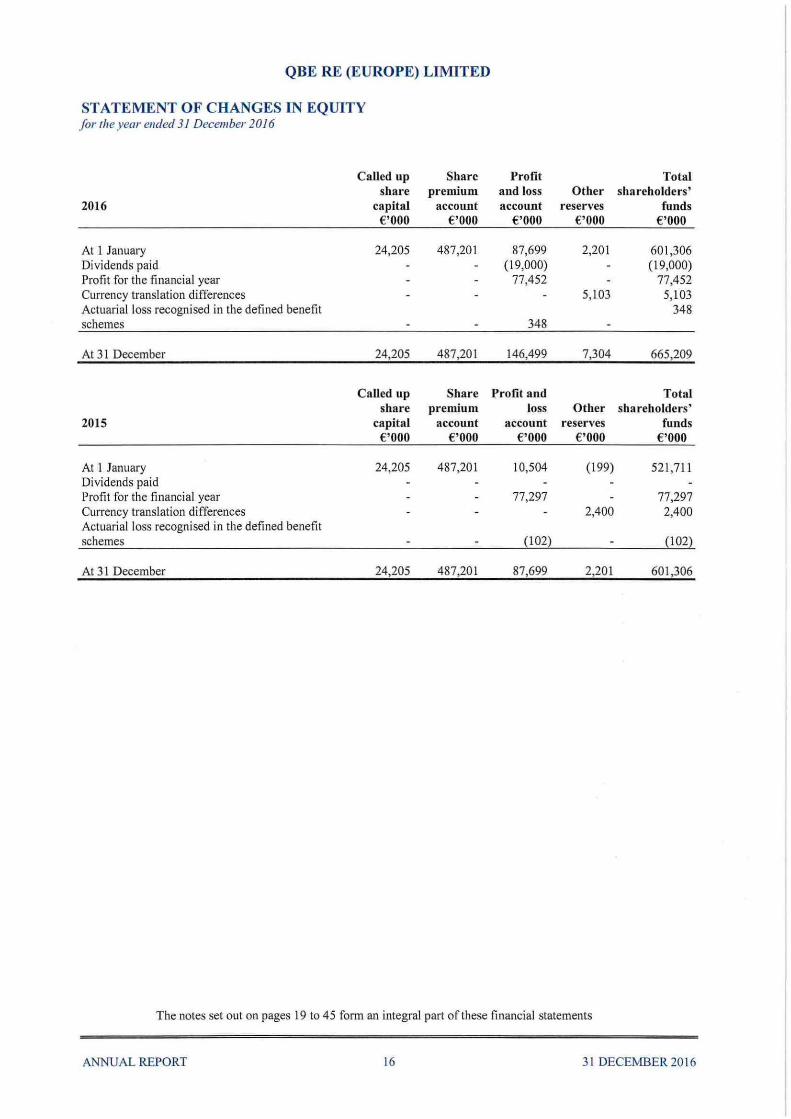
At 1 January 24,205 487,201 87,699 2,201 601,306 Dividends paid (19,000) {19,000) Profit for the financial year 77,452 77,452 Currency translation differences 5,103 5,103 Actuarial loss recognised in the defined benefit 348 schemes 348
At 31 December 24,205 487,201 146,499 7,304 665,209
Called up Share Profit and Total share premium loss Other shareholders'
2015 capital account account reserves funds €'000 €'000 €'000 €'000 €'000
At 1 January 24,205 487,201 10,504 (199) 521,711 Dividends paid Profit for the financial year 77,297 77,297 Currency translation differences 2,400 2,400 Actuarial .l oss recognised in the defined benefit schemes (102) {102)
At 31 December 24,205 487,201 87,699 2,201 601,306
The notes set out on pages 19 to 45 form an integral part of these financial statements
ANNUAL REPORT 16 3 1 DECEMBER 20 16

QBE RE (EUROPE) LlMITED
BALANCE SHEET As at 31 December 2016
Assets
Investments Other financial investments Deposits with ceding undertakings Deri vative financial instruments
Reinsurers' share of technical provisions Provision for unearned premiums Long-term business provision Claims outstandin~
Debtors Debtors arising out of reinsurance operations Deferred tax Other debtors
Other assets Tangible assets Cash at bank and in hand
Prepayments and accrued income Accrued interest Deferred acquisition costs
Total assets
Note
13
14
15 15 15
20 21 22
23
Restated 2016 2015
€ '000 € '000
1,567,965 1,549,871 135,863 136,398
1,900 1,770
1,705,728 1,688,039
2,355 8,186 2,091 597
108,246 121,963
112,692 130,746
240,424 187,456 7,484 2,902
30,170 4,666
278,078 195,024
291 368 27,686 9,804
27,977 10,172
3,743 4,570 9,858 11 ,673
13,601 16,243
2 ,138,076 2,040,224
The notes set out on pages 19 to 45 form an integral part of these financial statements
ANNUAL REPORT 17 3 1 DECEMBER 20 16
QBE RE (EUROPE) LIMITED
BALANCE SHEET As at 31 December 2016
Liabilities
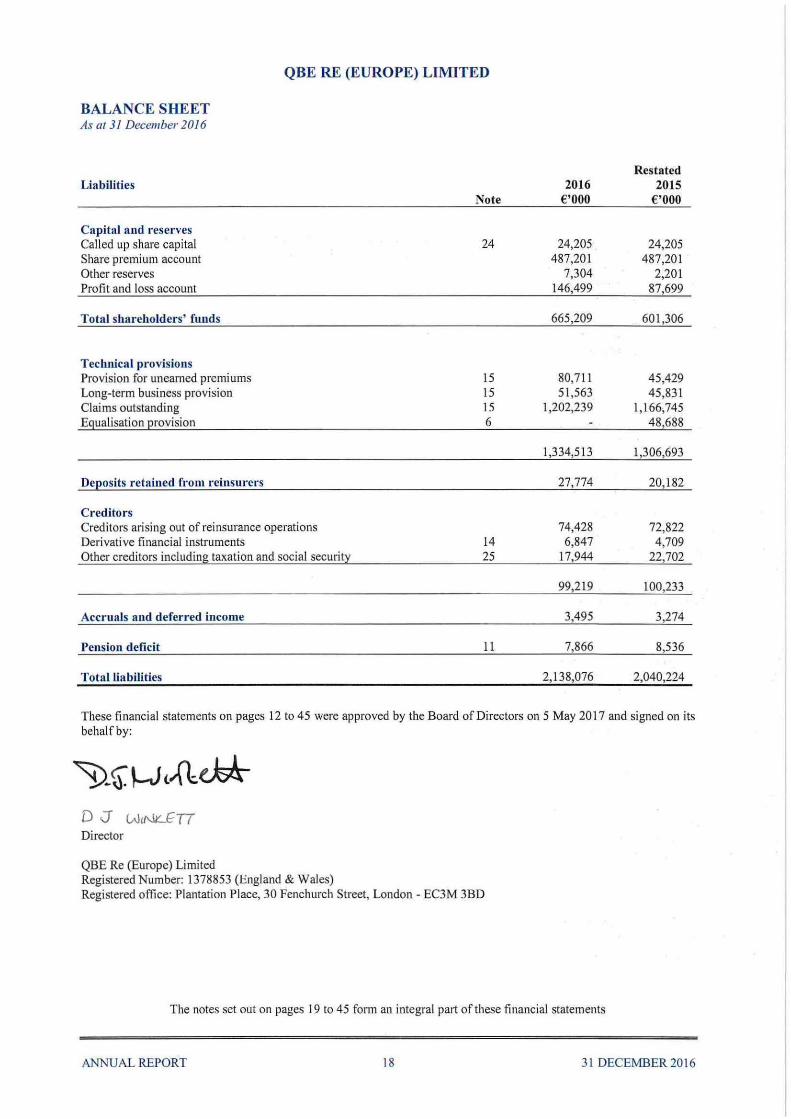
Capital and reserves Called up share capital Share premium account Other reserves Profit and loss account
Total shareholders' funds
Teclmical provisions Provision for unearned premiums Long-term business provision Claims outstanding Equalisation provision
Deposits retained from 1·einsurers
Creditors Creditors arising out of reinsurance operations Derivative financial instruments Other creditors including taxation and social security
Accruals and deferred income
Pension deficit
Total liabilities
Note
24
15 15 15 6
14 25
11
Restated 2016 2015
€'000 €'000
24,205 24,205 487,201 487,201
7,304 2,201 146,499 87,699
665,209 601,306
80,711 45,429 51 ,563 45,831
1,202,239 1,166,745 48,688
1,334,513 1,306,693
27,774 20,182
74,428 72,822 6,847 4,709
17,944 22,702
99,219 100,233
3,495 3,274
7,866 8,536
2,138,076 2,040,224
These financial statements on pages 12 to 45 were approved by the Board of Directors on 5 May 201 7 and signed on its behalf by:
D J tAJtNLET7 Director
QBE Re (Europe) Limited Registered Number: 1378853 (England & Wales) Registered office: Plantation Place, 30 Fenchurch Street, London - EC3M 3BD
The notes set out on pages 19 to 45 form an integral part of these financial statements
ANNUAL REPORT 18 31 DECEMBER 2016

QBE RE (EUROPE) LIMITED
NOTES TO THE FINANCIAL STATEMENTS fort he year ended 31 December 2016
1. Accounting policies
The principal accounting policies adopted in the preparation of these financial statements are set out below. These policies have been consistently applied to all the years presented unless otherwise stated.
(a) Basis of pr eparation
These financial statements are prepared in accordance with Financial Reporting Standard 10 I "Reduced Disclosure Framework" . The Company meets the definition of a qualifying entity under FRS 100 (Financial Reporting Standard 100) issued by the Financial Reporting Council.
These financial statements are prepared on the goiJlg concern basis and in accordance with the provisions of The Large and Medium-Sized Companies and Groups (Accow1ts and Repo1ts) Regulations 2008 (SI 2008/410) relating to insurance companies, and applicable accounting standards in the United Kingdom.
These financial statements are separate financial statements. In accordance with Section 401 of the Companies Act 2006, the Company is exempt from preparing group financial statements. QBE Insurance Group Limi ted, incorporated in Australia, prepares consolidated financial statements for the year ended 31 December 2016, in which the Company is included. The consolidated financial statements for QBE Insurance Group Limited, the ultimate parent company, are publicly avai lable.
Having assessed the proportion of the long-term business relative to the overall premium written by the Company and the provisions in SI 2008/410, the financial results and position arising from long-term business have been disclosed separately to the general business.
Following implementation of Solvency II reporting on I January 2016, the Company bas released the equal isation provision previously recorded on the balance sheet.
(b) Disclosure exemptions
The Company's financial results are included in the consolidated financial statements of QBE Insurance Group Limited. As permitted by FRS 101, the Company has taken advantage of the disclosure exemptions avai lable under that standard in relation to:
lAS 7:
lAS 8:
lAS 24:
lAS 24:
Presentation of a cash flow statement
Disclosures in respect of new standards and interpretations that have been issued but which are not yet effective
Disclosure of key management personnel compensation
Related party transactions entered into with other wholly owned entities included in the QBE Insurance Group Limited group financial statements.
Equivalent disclosures have been given in the group financial statements of QBE Insurance Group Limited. The group financial statements of QBE Insurance Group Limited are available to the public and can be obtained as set out in note 32.
ANNUAL REPORT 19 3 1 DECEMBER 2016
QBE RE (EUROPE) LIMITED
NOTES TO THE FINANCIAL STATEMENTS (continued) for the year ended 31 December 2016
1. Accounting policies (continued)
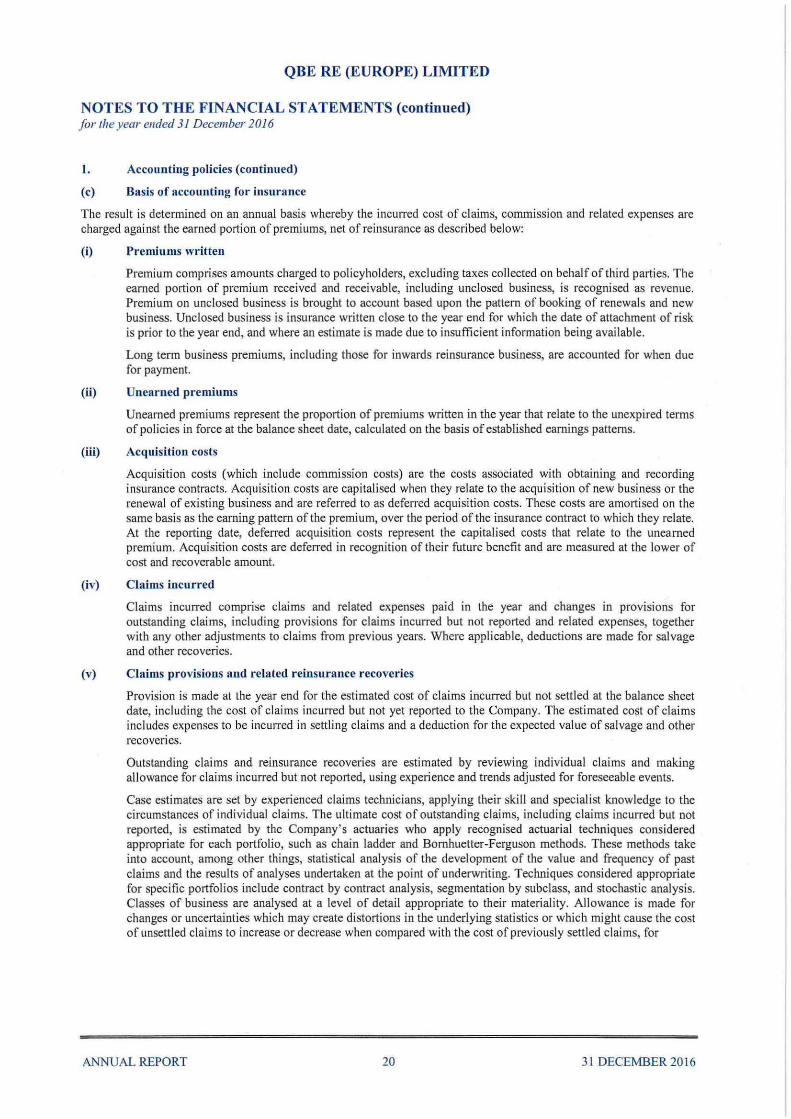
(c) Basis of accounting for insurance
The result is determined on an annual basis whereby the incurred cost of claims, commission and related expenses are charged against the earned portion of premiums, net of reinsurance as described below:
(i) Premiums written
Premium comprises amounts charged to policyholders, excluding taxes collected on behalf of third parties. The earned portion of premium received and receivable, including unclosed business, is recognised as revenue. Premium on unclosed business is brought to account based upon the pattern of booking of renewals and new business. Unclosed business is insurance written close to the year end for which the date of attachment of risk is prior to the year end, and where an estimate is made due to insufficient information being available.
Long term business premiums, including those for inwards reinsurance business, are accounted for when due for payment.
(ii) Unearned premiums
Unearned premiums represent the proportion of premiums written in the year that relate to the unexpired terms of policies in force at the balance sheet date, calculated on the basis of established earnings patterns.
(iii) Acquisition costs
Acquisition costs (which include commission costs) are the costs associated with obtaining and recording insurance contracts. Acquisition costs are capitalised when they relate to the acquisition of new business or the renewal of existing business and are referred to as defen·ed acquisition costs. These costs are amottised on the same basis as the earning pattern of the premium, over the period of the insurance contract to which they relate. At the reporting date, deferred acquisition costs represent the capitalised costs that relate to the unearned premium. Acquisition costs are deferred in recognition of their future benefit and are measured at the lower of cost and recoverable amount.
(iv) Claims incurred
Claims incurred comprise claims and related expenses paid in the year and changes in provtstons for outstanding claims, including provisions for claims incurred but not reported and related expenses, together with any other adjustments to claims from previous years. Where applicable, deductions are made for salvage and other recoveries.
(v) Claims provisions and related reinsurance recoveries
Provision is made at the year end for the estimated cost of claims incurred but not settled at the balance sheet date, including the cost of claims incurred but not yet reported to the Company. The estimated cost of claims includes expenses to be incurred in settling claims and a deduction for the expected value of salvage and other recoveries.
Outstanding claims and reinsurance recoveries are estimated by reviewing individual claims and making allowance for claims incurred but not reported, using experience and trends adjusted for foreseeab le events.
Case estimates are set by experienced claims technicians, applying their skill and specialist knowledge to the circumstances of individual claims. The ultimate cost of outstanding claims, including claims incurred but not reported, is estimated by the Company's actuaries who apply recognised actuarial techniques considered appropriate for each portfolio, such as chain ladder and Bornhuetter-Ferguson methods. These methods take into account, among other things, statistical analysis of the development of the value and frequency of past claims and the results of analyses undertaken at the point of underwriting. Techniques considered appropriate for specific portfolios include contract by contract analysis, segmentation by subclass, and stochastic analysis. Classes of business are analysed at a level of detail appropriate to their materiality. Allowance is made for changes or uncertainties which may create distortions in the underlying statistics or which might cause the cost of unsettled claims to increase or decrease when compared with the cost of previously settled claims, for
ANNUAL REPORT 20 31 DECEMBER 2016
QBE RE (EUROPE) LlMITED
NOTES TO THE FINANCIAL STATEMENTS (continued) for the year ended 31 December 2016
1. Accounting policies (continued)
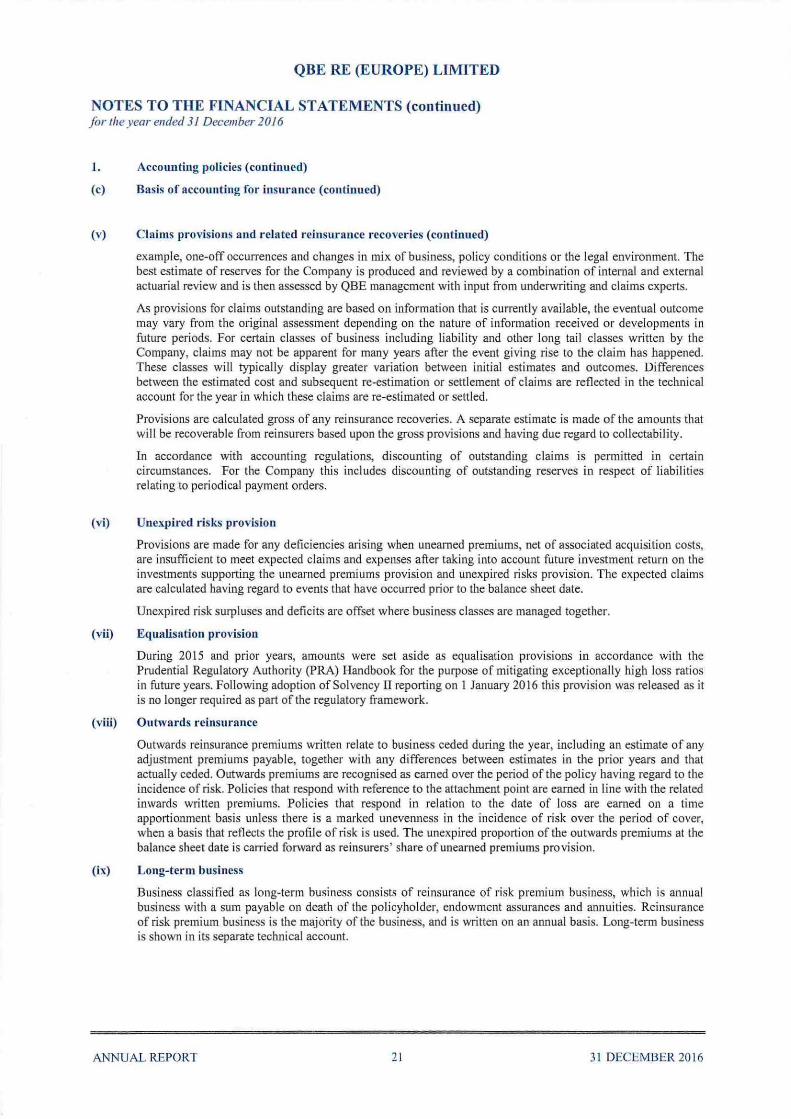
(c) Basis of accounting for insurance (continued)
(v) Claims provisions and related reinsurance recoveries (continued)
example, one-off occurrences and changes in mix of business, policy conditions or the legal environment. The best estimate of reserves for the Company is produced and reviewed by a combination of internal and external actuarial review and is then assessed by QBE management with input from underwriting and claims experts.
As provisions for claims outstanding are based on information that is currently available, the eventual outcome may vary from the original assessment depending on the nature of information received or developments in future periods. For certain cl<e;ses of business including liability and other long tail classes written by the Company, claims may not be apparent for many years after the event giving rise to the claim has happened. These classes will typically display greater variation between initial estimates and outcomes. Differences between the estimated cost and subsequent re-estimation or settlement of claims are reflected in the technical account for the year in which these claims are re-estimated or settled.
Provisions are calculated gross of any reinsurance recoveries. A separate estimate is made of the amounts that will be recoverable from reinsurers based upon the gross provisions and having due regard to collectability.
In accordance with accounting regulations, discounting of outstanding c laims is permitted in certain circumstances. For the Company this includes discounting of outstanding reserves in respect of liabilities relating to periodical payment orders.
(vi) Unexpired risks provision
Provisions are made for any deficiencies arising when unearned premiums, net of associated acquisition costs, are insufficient to meet expected claims and expenses after taking into account future investment return on the investments supporting the unearned premiums provision and unexpired risks provision. The expected claims are calculated having regard to events that have occurred prior to the balance sheet date.
Unexpired risk surpluses and deficits are offset where business classes are managed together.
(vii) Equalisation provision
During 2015 and prior years, amounts were set aside as equalisation prov1s1ons in accordance with the Prudential Regulatory Authority (PRA) Handbook for the purpose of mitigating exceptionally high loss ratios in future years. Following adoption of Solvency ll reporting on I January 2016 this provision was released as it is no longer required as part of the regulatory framework.
(viii) Outwards reinsurance
Outwards reinsurance premiums written relate to business ceded during the year, including an estimate of any adjustment premiums payable, together with any differences between estimates in the prior years and that actually ceded. Outwards premiums are recognised as earned over the period of the policy having regard to the incidence of risk. Policies that respond with reference to the attachment point are earned in line with the related inwards written premiums. Policies that respond in relation to the date of loss are earned on a time apportionment basis unless there is a marked unevenness in the incidence of risk over the period of cover, when a basis that reflects the proftle of risk is used. The unexpired proportion of the outwards premiums at the balance sheet date is carried forward as reinsurers' share of unearned premiums provision.
(h:) Long-term business
Business classified as long-term business consists of reinsurance of risk premium business, which is annual business with a sum payable on death of the policyholder, endowment assurances and annuities. Reinsurance of risk premium business is the majority of the business, and is written on an annual basis. Long-term business is shown in its separate technical account.
ANNUAL REPORT 21 31 DECEMBER 20 16

QBE RE (EUROPE) LIMITED
NOTES TO THE FINANCIAL STATEMENTS (continued) for the year ended 31 December 2016
J. Accounting policies (continued)
(d) Expenses
Acquisition costs, general overheads and other expenses are charged as incurred to the profit and loss technical account, net of the change in deferred acquisition costs. Investment expenses are charged to the profit and loss non-technical account.
The management and administration of the Company is carried out by QBE Management Services (UK) Limited and QBE Management (Ireland) Limited, fellow group undertakings, which also provide these services to other QBE EO companies. Administrative expenses, where recharged by QBE Management Services (UK) Limited and QBE Management (ire land) Limited to the Company, and those incuiTed directly by the Company's branches are taken into account on an accruals basis. These expenses include the costs of staff, who in the UK are employed by QBE Management Services (UK) Limited and in Ireland by QBE Management (Ireland) Limited.
QBE Management Services (UK) Limited and QBE Management (Ireland) Limited operate both defmed benefit and defined contribution pension schemes, the expense of which is included in the recharges.
The Company operates a defined contribution pension scheme for certain employees in Belgium. The pension entitlement of employees is secured through contributions by the Company to a separately administered pension fund. Payments are charged as expense as they faU due.
The Company a lso operates a defined benefit pension scheme. The costs of the defined benefit pension scheme are determined using the projected unit credit method. Actuarial gains and losses are recognised in the Statement of Total Recognised Gains and Losses in the year they arise. The retirement benefit obligation recognised in the balance sheet represents the present value of the defined benefit obligation reduced by the fair value of scheme's assets.
A surplus is only recognised if it is either recoverable from reductions in future contributions, or if agreement is in place to recover it from the scheme.
(e) Tangib le assets
Tangible assets are stated at cost less depreciation. Cost includes the original purchase price of the asset and the costs attributable to bringing the asset to its working condition for its intended use. Depreciation is provided at rates calculated to write off the cost less estimated residual values in equal amounts over the estimated useful lives of the tangible assets. The estimated lives are as follows:
Office equipment Computer equipment
from three to five years from three to five years
A review for impairment of a tangible asset is canied out if events or changes in circumstances indicate that the carrying amount of the tangible asset may not be recoverable. The recoverable amount is the higher of its fair value less costs to sell and its value in use. If the carrying value exceeds the recoverable amount the carrying value is reduced by writing the difference to the profit and loss account in that period.
ANNUAL REPORT 22 31 DECEMBER 2016

QBE RE (EUROPE) LIMITED
NOTES TO THE FINANCIAL STATEMENTS (continued) for the year ended 31 December 2016
1. Accounting policies (continued)
(t) Taxation
The charge for taxation is based on the result for the year adjusted for disallowable items. Deferred taxation is measured on an undiscounted basis at the tax rates that are expected to apply in the periods in which timing differences reverse, based on tax rates and laws enacted or substantively enacted at the balance sheet rate. Deferred tax assets are recognised for deductible temporary differences and unused tax losses only if it is probable that future taxable amounts will be available to utilise those temporary differences and losses.
Current and deferred tax is recognised in profit or loss, except to the extent that it relates to items recognised in other comprehensive income or directly in equity. In th.i s case, the tax is also recognised in other comprehensive income or directly in equity, as appropriate.
(g) Investments
Investments are designated as fair value through profit and loss on initial recognition. They are initially recorded at fa ir value, being the cost of acquisition excluding transaction costs, and are subsequently measured at fair value at each reporting date. Financial assets are managed on a fair value basis in accordance with the Company's documented investment strategy.
Listed investments are stated at fair value based on current bid prices quoted by the relevant exchanges. Unlisted investments are carried at Directors ' estimate of current fair value.
Other investments are stated at prices quoted by various recognised sources.
Derivatives are initially recognised at fair value on the date on which a derivative contract is entered into and are subsequently stated at fair value determined using generally accepted valuation techniques, including the use of forward exchange rates for the valuation offorward foreign exchange contracts.
Financial assets are derecognised whe n the right to receive future cash flows from the assets has expired, or has been transferred, and the Company has transferred substantively aU the risks and rewards of ownership.
(h) Investment income
Interest income is recognised on an accruals basis. Dividends are recognised when the right to receive payment is established. Investment income includes realised and unrealised gains or losses on financial assets that are reported on a combined basis as fair value gains or losses on financial assets.
A transfer is made from the non-technical account to the technical account of the return on investments supporting the long term insurance technical provisions.
(i) Financial liabilities
Creditors are initially recognised at fair value, net of directly attributable transaction costs, and are subsequently stated at amortised cost through the profit and loss account using the e ffective interest method, with the exception of derivatives. They are in.itially recognised at fair value on t11e date on wh.ich a derivative contract is entered into and are subsequently stated at fair value determined using generally accepted valuation techniques, including the use of forward exchange rates for the valuation offorward foreign exchange contracts.
(j) Operating leases
Leases in which a significant portion of the risks and rewards of ownership are retained by ilie lessor are classified as operating leases. Payments made under operating leases (net of any incentives received from the lessor) are charged to profit or loss on a straight line basis over the period of the lease.
ANNUAL REPORT 23 3 I DECEI\1BER 20 I 6

QBE RE (EUROPE) LIMJTED
NOTES TO THE FINANCIAL STATKMENTS (continued) for the year ended 31 December 2016
1. AccoWiting policies (continued)
(k) Foreign currency
The functional currency of the Company and its Belgian branch is the Euro (€). The funct ional currency of the Irish and Bermudian branches is the US dollar. The Company presents its financial statements in thousands ofEuros.
Foreign currency transactions are translated into functional currencies at the rates of exchange on the dates of the transactions. At the balance sheet date, monetary assets and liabilities denominated in foreign currencies are translated at the rates of exchange prevail ing at that date.
Exchange gains or losses are initially recognised in the profit and loss non-technical account as part of investment income, including gains and losses on foreign exchange derivatives.
The results and financial positions of the Irish and Bermudian branches are translated into the presentation currency as follows:
• Assets and liabi lities are translated at the closing rate at the balance sheet date; and
• Income and expenses are translated at the average rate of exchange during the year.
All resulting exchange gains or losses are recognised through the Statement Of Changes in Equity as a separate component of equity.
2. Critical accounting estimates and judgments
The Company makes estimates and judgments in respect of the reported amounts of certain assets and liabi lities. These estimates and judgments are determined by qualified and experienced employees with reference to historical data and reasoned expectations of future events, and are continually updated. Actual results may differ from these estimates.
The following are the critical judgements that the Company have made in the process of applying the accounting policies and that have the most significant effect on the amounts recognised in the financial statements.
Outstanding claims provisions
The Company's net outstanding claims provision comprises:
• the gross estimate of expected future claims payments;
• amounts recoverable from reinsurers based on the gross estimate;
Gross estimate
The provision for expected future payments includes claims reported but not yet paid; claims incurred but not reported (IBNR); claims incuned but not enough reported (IBNER); and estimated claims handl ing costs, being the direct and indirect expenses incurred in the settlement of claims.
The estimation ofiBNR is generally subject to a greater degree of uncertainty than the estimation of the cost of settling claims already notified to the Company, where more information about the claims is generally available. Liability and other long tail classes of business, where claims settlement may not happen for many years after the event giving rise to the claim, typically display greater variability between initial estimates and final settlement due to delays in rep011ing claims, uncertainty in respect of court awards and future claims inflation. Claims in respect of property and other short tail classes are typically reported and settled sooner after the claim event, giving rise to more certainty. The estimation techniques and assumptions used in determining the gross estimate are described below.
The Company' s process for establishing the gross estimate invo lves extensive consultation with internal and external actuaries, claim managers, underwriters and other senior management. This process includes regular in-bouse claims review meetings attended by senior divisional and management and detailed review by external actuaries at least annually. The determination of the amounts that the Company will ultimately pay for claims arising under reinsurance contracts involves a number of critical assumptions. Some of the uncertainties impacting these assumptions are as follows:
ANNUAL REPORT 24 31 DECEMBER 2016
QBE RE (EUROPE) LIMITED
NOTES TO THE FINANCIAL STATEMENTS (continued) f or the year ended 31 December 20 16
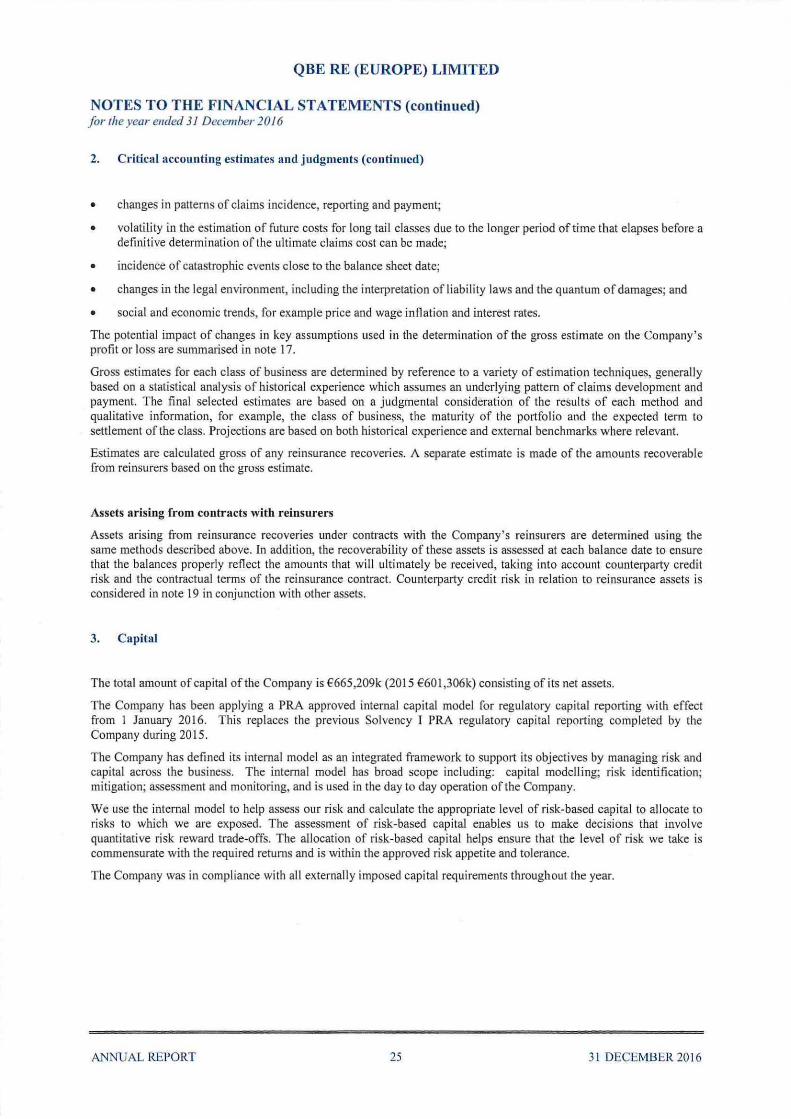
2. Critical accounting estimates and judgments (continued)
• changes in patterns of claims incidence, reporting and payment;
• volatili ty in the estimation of future costs for long tail classes due to the longer period of time that elapses before a definitive determination of the ultimate claims cost can be made;
• incidence of catastrophic events close to the balance sheet date;
• changes in the legal environment, including the interpretation of liability laws and the quantum of damages; and
• social and economic trends, for example price and wage inflation and interest rates.
The potential impact of changes in key assumptions used in the determination of the gross estimate on the Company's profit or loss are summarised in note 17.
Gross estimates for each class of business are determined by reference to a variety of estimation techniques, generally based on a statistical analysis of historical experience which assumes an underlying pattern of claims development and payment. The final selected estimates are based on a judgmental consideration of the results of each method and qualitative information, for example, the class of business, the maturity of the p01tfolio and the expected term to settlement of the class. Projections are based on both historical experience and external benchmarks where relevant.
Estimates are calculated gross of any reinsurance recoveries. A separate estimate is made of the amounts recoverable from reinsurers based on the gross estimate.
Assets arising from contracts with reinsurers
Assets arising from reinsurance recoveries under contracts with the Company's reinsurers are determined using the same methods described above. In addition, the recoverability of these assets is assessed at each balance date to ensure that the balances properly reflect the amounts that will ultimately be received, taking into account counterparty credit risk and the contractual terms of the reinsurance contract. Counterparty credit risk in relation to reinsurance assets is considered in note 19 in conjunction with other assets.
3. Capital
The total amount of capital of the Company is €665,209k (2015 €601 ,306k) consisting of its net assets.
The Company has been applying a PRA approved internal capital model for regulatory capital reporting with effect from 1 January 2016. T his replaces the previous Solvency I PRA regulatory capital reporting completed by the Company during 2015.
The Company has defined its internal model as an integrated framework to support its objectives by managing risk and capital across the business. The internal model has broad scope including: capital modell ing; risk identification; mitigation; assessment and monitoring, and is used in the day to day operation of the Company.
We use the internal model to help assess our risk and calculate the appropriate level of risk-based capital to all ocate to risks to which we are exposed. The assessment of risk-based capital enables us to make decisions that involve quantitative risk reward trade-offs. The allocation of risk-based capital helps ensure that the level of risk we take is commensurate with the required returns and is within the approved risk appetite and tolerance.
The Company was in compliance with all externally imposed capital requirements throughout the year.
ANNUAL REPORT 25 31 DECEMBER 2016

QBE RE (EUROPE) LIMITED
NOTES TO THE FINANCIAL STATEMENTS (continued) fort he year ended 3/ December 2016
4. Segmental analysis
The Company operates in one segment, reinsurance acceptances, only.
Analysis by geographic area Gross premiums written Profit before tax
United Kingdom I reland Belgium Bermuda
Gross premium by destination
United Kingdom Other EU member states The Americas and Caribbean Asia Other
5. Net operating expenses
Acquisition costs Change in deferred acquisition costs Admini strative exEenses
Gross operating expenses
2016 €'000
130,714 270,715
11 ,860
41 3,289
Reinsurance commissions and Erofit EarticiEation
Net o2eratin~ ex2enses
ANNUAL REPORT
2015 2016 2015 €'000 €'000 €'000
135,328 70,290 56,922 208,463 1,614 39,693
8,021 5,430 2,094
35 1,8 12 77,334 98,709
26
Net assets 2016 2015
€'000 €'000
207,670 226,683 100,739 29,677 349,061 342,832
7,739 2,114
665,209 601,306
Gross premiums written 2016 2015
€'000 €'000
16,586 15,990 225,314 201,306 107,481 71 ,708 38,340 42,645 25,568 20,163
413,289 351 ,812
2016 2015 €'000 €'000
83,036 71 ,336 2,078 200
14,720 17,953
99,834 89,489
{1 ,9442 (1,966)
97,890 87,523
31 DECEMBER 2016

QBE RE (EUROPE) LIMITED
NOTES TO THE FINANCIAL STATEMENTS (continued) f or the year ended 31 December 2016
6. Equalisation provision
At 1 January Transfer during the year Released during the year
At 31 December
2016 €'000
48,688
(48,688)
2015 €'000
37,663 11 ,025
48,688
Following implementation of Solvency II reporting on l January 2016, the Company has released the equalisation provision previously recorded on the balance sheet.
As explained in accounting policy l(c)(vii), an equalisation prov1s1on was established in the Company financial statements in 2015 and prior financial years. Following adoption of Solvency II reporting from l January 2016, this provis ion was released. The release of this provision during 2016 resulted in an increase to shareholder' s funds of £48,688k (20 15 dec rease by£ 11,025k). The release of the provision also resulted in an increase in the technical account and profit on ordinary activities before tax by £48,688k (2015 decrease of £ 11 ,025k).
7. Employees
The Company does not employ any staff in the UK or Ireland. All UK staff are employed by QBE Management Services (UK) Limi ted. Al l Irish staff are employed by QBE M anagement (Ireland) Limited. The Company is recharged for the services provided by these staff.
The Company holds contracts of employment with those staff employed by the Belgian and Bermudian branches.
Total employee costs for the year, including those recharged from QBE P artner Services (Europe) LLP and QBE Management (Ireland) Limited were:
Wages and salaries Social security costs Other pension costs
2016 €'000
16,128 2,954 1,664
20,746
2015 €'000
14,400 2,779 1,748
18,927
Employee costs that have been recharged include amounts in respect of share based payments granted by the ul timate parent company. Full details of these share based payments are included in the financial statements of QBE Management Services (UK) Limited and QBE Management (Ireland) Limited as these are the companies that employ the staff.
It is not practicable to allocate employee numbers for the above recharged costs, so these have been disclosed in aggregate in the statutory financial statements of QBE Management Services (UK) Limited and QBE Management (Ireland) Limited.
The average monthly staff numbers directly employed by the Belgium and Bermudian branch of the Company for the year was:
2016 2015 Number Number
Underwriting 12 13 Claims 4 7 Administration 72 69
88 89
ANNUAL REPORT 27 31 DECEMBER 2016

QBE RE (EUROPE) LIMITED
NOTES TO THE FINANCIAL STATEMENTS (continued) for t he year ended 31 December 2016
8. Investment income, e:.:penscs and charges
(a) Investment income
Dividend income Income from other investments Realised gains on investments Foreign exchange gains
8. Investment income, expenses and charges (continued)
(b) Investment expenses and charges
Investment management expenses Realised losses on investments
9. Profit on ordinary activities before tax
Profit on ordinary activities before tax is stated after charging:
Auditors' remuneration in respect of audit services Auditors' remuneration in respect of other services supplied pursuant to legislation
Payments on operating leases Depreciation charge for the year
2016 €'000
3,847 15,531
154 10,133
29,665
2016 €'000
4 ,623 7,746
12,369
2016 €'000
156 76
498 199
Restated 2015
€'000
3,361 16,847
748 1,900
22,856
Restated 2015
€'000
2,549 2,889
5,438
2015 €'000
166 63
496 128
Fees paid to the auditors for the supply of other services are borne by other QBE Group companies. There are no nonaudit fees in respect to QBE Re (Europe) Limited.
ANNUAL REPORT 28 3 1 DECEMBER 201 6

QBE RE (EUROPE) LIMITED
NOTES TO THE FINANCIAL STATEMENTS (continued) for the year ended 31 December 2016
lO. Tax on profit on ordinary activities
Analysis of charge in year Current tax: UK corporation tax Adjustments to tax in respect of prior year Foreign tax
Total CU!Tent tax
Deferred tax: Origination and reversal of timing differences
Total deferred tax
Tax (benefit) I char~e on 2rofit on ordina2: activities
Factors affecting tax charge for the year
2016 2015 €'000 €'000
47 5 5 104
4,625 21,345
4,677 21,454
{4,795} (43)
(4,795) (43)
(118) 21,411
The tax for the year is lower than (20 15 higher) the sta ndard rate of corporation tax in the UK, 20.00% (20 15 20.25%). The differences are explained below:
Profit on ordinary activities before tax Profit on ordinary activities before tax multiplied by standard rate of corporation tax in the UK of20.00% (2015 20.25% )
Effects of Differences in tax rates outside UK Income exempt from tax Permanent differences Expenses not deductible for tax purposes Adjustments to tax in respect of prior year
Current tax (benefit) I charge for the year
Factors affecting current and future tax charges
2016 €'000
77,334
15,467
(7,002) (242)
(10,789) 2,443
5
(118)
2015 €'000
98,709
19,989
1,027 (245)
(I ,740) 2,276
104
21,411
A reduction to the UK corporation tax rate was announced in the July 2016 Budget which reduces the rate to 17% effective 1 Apri l 2020. This change was enacted on 15 September 2016 and is therefore recognised in these financial statements for the relevant deferred tax balances. The appropriate tax rate has been used, depending on when the timing/temporary differences are expected to be reversed.
The Belgian and Irish corporation tax rates of33.99% and 12.5% respectively have also been recognised on the relevant branch deferred tax balances.
There were no additional developments affecting the UK corporation tax rate in July 20 16 budget.
ANNUAL REPORT 29 3 1 DECEtviBER 20 16

QBE RE (EUROPE) LIMITED
NOTES TO THE FINANCIAL STATEMENTS (continued) for the year ended 31 December 2016
11. Pension schemes
A propot1ion of the management and administration of the Company is carried out by QBE Management Services (UK) Limited and QBE Management (Ireland) Limited, fellow group undertakings. QBE Management Services (UK) Limited and QBE Management (Ireland) Limited operate defined contribution pension schemes and defined benefit pension schemes for their employees. Details of the pension scheme arrangements are disclosed in the financial statements of QBE Management Services (UK) Limited and QBE Management (Ireland) Limited along with the total amount of pension contributions paid.
The Company's employees in the Belgian branch are covered by pension scheme arrangements as follows:
(a) Defined benefit scheme
The Company' s Belgian branch operates a defined benefit pension scheme (Secura NY scheme). The Secura NY scheme became part of the Company in 2012.
The pension contributions relating to the scheme are assessed in accordance with the advice of independent qualified actuaries so as to spread the cost over the service lives of employees.
The actuarial valuation was reviewed and updated by independent external actuaries as at 31 December 2016 for the purposes of inclusion in these financial statements.
The principal actualial assumptions used at the year end were:
2016 2015 % 0/o
Expected return on plan assets 1.8 1.8 Discount rate 1.8 1.8 Inflation 1.7 1.7
On retirement, the scheme pays out a lump sum based on the final salary of the employee. As a result, rate of increase of pensions and life expectancy are not assumptions needed in the valuation of the scheme.
The valuation of the scheme's liabilities bas been determined using the projected unit method.
In addition, an assumption is made as to the life expectancy of members of the scheme. In conjunction with the scheme actuaries, the mortality tables used to calculate the liabilities are the Belgian mortality table MR. and FR with an age correction of minus 3 years.
The scheme assets do not include any of the Company' s own financial instruments or any property occupied by, or other assets used by the Company. The pension scheme is invested in a collective fund managed by KBC Group NV.
Collective fund
Total market value of assets
ANNUAL REPORT 30
Market value 2016
€'000
11,461
11 ,461
Market value 2015
€'000
10,589
10,589
31 DECEMBER 2016

QBE RE (EUROPE) LIMITED
NOTES TO THE FINANCIAL STATEMENTS (continued) for the year ended 31 December 2016
11. Pension schemes (continued)
(a) Defined benefit scheme (continued)
The overall expected long term rate of return on fund assets is based on historical and future expectations of returns for each of the major asset classes as well as the expected and actual allocation of scheme assets to these major classes.
Analysis of the amount credited to other finance income: Expected return on scheme assets Interest on scheme liabilities
Net charge
Analysis of the amount recognised in the statement of other comprehensive income (OCI): Actuarial gain I (losses) Deferred tax (charges) I credit on actuarial losses
Gain I (loss) recognised in the OCI after tax
2016 €'000
190 (327)
(137)
2016 €'000
880 {213)
667
2015 €'000
169 (302)
(133)
2015 €'000
(202) 52
( !50)
The cumulative amount of actuarial gains and losses recognised in the statement of other comprehensive income is a pre tax loss of€2,283k (20 15 loss €3,163k).
There is no history of assets and liabilities or history of experience gains and losses before 2012, as the defined benefit pension scheme was transferred to the Company as of the start of 2012.
Wholly funded defined benefit obligation at I January Service cost Interest cost Actuarial losses Contributions Benefits paid
Wholly funded defined benefit obligation at 31 December
Fair value of scheme assets at 1 January Expected return on scheme assets Actuarial gain on scheme assets Benefits and expenses paid Employer contributions Arising from the transfer in of merged entities Distribution
Fair value of scheme assets at 31 December
Deficit in the balance sheet at 31 December
2016 €'000
(18,607) (691) (328) (383) I ll
1,415
(18,483)
10,589 190
1,264 (111) 944
(1 ,415)
11 ,461
(7,022)
In 2017 the Company plans to make contributions totalling €6 19k to the scheme.
ANNUAL REPORT 31
2015 2014 €'000 €'000
(17,078) (15, 188) (696) (697) (302) (469) (603) (81 1)
72 87
(18,607) (1 7,078)
9,385 7,536 169 244 401 950 (72) (87) 706 742
10,589 9,385
(8,018) (7,693)
31 DECEMBER 20 16

QBE RE (EUROPE) LIMITED
NOTES TO THE FINANCIAL STATEMENTS (continued) for !he year e11ded 31 December 2016
11. Pension schemes (continued)
(b) Defined contribution schemes
For those employees who are not members of the defined benefit scheme, the Belgian branch operates a defined contribution scheme. The pension entitlement of employees is secured through contributions to separately administered pension funds as appropriate. There are no outstanding pension accruals or prepayments for these schemes as at 31 December 2016 (2015 €nil). The charge for the year was €253k (2015 €908k).
The Company has no significant exposure to any other post-retirement benefits obligations.
(c) Medical scheme
The Company is committed to pay medical expenses of certain former employees on retirement. This is accounted for in the same way as the defined benefit pension scheme. The pension deficit in the balance sheet at 31 December 2016 was €591 k (2015 €5 18k).
12. Directors' emoluments
The foLlowing aggregate emoluments were paid to Directors of this Company, including by QBE Management Services (UK) Limited, in respect of services as Directors of this Company for the year:
Aggregate emoluments (excluding pension contributions) Compensation for loss of office Company pension contributions to defined benefit scheme Company pension contributions to money purchase scheme
Number ofDirectors who are members of a defined benefit scheme Number of Directors who are members of a money purchase scheme
Highest paid director: Aggregate emoluments Company pension contribution to money purchase scheme
13. lnvestments
(a) Shares in group undertakings
Class of Held by Company Registered office share
Plantation Place, 30 Fenchurch Street, London, EC3M3BD
QBE Services (Europe) Limited United Kingdom Ordinary
Holding in company
50%
2016 €'000
1,078
68
1,146
Number
5
€'000
857 57
2015 €'000
1,843 14 88
100
2,045
Number
2 8
€'000
1,070 64
Principal activity
Service company incorporated on 12
December 2014
QBE Services (Europe) Limited is a service company that was incorporated on 12 December 2014 and is 50% owned by QBE Insurance (Europe) Limited and 50% owned by QBE Re (Europe) Limited.
ANNUAL REPORT 32 31 DECEMBER 2016

QBE RE (EUROPE) LlMITED
NOTES TO THE FINANCIAL STATEMENTS (continued) for the year ended 31 December 2016
13. Investments (continued)
(b) Other fmancial investments
2016 Fair value Cost
€'000 €'000
Shares and other variable yield securities and units in unit trusts:
Shares- listed 18,058 17,611 Shares - unlisted 16,307 19,542 Other variable yield securities and units in unit trusts - unlisted 113,784 102,565
Debt securities and other fixed income- listed 1,395,352 1,385,046 Infrastructure loans 24,461 24,126 DeEosits with credit institutions 3 3
1,567,965 1,548,893
(c) Valuation hierarchy
2015 Fair value Cost
€'000 €'000
16,979 17,687 22,095 19,542
103,069 97,920 1,397,726 1,394,098
10,000 10,000 2 2
1,549,871 1,539,249
The table below shows the financial instruments canied at fair value using a fai r value hierarchy that reflects the significance of inputs into the deterrllination of fai r value as follows. The table excludes the deposits with credit institutions.
2016 Levell Level2 Level3 Total €'000 €'000 €'000 €'000
Shares - listed 18,058 18,058 Shares- unlisted 16,307 16,307 Debt securities and other fixed income- listed 160,094 1,235,258 1,395,352 Derivative financial instruments- assets 1,900 1,900 Other variable yield securities and units in unit 113,784 113,784 trusts - unlisted Infrastructure loans 9,949 14,512 24,461
178,152 1,360,891 30,819 1,569,862
2015 Levell Level2 Level3 Total €'000 €'000 €'000 €'000
Shares - listed 16,979 16,979 Shares- unlisted 22,095 22,095 Debt securities and other fixed income- listed 68, 184 1,329,542 1,397,726 Derivative financial instruments- assets 1,770 1,770 Other variable yield securities and units in unit 103,069 103,069 trusts - unlisted Infrastructure loans 10,000 10,000
85,163 1,434,381 32,095 1,55 1,639
The investments included in Level 3 have one or more inputs that are not based on observable market data. Tbe following table presents the movements of Level 3 in vestments during the year.
ANNUAL REPORT 33 3 I DECEMBER 2016

QBE RE (EUROPE) LIMITED
NOTES TO THE FINANCIAL STATEMENTS (continued) for the year ended 31 December 2016
13. Investments (continued)
Balance at 1 January Purchases Unrealised gains in profit and loss Redemetions
Balance at 31 December
Level 1 Valuation is based on quoted prices in active markets for the same instruments.
2016 2015 €'000 €'000
32,095 49,237 4,365
(5,410) 430 (231) (17,572)
30,819 32,095
Level 2 Valuation is based on quoted market prices in active markets for similar assets or liabilities or other valuation techniques for which all significant inputs are based on observable market data, for example, consensus pricing using broker quotes and valuation models with observable input. For unlisted property, fair valued is determined by using the current unit price as advised by the responsible entity, trustee or equivalent of the investment management scheme.
Level 3 Valuation techniques are appl ied in which any one or more significant input is not based on observable market data. The fair value of infrastructure loan prices are sourced from the investment manager who may use a combination of observable market prices or comparable market prices where available and carried book value where none exist.
14. Derivative fmancial instruments
F air value
Foreign currency derivatives Derivative financial instrwnent- assets Derivative financial instrument- liabilities
Foreign currency derivatives
2016 €'000
1,900 (6,847)
Restated 2015
€'000
1,770 (4,709)
The Company uses forward foreign exchange derivatives in order to hedge its exposure to foreign currencies. These are valued using the underlying foreign exchange rates at the year end. Contractual amounts included foreign exchange contracts to buy the net equivalent of € 11 2,384k (2015 €233,593k).
The forward foreign exchange derivatives outstanding at the year end expired by 25 January 2017 (2015 27 January 2016).
During the year a loss of €4,682k (2015 €18,703k loss) relating to forward foreign exchange derivatives was recognised. This .is included in the net foreign exchange gain of€10,133k (2015 €1,900k gain) in the profit and loss non-technical account.
Fb.:ed income derivatives
The Company entered into fixed income derivative future contacts to provide a partial hedge for the fixed income portfolios within the Company against a rise in short term interest rates.
During the year, a loss of €126k (2015 €87k loss) was included in the profit and loss non-technical account relating to these derivatives.
There are no contractual amounts for fixed income derivatives outstanding at the balance sheet date (2015 €nil).
ANNUAL REPORT 34 31 DECEMBER 2016
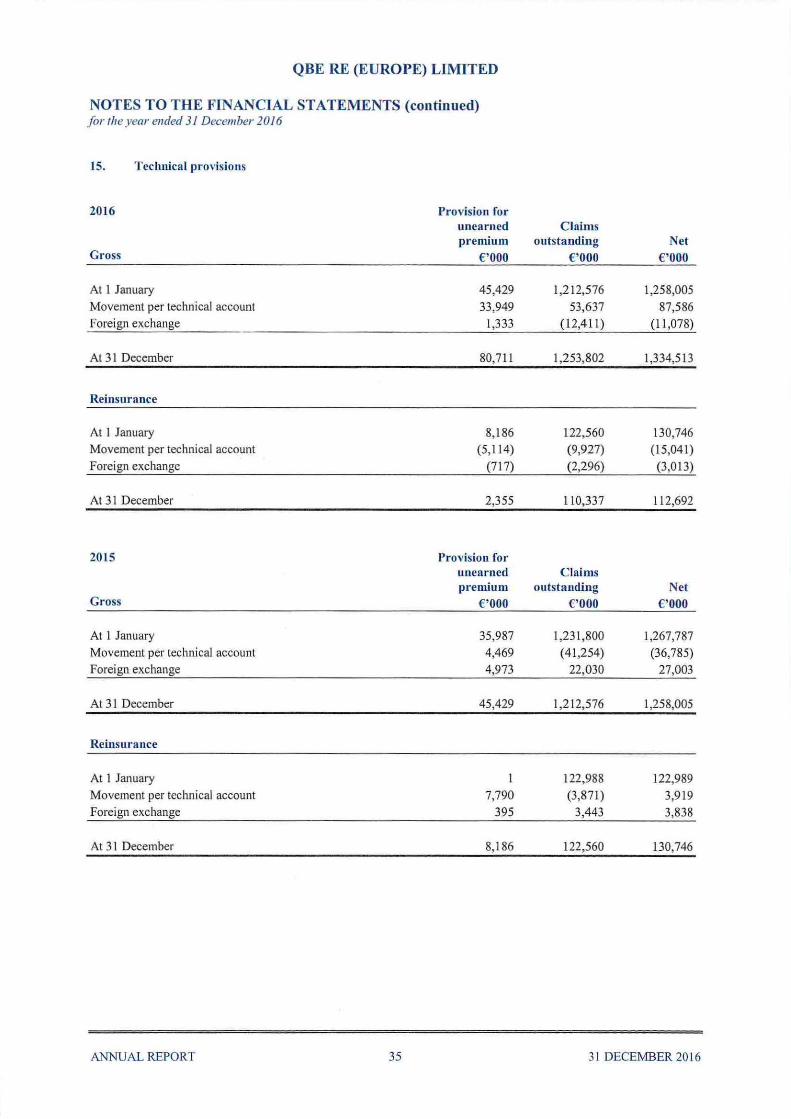
QBE RE (EUROPE) LIMITED
NOTES TO THE FINANCIAL STATEMENTS (continued) for the year ended 31 December 2016
15. Technical provisions
2016
Gross
At 1 January Movement per technical account Foreign exchange
At 31 December
Reinsurance
At 1 January Movement per technical account Foreign exchange
At 31 December
2015
Gross
At 1 January Movement per technical account Foreign exchange
At 31 December
Reinsurance
At 1 January Movement per technical account Foreign exchange
At 31 December
ANNUAL REPORT 35
Provision for unearned premium
€'000
45,429 33,949
1,333
80,711
8,186 (5,114)
(717)
2,355
Provision for unearned premium
€'000
35,987 4,469 4,973
45,429
7,790 395
8,186
Claims outstanding
€'000
1,212,576 53,637
(12,411)
1,253,802
122,560 (9,927) (2,296)
110,337
Claims outstanding
€'000
1,231,800 (41,254)
22,030
1,212,576
122,988 (3,871)
3,443
122,560
Net €'000
1,258,005 87,586
(1 1,078)
1,334,51 3
130,746 (15,041)
(3,013)
112,692
Net € '000
1,267,787 (36,785)
27,003
1,258,005
122,989 3,919 3,838
130,746
3 1 DECEMBER 20 16

QBE RE (EUROPE) LIMITED
NOTES TO THE FINANCIAL STATEMENTS (continued) for the year ended 31 December 2016
16. Outstanding claims - claims development
2012 and 2016 prior 2013 2014
€'000 €'000 €' 000
At end of year 204,774 207,455 One year later 212,209 207,041 Two years later 208,126 201,565 Three years later 203,200 CutTent estimate of net cumulative claims cost 203,200 201,565 Cumulative net claims payments to date (107,570) (103,871)
Net outstanding claims 635,8 11 95,630 97,694
2015 2016 Total €'000 €'000 €'000
176,582 213,241 199,304
199,304 213,241
(69,667) (28,548)
129,637 184,693 1,143,465
At the start of2012 the net outstanding claims liabi lities oftwo wholly owned QBE Group companies were transferred into the Company by way of a portfolio transfer. For financial reporting purposes the net outstanding claim liabilities that were transferred are disclosed in the 2012 underwriting year.
The Company writes business in currencies other than Euro. The translation of outstanding claims denominated in foreign currencies gives rise to foreign exchange movements which have no direct bearing on the development of the underlying claims. To eliminate this distortion, all estimates of net cumulative claims cost and cumulative payments for the 4 most recent reporting years denominated in currencies other than Euro have been retranslated to Euro using exchange rates at the end of the current financial year.
17. lmpact of changes of key variables on the outstanding claims provision
The impact of changes in key variables used in the calculation of the outstanding claims provision is summarised in the table below. Each change has been calculated in isolation from the other changes and assuming that there is no change to any of the other variables.
Profit I (loss) Profit I (loss) Sensitivity 2016 2015
o;o €'000 €'000
Net claims outstanding +5 45,739 43,464 -5 (45,739) (43,464)
Euro to US dollar exchange rate +10 5,279 5,839 -1 0 (5,279) (5,839)
Euro to Pound sterling exchange rate +10 8,909 8,616 -10 (8,909) (8,616)
The above is shown net of taxation at the standard rate of20.00% (2015 20.25%).
ANNUAL REPORT 36 31 DECEfv1BER 2016
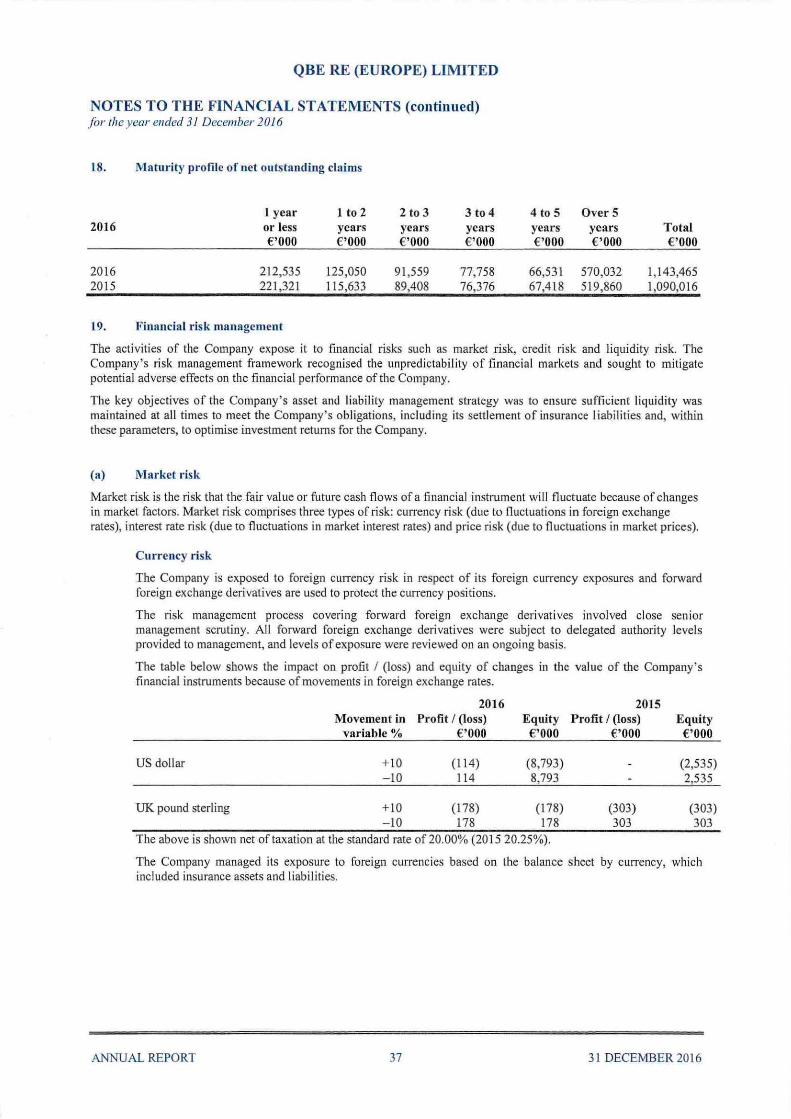
QBE RE (EUROPE) LIMITED
NOTES TO THE FINANCIAL STATEMENTS (continued) for rite year ended 31 December 2016
18. Maturity proftle of net outstanding claims
1 year 1 to 2 2 to 3 3 to4 4 to 5 OverS 2016 or less years years years years years Total
€'000 €'000 €'000 €'000 €'000 €'000 €'000
2016 212,535 125,050 91,559 77,758 66,531 570,032 1,143,465 2015 221,321 115,633 89,408 76,376 67,418 519,860 1,090,016
19. Financial risk management
The activities of the Company expose it to financial risks such as market risk, credit risk and liquidity risk. The Company's risk management framework recognised the unpredictabi lity of financial markets and sought to mitigate potential adverse effects on the financial performance of the Company.
The key objectives of the Company's asset and liability management strategy was to ensure sufficient liquidity was maintained at all times to meet the Company's obligations, including its settlement of insurance I iabilities and, within these parameters, to optimise investment returns for the Company.
(a) Market risk
Market risk is the risk that the fair value or future cash flows of a financial instrument will fluctuate because of changes in market factors. Market risk comprises three types of risk: currency risk (due to fluctuations in foreign exchange rates), interest rate risk (due to fluctuations in market interest rates) and price risk (due to fl uctuations in market prices).
Curre ncy risk
The Company is exposed to foreign currency risk in respect of its foreign currency exposures and forward foreign exchange derivatives are used to protect the currency positions.
The risk management process covering forward foreign exchange derivatives involved close senior management scrutiny. All forward foreign exchange derivatives were subject to delegated authority levels provided to management, and levels of exposure were reviewed on an ongoing basis.
The table below shows the impact on profit I (loss) and equity of changes in the value of the Company's financial instruments because of movements in foreign exchange rates.
US dollar
UK pound sterling
2016 Movement in Pr ofit I (loss)
variable % €'000
+ 10 - 10
+10 - 10
(114) 114
(178) 178
2015 Equity Profit I (loss) €'000 €'000
(8,793) 8,793
(178) 178
(303) 303
E quity €'000
(2,535) 2,535
(303) 303
The above is shown net of taxation at the standard rate of20.00% (2015 20.25%).
The Company managed its exposure to foreign currencies based on the balance sheet by cun·ency, which included insurance assets and liabilities.
ANNUAL REPORT 37 3 1 DECEMBER 20 16

QBE RE (EUROPE) LIMITED
NOTES TO THE FINANCIAL STATEMENTS (continued) for t he year ended 31 December 2016
19. Financial risk management (continued)
(a) Market risk (continued)
Interest rate risk
The Company was exposed to interest rate risk arising on interest bearing assets. Assets with floating interest rates exposed the Company to cash flow interest rate ri sk. Fixed interest rate assets exposed the Company to fair value interest rate risk. The Company's strategy was to invest in high quality, liquid fixed interest securities and cash and to actively manage duration. The investment portfolios were actively managed to achieve a balance between cash flow interest rate risk and fair value interest rate risk bearing in mind the need to meet the liquidity requirements of the business.
The Company's exposure to interest rate risk for each significant class of interest bearing financial assets and liabilities is as follows:
2016 Fixed interest rate maturing in Floating Interest 1 year or 1 to 2 2 to 3 Over3
rate less years years year s Total €'000 €'000 €'000 €'000 €'000 €'000
Interest bearing financial assets 766,215 185,405 23,362 77,166 413,733 1,465,881
2015 FLxed interest rate maturing in Floating interest 1 year or Ito 2 2 to 3 Over3
rate less years years years Total €'000 €'000 €'000 €'000 €'000 €'000
Interest bearing financial assets 707,005 410,737 81 ,846 217,937 1,417,525
The Company's sensitivity to movements in interest rates in relation to the value of fixed interest securities is shown in the table below.
Movement 2016 2015 in variable Profit I (loss) Profit I (loss)
% €'000 € ' 000
Interest rate movement - fixed interest securities +0.5 (11 ,076) (5,517) -0.5 7,508 2,83 1
The above is shown net of taxation at the standard rate of20.00% (2015 20.25%).
Equity price risk
Equity price risk is the risk that the fair value of an equity financial instrument will fluctuate because of changes in market prices (other than those arising from interest rate or currency risk), whether those changes are caused by factors specific to the individual equity instrument or its issuer, or factors affecting all similar equity instruments traded on the market.
Movement 2016 2015 in variable Profit I (loss) Profit I (loss)
0/o €'000 €'000
Euro Stoxx +20 4,927 5,628 -20 (4,927) (5,628)
Emerging Market Equi ties +20 80 2,089 -20 (80) (2,089~
The above is shown net of taxation at the standard rate of20.00% (2015 20.25%).
ANNUAL REPORT 38 3 1 DECEMBER 2016

QBE RE (EUROPE) LIMITED
NOTES TO THE FINANCIAL STATEMENTS (continued) for the year ended 31 December 2016
19. Financial risk management (continued)
Property price risk
Property price risk is the risk that the fa ir value of property will fluctuate because of changes in property market plices. The Company is exposed to property price risk indirectly through investments in unlisted property trusts in key developed markets.
Movement 2016 2015 in variable Profit I (loss) Profit I (loss)
% €'000 € ' 000
Property price- United States + 10 4,954 2,389 -10 (4,954) (2,389)
Property price- Europe + 10 2,639 4,787 -10 (2,639) ~4,787)
The above is shown net of taxation at the standard rate of20.00% (2015 20.25%).
(b) Credit risk
Credit risk is the risk that one party to a financial instrument will cause financial loss to the other party by failing to discharge an obligation.
Credit risk exposures are calculated regularly and 96.2% (2015 99.3%) of total fixed interest and cash investments are with counterparties having a Moody 's rating of A or better. The Company does not expect any investment counterparties to fai l to meet their obligations given their s trong credit ratings. The Compa ny only uses derivatives in highly liquid markets.
The reinsurers' share of claims outstanding is also exposed to credit risk. As at 3 1 December 2016, 25.5% (2015 19.5%) of the reinsurers' share of claims outstanding was with fe llow group undertakings and 86.6% (20 15 72.2%) of the remaining balance was with reinsurers with a standard rating of A or greater.
The Company holds letters of credit as security to mitigate credit ri sk exposure to reinsurers. At the balance sheet date the Company held €29,909k as collateral against credit risk (201 5 €28,4 18k).
The following table provides information regarding the carrying value of the Company's financial assets. All amounts were neither past due nor impaired.
Interest bearing investments Other ftnancial investments Derivative fmancial instruments - assets Other debtors Debtors arising out of reinsurance operations
ANNUAL REPORT 39
Restated 2016 2015
Neither past Neither past due nor due nor
impaired impaired €'000 €'000
1,465,881 1,417,525 129,770 142,143
1,900 1,770 5,521 4,636
240,424 187,456
31 DECEMBER 2016
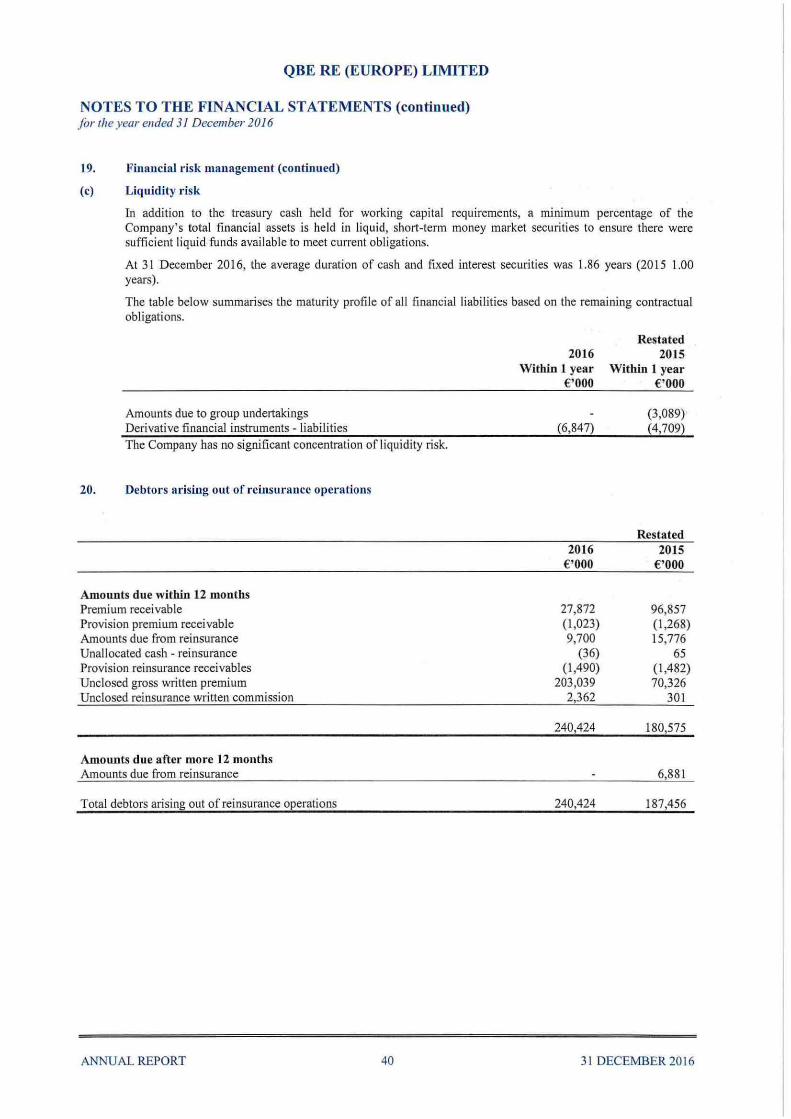
QBE RE (EUROPE) LIMITED
NOTES TO THE FINANCIAL STATEMENTS (continued) f or the year ended 31 December 2016
19. Financial risk management (continued)
(c) Liquidity risk
In addition to the treasury cash held for working capital requirements, a minimum percentage of the Company's total financial assets is held in liquid, sh01t-term money market securities to ensure there were sufficient liquid funds avaiJable to meet current obligations.
At 31 December 2016, the average dmation of cash and fixed interest securities was 1.86 years (2015 1.00 years).
The table below summarises the maturity profile of all financial liabilities based on the remaining contractual obl igations.
Amounts due to group undertakings Derivative financial instruments - liabilities The Company has no significant concentration of liquidity risk.
20. Debtors arising out of reinsurance operations
Amounts due within 12 months Premium receivable Provision premium receivable Amounts due from reinsurance Unallocated cash - reinsurance Provision reinsurance receivables Unclosed gross written premium Unclosed reinsurance written commission
Amounts due after more 12 months Amounts due from reinsurance
Total debtors arisin~ out of reinsmance o~erations
ANNUAL REPORT 40
2016 Within 1 year
€'000
(6,847)
2016 €'000
27,872 (1,023) 9,700
(36) (1,490)
203,039 2,362
240,424
240,424
Restated 2015
Within 1 year €'000
(3,089) (4,709)
Restated 2015
€ '000
96,857 (1,268) 15,776
65 {1,482) 70,326
301
180,575
6,881
187,456
31 DECEMBER 201 6

QBE RE (EUROPE) LIMITED
NOTES TO THE FINANCIAL STATEMENTS (continued) for the year ended 31 December 2016
21 . Deferred tax
Deferred tax Deferred tax asset at start of year Deferred tax charge in profi t and loss account (note 1 0) Other movements Movement in provision - equity (note 11 (a))
Deferred tax asset
Comprising: Pension - profi t & loss movement Pension- equity movement Other timing differe nces
Undiscounted deferred tax asset
22. Other debtors
Amounts due from group undertakings Unsettled investment trade debtors Corporation tax Other receivables
€nil of other debtors is due after more than one year (201 5 €nil) .
ANNUAL REPORT 41
2016 2015 €'000 €'000
2,902 2,804 4 ,795 43
3 (213) 52
7,484 2,902
(93) 123 2,566 2,779 5,011
7,484 2,902
Restated 2016 2015
€'000 €'000
24,650 5,520
30,170
117 30
519 4,000
4,666
31 DECEl\.1BER 2016

QBE RE (EUROPE) LIMITED
NOTES TO THE FINANCIAL STATEMENTS (continued) for the year ended 31 December 2016
23. Tangible assets
Office
Cost As at 1 January 2016 Additions DisEosals
At 31 December 2016
Accumulated depreciation As at I January 2016 Depreciation charge DisEosals
At 31 December 2016
Net book value at 31 December 2016
Net book value at 31 December 2015
24. Called up share capital
Called up, allotted and fully paid 20,082,852 (2015 20,082,852) ordinary shares of£ I each
25. Other creditors including taxation and social security
Amounts due to group undertakings Unsettled investment trade creditors Corporation tax
26. Operating lease commitments
equipment €'000
792
(1)
791
(490) (114)
1
(603)
188
302
Annual commitments of the Company under operating leases are as follows:
Land and buildings Leases which expire: Witllin one year Between one and five years
ANNUAL REPORT 42
Computer equipment Total
€'000 €'000
627 1,419 122 122
{1092 (110)
640 1,431
(561) (1,051) (85) (199) 109 110
(5372 {1,140)
103 291
66 368
2016 2015 €'000 €'000
24,205 24,205
Restated 2016 2015
€'000 €'000
279 17,665
17,944
3,089 17,977
1,636
22,702
2016 2015 €'000 €'000
59 439
498
72 424
496
31 DECEJ\1BER 20 16

QBE RE (EUROPE) LIMITED
NOTES TO THE FINANCIAL STATEMENTS (continued) for the year ended 31 December 2016
27. Charges on assets
The Company had outstanding liabi lities covered by the deposit of cash and investments in respect of undrawn letters of credit as per the following table, with Euro equivalents translated at the relevant balance sheet date:
2016 2015 Local Local
currency currency '000 €'000 ' 000 €'000
Australian dollar 5,989 4,105 5,804 3,892 US dollar 17,721 16,850 19,290 17,752 Euro 403 403 403 403 Canadian dollar 309 219 309 206 Pound sterling 600 704 600 814
Additionally, there are charges over the investment portfolio of €300,000k (201 5 €287,632k) in the Belgian branch, pledged in favour of different cedant companies as a guarantee covering the outstanding claims reserves from certain inward treaties the branch has entered into.
28. Presentation of prior year comparatives
The Company has changed the presentation of unreali sed gains and losses on foreign exchange derivatives to present the deri vative financial instrument assets and liabilities at a counterparty level, where right of set-off exists. In the prior year derivative financial instrument assets and liabil it ies were presented at a contract level.
The impact of this change to the balance sheet is:
Derivative financial instruments- assets Derivative financial instruments - liabi lities
Restated presentation
€'000 1,770
(4,709)
Previous presentation
€'000 2,827
(5,766)
There has been no impact to the profit and loss account or the value of net assets from this change in presentation.
The Company has changed the presentation of interest expense associated with foreign exchange derivatives to present this expense within investment expenses and charges. l n the prior year this expense was presented within investment income.
The impact of this change to the Profit and Loss Account- Non-Technical Account is:
Investment income Investment expenses and charges
Restated presentation
€'000 22,856 (5,438)
Previous presentation
€'000 20,996 (3,578)
There has been no impact to the profi t and loss account or the value of net assets from this change in presentation.
ANNUAL REPORT 43 31 DECEMBER 20 16

QBE RE (EUROPE) LIMITED
NOTES TO THE FINANCIAL STATEMENTS (continued) for the year ended 31 December 2016
28. Presentation of prior year comparatives (continued)
The Company has also changed the presentation of unsettled investment purchases and sales to present these balances with.in other debtors and other creditors. In the prior year these balances were presented wi thin accruals and deferred income and accrued interest.
The impact of this change to the balance sheet is:
Other debtors Accrued interest
Other creditors including taxation and social security Accruals and defeiTed income
Restated presentation
€'000 4,666 4,570
22,702 3,274
Previous presentation
€'000 4 ,636 4,600
4,725 21,251
There bas been no impact to the profit and loss account or the value of net assets from th.is change in presentation.
29. Available capital resources
In accordance with PRA regulatory requirements in place during 2015, the Company separately reported the capital resources between long-term and general business of the Company. Following adoption of Solvency II reporting with effect from 1 January 2016, the Company no longer reports separate capital resource balances.
2015
Shareholder ' s funds
Adjustments onto regufato1y basis: Adjustments to assets
Total avai lable capital resources
30. Movements in capital resources for long-term business
Long-term business
€'000
16,340
16,340
General Total business
€'000 €'000
584,966 601,306
(19,837) (19,837)
565,129 581,469
In accordance with PRA regulatory requirements in place during 2015, the Company separately reported the movements in capital resources attributable to the long-term business of the Company. Following adoption of Solvency II repotting with effect from l January 2016, the Company no longer reports the movement in capital resources for the long-term business.
Balance at 1 January New business and other factors
Movement in the year in capital resources for long-term business
ANNUAL REPORT 44
2015 €'000
16,688 (348)
16,340
31 DECEMBER 20 16

QBE RE (EUROPE) LIMITED
NOTES TO THE FINANCIAL STATEMENTS (continued) for the year ended 31 December 2016
31 . Capital resource sensitivities
The capital position is sensitive to changes in market conditions, due to both changes in the value of the assets and the effect that changes in investment conditions may have on the value of the liabil ities. It is also sensitive to assumptions and experience relating to mortality and morbidity and, to a lesser extent, expenses and persistency. The most significant sensitivities arise from the fo llowing three risks:
• m011ality risk in relation to annuity business, which would arise if the mortality of annuitants improved more rapidly than the assumptions used for reserving;
• market risk in relation to annuity business, which would arise if the return from the fixed interest investments supporting this business were lower than that assumed for reserving; and
• mortality risk in relation to term assurance business, which would arise if mot1ality of the lives insured were heavier than that assumed, possibly because of an epidemic or catastrophe.
The timing of any impact on capital would depend on the interaction of past experience and assumptions about future experience. In general, if experience had deteriorated or was expected to deteriorate and management actions were not expected to reduce the future impact, then assumptions relating to future experience would be changed to reflect it. In this way, liabi li ties would be increased to anticipate the future impact of the worse experience with immediate impact on the capital position.
32. Parent undet·takings
The Company's ultimate parent undertaking and controlling entity is QBE [nsurance Group Limited, which is incorporated in Australia. This is the largest and smallest group of undet1akings into which the Company's financial statements are consolidated.
The Company's immediate parent company is QBE Holdings (EO) Limited, which is incorporated in the United Kingdom. QBE Holdings (EO) Limited is a wholly owned subsidiary ofQBE Insurance Group Limited.
The consolidated financial statements for QBE Insurance Group Limited are available from the Company's registered office at Plantation Place, 30 Fenchurch Street, London, EC3M 3BD.
ANNUAL REPORT 45 3 1 DECEMBER 2016