qer 1.2: an integrated study of the u.s. electricity system installment... · and office of science...
TRANSCRIPT

1
February 4, 2016 Stakeholder Briefing Memo
QER 1.2: An Integrated Study of the U.S. Electricity System
Introduction The energy landscape in the United States is undergoing fundamental and historic change, driven by increased domestic production of oil and gas, the growth of renewable electricity generation, improvements in energy efficiency across sectors, growing interdependence among systems, and the introduction of a host of new services and technologies. The United States energy landscape is also being shaped by Federal, state and local policies that accelerate these changes, such as state renewable energy and efficiency goals, and carbon emissions reductions required by the Clean Power Plan and state efforts like California’s AB32 and the Northeast’s Regional Greenhouse Gas Initiative. The energy security implications of these changes are profound: North American energy imports are at record lows; vulnerabilities are more evident, particularly with respect to aging infrastructure and physical and cyber threats and vulnerabilities are accentuated; and the entrance of the United States into world crude oil and natural gas markets is generally welcomed by U.S. allies as positive for global energy security. Against this backdrop of dramatic change, President Obama issued a Presidential Memorandum establishing a Quadrennial Energy Review (QER) in January 2014.1 The administration-wide QER is intended to enable the Federal government to translate policy goals into a set of analytically based, integrated actions--executive actions, legislative proposals, and budget and resource requirements for proposed investments--over a four-year planning horizon. The White House Domestic Policy Council and Office of Science and Technology Policy jointly chair an interagency QER Task Force, while the Secretary of Energy provides support to the QER Task Force through an Executive Secretariat in the Office of Energy Policy and Systems Analysis, including coordination of activities related to the preparation of the QER report, policy analysis and modeling, and stakeholder engagement. Unlike other Federal Quadrennial Review processes where an analysis is done every four years, the QER is being conducted through installments to allow for granular analysis of key energy sub-sectors. The fourth installment is intended to be a synthesis of the previous three; this structure will provide policy makers both deep and broad policy analysis of the complex and inter-dependent elements that comprise the Nation’s energy system. The first installment of the Quadrennial Energy Review examined the Nation's infrastructure for transmission, storage, and distribution, including liquid and natural gas pipelines, the grid, and shared transport such as rail, waterways and ports. On April 21, 2015, the Quadrennial Energy Review Task Force released its first Quadrennial Energy Review installment (QER 1.1) entitled, Energy Transmission, Storage, and Distribution Infrastructure. Given the critical enabling role of electricity articulated in QER 1.1, the Administration has determined that the second installment of the QER (QER 1.2) will develop a set of findings and policy recommendations to help guide the modernization of the nation’s electric grid and ensure its continued reliability, safety, security, affordability, and environmental performance through 2040.
1 https://www.whitehouse.gov/the-press-office/2014/01/09/presidential-memorandum-establishing-quadrennial-energy-review

2
The Electricity Sector in Transition: QER 1.2 Scope and Systems Approach QER 1.1 noted that “all critical infrastructures depend on electricity.”2 The centrality of electricity to the Nation’s economic and environmental health and its energy and national security means that the United States has a vested interest in this critical sector, both in its current form and in its modernization. The growing reliance and the associated opportunities and vulnerabilities that a changing electricity system presents warrants a closer examination of the entire electricity system: from generation, through transmission and distribution, to end use. As part of its analysis, QER 1.2 will consider the roles and activities of major actors, industries, and institutions integral to the electricity system, as well as technologies, fuel choices, physical and cyber vulnerabilities, jurisdictional authorities, markets and finance. As with the first installment, QER 1.2 will make findings and recommendations for policymakers. QER 1.2 will continue its systems approach. It will include an analysis of the fundamental elements that comprise the electricity system, including end use, distribution, transmission, grid operations and planning, generation, markets, finance, and security. This second installment will also include an integrative cross-cutting examination incorporating valuation of system-level costs and benefits of actual and potential investments, resilience, jurisdictional authorities, markets and finance, innovation, regional differences and options, workforce, and the environment—as well as interactions and interdependencies within the electricity system and how broader societal trends like growing digitization and population movement affect the system as a whole. The electricity system across continental North America is already connected and highly integrated between the United States and Canada and could be increasingly so with Mexico. QER 1.2 will also include analysis and recommendations related to the trilateral energy relationship between the United States, Canada, and Mexico and intended to improve integration across the continent.
Select Drivers of Change in the Power Sector The United States has one of the world’s most reliable, affordable, and increasingly clean electric systems. This grid powers the Nation’s economy and helps provide for the well-being of its citizens. The U.S. electric system is, however, at a strategic inflection point—a time of significant changes in a system that has been relatively stable for nearly a century. These changes include the growing use of natural gas for power generation; low load growth; increasing deployment of renewable energy; the retirement of coal and nuclear generation; severe weather and climate change; evolving environmental and energy policies; the availability of a range of technologies that could be disruptive; and growing need for jurisdictional cooperation between Federal, State, and local levels. Innovative technologies and services are being introduced to the system at a rapid rate, often increasing efficiency, reliability, consumer choice, and improving environmental performance, but also injecting uncertainty into grid operations, traditional regulatory structures, and utility business models. The electricity system is also currently the largest contributor of carbon pollution. Changes in technologies, business plans, and policies are required for deep reductions in carbon emissions from the power sector; this will drive further changes in the electricity system.
2 Quadrennial Energy Review: Energy Transmission, Storage and Distribution Infrastructure. April 2014. Section 2, Page 13. www.energy.gov/qer.

3
The Changing Generation Mix The electricity generation mix in the United States is currently undergoing a fairly dramatic shift towards more natural gas and variable renewables. Low-priced natural gas (largely as a result of the shale revolution), in combination with evolving environmental requirements, is driving this shift; renewable deployment is also growing through a combination of falling capital costs and Federal and state incentives. Natural gas generation leads capacity additions, with over 5,600 megawatts of new capacity in the first eleven months of 2015. Over that time period, over 5,500 megawatts of wind generation capacity and 1,800 MW of solar have come on line. The share of coal generation fell from approximately 50 percent in 2005 to 34 percent in late 2015, while natural gas and non-hydro renewable sources increased from 19 percent to 33 percent and 2 percent to 7 percent, respectively, over the same time period. 3 These shifts have important implications for how the grid operates. Generators that can quickly start and stop, and ramp output up and down, provide the grid with valuable flexibility services. This is especially important in a grid with increasing amounts of variable generation. Typically, combined-cycle gas turbines have the best flexibility attributes. Most markets, however, do not currently reward generators for this flexibility. Conventional centralized power generators supply both energy to meet demand and a suite of ancillary services, such as regulation and frequency response that maintain system reliability. As the proportion of energy supplied by conventional generators decreases, so too does the availability of these ancillary services, which may then need to be procured separately. These
services are key to integrating renewable energy into the electricity system. Efficiency Improvements and Customer Choice Are Changing the System The slowing rate of growth in electricity demand is one of the most striking results of changes in end-use behavior, decreasing both load and the need for additional infrastructure, as well as reducing carbon emissions and potentially reducing utility revenue. Growth in U.S. electricity demand is at its lowest level in decades and is projected to continue to remain flat
3 January 2016 Electric Power Monthly with data for November 2015.
Figure 1. Industrial electricity productivity (defined as GDP produced/energy consumed} from 1990 to 2014. Source: EIA Annual Energy Outlook 2015.

4
or decline.4 This is driven by structural shifts in the U.S. our economy as well as improvements in energy efficiency. Standards, incentives and statutory goals will continue to drive end-use efficiency and investments. Also, while demand growth is virtually flat, productivity (as measured by units of GDP produced per unit of energy consumed) is growing. The industrial sector’s electricity productivity, for example, nearly doubled (96 percent growth) between 1990 and 2014 (Figure 1). Energy efficiency improvements are impacting the overall supply-demand balance in the United States. Advances in the efficiency of providing residential, commercial, transportation and industrial energy services have reduced the need for new energy infrastructure additions, saved money for consumers, improved security, and reduced overall environmental impacts. Advances in lighting, heating and cooling, distributed generation, electricity storage, transportation, and grid-enabled technologies have given consumers greater control of their energy consumption. Technological advances like the transition from compact fluorescent lights (CFLs) to light-emitting diodes (LEDs) are helping to reduce the energy intensity of the U.S. economy.5 Additionally, more stringent state building codes that establish minimum energy efficiency standards for new homes and renovations are also driving significant energy savings. Growing Concerns about Cyber and Physical Security Physical and cyber security concerns in the power sector have been elevated by the importance of electricity to the economy and its critical infrastructures. The integration of information communication technology with legacy devices as well as new decentralized systems offers advantages for system control and can contribute to resilience – but conversely, increased system integration and connectivity also give rise to larger and more complex networks of physical and cyber electricity assets that must be protected. In just the last five years, cyber threats to the grid have become more numerous and sophisticated. 6 Cyber threats may evolve faster than government standards for the electricity industry, a well-founded but alarming concern that illustrates the growing nature of the threat to the electricity sector. The uneven capacity of electricity companies to develop, implement, and maintain protective and responsive measures adds to these challenges. However, the electricity sector has a robust partnership with Federal agencies to coordinate efforts to prepare for, and respond to, national-level disasters or threats to critical infrastructure like cyber attacks. Environmental Risks are Among the Forces Driving Grid and Policy Changes QER 1.2 will look at environmental impacts of the electricity sector as well as the impacts of changes in the environment on the electricity sector. Specific health and environmental concerns associated with operation of the electric power system include impacts on water, waste, air quality and greenhouse gas
4 Quadrennial Energy Review: Energy Transmission, Storage and Distribution Infrastructure. April 2014. Section 1, page 8. www.energy.gov/qer. 5 LED technology can decrease lumens/watt by 75 percent or more. http://energy.gov/energysaver/articles/led-lighting. 6 Quadrennial Energy Review: Energy Transmission, Storage and Distribution Infrastructure. April 2014. Section 2, Page 37. www.energy.gov/qer.

5
(GHG) emissions associated with climate change. QER 1.2will examine trends in environmental indicators, including the role of policies in shaping and responding to those trends
Work is underway to better understand the interconnected flows of energy and water at the state, regional, and national levels; how these have changed; and how they may continue to change over time. This analysis will be used to further assess the potential to reduce electricity use in the water sector (i.e., management of drinking water and waste water, long distance conveyance, and agriculture) recommend policies to minimize the impacts of power generation on water resources: and impacts of drought on cooling water availability.
The storage and disposal of solid wastes produced during generation will also be examined, as well as the waste streams produced during the decommissioning of power plants. Solid waste issues pose a growing challenge as generations of power plants retire and as the power generation portfolio evolves over time. The electric power sector is the leading source of emissions for a number of major air pollutants, including greenhouse gases (GHG) and sulfur dioxide. While air quality in the United States has been improving for decades, largely due to Clean Air Act requirements and to relatively recent changes in the power mix, emissions still pose public health and climate change risks (Figure 2).7 Emissions mitigation, including of those emissions associated with climate change will also be an important area of focus in QER 1.2. Analysis will include an examination of how changes in power sector infrastructure and operations could affect emissions throughout the economy. In addition, QER 1.2 will explore electricity generation and energy efficiency pathways that would be consistent with the U.S. economy-wide emission reduction goals for 2050.8 While the electricity system affects the environment, changes in the environment create risks for the electricity sector. U.S. electricity and related infrastructure has also been increasingly impacted by major
7 All emissions are reported in carbon dioxide equivalent units using global warming potentials (GWP) from the IPCC Fourth Assessment Report (AR4). Methane has a GWP of 25, meaning that the release of 1 kg of methane has a heat-trapping effect equivalent to the release of 25 kg of carbon dioxide. The GWP of nitrous oxide is 298. 8 Consistent with the second Biennial Report recently submitted to the UNFCCC. http://unfccc.int/files/national_reports/biennial_reports_and_iar/submitted_biennial_reports/application/pdf/2016_second_biennial_report_of_the_united_states_.pdf
Figure 2. Greenhouse Gas Emissions from Electricity Generation, 1990-2013. Source: EPA (2015). Inventory of U.S. Greenhouse Gas Emissions and Sinks 1990-2013. Table 2-11. EPA data was used to produce Figure 2.
6
storms over the past two decades and there is a growing urgency to reduce exposure to risks associated with climate change and extreme weather. Reducing the frequency and duration of power outages is a significant motivator for increased investments in resilience. While there are a number of threats, and risks change over time, for the past several years, weather events have consistently been the leading cause of electric power outages.9 The report will characterize the leading vulnerabilities of the electric power sector to climate risks and priority actions for reducing those risks through investments in system resilience. In conjunction with analysis on the broader issue of valuation, QER 1.2 will identify key metrics and relevant data sources that would enable quantitative valuation of the costs of climate change to the electric power sector and benefits associated with investments in climate resilience measures and lower carbon infrastructure. The United States is already experiencing the effects of climate change and taking steps to reduce emissions. Local, state and Federal governments have been working with utilities10 and other private sector partners to respond to climate-related risks to the electric power sector. It is clear, however, that the pace and scale of these efforts will need to be accelerated to adequately build resilience to future climate change. Technologies and Policies are Challenging Historical Jurisdictional Arrangements State, local, and Federal agencies all have a role in regulating the electric utilities and the essential power services they provide. These agencies oversee service terms, rates, safety, power markets, and environmental and public health impacts. The state and Federal regulatory roles are clearly established by the Federal Power Act of 1935 and most of these still stand today. The traditional boundaries and regulations on which these roles are predicated are, however, increasingly being tested by new technologies and policies. With the rapid transformation of the electricity sector, utilities and regulators are balancing factors like cost, reliability, environmental performance, and consumer service under new, non-traditional business and regulatory frameworks. Distribution-level planning, as an example, is growing in significance as more distributed energy resources—such as advanced renewable technologies and storage—enter the grid. Utility planners and regulators are increasingly required to integrate planning across transmission and distribution systems, elevating the need for enhanced coordination between state and Federal governments and consumers. Technology and systems innovation are especially critical to achieving national goals, such as a low-carbon energy system where the electricity sector plays a central role. Examples of major advances in technology cost reduction and deployment over the past decade include wind, solar, and LED technologies.11 QER 1.2 will complement other analytical efforts related to technology and innovation, such as the recent DOE Quadrennial Technology Review (QTR).12 In particular, QER 1.2 will address innovation policy for the electricity sector in the context of clean, secure, and competitive energy.
9 Quadrennial Energy Review: Energy Transmission, Storage and Distribution Infrastructure. April 2014. Section 2, Page 9. www.energy.gov/qer. 10 For example, the Partnership for Energy Sector Climate Resilience: http://energy.gov/epsa/partnership-energy-sector-climate-resilience 11 For example, see DOE’s Revolution Now: The Future Arrives for Four Clean Energy Technologies at http://www.energy.gov/revolution-now 12 Quadrennial Technology Review. September 2015. http://energy.gov/quadrennial-technology-review-2015.

7
Innovation in the electricity sector occurs in extensively regulated ecosystems – with interactions among researchers, entrepreneurs, corporations, and investors. These ecosystems may have strong regional characteristics based on regional energy policies, power market structures, industry strengths, energy resource availability, and current innovation centers. This installment of the QER will seek to identify characteristics that can accelerate innovation across the electricity sector. More Changes May be Needed in Grid Operations and Planning Technology advances, and security, reliability and resilience issues are raising issues about transmission and distribution system operations and planning, including increasing intersections between transmission and distribution. Planning must consider how and where to deploy new technologies. Planning potentially needs to consider new structures for control systems, such as supplementing centralized controls in the bulk power system with control technologies installed in the distribution network. There may be synergies between these elements that can be exploited for more robust operation of the entire system. Opportunities for improving overall electric grid performance include: advances in high-voltage direct current transmission, expanding the use of existing transmission corridors, greater deployment of communications and information technologies, and evolving wholesale markets. One example of a technological change that both planners and grid operators must account for is the need for faster system dynamics in regions experiencing an increase in variable renewable energy — both distributed and utility-scale — or increased demand response capacity. To help better respond to real-time changes in the grid, including regions where variable wind and solar generation is growing, but for other reasons as well, operators of the bulk power system have been moving to dispatch generation and coordinate transmission with dispatch intervals that are less than the traditional hour or 30 minutes. Operators of the bulk power system in some regions now dispatch in 5 minute intervals. New technologies and computational methods to allow even faster dispatch and scheduling may be needed should future grid conditions evolve to make even shorter dispatch intervals advantageous. QER 1.2 will explore a number of key grid operations and planning questions focusing on system reliability and security, the implications of a hybrid generation system, and policies that can catalyze advances in monitoring and controls to increase resilience, improve environmental performance and reduce costs. Markets and Finance Are Key to Electricity System Modernization Investments in power system asset replacement; connecting new sources of electricity to demand centers; upgrading for resilience, efficiency and consumer choice; and reducing carbon and other emissions are central to modernizing the power system and meeting key energy security, economic and environmental goals. Large capital costs, long lifetimes, and largely private-ownership of electricity assets all create barriers to investment in energy infrastructure.

8
The types and levels of investments are strongly influenced by regulatory structures and asset ownership model. The following discussion mainly concerns investor-owned utility (IOU) investments. Investment profiles for electricity infrastructure occupy a continuum from low-risk-and-return to high-risk-and-return projects, and vary as a function of the degree of market regulation, industry structure, technology trends, and regional differences. At one end, traditional IOUs that provide generation or distribution services to consumers use well-established infrastructure financing structures overseen by a stable regulator. This oversight is often known as “cost of service” (COS) regulation, where the regulator determines the total amount that must be collected in electricity rates for the utility to recover its costs and earn a reasonable return. At the higher-risk end of spectrum, merchant projects without a guaranteed customer base are free to seek market-based prices. Although riskier, these projects can offer a higher return. There are states that have a restructured market for electricity at the wholesale and retail level, while there are other states that still function under the old vertically integrated construct. Some states are embedded in Independent System Operators (ISO) with wholesale markets, but have limited or no retail choice. Some regions have elements of both restructured markets and traditional utility structures, and can thus be described as “hybrid”. In short, there is a patchwork of rate and regulatory mechanisms and structures that govern electricity markets and the associated investments in the maintenance, expansion and modernization (see Figure 3) of the system. These complexities, on top of those associated with innovation and the introduction of new technologies, may add barriers to investment. These barriers and policies to reduce them will be a key focus of QER 1.2. Appropriate Valuation of Goods and Services Needed for Transformation New technologies, consumer demands, reliability, security, and resilience concerns and state, local and Federal policies are drivers of the need to appropriately value a range of services not necessarily reflected in current electricity rates. The appropriate and accurate system-wide valuation of all energy assets and services – which should be but are not always reflected in power prices – is critical to modernizing and transforming the electric grid. New technologies such as DER, fuel cells, storage, and intelligent grid equipment can provide a suite of services that have been traditionally provided by conventional generations, including energy and
Figure 3. Centrally organized wholesale electricity market regions, i.e. centrally organized RTO/ISOs. Outside of these regions, wholesale electricity markets are bilateral. Note a region may include multiple, overlapping entities, e.g. public power, co-ops, IOUs, IPPs and Federal entities. Different regions may have different market structures for wholesale generation, including centrally organized markets, traditional vertically integrated structures, or a combination of the two (i.e. hybrid). Source: Federal Energy Regulatory Commission 2016
9
ancillary services, and can also help meet societal goals like minimizing environmental impacts. Determining the costs and benefits of deploying these technologies may be difficult due to lack of data or appropriate cost-benefit models, which can lead to unclear market signals. Conventional generators (e.g., nuclear power generators), are concerned about variable renewables and markets that value near-term generation over capacity and are increasingly attuned to valuation issues. Environmental externalities like criteria pollutants, GHGs, and water may or may not be reflected in rates. Rates also may not reflect the costs of siting delays associated with building transmission lines. There are barriers to end-use efficiency investments because building owners and renters have different financial incentives for efficiency improvements. As investments in new assets are made, and as policies and grid operations evolve, they should reflect the true costs and benefits of multiple system attributes. Such a challenge can be especially acute when introducing new technologies like grid-scale battery storage or distributed energy resources, given that many of the costs and benefits of the services these technologies can provide may be rapidly changing or not fully understood. Desirable attributes will range widely, and include reliability, resilience, load management, and environmental performance. Major Elements of the Electricity System As with the first installment, QER 1.2 will catalog the current state and key trends of the individual elements of the electricity system. Key individual elements—generation, transmission, distribution, grid operations and planning, and end use—are described below.
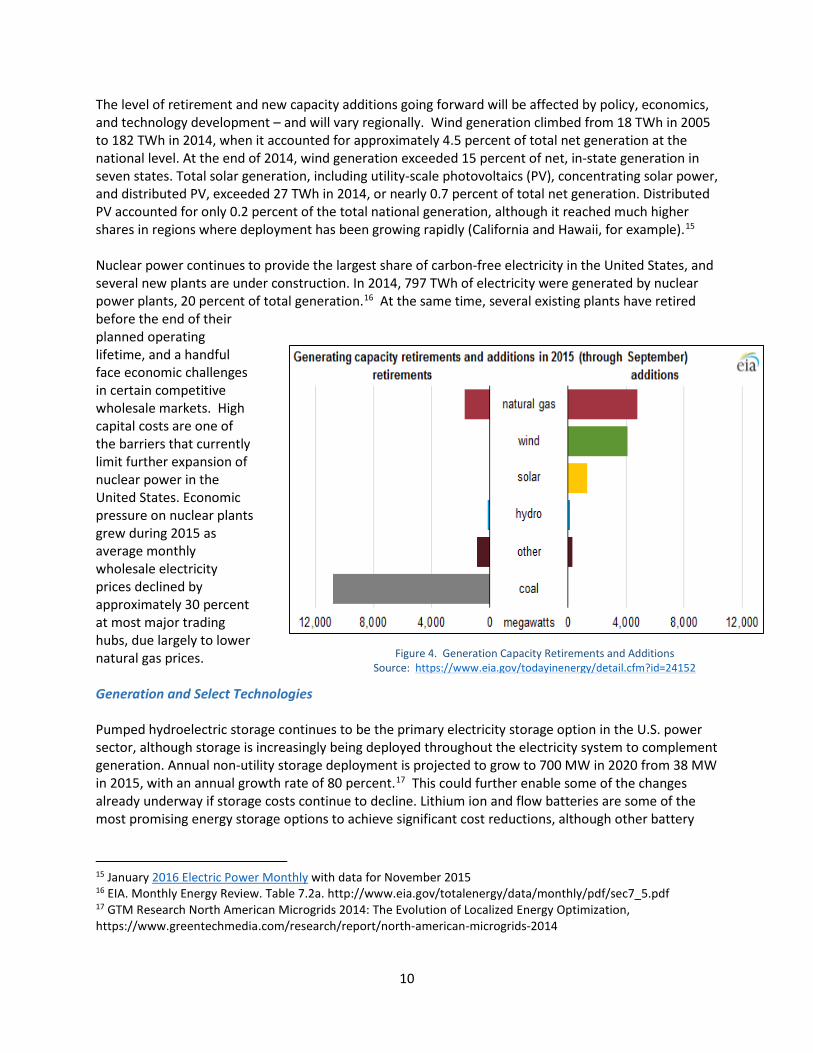
Generation Diversity is a hallmark of the U.S. generation fleet with notable regional differences in the technologies, market designs, policies, and grid operators that contribute to the provision of electricity services. The vintage of existing power generation capacity, the regional nature of that capacity, and the rate of both retirements and of new installed capacity suggest the need for thoughtful, analytically derived policies to address a range of issues. Total net electricity generation in the United States peaked in 2007 at 4156 TWh. Since the recession ended, it has grown slowly, with roughly 0.5 percent annual growth rates in 2013 and 2014.13 Generation Mix As noted, natural gas and renewables have recently dominated capacity additions. Natural gas generation has also exceeded generation from coal for 5 of the first 10 months of 2015. This is the first year gas generation has ever exceeded coal on a monthly basis. On the flip side, net coal generation has also declined by 27 percent between its peak in 2007 (2016 terawatt-hours (TWh)) and 2014 (1582 TWh); in the first 10 months of 2015, coal generation declined by an additional 13 percent compared to the same period in 2014. Coal generators have also led all other types of generation technologies in retirements, with almost 10,000 megawatts retired in the last year alone.14 Figure 4 indicates both retirements and additions to the electrical grid during 2015. 13 EIA. Monthly Energy Review. Table 7.2a. http://www.eia.gov/totalenergy/data/monthly/pdf/sec7_5.pdf 14 Kuykendall, Taylor. SNL Financial. December 31, 2015. https://www.snl.com/interactivex/article.aspx?id=34943832&KPLT=6
10
The level of retirement and new capacity additions going forward will be affected by policy, economics, and technology development – and will vary regionally. Wind generation climbed from 18 TWh in 2005 to 182 TWh in 2014, when it accounted for approximately 4.5 percent of total net generation at the national level. At the end of 2014, wind generation exceeded 15 percent of net, in-state generation in seven states. Total solar generation, including utility-scale photovoltaics (PV), concentrating solar power, and distributed PV, exceeded 27 TWh in 2014, or nearly 0.7 percent of total net generation. Distributed PV accounted for only 0.2 percent of the total national generation, although it reached much higher shares in regions where deployment has been growing rapidly (California and Hawaii, for example).15 Nuclear power continues to provide the largest share of carbon-free electricity in the United States, and several new plants are under construction. In 2014, 797 TWh of electricity were generated by nuclear power plants, 20 percent of total generation.16 At the same time, several existing plants have retired before the end of their planned operating lifetime, and a handful face economic challenges in certain competitive wholesale markets. High capital costs are one of the barriers that currently limit further expansion of nuclear power in the United States. Economic pressure on nuclear plants grew during 2015 as average monthly wholesale electricity prices declined by approximately 30 percent at most major trading hubs, due largely to lower natural gas prices. Generation and Select Technologies Pumped hydroelectric storage continues to be the primary electricity storage option in the U.S. power sector, although storage is increasingly being deployed throughout the electricity system to complement generation. Annual non-utility storage deployment is projected to grow to 700 MW in 2020 from 38 MW in 2015, with an annual growth rate of 80 percent.17 This could further enable some of the changes already underway if storage costs continue to decline. Lithium ion and flow batteries are some of the most promising energy storage options to achieve significant cost reductions, although other battery
15 January 2016 Electric Power Monthly with data for November 2015 16 EIA. Monthly Energy Review. Table 7.2a. http://www.eia.gov/totalenergy/data/monthly/pdf/sec7_5.pdf 17 GTM Research North American Microgrids 2014: The Evolution of Localized Energy Optimization, https://www.greentechmedia.com/research/report/north-american-microgrids-2014
Figure 4. Generation Capacity Retirements and Additions
Source: https://www.eia.gov/todayinenergy/detail.cfm?id=24152

11
types are also being developed and could achieve breakthroughs. Distributed storage is projected to capture over the half of the storage market by 2020.18 Carbon capture and storage (CCS) is a key technology for both fossil and biomass power generation options. Technology uptake for CCS in the power sector has been slow but EPA’s recent GHG standards for power plants provide a driver for CCS. Coal currently supplies about 40 percent of global electricity demand, and CCS is a way to reduce carbon emissions from some of these generators.19 CCS could be integrated into existing coal plants if costs decline sufficiently or market signals for carbon mitigation increase. Successful development of CCS would allow greater diversity of generation options around the world and lower portfolio risk. Continued growth in diverse clean electricity deployment will may depend on advances in new materials and physical/chemical processes, modeling and simulation, techno-economic analysis, embedded information and communications technology, and understanding of system interactions. Additionally, the non-hardware, or “soft” costs related to permitting, installation, and maintenance still account for more than half of the cost of an installed rooftop solar array.20 Significant improvements are needed in some technologies if they are to compete in the market and contribute to a diverse portfolio of generation options. Energy efficiency improvements are impacting the overall supply-demand balance in the United States. Advances in the efficiency of providing residential, commercial, transportation and industrial energy services have reduced the need for new energy additions, saved money for consumers, improved security, and reduced overall environmental impacts. Advances in lighting, heating and cooling, distributed generation, electricity storage, transportation, and grid-enabled technologies have given consumers greater control of their energy use and lower overall energy consumption. Finally, greater awareness and intelligence embedded in the electricity system through expanded use of information and communication technologies allows more control in how energy is generated, stored, and used among consumers, although it also highlights physical and cyber security concerns.
Transmission Electricity generators send electrical currents through over 642,000 miles of high voltage transmission lines creating the backbone of the U.S. power grid. Transmissions systems have historically linked dispersed bulk power generators together to form reliable and economic networks that serve local distribution systems. High-voltage transmission lines can more easily accommodate two-way flows of electricity than the distribution network. The number of circuit miles added to the Nation’s transmission networks has also been rising in recent years, but new line construction accounts for just slightly more than half of total investments. Non-line investments—including station equipment, fixtures, towers and undergrounding lines—were increasing even during the lowest period of circuit miles construction from 1997 to 2012.
18 GTM Research North American Microgrids 2014: The Evolution of Localized Energy Optimization, https://www.greentechmedia.com/research/report/north-american-microgrids-2014 19 International Energy Agency (2016). Coal. http://www.iea.org/topics/coal/ 20 http://energy.gov/eere/success-stories/articles/challenge-accepted-reducing-soft-costs-going-solar
12
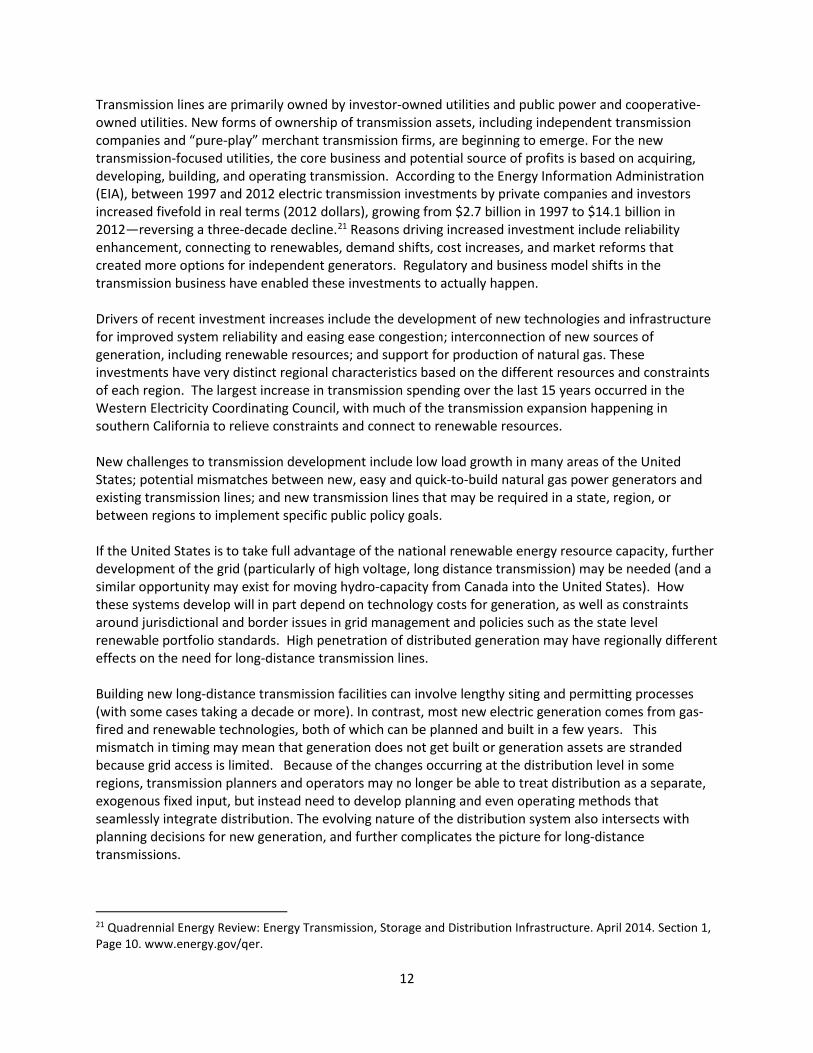
Transmission lines are primarily owned by investor-owned utilities and public power and cooperative-owned utilities. New forms of ownership of transmission assets, including independent transmission companies and “pure-play” merchant transmission firms, are beginning to emerge. For the new transmission-focused utilities, the core business and potential source of profits is based on acquiring, developing, building, and operating transmission. According to the Energy Information Administration (EIA), between 1997 and 2012 electric transmission investments by private companies and investors increased fivefold in real terms (2012 dollars), growing from $2.7 billion in 1997 to $14.1 billion in 2012—reversing a three-decade decline.21 Reasons driving increased investment include reliability enhancement, connecting to renewables, demand shifts, cost increases, and market reforms that created more options for independent generators. Regulatory and business model shifts in the transmission business have enabled these investments to actually happen. Drivers of recent investment increases include the development of new technologies and infrastructure for improved system reliability and easing ease congestion; interconnection of new sources of generation, including renewable resources; and support for production of natural gas. These investments have very distinct regional characteristics based on the different resources and constraints of each region. The largest increase in transmission spending over the last 15 years occurred in the Western Electricity Coordinating Council, with much of the transmission expansion happening in southern California to relieve constraints and connect to renewable resources. New challenges to transmission development include low load growth in many areas of the United States; potential mismatches between new, easy and quick-to-build natural gas power generators and existing transmission lines; and new transmission lines that may be required in a state, region, or between regions to implement specific public policy goals. If the United States is to take full advantage of the national renewable energy resource capacity, further development of the grid (particularly of high voltage, long distance transmission) may be needed (and a similar opportunity may exist for moving hydro-capacity from Canada into the United States). How these systems develop will in part depend on technology costs for generation, as well as constraints around jurisdictional and border issues in grid management and policies such as the state level renewable portfolio standards. High penetration of distributed generation may have regionally different effects on the need for long-distance transmission lines.
Building new long-distance transmission facilities can involve lengthy siting and permitting processes (with some cases taking a decade or more). In contrast, most new electric generation comes from gas-fired and renewable technologies, both of which can be planned and built in a few years. This mismatch in timing may mean that generation does not get built or generation assets are stranded because grid access is limited. Because of the changes occurring at the distribution level in some regions, transmission planners and operators may no longer be able to treat distribution as a separate, exogenous fixed input, but instead need to develop planning and even operating methods that seamlessly integrate distribution. The evolving nature of the distribution system also intersects with planning decisions for new generation, and further complicates the picture for long-distance transmissions.
21 Quadrennial Energy Review: Energy Transmission, Storage and Distribution Infrastructure. April 2014. Section 1, Page 10. www.energy.gov/qer.
13
Distribution
The retail power distribution industry today is made up of roughly 3,000 utilities organized under two primary management structures: the IOU and the customer-owned utility (COU). Within the COU category there are utilities organized under municipalities, rural cooperatives, and utilities formed as municipal corporations under state law that are not cities per se, such as public utility districts in Oregon and Washington and irrigation districts in California. Although other entities may be engaged in the sale of electricity to retail customers, these utilities provide virtually all distribution service to deliver retail electricity purchases.
Historically, distribution systems have served a critical but limited role: delivering power from the bulk power system to customers’ power meters within standard voltage ranges. New technologies and changing consumer expectations are introducing new demands on distribution systems. End users can now interact with the bulk power grid to provide energy and ancillary services that would otherwise come from central generation. Distribution circuits are increasingly experiencing two-way flow of electricity (from distributed generation) and information (from new types of sensors and communication systems), both of which create new opportunities for improved grid performance but also uncertainties in grid operation.
Although electricity distribution utilities in the United States are organized under a mix of private and public ownership, all of them follow principles that evolved early in the industry’s history to ensure the public’s interest was served by monopoly utility companies. This regulatory compact legally binds IOUs and regulators into a partnership based on reciprocal obligations and provides a powerful voluntary contract between COUs (most of whom are not regulated by state authorities) and their customers. This utility/regulatory model is unlike other commercial relationships because it is able to incorporate the public’s interest in utility obligations while assuring utilities adequate compensation.
The primary benefit of this structure in the early years of the 20th century was to guarantee that utilities would be repaid for investment in expanding electricity service to customers without access and that electricity rates would be reasonable. In the last part of the century, this regulatory compact was used to provide enhanced public benefits including energy efficiency, clean energy, and facilitation of energy production by customers in the form of distributed generation. Distribution assets are a significant fraction of a utility’s infrastructure investment and operating expense; therefore, cost minimization is essential to keep retail rates at reasonable levels. This is reflected in differences in how distribution systems are planned, constructed, built and rebuilt, and maintained across rural, urban, and suburban utility service areas. Utilities and Regulatory Frameworks IOUs are organized as for-profit corporations subject to further regulation of electricity rates according to the laws of the states where they serve retail customers. IOUs are larger than all but the very largest municipal utilities. The majority of U.S. electricity customers are provided with retail delivery service by IOUs. COUs serve smaller customer bases than IOUs (roughly 1,000 very small with annual sales under 100,000 MWh). COUs are broken into two categories municipal utilities and rural electric cooperatives. COUs are governed by the retail customers they serve through elected governing bodies, be they municipalities, counties, or service districts. Both are organized under applicable state corporation regulations or equivalent authority. Most states allow COUs to establish rates without state oversight.

14
Regulation of utilities at the state level means utilities can be agents of public policy as well as energy providers. It also means consumer access to beneficial programs varies from state to state. However, utility actions are not confined to one state because they are interconnected through a web of transmission lines tied to generators using a diversity of regional energy sources. Those interstate relationships are governed by Federal regulations. Utility adoption and use of advanced grid technologies – including physical components, grid monitoring software, and grid management tools – varies by utility type and size. Utilities will adopt a range of business models, from a wires-only utility that maintains only the physical structure of the grid to a vertically-integrated utility that owns the entire generation and distribution infrastructure to deliver electricity to its customers, or something in between. Energy efficiency and distributed generation deployed by electric utility customers can reduce overall demand for utility-provided electricity. Debates over the benefits that customers provide the system and equitable allocation of the costs of system maintenance and improvements are playing out across the country. These debates have prompted regulators, legislators, and utilities to consider the role and structure of the distribution utility as the grid evolves. Regulated Utility Industry Structure and Financing As shown in Figure 5, multiple types of private and public entities deliver final power to the end-user. While the total number of entities is dominated by publicly and cooperatively owned electric utilities, investor-owned utilities account for the majority of total customers, sales, and delivered power. A relatively small number of private entities (47 parent companies controlling 240 subsidiaries22) is responsible for about 55 percent of electricity sales23 and finances the largest fraction of electric infrastructure at over $92 billion dollars in 2013 alone.24 Of all the capital expenditures for IOUs, electricity transmission and distribution infrastructure accounts for almost half of annual investments. Cost-of-service regulation allows regulated asset owners to recover their capital and operations/maintenance costs 22 Edison Electric Institute, “U.S. Member Company Service Territories,” updated August 2014 23 Energy Information Administration, Sales (consumption), revenue, prices & customers, March 2014 24 SNL Financial, “Capital Expenditure Update: November 2013,” November 8, 2013
Figure 5. Fraction of retail power sales by supplier in 2013. Source: American Public Power Association, “U.S. Electric Utility Industry Statistics,” 2015

15
plus a margin as measured by the Return on Equity (ROE). The ROE is set in a general rate case hearing, where a public utility commission balances the need for new spending against the public objective to minimize rates. There has been a slow but steady decrease in the average authorized ROE from approximately 13 percent in 1990 to today’s value of approximately 10 percent,25 which reflects the underlying drop in treasury rates. Current low interest rates have reduced infrastructure financing costs to a level that is lower today than at any other time in recent history. Financing is typically accessed through the public debt and equity markets, based on the utility balance sheet or project specific revenue sources. As mentioned in the prior section, IPP’s (or merchant) power generation play a critical role in restructured markets, and the financing of these projects are discussed in the next section. Non-IOU utilities do not have the IOU obligation to shareholders, yet their financing shares similarities to cost-of-service regulation. There are over 828 municipal electric utilities and 20 state utilities that constitute the public electric utility sector.26 Municipal and state utilities typically finance energy infrastructure through general obligation or revenue bonds. Rural electric cooperatives (RECs) are consumer-owned utilities that were established to bring electricity to rural areas. Sources of finance include the Rural Utility Service, National Rural Utilities Cooperative Finance Corporation and the National Cooperative Services Corporation. Since the Tennessee Valley Authority (TVA) Act of 1933,27 the Federal government has taken a direct role in the power sector in certain regions of the country. Along with TVA, the Department of Energy’s four Power Marketing Administrations (PMAs) - the Bonneville Power Administration (BPA), the Western Area Power Administration (WAPA), the Southeastern Power Administration (SEPA), and the Southwestern Power Administration (SWPA) – market and distribute hydroelectric power produced at Federal dams. PMA power-related capital projects can be financed through funds borrowed from the U.S. Treasury, appropriated funds, or customer funding. Distribution Infrastructure and Technology Traditional distribution system functions and physical architectures that enable passive one-way kilowatt-hour (kWh) delivery from central power plants to end-use customers are not adequate for future needs. New technologies and changing consumer expectations are introducing new demands on distribution systems, and increasingly, end users are interacting with the bulk power grid to provide energy and ancillary services that would otherwise come from central generation. This creates new opportunities for improved grid performance but also uncertainties in grid operation.
Planners and grid operators must account for faster system dynamics in regions experiencing increasing variable renewable energy or increased demand response capacity. In organized energy markets in the United States, regional system operators dispatch generation and coordinate transmission with dispatch intervals measured in minutes. However, in areas with high wind and solar deployment, grid dynamics may require management at speeds in the range of a second.
Changes to power system operations and markets can provide significant flexibility, often at lower economic costs than building new transmission infrastructure. Examples include more frequent dispatch (which reduces the time frame over which a generator must maintain a specified output level), smart
25 Stephen G. Hill, “What is ROE and Why Does it Matter,” 2013 26 U.S. Department of Energy. Memo to members of the Public on the Quadrennial Energy Review. October 8, 2014.
16
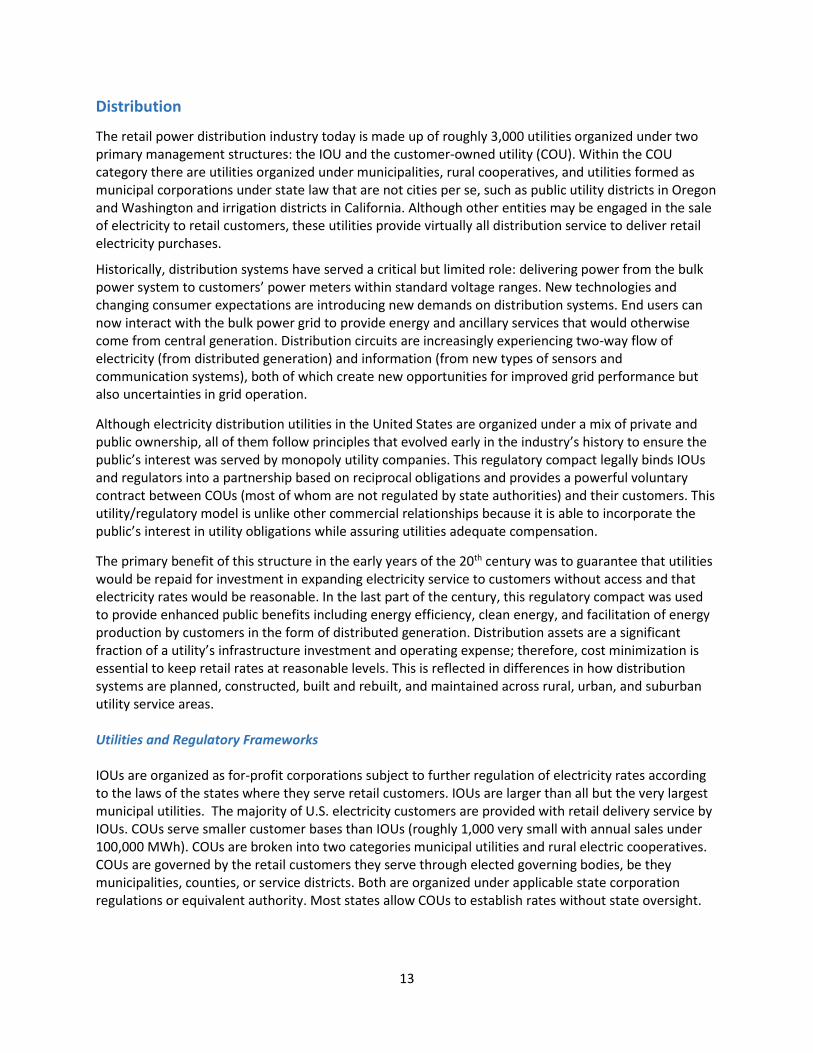
network technologies (Figure 6), which can minimize bottlenecks and optimize transmission usage, increased plant cycling, and demand response. Transmission and distribution planners and operators can use this information to employ the most reliable and cost-effective flexibility options – and consider building new generation and transmission or turning to other options like demand response or bigger balancing areas. Advanced metering infrastructure (AMI) enables operators to measure and record electricity usage data from 5-minute to monthly intervals, and provide
usage data at least daily to energy companies and may also provide data to consumers. Data are used for billing and other purposes. Advanced meters include basic hourly interval meters and extend to real-time meters with built-in two-way communication capable of recording and transmitting instantaneous data. Home area networks (HAN), a subset of AMI, consist of software and hardware that permits the HAN to monitor energy use and to communicate with devices within a customer’s premises. Smart meters enable a variety of dynamic pricing programs, also known as time-based rate programs, which are designed to modify patterns of electricity usage, including the timing and level of electricity demand. The location of resources on the grid has also gained importance in distribution planning and grid operations. Planners must consider how and where to deploy new technologies and potentially even new structures for control systems, i.e. supplementing centralized controls with control technologies installed within the distribution network. Microgrid capacity is projected to grow from 1.2 gigawatts (GW) today to 2.9 GW by 2020, with the most capacity in military installations and university/research facilities. In some cases, future development may be in concert with utility modernization efforts. Several larger projects at the 30 MW to 200 MW are planned in New York.28 While they are still a very small fraction of overall generation, distributed energy resources are being rapidly deployed and is forecast to further increase over time.
End Use The electric meter has traditionally been viewed as the end of the electricity system, the final node in a utility’s network of wires, sensors, generators, and controls. However, what happens on the consumer side of the meter, from efficiency improvements to demand response to distributed generation, is now more than ever bringing the consumer into the electricity system. QER 1.2 will include significant analyses of end-use infrastructure and services, as well as examining how the changing nature of supply 28 Saadeh, Omar. 2015. “ Microgrids Flourishing in Spite of Regulatory Barriers.” Greentech Media, August 27. http://www.greentechmedia.com/articles/read/microgrids-flourishing-in-spite-of-regulatory-barriers
Figure 6. Smart meter deployment. As of July 2014, 50 million smart meters were deployed in the United States, covering 43 percent of U.S. homes. Source: Institute for Electric Innovation 2014
17
and demand, including the role of new market entrants like aggregators, challenge traditional jurisdictional lines. Industrial Sector While demand growth is virtually flat, productivity (as measured by units of GDP produced per unit of energy consumed) is growing. The industrial sector’s electricity productivity nearly doubled (96 percent growth) between 1990 and 2014.29 Projections suggest that grid-purchased electricity will rapidly increase in this sector from 2010 until 2025, after which growth is anticipated to slow to 2040, when it reaches 1,338,061 million kWh (26 percent above the 2010 level).30 Motor-driven systems are identified as the largest electricity end-use consumption category in the manufacturing sector. Moreover, a significant percentage of motor-driven system efficiency opportunities are in design of the systems, rather than the motors themselves.3132 Self-generation remains a small portion of total end-use electricity although its growth is projected to be faster than the growth in grid-purchased electricity. Self-generation reaches 175,655 million kWh (68 percent above its 2010 level) in 2040 and self-generation capacity is projected to be primarily (74%) within the chemicals, paper, and refinery subsectors.33 Fuel switching from fuel-driven to electricity-driven end-use infrastructure can lower facility site emissions and leverage increasing grid efficiencies and renewable resources.
Currently, many product demands across the non-industrial sectors are not explicitly captured in industrial energy demand models. Therefore, performing life-cycle analysis of these products is challenging and time consuming. Commercial Sector Electricity consumption in the commercial sector has been increasing since 1992, consistent with increased use of conventional electrical equipment and the introduction of newer technologies in commercial buildings such as computers (PCs, work stations and servers), office equipment (printers, copiers and fax machines), telecommunications equipment, and medical diagnostic and monitoring equipment.34,35,36 Different end uses (as reflected by changes in technology) have seen different electric consumption trends (see Figure 7). End-use electricity in the commercial sector is projected to continue to increase by 0.8 percent annually from 2015 to 2040, a combination of a projected 1% increase in floor space per year and a 0.2% drop in electricity intensity (kwh per square foot of floor space).”37 29 EIA Annual Energy Outlook (2015). http://www.eia.gov/analysis/projection-data.cfm#annualproj. 30 DOE/EIA. Annual Energy Outlook 2015. http://www.eia.gov/analysis/projection-data.cfm#annualproj. 31 McKane, A. and A. Hasanbeigi, Assessing the Energy Efficiency Potential of Industrial Motor Systems. 2012. 32 Ahmed, G. and S. Tokuoka, U.S. Adoption of High-Efficiency Motors and Drives: Lessons Learned. 2010, Center on Globalization, Governance & Competitiveness, Duke University. 33 DOE/EIA. Annual Energy Outlook 2015. http://www.eia.gov/analysis/projection-data.cfm#annualproj 34 EIA, 2015b. “Electric Power Monthly”. United States Energy Information Administration. https://www.eia.gov/electricity/monthly/epm_table_grapher.cfm?t=epmt_1_1. 35 “How much electricity does an American home use?”, United States Energy Information Administration. https://www.eia.gov/tools/faqs/faq.cfm?id=97&t=3 36 Energy Information Administration [EIA]. 2003. Commercial Building Energy Consumption Survey (CBECS). http://www.eia.gov/consumption/commercial/data/2003/ 37 Energy Information Administration, “Annual Energy Outlook 2015,” April 2015, http://www.eia.gov/forecasts/aeo/pdf/0383%282015%29.pdf.

18
Technology exists to enable zero net energy buildings (ZEB, defined as a building that produces as much energy on-site as it consumes), and several examples have been built around the country. However, more widespread penetration of such buildings requires additional detailed information about actual occupancy, use, and as-built conditions, as well as advances in building energy modeling calibration. More accurate input data could come from enhanced measurement and monitoring capabilities through sensors and data collection or from measurement and verification for outcome-based building energy codes and outcome-based efficiency programs. In addition, more analysis is needed on the cost-effectiveness of new ZEBs considering an integrated package of energy efficiency measures, rather than the analysis of discrete measures. Programs that achieve energy efficiency savings through operational, behavioral, and energy auditing
activities are being pursued in some states. Often, market actors have imperfect information about the performance of energy-efficient technology and equipment, practices that can save energy, and cost effectiveness. Energy savings can be difficult to measure and separate by end-use. Further, more efficient devices typically cost more up- front, and businesses usually require a short payback period (e.g., one to two years), severely restricting opportunities to invest in more energy-efficient equipment. In addition, when energy costs are small relative to other costs, it is hard to get building owners to pay attention to energy efficiency. Finally, market barriers exist, such as split incentives between owners and operators. Residential Sector According to the EIA, residential electricity demand and consequently electricity-related emissions from power plants that
are attributable to residential electricity demand, rose steadily until 2005 and has been nearly flat since.
Figure 7. Trends in shares of electricity consumption by end-use from 1992 to 2012. Lighting, “Other,” cooling and ventilation make up 75 percent of total use, with a sharp drop in lighting share and large increase in other end-uses in the past 20 years. (Source: Energy Information Administration)
19
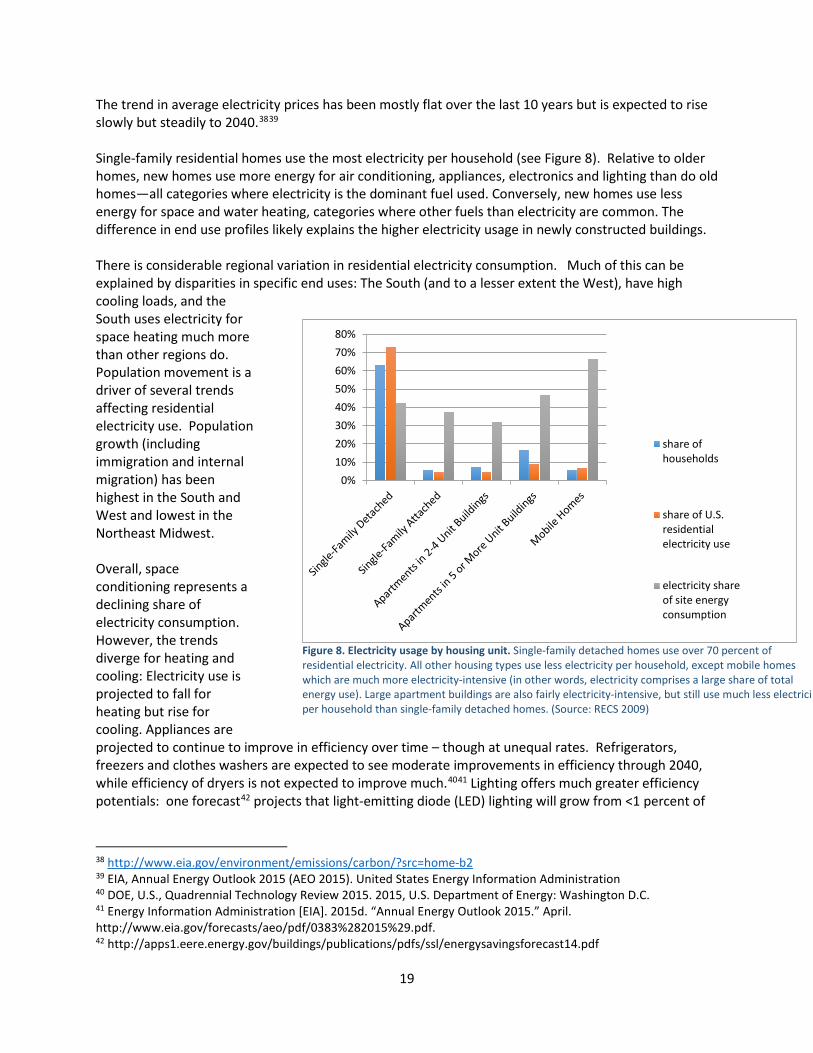
The trend in average electricity prices has been mostly flat over the last 10 years but is expected to rise slowly but steadily to 2040.3839 Single-family residential homes use the most electricity per household (see Figure 8). Relative to older homes, new homes use more energy for air conditioning, appliances, electronics and lighting than do old homes—all categories where electricity is the dominant fuel used. Conversely, new homes use less energy for space and water heating, categories where other fuels than electricity are common. The difference in end use profiles likely explains the higher electricity usage in newly constructed buildings. There is considerable regional variation in residential electricity consumption. Much of this can be explained by disparities in specific end uses: The South (and to a lesser extent the West), have high cooling loads, and the South uses electricity for space heating much more than other regions do. Population movement is a driver of several trends affecting residential electricity use. Population growth (including immigration and internal migration) has been highest in the South and West and lowest in the Northeast Midwest.
Overall, space conditioning represents a declining share of electricity consumption. However, the trends diverge for heating and cooling: Electricity use is projected to fall for heating but rise for cooling. Appliances are projected to continue to improve in efficiency over time – though at unequal rates. Refrigerators, freezers and clothes washers are expected to see moderate improvements in efficiency through 2040, while efficiency of dryers is not expected to improve much.4041 Lighting offers much greater efficiency potentials: one forecast42 projects that light-emitting diode (LED) lighting will grow from <1 percent of
38 http://www.eia.gov/environment/emissions/carbon/?src=home-b2 39 EIA, Annual Energy Outlook 2015 (AEO 2015). United States Energy Information Administration 40 DOE, U.S., Quadrennial Technology Review 2015. 2015, U.S. Department of Energy: Washington D.C. 41 Energy Information Administration [EIA]. 2015d. “Annual Energy Outlook 2015.” April. http://www.eia.gov/forecasts/aeo/pdf/0383%282015%29.pdf. 42 http://apps1.eere.energy.gov/buildings/publications/pdfs/ssl/energysavingsforecast14.pdf
Figure 8. Electricity usage by housing unit. Single-family detached homes use over 70 percent of residential electricity. All other housing types use less electricity per household, except mobile homes which are much more electricity-intensive (in other words, electricity comprises a large share of total energy use). Large apartment buildings are also fairly electricity-intensive, but still use much less electricit per household than single-family detached homes. (Source: RECS 2009)
0%10%20%30%40%50%60%70%80%
share ofhouseholds
share of U.S.residentialelectricity use
electricity shareof site energyconsumption
20
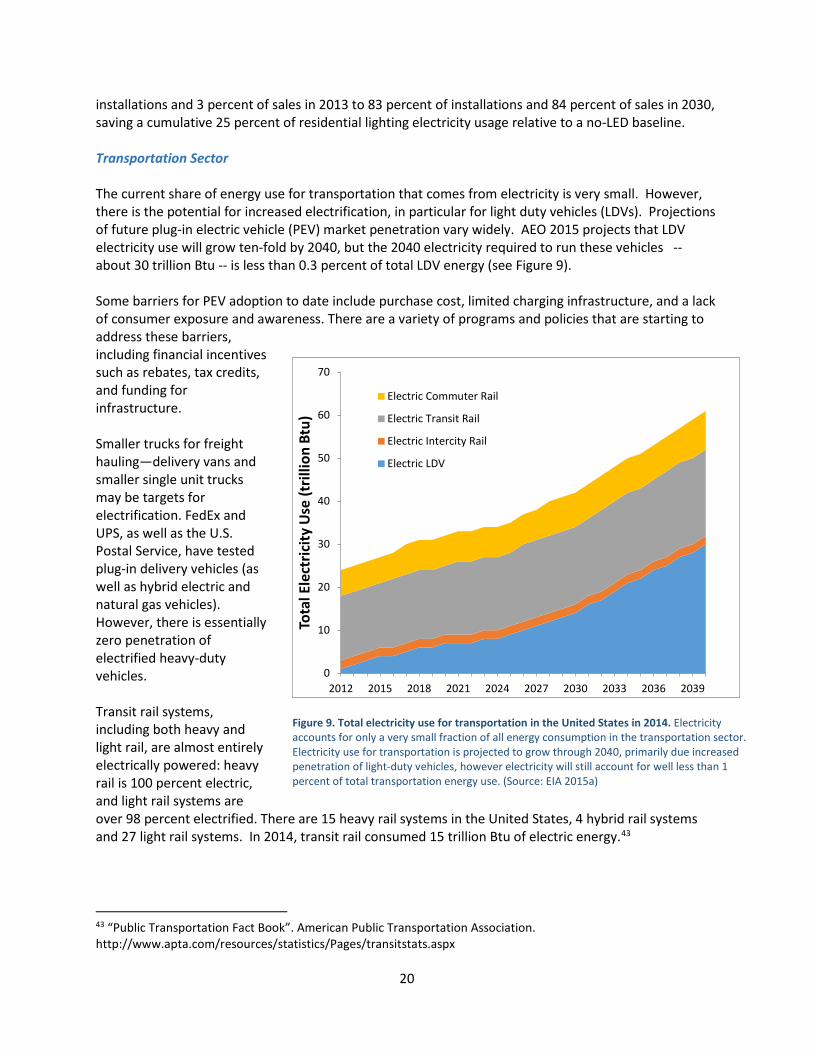
installations and 3 percent of sales in 2013 to 83 percent of installations and 84 percent of sales in 2030, saving a cumulative 25 percent of residential lighting electricity usage relative to a no-LED baseline. Transportation Sector The current share of energy use for transportation that comes from electricity is very small. However, there is the potential for increased electrification, in particular for light duty vehicles (LDVs). Projections of future plug-in electric vehicle (PEV) market penetration vary widely. AEO 2015 projects that LDV electricity use will grow ten-fold by 2040, but the 2040 electricity required to run these vehicles -- about 30 trillion Btu -- is less than 0.3 percent of total LDV energy (see Figure 9). Some barriers for PEV adoption to date include purchase cost, limited charging infrastructure, and a lack of consumer exposure and awareness. There are a variety of programs and policies that are starting to address these barriers, including financial incentives such as rebates, tax credits, and funding for infrastructure. Smaller trucks for freight hauling—delivery vans and smaller single unit trucks may be targets for electrification. FedEx and UPS, as well as the U.S. Postal Service, have tested plug-in delivery vehicles (as well as hybrid electric and natural gas vehicles). However, there is essentially zero penetration of electrified heavy-duty vehicles. Transit rail systems, including both heavy and light rail, are almost entirely electrically powered: heavy rail is 100 percent electric, and light rail systems are over 98 percent electrified. There are 15 heavy rail systems in the United States, 4 hybrid rail systems and 27 light rail systems. In 2014, transit rail consumed 15 trillion Btu of electric energy.43
43 “Public Transportation Fact Book”. American Public Transportation Association. http://www.apta.com/resources/statistics/Pages/transitstats.aspx
Figure 9. Total electricity use for transportation in the United States in 2014. Electricity accounts for only a very small fraction of all energy consumption in the transportation sector. Electricity use for transportation is projected to grow through 2040, primarily due increased penetration of light-duty vehicles, however electricity will still account for well less than 1 percent of total transportation energy use. (Source: EIA 2015a)
0
10
20
30
40
50
60
70
2012 2015 2018 2021 2024 2027 2030 2033 2036 2039
Tota
l Ele
ctric
ity U
se (t
rillio
n Bt
u)
Electric Commuter Rail
Electric Transit Rail
Electric Intercity Rail
Electric LDV
21
Framing Questions for QER 1.2 It is clear from this discussion that the electricity system is both complex and changing rapidly. QER analytical work will be designed to address a long list of questions about end use, grid operations, generation, markets and valuation, jurisdictions, environmental protection and impacts, financing, innovation, resilience, security, workforce development, and North American integration. The following set of questions is provided as a starting point for such a list. Stakeholders are invited to both provide their own views on key issues to be addressed, as well as to respond to any or all of the following questions in their comments. Additional insights and recommendations for Federal action to address challenges and opportunities associated with modernizing the Nation’s electricity system are warmly welcomed. All comments can be uploaded at www.energy.gov/qer or submitted to [email protected] from February 4th to July 1st, 2016.
Generation Portfolio, Reliability, Supply Chains, and Equity • What is the evolution of the generation portfolio? • What are U.S. reserve margins? What is the availability and need for backup power? • What policies can be put in place to increase access to rural, low-income communities, and remote
communities?
Distributed Energy Resources (DER): Demand Response, Distributed Generation and Distributed Energy Storage • How should DER value streams be assessed from different perspectives—customer, utility and
society? • What are the major barriers to distributed generation deployment, including financial, technical,
transactional and distribution system limitations? • What policies and regulations enable demand response to support variable energy resources at
utility scale?
Grid Operations and Planning • How do different system architectures facilitate or inhibit efficient grid evolution? • What lessons from international experiences with grids operating at high penetration levels of
variable energy resources can be translated to U.S. system operations? • What are the implications of having a hybrid generation system – a mix of centralized and
distributed resources – on the grid?
Electricity Consumption and Energy Efficiency by Sector (residential, commercial, industrial, transportation) Status, Trends and Barriers • What levels and patterns of electricity consumption exist today and are forecasted for 2040 in the
industrial, commercial, residential and transportation sectors? • What business models and methods of customer engagement have been most successful, or show
the most promise, for deploying residential efficiency measures? What is the role of policy in facilitating these models and methods?
Electricity Markets • What frameworks and metrics can characterize regional markets and degree of market regulation?
How have markets performed across different criteria since restructuring? • How can policy levers be employed to remove barriers in each type of market to facilitate policy
goals?
22
• Are there barriers to cleaner and more efficient generation given cost of capital differences?
Electricity Finance • How sensitive are costs to inputs (commodity prices, construction costs, technology costs)? • How do costs change under alternate financial scenarios (interest/debt/capital)? • What are the end user cost distributions under alternate DG/centralized scenarios?
Electricity Valuation • How are uncertainty and risk taken into account under electricity valuation practices? • What value streams do electricity technologies provide to the system that are or are not monetized
(and to which stakeholders do they accrue)? • Do grid operators and policymakers manage tradeoffs among value streams?
Innovation and Technology • What are the government, industry, and investor roles across the clean energy innovation
spectrum? • How has technology innovation enabled policy changes (e.g. FERC rules)? • What level of innovation is required to prudently ensure availability of clean energy capabilities to
meet 2030 and 2050 goals, focusing on the electricity sector, e.g. baseload, storage?
Jurisdiction and Regulations • How did existing jurisdictional boundaries and policies evolve? What are the authorities for
oversight of the electricity system? What are the responsibilities vested at each level? What policy levers that exist at each level that may be challenged by the growing blurring of jurisdictional lines?
• Distribution-level planning is becoming increasingly important: DER requires utility planners to achieve better integration of transmission planning and distribution planning and coordination between the Feds and the states. How do wholesale and retail markets complement each other (from a jurisdictional perspective)?
Environment • What are potential generation pathways for meeting climate goals in the short, medium, and longer
term? • How do the interconnected flows of energy and water compare across states? How are these
changing over time? How are potential impacts to water quality changing over time? What are the key environmental justice issues that are related to the electric power sector and what policy measures should be taken to minimize impacts to EJ communities?
• What are the key environmental issues that arise in the context of electric infrastructure siting and what policy measures should be taken to minimize these impacts?
Resilience • What strategies and methods are available to improve the resilience of the electricity system, and
how do alternative approaches compare on benefits, costs, and performance? • How can system resilience be maintained in the face of evolving trends and changing conditions, i.e.,
increased consumer choice, DER, smart grids, climate change, regional migration, fuel diversity? • What is the role of the insurance industry?
23
Physical and Cyber Security • What are the key threats, vulnerabilities, risks and consequences associated with cyber and physical
attacks on electricity systems, especially ICS? How can the United States address the threat of EMPs to the grid?
• Have system owners and operators incorporated physical security measures in response to terrorist attacks? How do utilities view cyber threats, e.g. in response to NIST’s framework and NERC’s cybersecurity standards?
• As the economy is increasingly electrified (including DER), do cyber and physical vulnerabilities change?
North American Integration • Are there barriers or constraints for continuing integration with Canada’s electricity sector? How will
new transmission be handled? • Mexico’s electricity sector is less extensively integrated with the United States. Integration is not a
current reality, but an objective. How does an analysis of the Canadian border inform policies with Mexico?
• For Canadian hydropower to backstop U.S. electricity, what are the constraints and opportunities?
Employment and Workforce Development • What are workforce skills and requirements in context of evolving technology and the environment Stakeholder Engagement The 2014 Presidential Memorandum establishing the QER notes the importance of a robust stakeholder engagement process to inform the QER’s insights and recommendations: “…non-Federal actors are crucial contributors to energy policies. Because most energy and related infrastructure is owned by private entities, investment by and engagement of the private sector is necessary to develop and implement effective policies. State and local policies; the views of nongovernmental, environmental, faith-based, labor, and other social organizations; and contributions from the academic and non-profit sectors are also critical to the development and implementation of effective energy policies.”44 The stakeholder engagement process for the second installment of the QER will be very similar to the extensive outreach efforts conducted for QER 1.1. The DOE, as the Secretariat for QER 1.2, will coordinate stakeholder outreach, including formal public meetings, technical workshops, stakeholder briefings, one-on-one meetings, and an online comments portal. Information on how to provide input to the QER can be found online at www.energy/qer. Formal stakeholder meetings will also be posted in the Federal Register. The formal stakeholder engagement process for the QER will include a meeting in Washington DC, followed by a series of meetings in locations around the country to solicit input and foster public dialogue about the QER. The locations of the meetings will provide for full consideration of the geographical diversity of electricity systems, including: resource mix; history of regional electricity development; market operation; prevalence of investor owned, public power and rural coop utilities; levels of industrial activity; relative interest between states in regional cooperation; urban-rural balance;
44 https://www.whitehouse.gov/the-press-office/2014/01/09/presidential-memorandum-establishing-quadrennial-energy-review, accessed December 30, 2015.

24
existing renewable and efficiency mandates; Federal footprint; involvement in carbon market(s); regulated vs. deregulated environment; and various other factors. These meetings will include a series of three discussion panels moderated by a professional facilitator and an open microphone session for audience input. The Administration encourages public participation in these meetings. If you are unable to participate in the formal stakeholder meetings, please submit your comments online at www.energy.gov/qer or by emailing them to [email protected] .