qi macros user guide (pdf) - qi macros for excel
TRANSCRIPT
© 2018 Jay Arthur QI Macros
User Guide Table of ContentsInstallation 1Overview 3
Creating Charts 5Data Format & Selection 6Chart Tab 7
Wizards 8Data Mining Wizard 9Chart Wizard 10Control Chart Wizard 11Statistics Wizard 12PivotTable Wizard 13
Capability and Improvement 14Pareto Chart 14Scatter Plot 15Matrix Plot 15Box and Whisker 16Multivari Chart 16Histogram 17
Control Charts 19c, np, p, and u Control Charts 19X and R Control Charts 20Specialized Control Charts 21Control Chart Dashboards 22
Control Chart Features 23Control Chart Stability Rules 23Create Stair Step Limits 23QI Macros Chart Menu 24
Excel Charts 26Fill-in-the-Blank Templates 27
Control Chart Templates 28Fishbone (Ishikawa) Diagram 29Value Stream Map 31Gage R&R 32Design of Experiments (DOE) 33
Statistical Tools 34Data Mining Tools 35Installation Troubleshooting 36Other Resources 37
© 2018 Jay Arthur QI Macros1
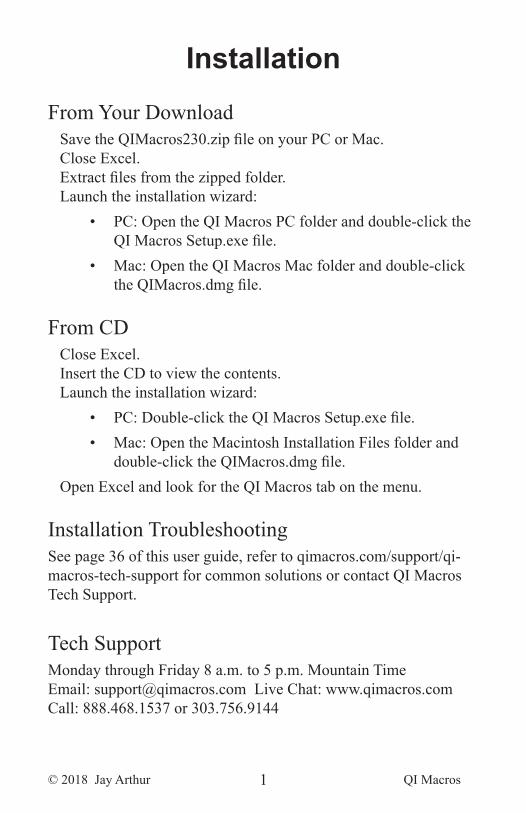
InstallationFrom Your Download
Save the QIMacros230.zip file on your PC or Mac.Close Excel.Extract files from the zipped folder.Launch the installation wizard:
• PC: Open the QI Macros PC folder and double-click the QI Macros Setup.exe file.
• Mac: Open the QI Macros Mac folder and double-click the QIMacros.dmg file.
From CDClose Excel. Insert the CD to view the contents.Launch the installation wizard:
• PC: Double-click the QI Macros Setup.exe file.• Mac: Open the Macintosh Installation Files folder and
double-click the QIMacros.dmg file.Open Excel and look for the QI Macros tab on the menu.
Installation Troubleshooting See page 36 of this user guide, refer to qimacros.com/support/qi-macros-tech-support for common solutions or contact QI Macros Tech Support.
Tech Support Monday through Friday 8 a.m. to 5 p.m. Mountain TimeEmail: [email protected] Live Chat: www.qimacros.comCall: 888.468.1537 or 303.756.9144
© 2018 Jay Arthur QI Macros2
LicensingQI Macros is a single user license; one license per user, per com-puter: qimacros.com/pdf/qi-macros-license-agreement.pdf.
QI Macros Home/Office is for one user with two computers (desk-top/laptop, home/office, PC/Mac): qimacros.com/store/add-w244.
CompatibilityQI Macros is compatible with PCs, Macs and tablets running a fully functioning version of Excel (with vba installed):
• Windows 7, 8, and 10, Mac OSX• Excel 2010, 2013, 2016, and 2019 for Windows, Excel
2016 and 2019 for Mac, and Office 365• Windows 8 and 10 Tablets that are running a full version
of Excel 2013, Excel 2016 or Office 365qimacros.com/support/excel-compatibility
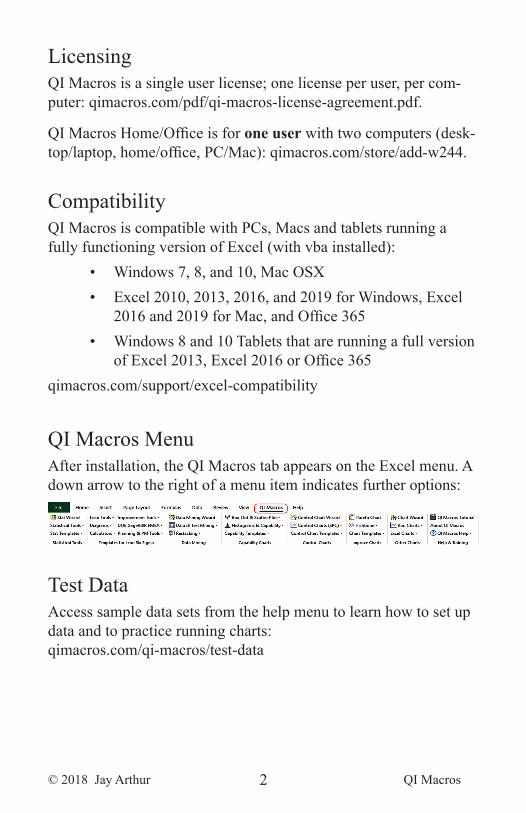
QI Macros MenuAfter installation, the QI Macros tab appears on the Excel menu. A down arrow to the right of a menu item indicates further options:
Test Data Access sample data sets from the help menu to learn how to set up data and to practice running charts: qimacros.com/qi-macros/test-data
© 2018 Jay Arthur QI Macros3
OverviewAbout this User GuideThis booklet covers the use of QI Macros. It does not cover Excel, SPC, or Six Sigma. See qimacros.com/training for other resources addressing these topics.
Video Tutorials Watch how-to videos for most of the QI Macros tools:P qimacros.com/qi-macros/video-tourP qimacros.com/training/videos
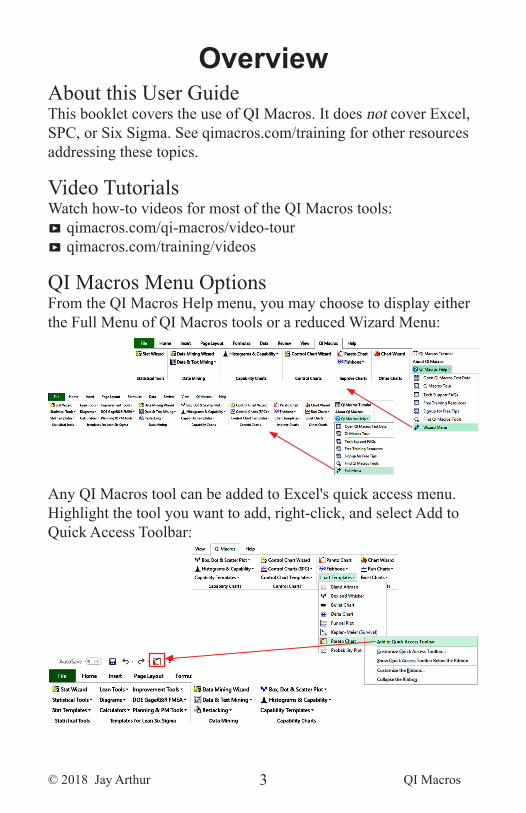
QI Macros Menu OptionsFrom the QI Macros Help menu, you may choose to display either the Full Menu of QI Macros tools or a reduced Wizard Menu:
Any QI Macros tool can be added to Excel's quick access menu. Highlight the tool you want to add, right-click, and select Add to Quick Access Toolbar:
© 2018 Jay Arthur QI Macros4
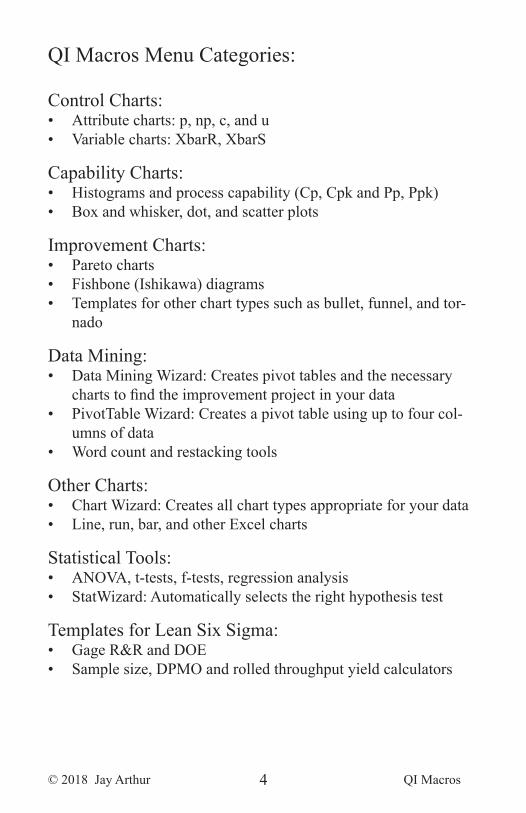
QI Macros Menu Categories:
Control Charts:• Attribute charts: p, np, c, and u • Variable charts: XbarR, XbarS
Capability Charts:• Histograms and process capability (Cp, Cpk and Pp, Ppk)• Box and whisker, dot, and scatter plots
Improvement Charts:• Pareto charts• Fishbone (Ishikawa) diagrams• Templates for other chart types such as bullet, funnel, and tor-
nado
Data Mining:• Data Mining Wizard: Creates pivot tables and the necessary
charts to find the improvement project in your data• PivotTable Wizard: Creates a pivot table using up to four col-
umns of data• Word count and restacking tools
Other Charts:• Chart Wizard: Creates all chart types appropriate for your data• Line, run, bar, and other Excel charts
Statistical Tools:• ANOVA, t-tests, f-tests, regression analysis• StatWizard: Automatically selects the right hypothesis test
Templates for Lean Six Sigma:• Gage R&R and DOE• Sample size, DPMO and rolled throughput yield calculators
© 2018 Jay Arthur QI Macros5
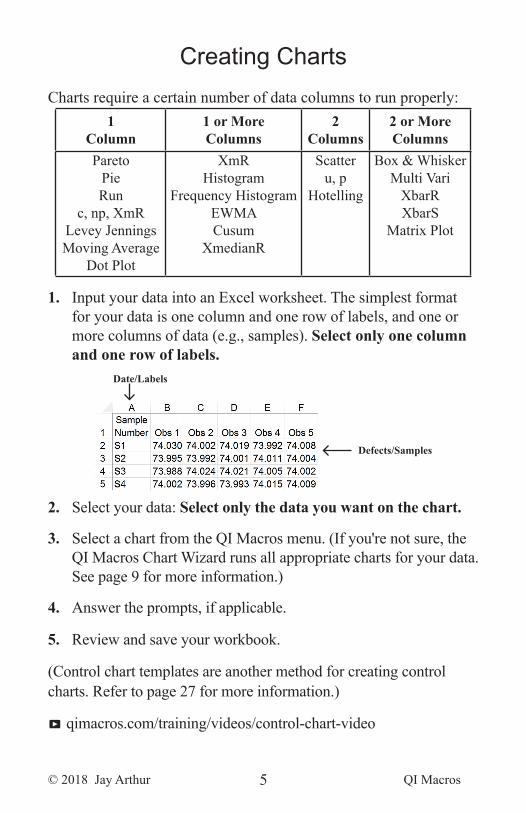
Creating ChartsCharts require a certain number of data columns to run properly:
1 Column
1 or More Columns
2 Columns
2 or More Columns
ParetoPie Run
c, np, XmRLevey JenningsMoving Average
Dot Plot
XmRHistogram
Frequency HistogramEWMACusum
XmedianR
Scatteru, p
Hotelling
Box & WhiskerMulti Vari
XbarRXbarS
Matrix Plot
1. Input your data into an Excel worksheet. The simplest format for your data is one column and one row of labels, and one or more columns of data (e.g., samples). Select only one column and one row of labels.
2. Select your data: Select only the data you want on the chart.
3. Select a chart from the QI Macros menu. (If you're not sure, the QI Macros Chart Wizard runs all appropriate charts for your data. See page 9 for more information.)
4. Answer the prompts, if applicable.
5. Review and save your workbook.
(Control chart templates are another method for creating control charts. Refer to page 27 for more information.)
P qimacros.com/training/videos/control-chart-video
Defects/Samples
Date/Labels
© 2018 Jay Arthur QI Macros6
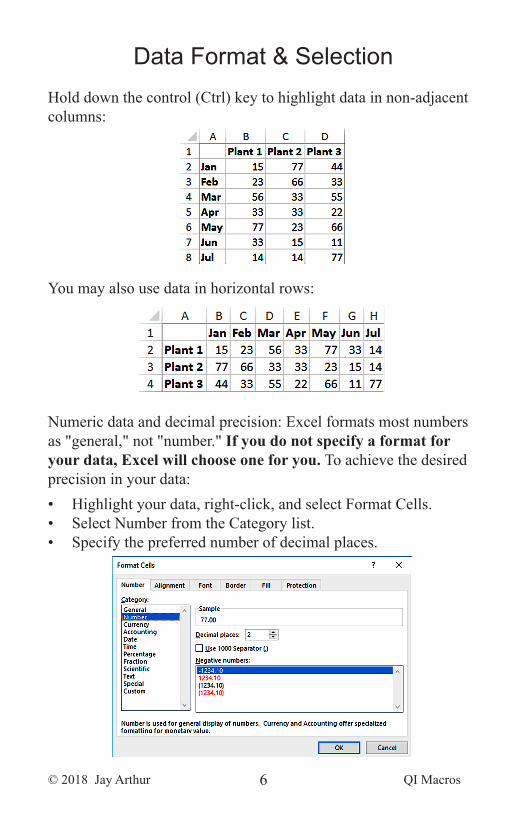
Data Format & SelectionHold down the control (Ctrl) key to highlight data in non-adjacent columns:
You may also use data in horizontal rows:
Numeric data and decimal precision: Excel formats most numbers as "general," not "number." If you do not specify a format for your data, Excel will choose one for you. To achieve the desired precision in your data:• Highlight your data, right-click, and select Format Cells.• Select Number from the Category list.• Specify the preferred number of decimal places.
© 2018 Jay Arthur QI Macros7
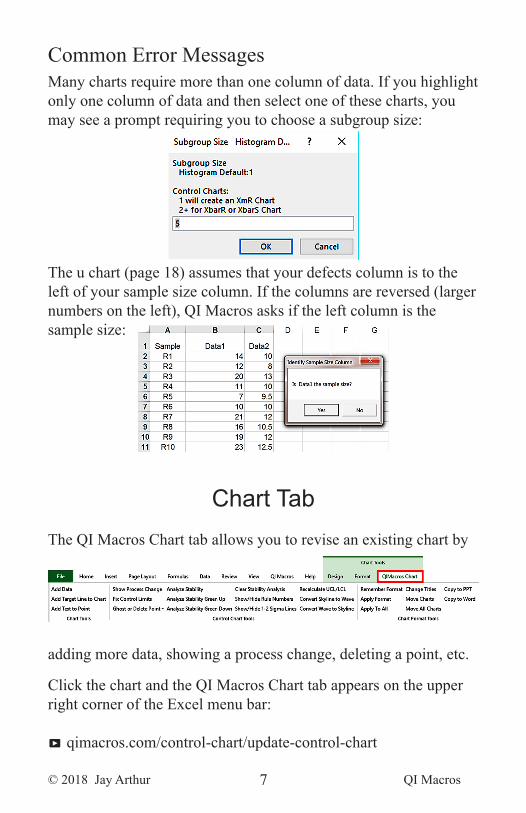
Common Error MessagesMany charts require more than one column of data. If you highlight only one column of data and then select one of these charts, you may see a prompt requiring you to choose a subgroup size:
The u chart (page 18) assumes that your defects column is to the left of your sample size column. If the columns are reversed (larger numbers on the left), QI Macros asks if the left column is the sample size:
Chart TabThe QI Macros Chart tab allows you to revise an existing chart by
adding more data, showing a process change, deleting a point, etc.
Click the chart and the QI Macros Chart tab appears on the upper right corner of the Excel menu bar:
P qimacros.com/control-chart/update-control-chart
© 2018 Jay Arthur QI Macros8
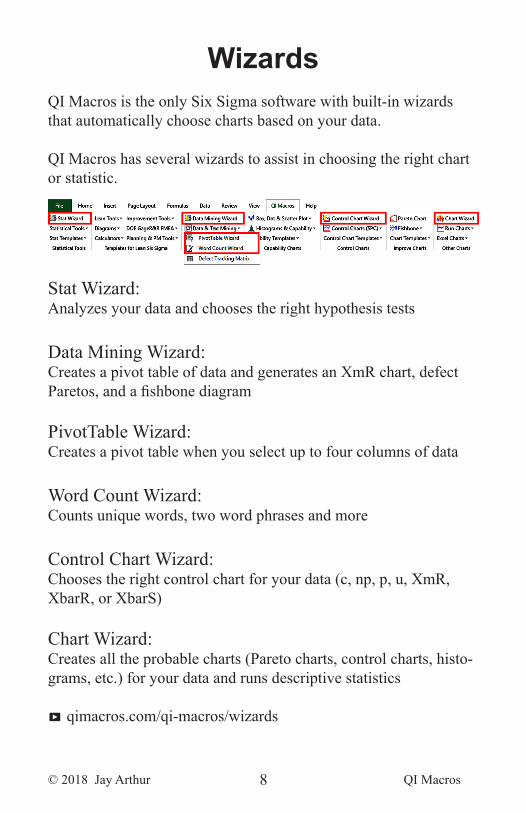
Wizards QI Macros is the only Six Sigma software with built-in wizards that automatically choose charts based on your data.
QI Macros has several wizards to assist in choosing the right chart or statistic.
Stat Wizard:Analyzes your data and chooses the right hypothesis tests
Data Mining Wizard:Creates a pivot table of data and generates an XmR chart, defect Paretos, and a fishbone diagram
PivotTable Wizard:Creates a pivot table when you select up to four columns of data
Word Count Wizard:Counts unique words, two word phrases and more
Control Chart Wizard:Chooses the right control chart for your data (c, np, p, u, XmR, XbarR, or XbarS)
Chart Wizard:Creates all the probable charts (Pareto charts, control charts, histo-grams, etc.) for your data and runs descriptive statistics
P qimacros.com/qi-macros/wizards
© 2018 Jay Arthur QI Macros9
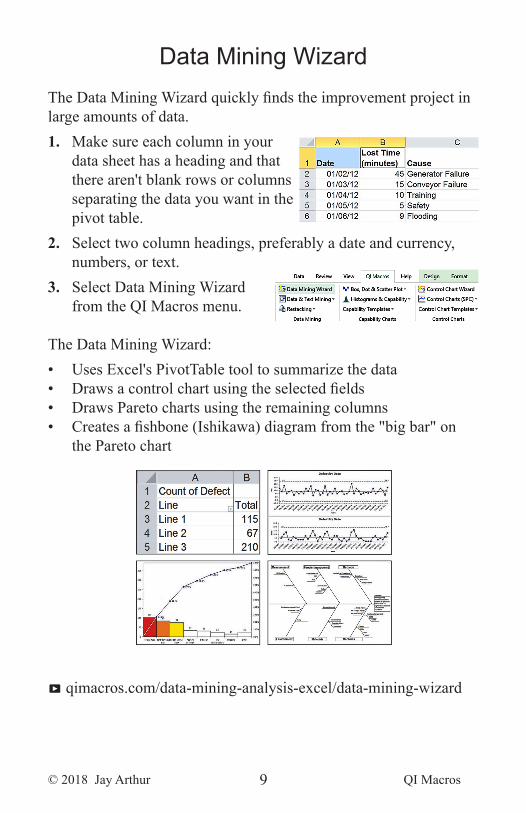
Data Mining WizardThe Data Mining Wizard quickly finds the improvement project in large amounts of data. 1. Make sure each column in your
data sheet has a heading and that there aren't blank rows or columns separating the data you want in the pivot table.
2. Select two column headings, preferably a date and currency, numbers, or text.
3. Select Data Mining Wizard from the QI Macros menu.
The Data Mining Wizard:• Uses Excel's PivotTable tool to summarize the data• Draws a control chart using the selected fields • Draws Pareto charts using the remaining columns• Creates a fishbone (Ishikawa) diagram from the "big bar" on
the Pareto chart
P qimacros.com/data-mining-analysis-excel/data-mining-wizard
© 2018 Jay Arthur QI Macros10
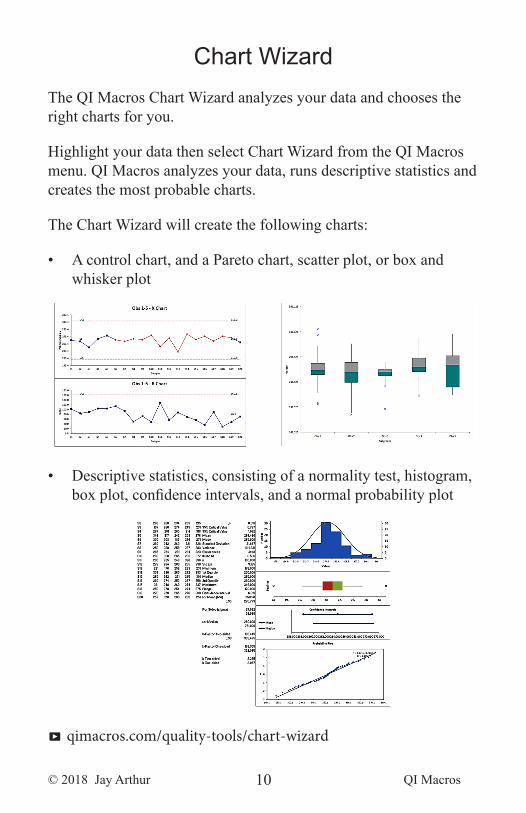
Chart WizardThe QI Macros Chart Wizard analyzes your data and chooses the right charts for you.
Highlight your data then select Chart Wizard from the QI Macros menu. QI Macros analyzes your data, runs descriptive statistics and creates the most probable charts.
The Chart Wizard will create the following charts:
• A control chart, and a Pareto chart, scatter plot, or box and whisker plot
• Descriptive statistics, consisting of a normality test, histogram, box plot, confidence intervals, and a normal probability plot
P qimacros.com/quality-tools/chart-wizard
© 2018 Jay Arthur QI Macros11
Control Chart WizardChoosing the right control chart depends on your data – attribute (counted) or variable (measured) – and the sample size:
Number of SamplesType of data 1 2 or more Varies
Fraction Defective np pNumber of Defects c u
Time, Length, Weight, $(Measured) XmR XbarR
XbarSXbarRXbarS
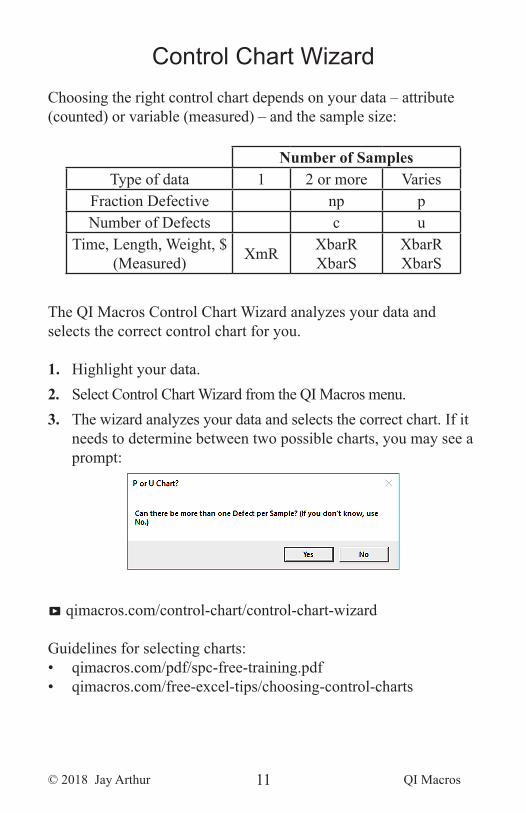
The QI Macros Control Chart Wizard analyzes your data and selects the correct control chart for you.
1. Highlight your data. 2. Select Control Chart Wizard from the QI Macros menu. 3. The wizard analyzes your data and selects the correct chart. If it
needs to determine between two possible charts, you may see a prompt:
P qimacros.com/control-chart/control-chart-wizard
Guidelines for selecting charts: • qimacros.com/pdf/spc-free-training.pdf• qimacros.com/free-excel-tips/choosing-control-charts
© 2018 Jay Arthur QI Macros12
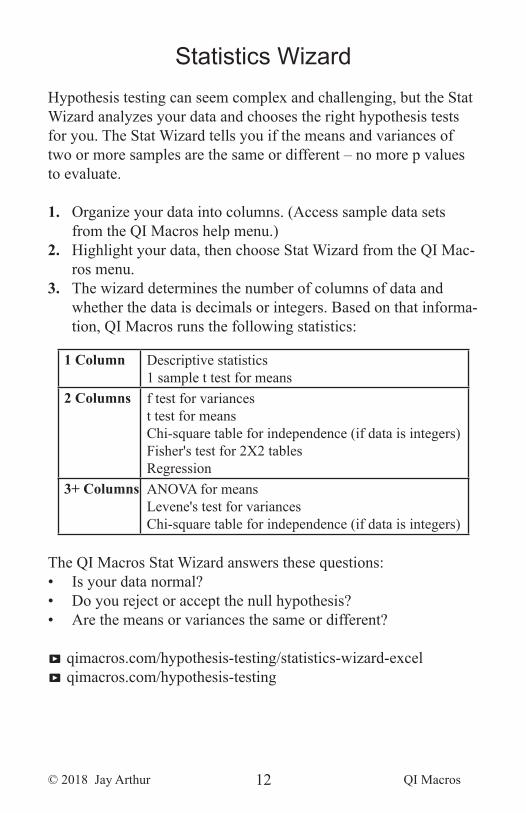
Statistics WizardHypothesis testing can seem complex and challenging, but the Stat Wizard analyzes your data and chooses the right hypothesis tests for you. The Stat Wizard tells you if the means and variances of two or more samples are the same or different – no more p values to evaluate.
1. Organize your data into columns. (Access sample data sets from the QI Macros help menu.)
2. Highlight your data, then choose Stat Wizard from the QI Mac-ros menu.
3. The wizard determines the number of columns of data and whether the data is decimals or integers. Based on that informa-tion, QI Macros runs the following statistics:
1 Column Descriptive statistics 1 sample t test for means
2 Columns f test for variancest test for meansChi-square table for independence (if data is integers)Fisher's test for 2X2 tables Regression
3+ Columns ANOVA for meansLevene's test for variances Chi-square table for independence (if data is integers)
The QI Macros Stat Wizard answers these questions:• Is your data normal?• Do you reject or accept the null hypothesis?• Are the means or variances the same or different?
P qimacros.com/hypothesis-testing/statistics-wizard-excel P qimacros.com/hypothesis-testing
© 2018 Jay Arthur QI Macros13
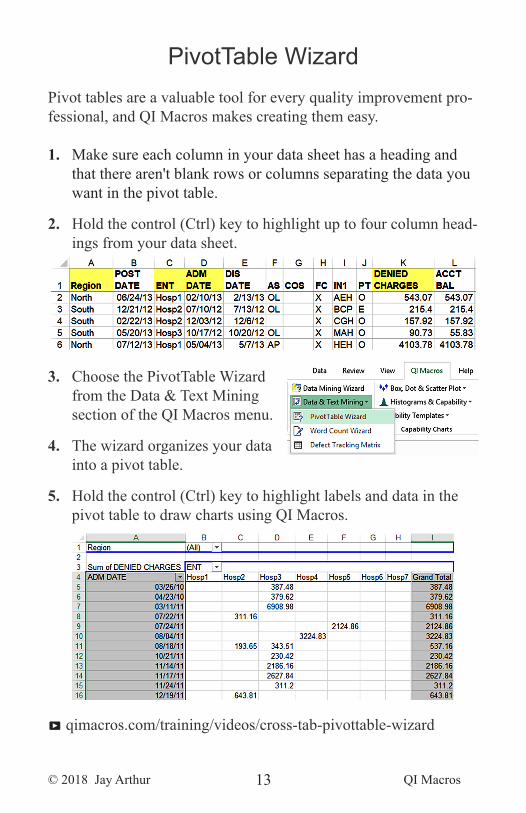
PivotTable Wizard Pivot tables are a valuable tool for every quality improvement pro-fessional, and QI Macros makes creating them easy.
1. Make sure each column in your data sheet has a heading and that there aren't blank rows or columns separating the data you want in the pivot table.
2. Hold the control (Ctrl) key to highlight up to four column head-ings from your data sheet.
3. Choose the PivotTable Wizard from the Data & Text Mining section of the QI Macros menu.
4. The wizard organizes your data into a pivot table.
5. Hold the control (Ctrl) key to highlight labels and data in the pivot table to draw charts using QI Macros.
P qimacros.com/training/videos/cross-tab-pivottable-wizard
© 2018 Jay Arthur QI Macros14
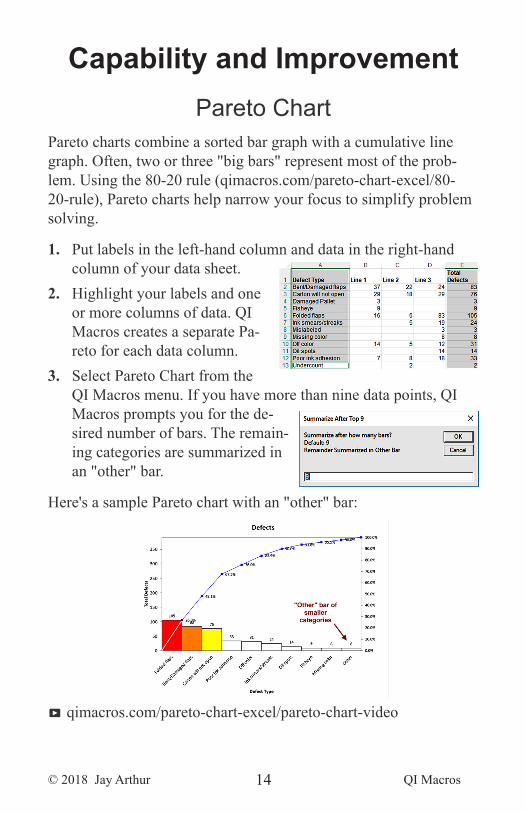
Capability and ImprovementPareto Chart
Pareto charts combine a sorted bar graph with a cumulative line graph. Often, two or three "big bars" represent most of the prob-lem. Using the 80-20 rule (qimacros.com/pareto-chart-excel/80-20-rule), Pareto charts help narrow your focus to simplify problem solving.
1. Put labels in the left-hand column and data in the right-hand column of your data sheet.
2. Highlight your labels and one or more columns of data. QI Macros creates a separate Pa-reto for each data column.
3. Select Pareto Chart from the QI Macros menu. If you have more than nine data points, QI Macros prompts you for the de-sired number of bars. The remain-ing categories are summarized in an "other" bar.
Here's a sample Pareto chart with an "other" bar:
P qimacros.com/pareto-chart-excel/pareto-chart-video
© 2018 Jay Arthur QI Macros15
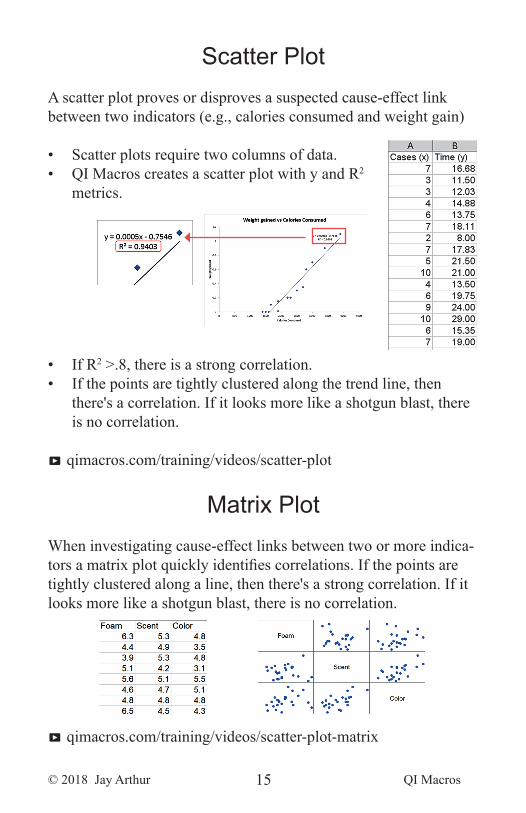
Scatter PlotA scatter plot proves or disproves a suspected cause-effect link between two indicators (e.g., calories consumed and weight gain)
• Scatter plots require two columns of data.• QI Macros creates a scatter plot with y and R2
metrics.
• If R2 >.8, there is a strong correlation. • If the points are tightly clustered along the trend line, then
there's a correlation. If it looks more like a shotgun blast, there is no correlation.
P qimacros.com/training/videos/scatter-plot
Matrix PlotWhen investigating cause-effect links between two or more indica-tors a matrix plot quickly identifies correlations. If the points are tightly clustered along a line, then there's a strong correlation. If it looks more like a shotgun blast, there is no correlation.
P qimacros.com/training/videos/scatter-plot-matrix
© 2018 Jay Arthur QI Macros16
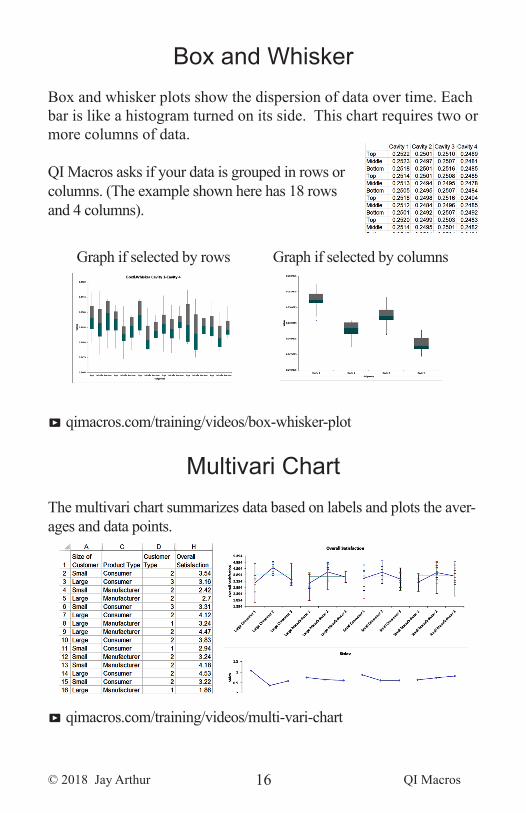
Box and WhiskerBox and whisker plots show the dispersion of data over time. Each bar is like a histogram turned on its side. This chart requires two or more columns of data.
QI Macros asks if your data is grouped in rows or columns. (The example shown here has 18 rows and 4 columns).
Graph if selected by rows Graph if selected by columns
P qimacros.com/training/videos/box-whisker-plot
Multivari ChartThe multivari chart summarizes data based on labels and plots the aver-ages and data points.
P qimacros.com/training/videos/multi-vari-chart
© 2018 Jay Arthur QI Macros17
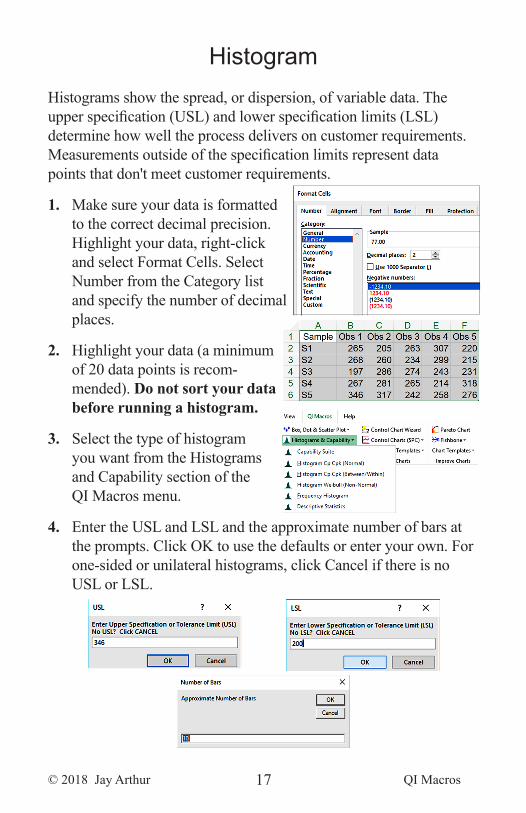
HistogramHistograms show the spread, or dispersion, of variable data. The upper specification (USL) and lower specification limits (LSL) determine how well the process delivers on customer requirements. Measurements outside of the specification limits represent data points that don't meet customer requirements.
1. Make sure your data is formatted to the correct decimal precision. Highlight your data, right-click and select Format Cells. Select Number from the Category list and specify the number of decimal places.
2. Highlight your data (a minimum of 20 data points is recom-mended). Do not sort your data before running a histogram.
3. Select the type of histogram you want from the Histograms and Capability section of the QI Macros menu.
4. Enter the USL and LSL and the approximate number of bars at the prompts. Click OK to use the defaults or enter your own. For one-sided or unilateral histograms, click Cancel if there is no USL or LSL.
© 2018 Jay Arthur QI Macros18
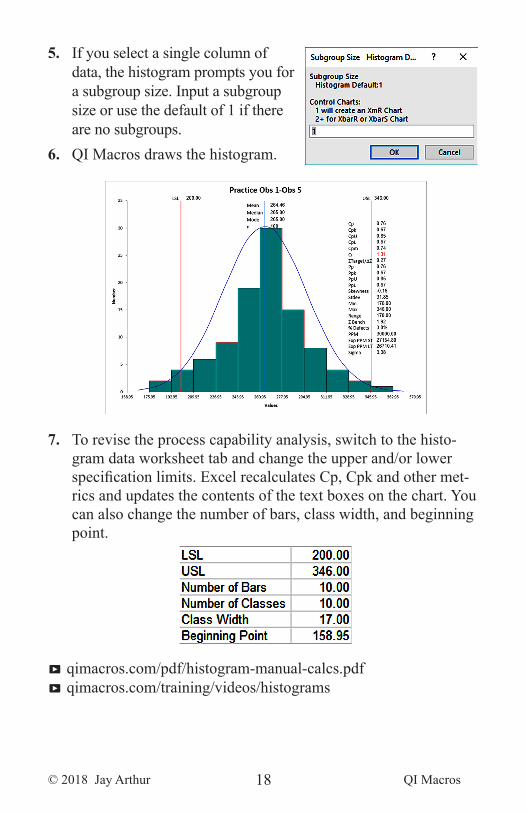
5. If you select a single column of data, the histogram prompts you for a subgroup size. Input a subgroup size or use the default of 1 if there are no subgroups.
6. QI Macros draws the histogram.
7. To revise the process capability analysis, switch to the histo-gram data worksheet tab and change the upper and/or lower specification limits. Excel recalculates Cp, Cpk and other met-rics and updates the contents of the text boxes on the chart. You can also change the number of bars, class width, and beginning point.
P qimacros.com/pdf/histogram-manual-calcs.pdfP qimacros.com/training/videos/histograms
© 2018 Jay Arthur QI Macros19
Control Chartsc, np, p, and u Control Charts
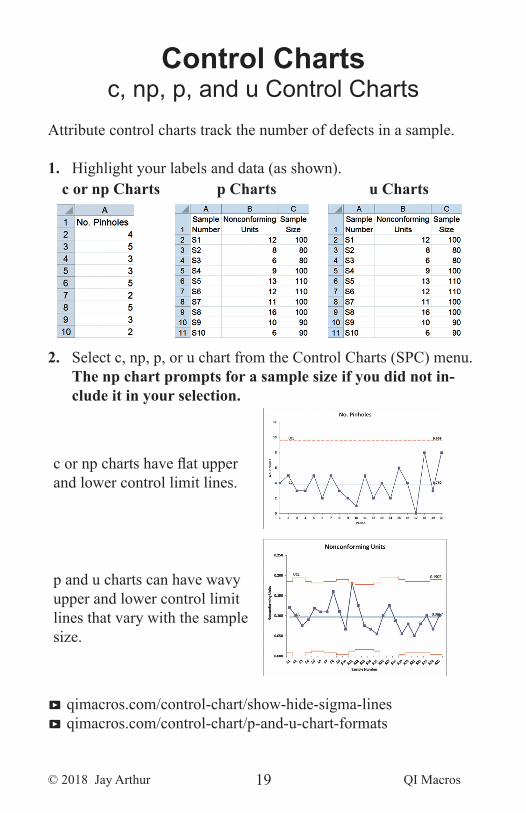
Attribute control charts track the number of defects in a sample.
1. Highlight your labels and data (as shown). c or np Charts p Charts u Charts
2. Select c, np, p, or u chart from the Control Charts (SPC) menu. The np chart prompts for a sample size if you did not in-clude it in your selection.
c or np charts have flat upper and lower control limit lines.
p and u charts can have wavy upper and lower control limit lines that vary with the sample size.
P qimacros.com/control-chart/show-hide-sigma-linesP qimacros.com/control-chart/p-and-u-chart-formats
© 2018 Jay Arthur QI Macros20
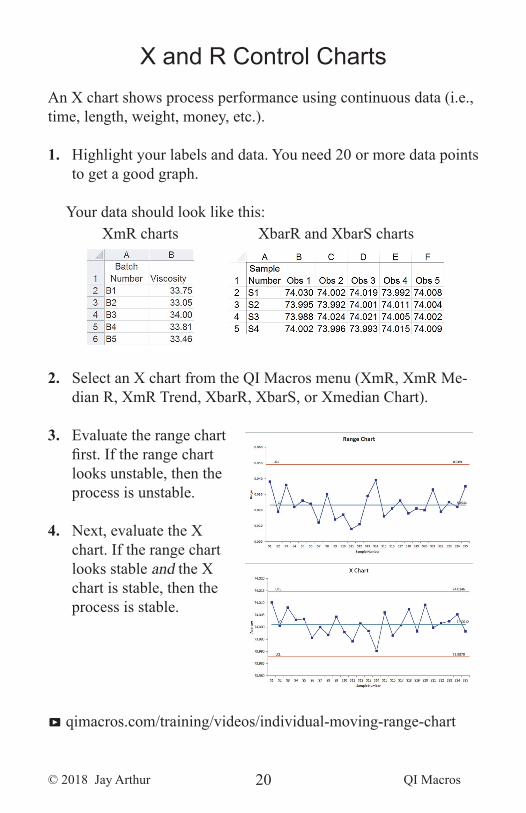
X and R Control ChartsAn X chart shows process performance using continuous data (i.e., time, length, weight, money, etc.).
1. Highlight your labels and data. You need 20 or more data points to get a good graph.
Your data should look like this:XmR charts XbarR and XbarS charts
2. Select an X chart from the QI Macros menu (XmR, XmR Me-dian R, XmR Trend, XbarR, XbarS, or Xmedian Chart).
3. Evaluate the range chart first. If the range chart looks unstable, then the process is unstable.
4. Next, evaluate the X chart. If the range chart looks stable and the X chart is stable, then the process is stable.
P qimacros.com/training/videos/individual-moving-range-chart
© 2018 Jay Arthur QI Macros21
Specialized Control ChartsQI Macros contains tools for specialized control charts. Refer to the links on this page to learn more:
Prime Charts:qimacros.com/control-chart/p-prime-control-chartqimacros.com/control-chart/u-prime-control-chart
g and t Charts:qimacros.com/control-chart/g-chart-templateqimacros.com/control-chart/t-chart-excel
Moving Average:qimacros.com/control-chart/moving-average-chart
Levey Jennings:qimacros.com/control-chart/levey-jennings-chart
ANOM: qimacros.com/control-chart/analysis-of-means-chart
CUSUM:qimacros.com/control-chart/cusum-chart
EWMA:qimacros.com/control-chart/ewma-chart
I-MR-R:qimacros.com/control-chart/i-mr-r-s-chart
Hotelling T2:qimacros.com/control-chart/hotelling-t2-chart
© 2018 Jay Arthur QI Macros22
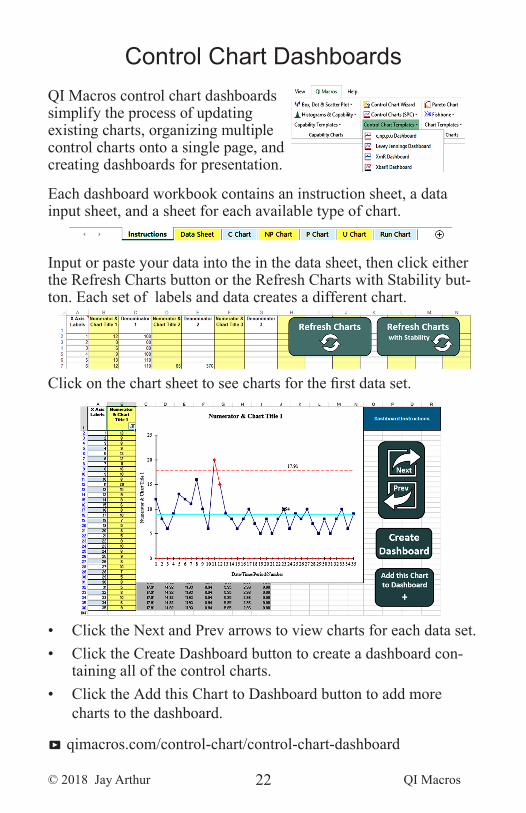
Control Chart DashboardsQI Macros control chart dashboards simplify the process of updating existing charts, organizing multiple control charts onto a single page, and creating dashboards for presentation.
Each dashboard workbook contains an instruction sheet, a data input sheet, and a sheet for each available type of chart.
Input or paste your data into the in the data sheet, then click either the Refresh Charts button or the Refresh Charts with Stability but-ton. Each set of labels and data creates a different chart.
Click on the chart sheet to see charts for the first data set.
• Click the Next and Prev arrows to view charts for each data set.• Click the Create Dashboard button to create a dashboard con-
taining all of the control charts.• Click the Add this Chart to Dashboard button to add more
charts to the dashboard.
P qimacros.com/control-chart/control-chart-dashboard
© 2018 Jay Arthur QI Macros23
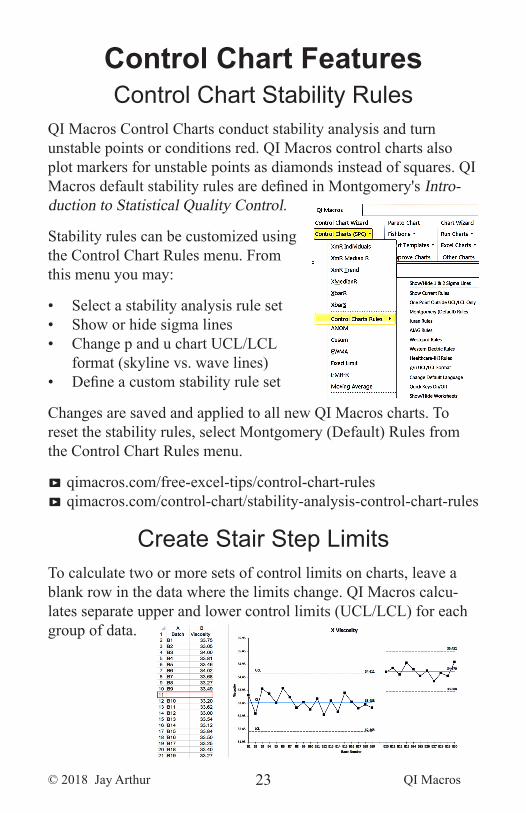
Control Chart FeaturesControl Chart Stability Rules
QI Macros Control Charts conduct stability analysis and turn unstable points or conditions red. QI Macros control charts also plot markers for unstable points as diamonds instead of squares. QI Macros default stability rules are defined in Montgomery's Intro-duction to Statistical Quality Control.
Stability rules can be customized using the Control Chart Rules menu. From this menu you may:
• Select a stability analysis rule set• Show or hide sigma lines• Change p and u chart UCL/LCL
format (skyline vs. wave lines)• Define a custom stability rule set
Changes are saved and applied to all new QI Macros charts. To reset the stability rules, select Montgomery (Default) Rules from the Control Chart Rules menu.
P qimacros.com/free-excel-tips/control-chart-rulesP qimacros.com/control-chart/stability-analysis-control-chart-rules
Create Stair Step LimitsTo calculate two or more sets of control limits on charts, leave a blank row in the data where the limits change. QI Macros calcu-lates separate upper and lower control limits (UCL/LCL) for each group of data.
© 2018 Jay Arthur QI Macros24
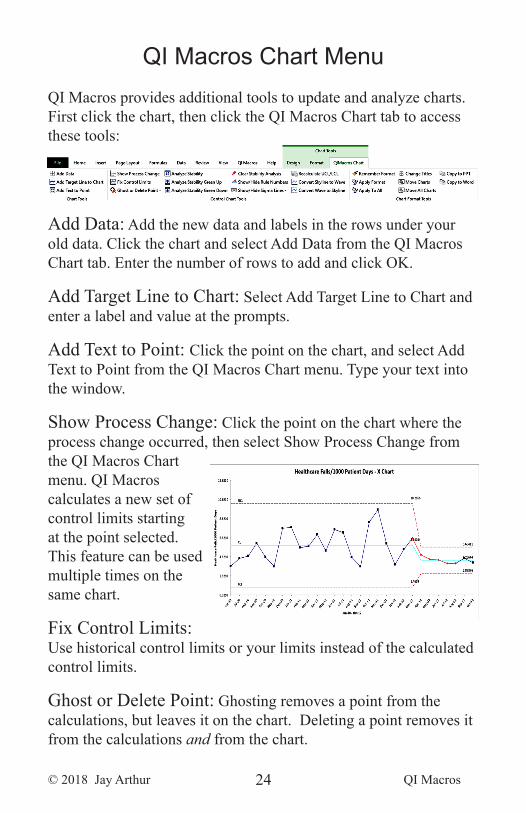
QI Macros Chart MenuQI Macros provides additional tools to update and analyze charts. First click the chart, then click the QI Macros Chart tab to access these tools:
Add Data: Add the new data and labels in the rows under your old data. Click the chart and select Add Data from the QI Macros Chart tab. Enter the number of rows to add and click OK.
Add Target Line to Chart: Select Add Target Line to Chart and enter a label and value at the prompts.
Add Text to Point: Click the point on the chart, and select Add Text to Point from the QI Macros Chart menu. Type your text into the window.
Show Process Change: Click the point on the chart where the process change occurred, then select Show Process Change from the QI Macros Chart menu. QI Macros calculates a new set of control limits starting at the point selected. This feature can be used multiple times on the same chart.
Fix Control Limits: Use historical control limits or your limits instead of the calculated control limits.
Ghost or Delete Point: Ghosting removes a point from the calculations, but leaves it on the chart. Deleting a point removes it from the calculations and from the chart.
© 2018 Jay Arthur QI Macros25
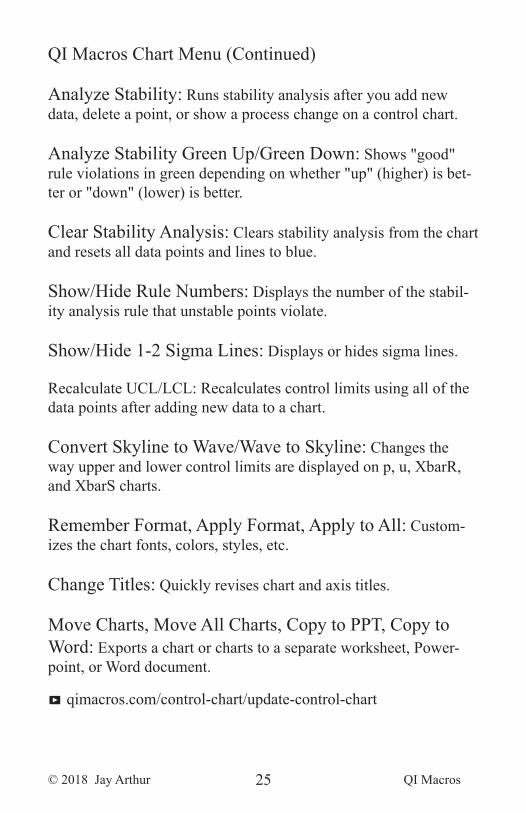
QI Macros Chart Menu (Continued)
Analyze Stability: Runs stability analysis after you add new data, delete a point, or show a process change on a control chart.
Analyze Stability Green Up/Green Down: Shows "good" rule violations in green depending on whether "up" (higher) is bet-ter or "down" (lower) is better.
Clear Stability Analysis: Clears stability analysis from the chart and resets all data points and lines to blue.
Show/Hide Rule Numbers: Displays the number of the stabil-ity analysis rule that unstable points violate.
Show/Hide 1-2 Sigma Lines: Displays or hides sigma lines.
Recalculate UCL/LCL: Recalculates control limits using all of the data points after adding new data to a chart.
Convert Skyline to Wave/Wave to Skyline: Changes the way upper and lower control limits are displayed on p, u, XbarR, and XbarS charts.
Remember Format, Apply Format, Apply to All: Custom-izes the chart fonts, colors, styles, etc.
Change Titles: Quickly revises chart and axis titles.
Move Charts, Move All Charts, Copy to PPT, Copy to Word: Exports a chart or charts to a separate worksheet, Power-point, or Word document.
P qimacros.com/control-chart/update-control-chart
© 2018 Jay Arthur QI Macros26
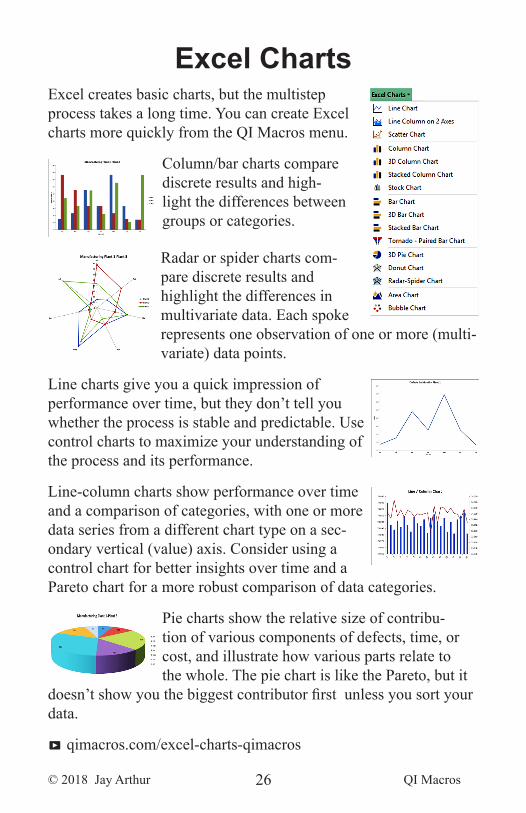
Excel ChartsExcel creates basic charts, but the multistepprocess takes a long time. You can create Excel charts more quickly from the QI Macros menu.
Column/bar charts compare discrete results and high-light the differences between groups or categories.
Radar or spider charts com-pare discrete results and highlight the differences in multivariate data. Each spoke represents one observation of one or more (multi-variate) data points.
Line charts give you a quick impression of performance over time, but they don’t tell you whether the process is stable and predictable. Use control charts to maximize your understanding of the process and its performance.
Line-column charts show performance over time and a comparison of categories, with one or more data series from a different chart type on a sec-ondary vertical (value) axis. Consider using a control chart for better insights over time and a Pareto chart for a more robust comparison of data categories.
Pie charts show the relative size of contribu-tion of various components of defects, time, or cost, and illustrate how various parts relate to the whole. The pie chart is like the Pareto, but it
doesn’t show you the biggest contributor first unless you sort your data.
P qimacros.com/excel-charts-qimacros
© 2018 Jay Arthur QI Macros27
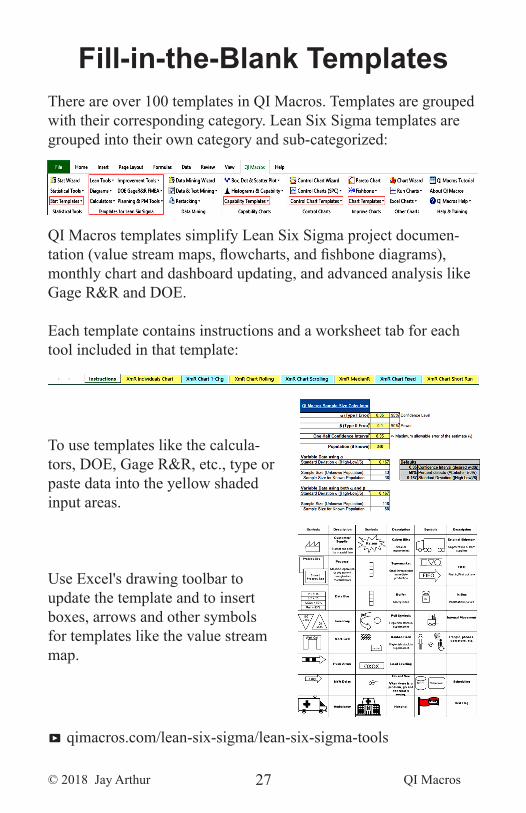
Fill-in-the-Blank TemplatesThere are over 100 templates in QI Macros. Templates are grouped with their corresponding category. Lean Six Sigma templates are grouped into their own category and sub-categorized:
QI Macros templates simplify Lean Six Sigma project documen-tation (value stream maps, flowcharts, and fishbone diagrams), monthly chart and dashboard updating, and advanced analysis like Gage R&R and DOE.
Each template contains instructions and a worksheet tab for each tool included in that template:
To use templates like the calcula-tors, DOE, Gage R&R, etc., type or paste data into the yellow shaded input areas.
Use Excel's drawing toolbar to update the template and to insert boxes, arrows and other symbols for templates like the value stream map.
P qimacros.com/lean-six-sigma/lean-six-sigma-tools
© 2018 Jay Arthur QI Macros28
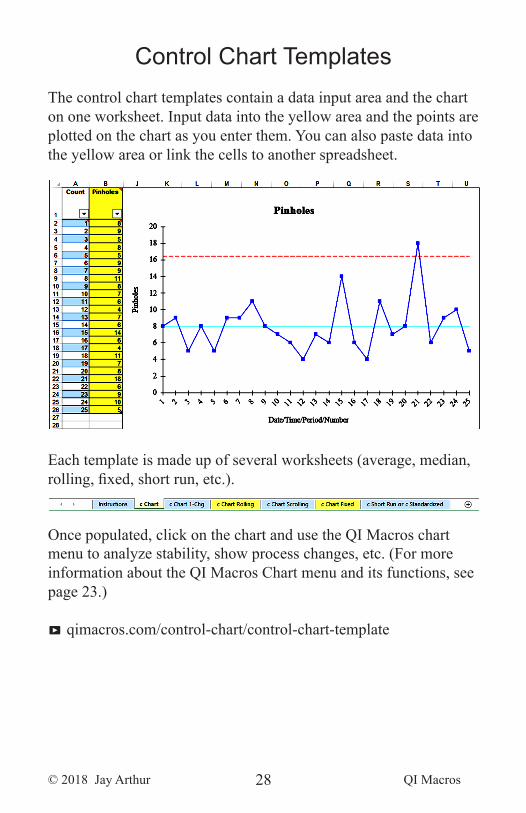
Control Chart TemplatesThe control chart templates contain a data input area and the chart on one worksheet. Input data into the yellow area and the points are plotted on the chart as you enter them. You can also paste data into the yellow area or link the cells to another spreadsheet.
Each template is made up of several worksheets (average, median, rolling, fixed, short run, etc.).
Once populated, click on the chart and use the QI Macros chart menu to analyze stability, show process changes, etc. (For more information about the QI Macros Chart menu and its functions, see page 23.)
P qimacros.com/control-chart/control-chart-template
© 2018 Jay Arthur QI Macros29
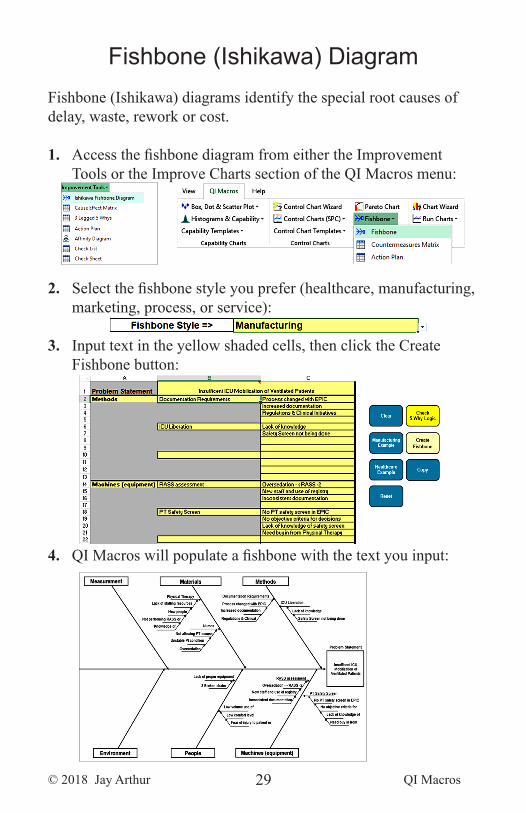
Fishbone (Ishikawa) DiagramFishbone (Ishikawa) diagrams identify the special root causes of delay, waste, rework or cost.
1. Access the fishbone diagram from either the Improvement Tools or the Improve Charts section of the QI Macros menu:
2. Select the fishbone style you prefer (healthcare, manufacturing, marketing, process, or service):
3. Input text in the yellow shaded cells, then click the Create Fishbone button:
4. QI Macros will populate a fishbone with the text you input:
© 2018 Jay Arthur QI Macros30
Fishbone (Ishikawa) Diagram (Continued)
• To revise the fishbone, go back into the input tab and update your text, then click the Create Fishbone button again.
• To copy the fishbone to Powerpoint or Word click on the Copy button, then paste the fishbone diagram as either a picture or drawing object. (Pictures are static, drawing objects can be revised.)
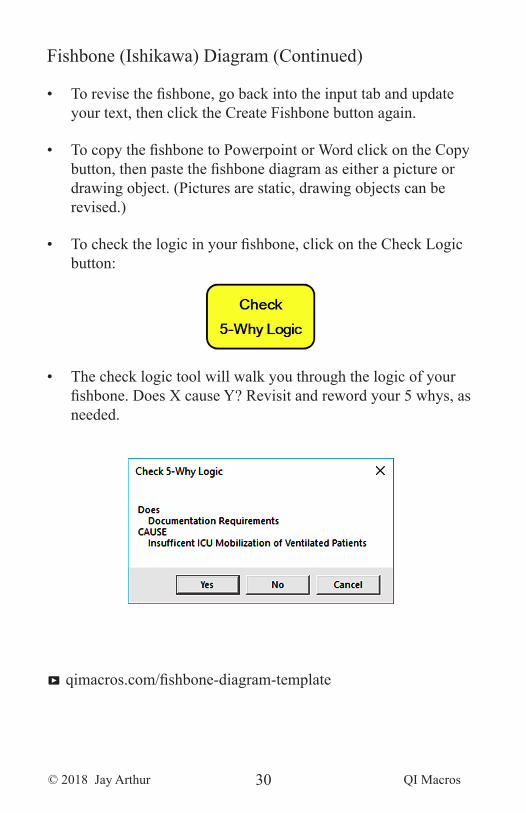
• To check the logic in your fishbone, click on the Check Logic button:
• The check logic tool will walk you through the logic of your fishbone. Does X cause Y? Revisit and reword your 5 whys, as needed.
P qimacros.com/fishbone-diagram-template
© 2018 Jay Arthur QI Macros31
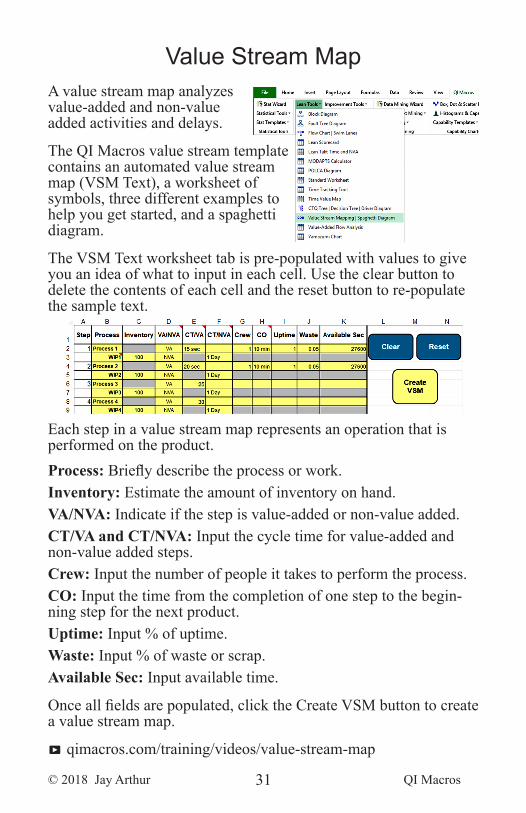
Value Stream MapA value stream map analyzes value-added and non-value added activities and delays.
The QI Macros value stream template contains an automated value stream map (VSM Text), a worksheet of symbols, three different examples to help you get started, and a spaghetti diagram.
The VSM Text worksheet tab is pre-populated with values to give you an idea of what to input in each cell. Use the clear button to delete the contents of each cell and the reset button to re-populate the sample text.
Each step in a value stream map represents an operation that is performed on the product. Process: Briefly describe the process or work.Inventory: Estimate the amount of inventory on hand.VA/NVA: Indicate if the step is value-added or non-value added.CT/VA and CT/NVA: Input the cycle time for value-added and non-value added steps.Crew: Input the number of people it takes to perform the process.CO: Input the time from the completion of one step to the begin-ning step for the next product.Uptime: Input % of uptime.Waste: Input % of waste or scrap.Available Sec: Input available time.
Once all fields are populated, click the Create VSM button to create a value stream map.
P qimacros.com/training/videos/value-stream-map
© 2018 Jay Arthur QI Macros32
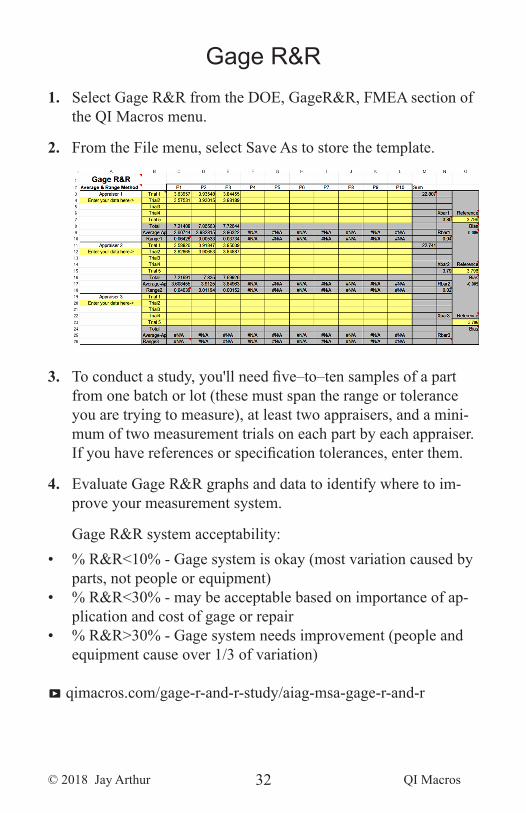
Gage R&R1. Select Gage R&R from the DOE, GageR&R, FMEA section of
the QI Macros menu.
2. From the File menu, select Save As to store the template.
3. To conduct a study, you'll need five–to–ten samples of a part from one batch or lot (these must span the range or tolerance you are trying to measure), at least two appraisers, and a mini-mum of two measurement trials on each part by each appraiser. If you have references or specification tolerances, enter them.
4. Evaluate Gage R&R graphs and data to identify where to im-prove your measurement system.
Gage R&R system acceptability:• % R&R<10% - Gage system is okay (most variation caused by
parts, not people or equipment) • % R&R<30% - may be acceptable based on importance of ap-
plication and cost of gage or repair• % R&R>30% - Gage system needs improvement (people and
equipment cause over 1/3 of variation)
P qimacros.com/gage-r-and-r-study/aiag-msa-gage-r-and-r
© 2018 Jay Arthur QI Macros33
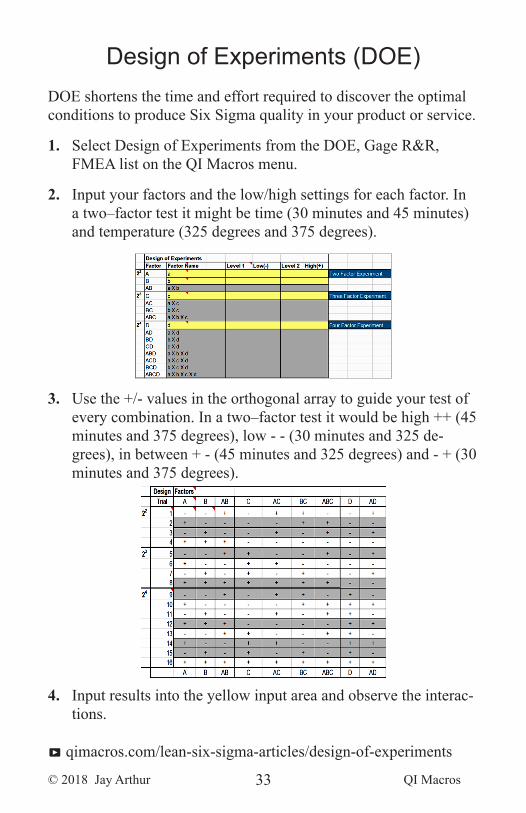
Design of Experiments (DOE)DOE shortens the time and effort required to discover the optimal conditions to produce Six Sigma quality in your product or service.
1. Select Design of Experiments from the DOE, Gage R&R, FMEA list on the QI Macros menu.
2. Input your factors and the low/high settings for each factor. In a two–factor test it might be time (30 minutes and 45 minutes) and temperature (325 degrees and 375 degrees).
3. Use the +/- values in the orthogonal array to guide your test of every combination. In a two–factor test it would be high ++ (45 minutes and 375 degrees), low - - (30 minutes and 325 de-grees), in between + - (45 minutes and 325 degrees) and - + (30 minutes and 375 degrees).
4. Input results into the yellow input area and observe the interac-tions.
P qimacros.com/lean-six-sigma-articles/design-of-experiments
© 2018 Jay Arthur QI Macros34
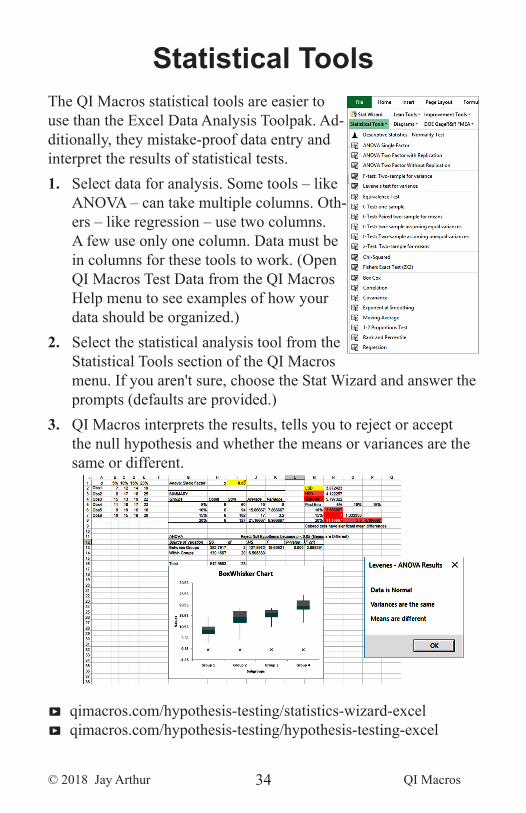
Statistical ToolsThe QI Macros statistical tools are easier to use than the Excel Data Analysis Toolpak. Ad-ditionally, they mistake-proof data entry and interpret the results of statistical tests. 1. Select data for analysis. Some tools – like
ANOVA – can take multiple columns. Oth-ers – like regression – use two columns. A few use only one column. Data must be in columns for these tools to work. (Open QI Macros Test Data from the QI Macros Help menu to see examples of how your data should be organized.)
2. Select the statistical analysis tool from the Statistical Tools section of the QI Macros menu. If you aren't sure, choose the Stat Wizard and answer the prompts (defaults are provided.)
3. QI Macros interprets the results, tells you to reject or accept the null hypothesis and whether the means or variances are the same or different.
P qimacros.com/hypothesis-testing/statistics-wizard-excelP qimacros.com/hypothesis-testing/hypothesis-testing-excel
© 2018 Jay Arthur QI Macros35
Data Mining ToolsQI Macros data mining tools quickly analyze your data and reorga-nize it into a usable format. Refer to the links on this page to learn more.
Data Mining Wizard: Draws pivot tables and all of the charts required to find the improvement project in your data. (see page 8).
P qimacros.com/data-mining-analysis-excel/data-mining-wizard
PivotTable Wizard: Creates pivot tables using up to four column headings. (see page 12)
P qimacros.com/quality-tools/pivot-table-cross-tab
Word Count: Counts the number of times a word or two-word phrase appears in your data.
P qimacros.com/quality-tools/word-count
Stack/Restack/Restacking: Restacks one column of data into multiple columns or restacks multiple columns of data into one column. Converts two columns to three, four columns to two, etc.
P qimacros.com/quality-tools/restack
Paste Link/Paste Link Transpose: Paste-links and paste-transposes in one step. Links your data to a chart template to create dashboards. Updates your data sheet to automatically update the template and chart.
P qimacros.com/quality-tools/pastelink
Box Cox Transformation: Transforms non-normal data into data that is closer to normal.
P qimacros.com/quality-tools/boxcox
© 2018 Jay Arthur QI Macros36
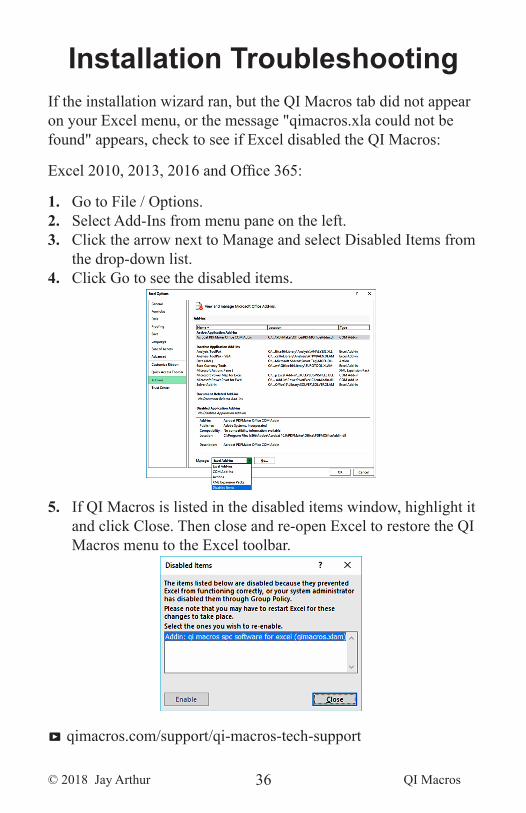
Installation Troubleshooting If the installation wizard ran, but the QI Macros tab did not appear on your Excel menu, or the message "qimacros.xla could not be found" appears, check to see if Excel disabled the QI Macros:
Excel 2010, 2013, 2016 and Office 365:
1. Go to File / Options.2. Select Add-Ins from menu pane on the left. 3. Click the arrow next to Manage and select Disabled Items from
the drop-down list. 4. Click Go to see the disabled items.
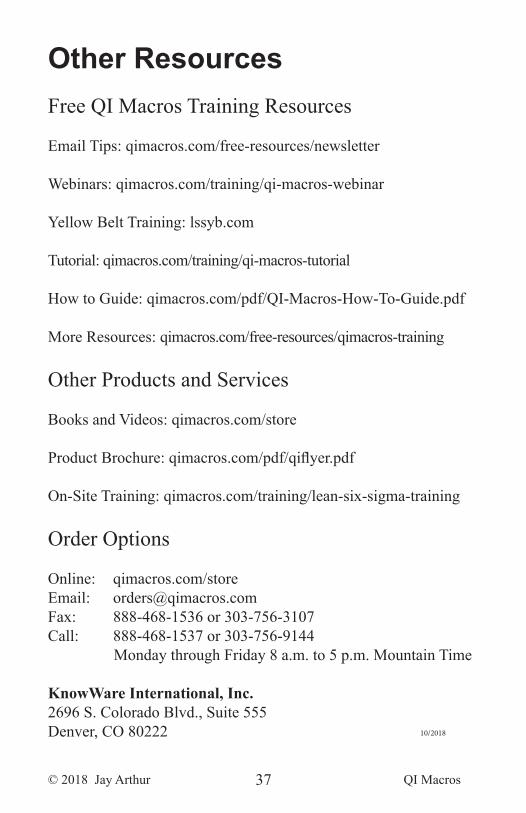
5. If QI Macros is listed in the disabled items window, highlight it and click Close. Then close and re-open Excel to restore the QI Macros menu to the Excel toolbar.
P qimacros.com/support/qi-macros-tech-support
© 2018 Jay Arthur QI Macros37
Other ResourcesFree QI Macros Training Resources
Email Tips: qimacros.com/free-resources/newsletter
Webinars: qimacros.com/training/qi-macros-webinar
Yellow Belt Training: lssyb.com
Tutorial: qimacros.com/training/qi-macros-tutorial
How to Guide: qimacros.com/pdf/QI-Macros-How-To-Guide.pdf
More Resources: qimacros.com/free-resources/qimacros-training
Other Products and Services
Books and Videos: qimacros.com/store
Product Brochure: qimacros.com/pdf/qiflyer.pdf
On-Site Training: qimacros.com/training/lean-six-sigma-training
Order Options
Online: qimacros.com/storeEmail: [email protected]: 888-468-1536 or 303-756-3107Call: 888-468-1537 or 303-756-9144
Monday through Friday 8 a.m. to 5 p.m. Mountain Time
KnowWare International, Inc.2696 S. Colorado Blvd., Suite 555Denver, CO 80222 10/2018