qnoc: qos architecture and design process for network...
TRANSCRIPT

ARTICLE IN PRESS
Journal of Systems Architecture xxx (2003) xxx–xxx
www.elsevier.com/locate/sysarc
QNoC: QoS architecture and design processfor network on chip
Evgeny Bolotin *, Israel Cidon, Ran Ginosar, Avinoam Kolodny
Electrical Engineering Department, Technion––Israel Institute of Technology, Haifa 32000, Israel
Abstract
We define Quality of Service (QoS) and cost model for communications in Systems on Chip (SoC), and derive related
Network on Chip (NoC) architecture and design process. SoC inter-module communication traffic is classified into four
classes of service: signaling (for inter-module control signals); real-time (representing delay-constrained bit streams);
RD/WR (modeling short data access) and block-transfer (handling large data bursts). Communication traffic of the
target SoC is analyzed (by means of analytic calculations and simulations), and QoS requirements (delay and
throughput) for each service class are derived. A customized Quality-of-Service NoC (QNoC) architecture is derived by
modifying a generic network architecture. The customization process minimizes the network cost (in area and power)
while maintaining the required QoS.
The generic network is based on a two-dimensional planar mesh and fixed shortest path (X–Y based) multi-class
wormhole routing. Once communication requirements of the target SoC are identified, the network is customized as
follows: The SoC modules are placed so as to minimize spatial traffic density, unnecessary mesh links and switching
nodes are removed, and bandwidth is allocated to the remaining links and switches according to their relative load so
that link utilization is balanced. The result is a low cost customized QNoC for the target SoC which guarantees that
QoS requirements are met.
� 2003 Elsevier B.V. All rights reserved.
IDT: Network on chip; QoS architecture; Wormhole switching; QNoC design process; QNoC
1. Introduction
On-chip packet-switched networks [1–11] have
been proposed as a solution for the problem of
global interconnect in deep sub-micron VLSI
Systems on Chip (SoC). Networks on Chip (NoC)
can address and contain major physical issues such
* Corresponding author. Tel.: +972-4-829-4711; fax: +972-4-
829-5757.
E-mail address: [email protected] (E. Bolotin).
1383-7621/$ - see front matter � 2003 Elsevier B.V. All rights reserv
doi:10.1016/j.sysarc.2003.07.004
as synchronization, noise, error correction and
speed optimization. NoC can also improve design
productivity by supporting modularity and reuse
of complex cores, thus enabling a higher level of
abstraction in architectural modeling of future
systems [4,5]. However, VLSI designers must be
ensured that the benefits of NoC do not compro-mise system performance and cost [8,10]. Perfor-
mance concerns are associated with latency and
throughput. Cost concerns are primarily chip-area
and power dissipation. This paper presents a de-
sign process and a network architecture that sat-
ed.

2 E. Bolotin et al. / Journal of Systems Architecture xxx (2003) xxx–xxx
ARTICLE IN PRESS
isfy Quality of Service (QoS) (performance) re-
quirements at a measurable VLSI cost which is
favorably compared with alternative on-chip in-
terconnection approaches.
Traditionally, on-chip global communication
has been addressed by shared-bus structures andad-hoc direct interconnections. Non-scalability of
these approaches was discussed in [1,6,9]. How-
ever, modern on-chip buses have evolved to multi-
layered and segmented structures, supporting split
transactions, burst transfers and parallel opera-
tions [12–14]. From several aspects they can be
considered as networks but still, they do not pro-
vide effective spatial reuse of resources and do notutilize packet or wormhole switching associated
with distributed routing and congestion/flow-con-
trol. Therefore, they are inefficient and require
centralized arbitration mechanisms.
Advantages of spatial-reuse packet/wormhole
switched networks were analyzed in comparison
with buses by several authors [1,3,5,8,9]. A hybrid
approach, supporting both NoC and on-chip bu-ses has been proposed in [10]. Switched networks
and techniques for their design have been devel-
oped for computer networks and for multi-pro-
cessor systems [15–21]. However, a unique set of
resource constraints and design considerations
exists for an on-chip environment. As described in
[1,9], memory and computing resources are rela-
tively more expensive on-chip, while relativelymore wires are available. The need to combine
several types of service, such as ‘‘best effort’’ and
‘‘guaranteed throughput’’ was noted by [1,8]. In [9]
it was suggested to support several access para-
digms such as request–response (for compatibility
with bus-based approaches) and connection-ori-
ented services for extended functionality. A mesh
network topology was proposed in [4], a torustopology was proposed in [1], while [6] used a fat
tree. Different routing schemes and router archi-
tectures have been proposed [1,4,6,7,10,11].
Unlike computer networks which are built for
on-going expansion, future growth and standards
compatibility, on-chip networks can be designed
and customized for an a priori known set of
computing resources, given pre-characterizedtraffic patterns among them. These imply that
various components of the network architecture
including addressing fields and QoS classifica-
tion can be modified between implementations.
Moreover, placement of the computing re-
sources can be made simultaneously with the de-
sign of the network. Dynamic changes of links
(link upgrades or failures) are not expected on-chip. Also, highly reliable link operation can
be assumed, at least in the early generations of
NoCs.
Based on the above considerations, given the
cost sensitivity and the need to support various
services and access paradigms, we suggest a
Quality-of-Service NoC (QNoC) architecture and
a process for its design, using the following char-acteristics: The modules are interconnected by a
network of multi-port switches connected to each
other by links composed of parallel point-to-point
lines. The physical layer is optimized to take care
of deep-sub-micron issues such as delay and re-
peater optimization, synchronization, noise im-
munity, etc. The network applies a mesh topology
and employs wormhole packet forwarding withhop-by-hop credit-based backpressure flow-con-
trol (for lossless buffer operation and minimal
buffer requirements). The packets are forwarded
using a static shortest path, X–Y coordinates-
based routing (for minimal routing table opera-
tions, deadlock avoidance and no reordering at
end-points). Packets can belong to different classes
of service and packets of different classes are for-warded in an interleaved manner according to the
QoS definitions (packets priorities). As a typical
guideline we classify system traffic into four com-
mon classes of service: Signaling (replacing inter-
module control signals); Real-Time (representing
delay-constrained bit streams); RD/WR (modeling
short data access) and Block-Transfer (providing
for large data bursts and DMA operations). Wemodel traffic behavior for each class and define the
Quality of Service requirements of each class in
terms of throughput, end-to-end delay and relative
priority. Unlike other wormhole routing systems
these requirements are recorded at all switches and
different packet forwarding is interleaved accord-
ing to the QoS rules. For example a high priority
Signaling packet will pre-empt the transmission ofa long Block-Transfer packet. Similar to [4] we
employ a design process, starting from a generic

E. Bolotin et al. / Journal of Systems Architecture xxx (2003) xxx–xxx 3
ARTICLE IN PRESS
topology and proceeding to a customized network.
The layout of the network is customized and links
bandwidth is allocated according to their relative
load so that the overall utilization of links in the
network is balanced. During customization un-
necessary resources (links, routers and buffers) aretrimmed where possible, resulting in a low cost
customized layout for the specific SoC. Traffic
simulations are used in the cost optimization steps
to ensure that QoS is satisfied. We also introduce a
simple methodology to evaluate the cost in area
and power of the resulting network. The area cost
is based on the total wire length and the amount of
packet switch logic (buffers, tables, etc.), that isestimated by the flip-flop count. The power cost is
based on summation of the traffic that traverses
each wire length and is received by input stages. It
is easy to realize that for a given traffic metric and
network topology, the power consumption will be
reduced by employing shortest path routing and
by the elimination of packets losses within
switches. In that way our design process results inQNoC which meets predefined QoS requirements
from the networking point of view and takes VLSI
costs into consideration by minimizing area and
power of the resulting QNoC.
The rest of this paper is organized as follows:
Section 2 presents the network architecture, Sec-
tion 3 describes the network design process, Sec-
tion 4 discusses simple design examples, andSection 5 provides simulation results for the net-
work examples along with observations and con-
clusions.
1 Since higher noise vulnerability is expected in future
technologies, simple error correction techniques can be applied
in physical, data-link or even higher levels. NoC may be capable
of containing such errors and efficiently isolating them from the
rest of the SoC. These techniques are beyond the scope of this
paper.2 For interpretation of color in Figs. 1–21, the reader is
referred to the web version of this article.3 Simple ‘‘around the block’’ modification is employed where
needed.
2. QNoC architecture
Our QoS network architecture is based on a gridtopology and wormhole packet routing, following
[1,6,7]. Wormhole routing [1,22] reduces latency
and buffer requirements in the routers. Circuit
switching [7] is avoided in our architecture due to
the high cost of establishing and managing circuit
connections. Similarly, store-and-forward routing
techniques [7] are also avoided as they may incur
high buffer requirements and consequently a highpenalty in silicon area of the router. The network is
lossless, and links are assumed reliable so that no
retransmissions are required. 1 Packets traverse the
network along the shortest route, thus minimizing
power dissipation and maximizing network re-
source utilization. The architecture has served as a
platform for developing the QNoC design process
and cost metrics (Section 3), and has been modeledand simulated, as described in Section 4. In this
section we describe the QNoC topology, service
levels, link communications, router design and in-
terface to the system modules of the chip.
2.1. QNoC topology
Networks on chip comprise routers intercon-nected by point-to-point links. Topology can vary
depending on system needs and module sizes and
placement. Fat tree [6], folded torus [1] and regular
mesh [4,7] topologies have been proposed for NoC
(Fig. 1). 2 We propose an irregular mesh topology
as a best match for the typically irregular planar
and rectangular structure of common SoC
floorplans. Each system module is connected to arouter (Fig. 1c) via a standard interface, where the
bandwidth is adapted to the communication needs
of the module. The bandwidth of each inter-router
link is similarly adjusted to accommodate the ex-
pected traffic and fulfill QoS requirements at the
specific link. Link and interface bandwidth is ad-
justable by changing either the number of wires or
the data frequency. In addition, a module may beconnected to the network through more than one
interface.
Routing is performed over fixed shortest paths,
employing a symmetric X–Y discipline whereby
each packet is routed first in an ‘‘X ’’ direction and
then along the perpendicular dimension or vice
versa. 3 This scheme leads to a simple, cost-effec-

Module
(b)(a) (c)
Module
Module Module
Module Module
Module Module
Module
Module
Module
Module
Fig. 1. NoC topologies: (a) regular mesh; (b) folded torus; (c) irregular mesh-custom topology.
Command
TRA
Payload
Fig. 2. Packet format.
Table 1
Interface signals of output port: output direction
Output
signals
Width [bit] Description
Clk 1 Source-synchronous clock
indicating flit transmission
Data_o Parameter Data out of the router
Type 2 Type of flit:
00: IDLE
01: EP––end of packet
10: BDY––packet body
11: FP––full packet
Note: start of packet is implied
by non-idle flit following {EP,
FP} per each SL
SL 2 Flit service level
4 E. Bolotin et al. / Journal of Systems Architecture xxx (2003) xxx–xxx
ARTICLE IN PRESS
tive router implementation. Network traffic is thus
distributed non-uniformly over the mesh links, buteach link�s bandwidth is adjusted to its expected
load, achieving an approximately equal level of
link utilization across the chip.
2.2. QNoC service levels
The principal goal of an on-chip interconnec-
tion network is to provide for all communication
demands of heterogeneous modules within the
chip. A QNoC should replace not only shared
buses but also other types of dedicated inter-
modular wires and interfaces. We identify fourdifferent types of communication requirements
and define appropriate service levels (SL) to sup-
port them: Signaling, Real-Time, Read/Write and
Block-Transfer. Two classes of service were pre-
Router
Module
Moduleor
another router
Fig. 3. The router has up to five links and may connect to
neighbor mesh routers or to chip modules.

outputport
inputport
inputport
outputport
inpu
tpo
rtou
tput
port
outp
utpo
rtin
put
port
Routing,SchedulingSwitching
Fig. 4. Router––data flow.
E. Bolotin et al. / Journal of Systems Architecture xxx (2003) xxx–xxx 5
ARTICLE IN PRESS
viously proposed in this context in [7]: best-effortand guaranteed throughput.
Signaling covers urgent messages and very short
packets that are given the highest priority in the
Fig. 5. Router a
network to assure shortest latency. This service
level is suitable for interrupts and control signals
and alleviates the need for dedicating special, sin-
gle-use wires for them.
Real-Time service level guarantees bandwidth
and latency to real-time applications, such asstreamed audio and video processing. This service
(like all other ones) is packet based (and does not
employ virtual circuits); a certain maximal level of
bandwidth may be allocated to each real-time link
and it should not be exceeded. This is achieved
either by the design of each module or by en-
forcement circuits in the network.
Read/Write (RD/WR) service level provides bussemantics and is hence designed to support short
memory and register accesses.
Block-Transfer service level is used for transfers
of long messages and large blocks of data, such as
cache refill and DMA transfers.
rchitecture.

Table 2
Interface signals of output port: input direction
Input signals Width
[bit]
Description
Buffer_Credit_SL 4 A buffer space for one flit
at each specified service
levels has become available
Buffer_Credit_valid 1 Indicates that
Buffer_Credit_SL lines
carry a valid credit.
Clk
Data_o
Type
SL
BDY FP
Real-Time Signalling
Flit Flit
BDY
Flit
Real-Time
Fig. 6. Tx waveforms: a Real-Time packet is pre-empted by a
single-flit Signaling packet.
Define inter-moduletraffic
Map traffic to gridusing given QNoCarchitecture and
placement
QNoCArchitecture
Perform optimizationto balance utilization,
minimize cost andmeet QoS
Estimate cost
Define modules andconnect them with an
ideal network
Validate or measuretraffic assumptions
using high-levelsystem simulations
Place modules
Fig. 7. QNoC design flow chart.
6 E. Bolotin et al. / Journal of Systems Architecture xxx (2003) xxx–xxx
ARTICLE IN PRESS
A priority ranking is established among the
four service levels, where Signaling is given the
highest priority and Block-Transfer the lowest.
Below we describe a pre-emptive communication
scheduling where data of a higher priority packetis always transmitted before that of a lower service
level (a round-robin is employed within each ser-
vice level). Thus, service levels are simply imple-
mented by means of a priority mechanism.
Additional service levels may be defined if desired,
as long as a priority ranking is adhered to. For
instance, the RD/WR service level may be split
into normal and urgent RD/WR sub-levels.
2.3. QNoC communication
Packets carry routing information, commandand payload. Fig. 2 shows the basic packet format.
The target routing address (TRA) field contains
the address required for routing. The command
field identifies the payload, specifying the type of
operation. The rest is an arbitrary length payload,
including operation-specific control information
such as sender identification.
The packet is divided into multiple flits [21] and
transmitted over the Data_o signals (see Table1).
Flit transfer over the link is controlled by hand-
shake. The flits are classified into the following
types:
• FP (full packet): a one-flit packet• EP (end of packet): last flit in a packet
• BDY (body): a non-last flit
Thus, all but the last flit in a packet are tagged
BDY. The first flit of a packet can be detected as
the first valid flit following either a FP or EP flit
(this identification triggers the routing mecha-
nism). Flit type and service level are indicated onseparate out-of-band control wires (Table 1).
2.4. QNoC routers
Routers connect to up to five links (Fig. 3),
designed for planar interconnect to four mesh
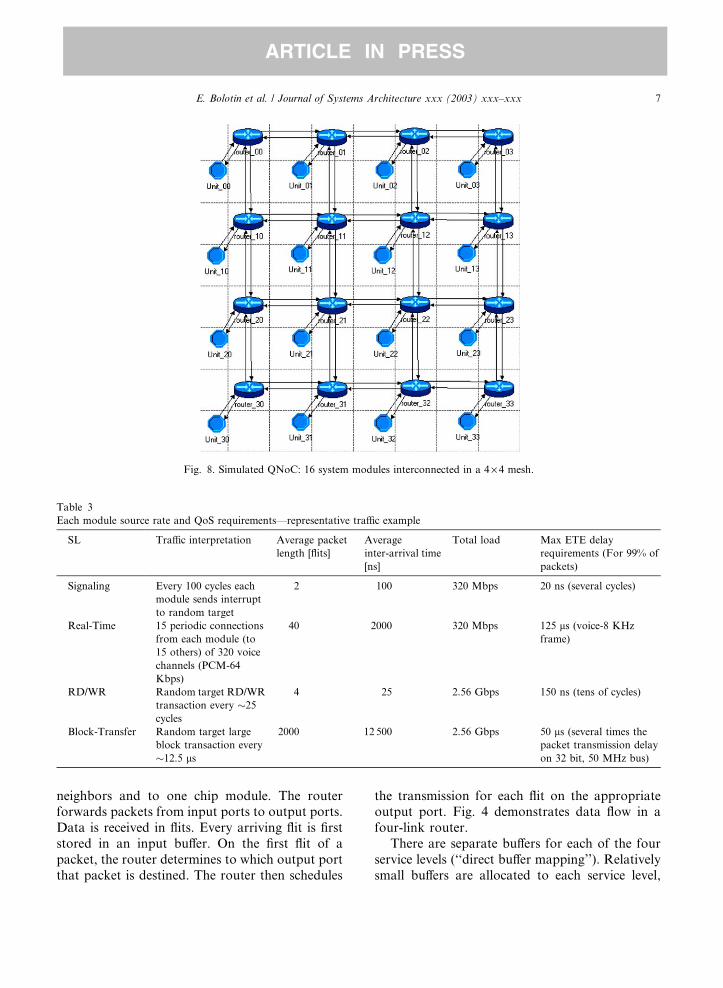
Table 3
Each module source rate and QoS requirements––representative traffic example
SL Traffic interpretation Average packet
length [flits]
Average
inter-arrival time
[ns]
Total load Max ETE delay
requirements (For 99% of
packets)
Signaling Every 100 cycles each
module sends interrupt
to random target
2 100 320 Mbps 20 ns (several cycles)
Real-Time 15 periodic connections
from each module (to
15 others) of 320 voice
channels (PCM-64
Kbps)
40 2000 320 Mbps 125 ls (voice-8 KHz
frame)
RD/WR Random target RD/WR
transaction every �25
cycles
4 25 2.56 Gbps 150 ns (tens of cycles)
Block-Transfer Random target large
block transaction every
�12.5 ls
2000 12 500 2.56 Gbps 50 ls (several times the
packet transmission delay
on 32 bit, 50 MHz bus)
Fig. 8. Simulated QNoC: 16 system modules interconnected in a 4· 4 mesh.
E. Bolotin et al. / Journal of Systems Architecture xxx (2003) xxx–xxx 7
ARTICLE IN PRESS
neighbors and to one chip module. The routerforwards packets from input ports to output ports.
Data is received in flits. Every arriving flit is first
stored in an input buffer. On the first flit of a
packet, the router determines to which output port
that packet is destined. The router then schedules
the transmission for each flit on the appropriateoutput port. Fig. 4 demonstrates data flow in a
four-link router.
There are separate buffers for each of the four
service levels (‘‘direct buffer mapping’’). Relatively
small buffers are allocated to each service level,
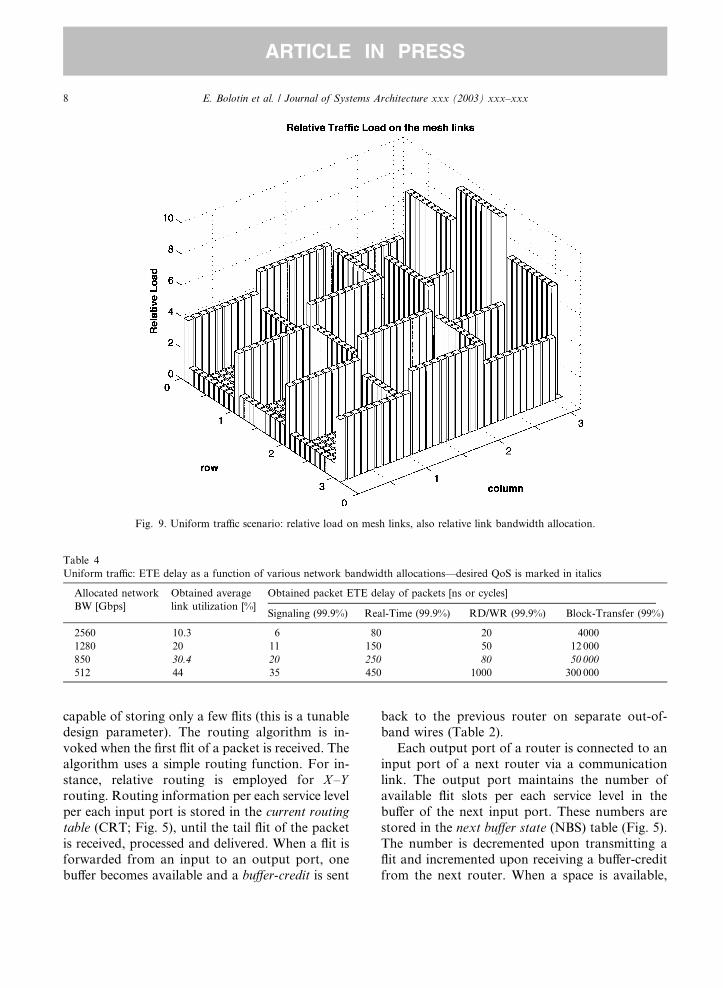
Fig. 9. Uniform traffic scenario: relative load on mesh links, also relative link bandwidth allocation.
Table 4
Uniform traffic: ETE delay as a function of various network bandwidth allocations––desired QoS is marked in italics
Allocated network
BW [Gbps]
Obtained average
link utilization [%]
Obtained packet ETE delay of packets [ns or cycles]
Signaling (99.9%) Real-Time (99.9%) RD/WR (99.9%) Block-Transfer (99%)
2560 10.3 6 80 20 4000
1280 20 11 150 50 12 000
850 30.4 20 250 80 50 000
512 44 35 450 1000 300 000
8 E. Bolotin et al. / Journal of Systems Architecture xxx (2003) xxx–xxx
ARTICLE IN PRESS
capable of storing only a few flits (this is a tunabledesign parameter). The routing algorithm is in-
voked when the first flit of a packet is received. The
algorithm uses a simple routing function. For in-
stance, relative routing is employed for X–Yrouting. Routing information per each service level
per each input port is stored in the current routing
table (CRT; Fig. 5), until the tail flit of the packet
is received, processed and delivered. When a flit isforwarded from an input to an output port, one
buffer becomes available and a buffer-credit is sent
back to the previous router on separate out-of-band wires (Table 2).
Each output port of a router is connected to an
input port of a next router via a communication
link. The output port maintains the number of
available flit slots per each service level in the
buffer of the next input port. These numbers are
stored in the next buffer state (NBS) table (Fig. 5).
The number is decremented upon transmitting aflit and incremented upon receiving a buffer-credit
from the next router. When a space is available,

0 1 2 3 4 5 6 7 80
20
40
60 % of Packets with given ETE (Utilization = 10.3%)
Sig
nal
ing 43% 46%
6.3% 1.8% 1.6% 0.17% 0.77% 0.07% 0.043% 0.014%
0 10 20 30 40 50 60 70 80 900
20
40
60
Rea
lTim
e 37%48%
9.8%1.1% 0.42% 0.9% 0.85% 0.5% 0.77% 0.62%
0 10 20 30 40 50 60 70 80 900
50
100
RD
/WR
99%
0.96% 0.096% 0.018% 0.016% 0.0087% 0.0094% 0.0044%0.00083%0.0012%
0 1000 2000 3000 4000 5000 6000 70000
50
100
ETE(cycles)
Blo
ck T
ran
sfer 80%
11% 2.8% 1.1% 3.3% 0.62% 0.31% 0.21% 0.1% 0.1%
Fig. 10. Uniform traffic: distribution of ETE delay for total QNoC bandwidth of 2560 Gbps (10.3% utilization)––performance is better
than required.
E. Bolotin et al. / Journal of Systems Architecture xxx (2003) xxx–xxx 9
ARTICLE IN PRESS
the output port schedules transmission of flits that
are buffered at the input ports and waiting for
transmission through that output port, as detailed
below.
We describe a simple handshake interface to
each of the links. Other interfaces, such as asyn-
chronous, are also possible. The same interface is
employed whether the link connects to a chipmodule or to another router. The output port
transmits a flit on the rising edge of the link clock
(identifying the flit with a non-idle type, Table 1),
and the input port samples a new flit on the falling
edge. The clock could be replaced by a valid signal,
which toggles only when a flit needs to be trans-
mitted, alleviating the need for an ‘‘idle’’ flit type.
Tables 1and 2 summarize the output and inputsignals of the output port.
We now turn to the mechanics of flit transfer
inside the router. Flits are buffered at the input
ports, awaiting transmission by the output ports.
Flit routing (namely, to which output port each flit
is targeted) is resolved upon arrival of the first flit
of a packet and the output port number is stored
in CRT for the pending flit per each input port and
per each service level. Each output port schedulestransmission of the flits according to the avail-
ability of buffers in the next router, the priority
(namely service level) of the pending flits, and the
packet-based round-robin ordering of input ports
awaiting transmission of packets within the same
service level. The numbers of available flit slots in
the buffers at the next routers are stored in the
NBS tables for each service level at each outputport. Service level priorities are ranked with Sig-

0 2 4 6 8 10 12 14 16 180
20
40
60 % of Packets with given ETE (Utilization = 20%)
Sig
nal
ing
49% 45%
3.4% 1.5% 0.37% 0.71% 0.18% 0.049% 0.017% 0.0017%
0 50 100 150 200 2500
20
40
60
Rea
lTim
e
45% 46%
4.5% 1% 1% 1.1% 0.8% 0.67% 0.05% 0.017%
0 50 100 150 200 2500
50
100
RD
/WR
98%
1.5% 0.19% 0.085% 0.051% 0.036% 0.017% 0.0069%0.0037%0.00062%
0 2000 4000 6000 8000 10000 12000 14000 160000
50
100
ETE(cycles)
Blo
ck T
ran
sfer
63%
21%4.7% 5.7% 2.9% 0.34% 1% 0.56% 0.23% 0.45%
Fig. 11. Uniform traffic: distribution of ETE delay for total QNoC bandwidth of 1280 Gbps (20% utilization)––performance is better
than required.
10 E. Bolotin et al. / Journal of Systems Architecture xxx (2003) xxx–xxx
ARTICLE IN PRESS
naling having the highest priority, Real-Time be-
ing second, RD/WR third and Block-Transfer
ranked last. The present state of round-robin
scheduling is stored in the currently serviced input
port number (CSIP) table for each service level at
each output port (Fig. 5). This number is advanced
when transmission of a complete packet is finished
or if there is nothing to transmit from a particular
input port and service level.
This scheduling discipline implies that a par-
ticular flit gets transmitted on an output port as
long as there is buffer space available on the nextrouter and there is no packet with a higher priority
pending for that particular output port. Once a
higher priority packet appears on one of the input
ports, transmission of the current packet is pre-
empted and the higher priority packet gets
through. Transmission of the lower priority packet
is resumed only after all higher priority packets are
serviced. In the example of Fig. 6, a Real-Time
packet is pre-empted by a Signaling packet. The
network is designed with bounded traffic require-ments in the higher service levels, to avoid star-
vation of RD/WR and Block-Transfer
communications.
2.5. QNoC interface
The network interface connects modules to the
network. It maps a variety of transactions onto thefour structured QNoC service levels. For instance,
it hides the packet switching character of the net-
work when one module needs to access another
using bus and conventional read/write semantics.
This section has presented the QNoC architec-
ture: Simple and efficient routers are intercon-
0 5 10 15 20 250
20
40
60 % of Packets with given ETE (Utilization = 30.4%)
Sig
nal
ing 38%
47%
10%1.9% 1.4% 0.36% 0.66% 0.2% 0.1% 0.047%
0 50 100 150 200 250 300 350 4000
20
40
60
Rea
lTim
e
59%
35%
2.2% 1.4% 0.93% 1% 0.28% 0.017% 0% 0.033%
0 50 100 150 200 250 300 350 4000
50
100
RD
/WR
96%
3% 0.52% 0.2% 0.12% 0.054% 0.032% 0.012% 0.0038% 0.0013%
0 1 2 3 4 5 6 7
x 104
0
50
100
ETE(cycles)
Blo
ck T
ran
sfer
70%
18%6.1% 2.6% 1.1% 0.84% 0.94% 0.31% 0.42% 0.21%
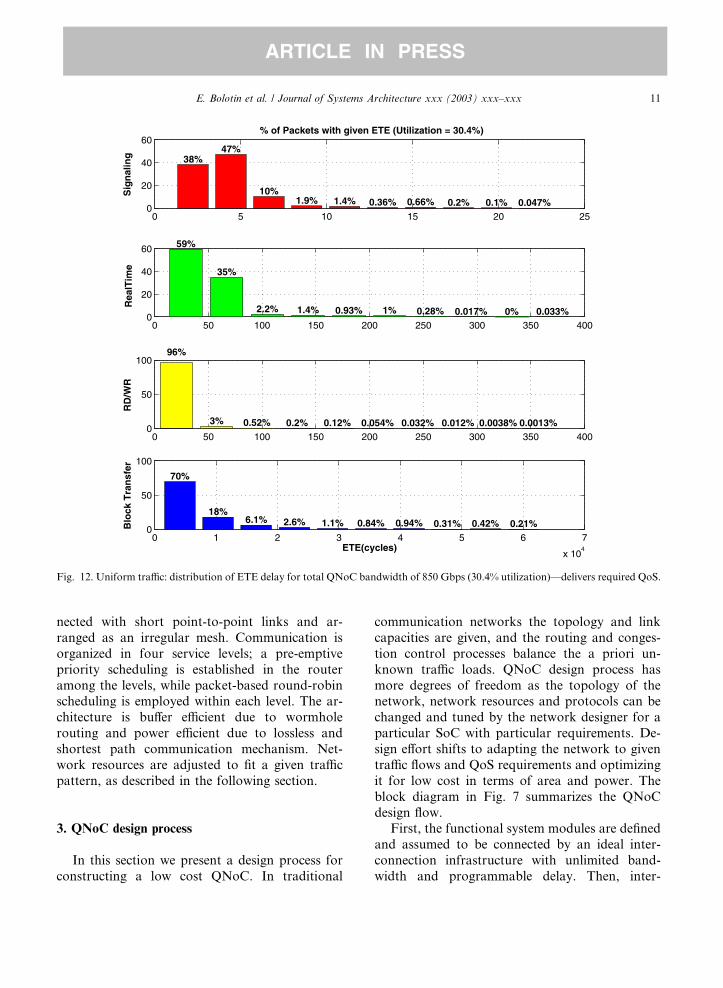
Fig. 12. Uniform traffic: distribution of ETE delay for total QNoC bandwidth of 850 Gbps (30.4% utilization)––delivers required QoS.
E. Bolotin et al. / Journal of Systems Architecture xxx (2003) xxx–xxx 11
ARTICLE IN PRESS
nected with short point-to-point links and ar-
ranged as an irregular mesh. Communication is
organized in four service levels; a pre-emptive
priority scheduling is established in the router
among the levels, while packet-based round-robinscheduling is employed within each level. The ar-
chitecture is buffer efficient due to wormhole
routing and power efficient due to lossless and
shortest path communication mechanism. Net-
work resources are adjusted to fit a given traffic
pattern, as described in the following section.
3. QNoC design process
In this section we present a design process for
constructing a low cost QNoC. In traditional
communication networks the topology and link
capacities are given, and the routing and conges-
tion control processes balance the a priori un-
known traffic loads. QNoC design process has
more degrees of freedom as the topology of thenetwork, network resources and protocols can be
changed and tuned by the network designer for a
particular SoC with particular requirements. De-
sign effort shifts to adapting the network to given
traffic flows and QoS requirements and optimizing
it for low cost in terms of area and power. The
block diagram in Fig. 7 summarizes the QNoC
design flow.First, the functional system modules are defined
and assumed to be connected by an ideal inter-
connection infrastructure with unlimited band-
width and programmable delay. Then, inter-

0 5 10 15 20 25 30 35 40 45 500
20
40
60 % of Packets with given ETE (Utilization = 44%)
Sig
nal
ing
49%43%
4.7% 1.4% 0.62% 0.65% 0.23% 0.081% 0.0092% 0.0017%
0 50 100 150 200 250 300 350 400 450 5000
20
40
60
Rea
lTim
e 37%
50%
6.9%1.7% 1.3% 0.95% 0.72% 0.8% 0.27% 0.05%
0 200 400 600 800 1000 1200 1400 1600 18000
50
100
RD
/WR
83%
11% 3.7% 1.5% 0.63% 0.22% 0.057% 0.038% 0.02% 0.012%
0 0.5 1 1.5 2 2.5 3 3.5 4 4.5
x 105
0
10
20
30
ETE(cycles)
Blo
ck T
ran
sfer
22%
16%
22% 20%
12%
6.1%1.1% 0.14% 0.28% 0.14%
Fig. 13. Uniform traffic: distribution of ETE delay for total QNoC bandwidth of 512 Gbps (44% utilization)––QoS requirements are
not satisfied.
12 E. Bolotin et al. / Journal of Systems Architecture xxx (2003) xxx–xxx
ARTICLE IN PRESS
module traffic is characterized. This characteriza-
tion is conducted by analyzing the interconnected
modules and their traffic specification. To verify
the assumptions or as an alternative way for
characterization, the inter-module traffic is mea-
sured and partitioned into traffic classes using a
high-level multi-module operational simulation.
Similarly, QoS requirements are derived for eachtraffic class by observing the actual performance as
well as evaluating via simulation the effect of de-
lays and throughput. The characterization and
requirements derivation stage should take into
account that QNoC cost will increase if safety
margins are excessive. Once traffic patterns are
specified, modules are placed so as to minimize the
system spatial traffic density.Only after system module placement and inter-
modular communication requirements are deter-
mined, the QNoC can be constructed. The QNoC
architecture is finalized, and architectural param-
eters are set according to the number of modules,
their spatial placement, and the QoS service levels
to be supported. The initial topology is set to a
mesh grid and the required traffic is mapped onto
the mesh grid according to the routing algorithm,
such as X–Y routing. As parts of the grid are notfully utilized, some vertices and links can be
eliminated as shown in Fig. 1c. Once the routing
algorithm is selected, communication paths be-
tween all pairs of modules can be determined and
link bandwidth optimization can be performed.
Average traffic load at each link can be calculated
since routing is fixed and traffic patterns are
known in advance. Link bandwidth can be as-signed proportionally to the calculated load on
that link by varying the number of wires in a link

40 50 60 70 80 90 100 110 120 130 14010
0
101
102
103
104
105
Total traffic load [Gbps]
Mea
n E
TE
del
ay [
cycl
es]
Mean ETE delay (vs. Total traffic load)
SignalingRealTimeRD/WRBlock Tr.
Ut=21% Ut=25% Ut=30% Ut=37% Ut=42%Ut=16%
Fig. 14. Uniform traffic: mean ETE delay of packets at each service level vs. total load, using constant network bandwidth allocation.
E. Bolotin et al. / Journal of Systems Architecture xxx (2003) xxx–xxx 13
ARTICLE IN PRESS
or its frequency. In that way the designer calibrates
the system resources so that average utilization of
all links in the network is approximately equal. At
this point, the average load calculation provides
only relative link bandwidths. To finalize the de-
sign, the QNoC can be simulated and analyzed
more precisely by a network simulator. Actualbandwidth can then be assigned to the links ac-
cording to QoS requirements and the supporting
simulation results. Further optimizations can be
performed: Buffers and routers can be trimmed
where possible while maintaining the required
QoS. The entire design process may be iterated if
hardware cost of the resulting QNoC is too high,
or if other QNoC architectures need to be inves-tigated.
QNoC cost estimation: It is important to esti-
mate accurately the cost of the QNoC, as it di-
rectly influences the cost of the entire system. By
having a good measure of cost, the system archi-
tect can compare different solutions that provide
the same performance and choose the most cost-
effective one. We employ area and power cost
functions, as is common for VLSI systems, by
comparing architectures having the same perfor-
mance (in terms of delay and throughput) andquantifying their area and power requirements.
The cost of QNoC architecture consists of two
main factors: the cost of routers and module in-
terfaces (logic cost), and the cost of wires of the
links that interconnect them. We assume that the
logic and links are designed in an effective way
such that power is consumed only when informa-
tion is flowing through these components (onlywhen logical transitions happen). For power sav-
ing, packets traverse the network over the shortest
path. In addition, no retransmissions of informa-
tion are needed since the transmission over a link

Fig. 15. Non-uniform traffic: relative load on mesh links, also relative link bandwidth allocation.
Table 5
Non-uniform traffic: ETE delay as a function of various network bandwidth allocations––desired QoS is marked in italics
Allocated network
BW [Gbps]
Obtained average
link utilization [%]
Obtained packet ETE delay of packets [ns or cycles]
Signaling (99.9%) Real-Time (99.9%) RD/WR (99.9%) Block-Transfer (99%)
2752 8.2 5 60 20 4500
1376 16.5 10 120 50 13 000
688 33.5 20 270 150 45 000
459 44 35 400 1300 350 000
14 E. Bolotin et al. / Journal of Systems Architecture xxx (2003) xxx–xxx
ARTICLE IN PRESS
is assumed to be reliable 4 and hop-by-hop flow-
control (back pressure) prevents losing or drop-
ping any packet. These facts result in a power ef-
ficient network architecture.
Wire cost: Since the distance between two ad-jacent wires is fixed, the area occupied by link
wires on a chip is proportional to the total wire
length:
4 Or made reliable using error correction.
Costwire-area ¼ A0
X
i2fQNoC linksgW ðiÞlðiÞ ð1Þ
where A0 is the wire pitch, W ðiÞ is the width of link
i (number of wires), and lðiÞ is the length of link i.The dynamic power consumed by wires is pro-
portional to wire length and thus wire length is a
good estimator of power dissipated on wires. Dy-
namic power dissipation in switching circuits is
Pd ¼ CLV 2ddfp ð2Þ

0 1 2 3 4 5 60
20
40 % of Packets with given ETE (Utilization = 8.2%)
Sig
nal
ing
38% 38%
18%
3.5% 1.4% 0.16% 0.67% 0.066% 0.047% 0.0083%
0 10 20 30 40 50 60 700
20
40
60
Rea
lTim
e
26%
42%
22%
4.3% 1.2% 1.2% 0.87% 0.87% 0.85% 0.63%
0 10 20 30 40 50 60 70 800
50
100
RD
/WR
99%
0.53% 0.083% 0.017% 0.0083% 0.0056% 0.0033% 0.0021% 0.00083% 0.00021%
0 500 1000 1500 2000 2500 3000 3500 4000 4500 50000
50
100
ETE(cycles)
Blo
ck T
ran
sfer
71%
18%2.9% 4% 3.7% 0.67% 0.11% 0.11% 0.11% 0.11%
Fig. 16. Non-uniform traffic: distribution of ETE delay for total QNoC bandwidth of 2752 Gbps (8.2% utilization)––performance is
better than required.
E. Bolotin et al. / Journal of Systems Architecture xxx (2003) xxx–xxx 15
ARTICLE IN PRESS
where CL is the load capacitance, Vdd is the supply
voltage and fp is the switching frequency.
Switching frequency of every link is link fre-
quency multiplied by the link utilization. CL is thetotal load capacitance, consisting of wire capaci-
tance ðCwireÞ and gate capacitance of the transistor
driven by that wire ðCgateÞ. We assume that Cgate
can be neglected and the dominant factor is Cwire,
which is directly proportional to the length of the
wire:
Costwire-powerðPdÞ ¼ P0UX
i2fQNoC linksgf ðiÞW ðiÞlðiÞ
ð3Þwhere P0 is the constant coefficient, U is the utili-
zation of the links, f ðiÞ is the frequency of the link
i.
Therefore, total wire length can be a convenient
cost metric when comparing between both power
and area costs of alternative interconnection ar-
chitectures.
Logic cost: Logic cost consists of the cost of therouters and the cost of network interfaces of the
system modules. In all interconnection architec-
tures, a bus or a network, an interface logic must
be implemented. It is beyond the scope of this
paper to evaluate the exact interface mechanisms
that need to be developed. However, it is clear that
in a shared media interconnection (like a bus),
each module interface must accommodate higherspeed bursts of information as compared to a
switched architecture and consequently the cost is
increased. The cost of router is affected by several
parameters: number of ports (#Port), number of

0 2 4 6 8 10 12 140
20
40
60 % of Packets with given ETE (Utilization = 16.5%)
Sig
nal
ing 42% 39%
15%
1.2% 1.4% 0.2% 0.61% 0.13% 0.023%0.0075%
0 20 40 60 80 100 120 1400
20
40
60
Rea
lTim
e
20%
42%
27%
5.4% 1.3% 1.3% 0.92% 0.92% 0.87% 0.72%
0 20 40 60 80 100 120 140 1600
50
100
RD
/WR
98%
1.4% 0.27% 0.069% 0.035% 0.019% 0.012% 0.0054% 0.001% 0.00021%
0 2000 4000 6000 8000 10000 12000 140000
50
100
ETE(cycles)
Blo
ck T
ran
sfer
65%
20%6.1% 6.4% 1.2% 0.79% 0.45% 0.34% 0% 0.22%
Fig. 17. Non-uniform traffic: distribution of ETE delay for total QNoC bandwidth of 1376 Gbps (16.5% utilization)––performance is
better than required.
16 E. Bolotin et al. / Journal of Systems Architecture xxx (2003) xxx–xxx
ARTICLE IN PRESS
service levels (#SL), flit size (FlitSize), buffer sizefor each service level (BufSize). A good estimation
for the area cost of the router is flip-flop count.
Generally the cost of a router is very much archi-
tecture specific. We give an estimate for the cost of
the router in the architecture that was presented in
Section 2.4. The number of flip-flops in router is
dominated by the flip-flops used for storing data
and control information:
#FF ’ #Port � #SL � ½ðFlitSizeþ 2Þ � BufSizeþ log2 ðBufSize � ð#PortÞ
2Þ� ð4Þ
Total logic cost of QNoC is summation of costs of
all routers in the network:
Costlogic-area ’X
i2fRoutersg#FF ðiÞ ð5Þ
4. Design examples
As a simple example of QNoC design for a given
SoC, let us consider an array of 16 communicating
units arranged in a 4 · 4 mesh. Each unit is con-
nected to the QNoC via a router that is a part of the
network (see Fig. 8). The routing mechanism is a
symmetric X–Y routing when the destination x-coordinate is greater than source x-coordinate;otherwise, it is Y –X routing. In that way the traffic
between each pair of nodes in both directions tra-
verses the network on the same routing path. We
assume that links operate at a frequency of 1 GHz,
which is a reasonable assumption for short links at
current technology. We allocate the final link�sbandwidth by adding or trimming wires from it.We define flit size to be 16 bits, and use minimal
buffering requirements––buffers capable of storing

0 5 10 15 20 25 300
20
40
60 % of Packets with given ETE (Utilization = 33.5%)
Sig
nal
ing 45% 41%
11%1.9% 0.49% 0.56% 0.24% 0.077% 0.018% 0.0033%
0 50 100 150 200 250 300 3500
20
40
60
Rea
lTim
e 35%
50%
9.9%1.8% 1.4% 1.3% 0.87% 0.45% 0.017% 0.017%
0 50 100 150 200 250 300 350 4000
50
100
RD
/WR
93%
5% 1.2% 0.46% 0.23% 0.11% 0.046% 0.014% 0.0064% 0.0023%
0 1 2 3 4 5 6
x 104
0
20
40
60
ETE(cycles)
Blo
ck T
ran
sfer 52%
26%
13%4.7% 1.5% 1% 0.78% 1% 0.34% 0.45%
Fig. 18. Non-uniform traffic: distribution of ETE delay for total QNoC bandwidth of 688 Gbps (33.5% utilization)––Delivers required
QoS.
E. Bolotin et al. / Journal of Systems Architecture xxx (2003) xxx–xxx 17
ARTICLE IN PRESS
two flits at each input port (so small Signaling or
Real-Time packets will not be stretched beyond a
single stage and create excessive blocking). The
delay of packets in the network consists of the de-
lay of the links and queuing delay in the network.
We neglect the delay of routers logic, which shouldadd only a few cycles to the overall delay. During
the design process we assign traffic characteristics
to the communicating units and simulate the
QNoC behavior. OPNET [23] was chosen as a
simulation framework for performing this task.
OPNET provides a convenient tool for hierarchical
modeling of a network, including processes (state
machines), network topology description and sim-ulation of different traffic scenarios. The QNoC
architecture described in Section 2 was fully mod-
eled in the OPNET environment and simulated for
two scenarios as follows:
4.1. Uniform traffic scenario
Each unit communicates uniformly with allother units in the system. Each unit contains four
traffic sources that correspond to four classes of
system traffic: Signaling, Real-Time, RD/WR and
Block-Transfer. Each source creates packets with
specific distribution of packet size and packet inter-
arrival time. Representative traffic source rates for
each service level and its interpretation are sum-
marized in Table 3. According to that benchmarkwe obtain average traffic load from each module in
the system of about 5.76 Gbps, or a total load of
0 5 10 15 20 25 30 35 40 450
20
40
60 % of Packets with given ETE (Utilization = 44%)
Sig
nal
ing 42% 40%
14%2.2% 0.67% 0.53% 0.31% 0.11% 0.022% 0.0042%
0 50 100 150 200 250 300 350 400 450 5000
20
40
60
Rea
lTim
e
33%
48%
12%2.3% 1.5% 1.3% 1.1% 0.5% 0.033% 0.05%
0 200 400 600 800 1000 1200 1400 1600 1800 20000
50
100
RD
/WR
83%
11% 3.5% 1.4% 0.63% 0.37% 0.21% 0.059% 0.033% 0.009%
0 0.5 1 1.5 2 2.5 3 3.5 4 4.5
x 105
0
10
20
30
ETE(cycles)
Blo
ck T
ran
sfer 24%
16% 15%19%
12%5.6% 6.5%
2% 0.15% 0.3%
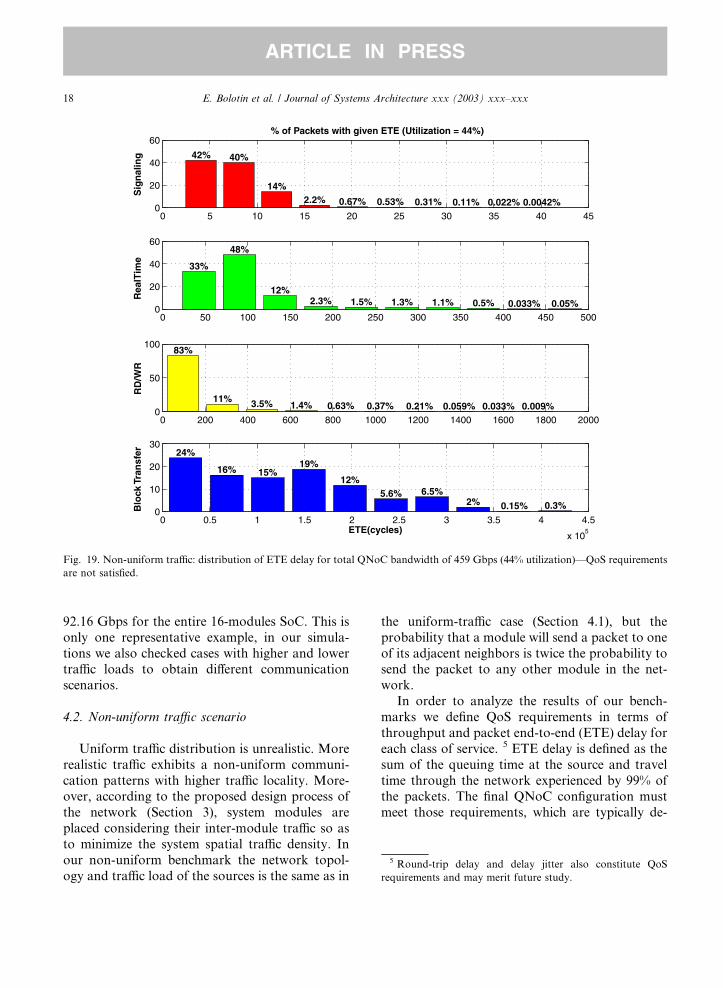
Fig. 19. Non-uniform traffic: distribution of ETE delay for total QNoC bandwidth of 459 Gbps (44% utilization)––QoS requirements
are not satisfied.
5 Round-trip delay and delay jitter also constitute QoS
requirements and may merit future study.
18 E. Bolotin et al. / Journal of Systems Architecture xxx (2003) xxx–xxx
ARTICLE IN PRESS
92.16 Gbps for the entire 16-modules SoC. This is
only one representative example, in our simula-
tions we also checked cases with higher and lowertraffic loads to obtain different communication
scenarios.
4.2. Non-uniform traffic scenario
Uniform traffic distribution is unrealistic. More
realistic traffic exhibits a non-uniform communi-
cation patterns with higher traffic locality. More-over, according to the proposed design process of
the network (Section 3), system modules are
placed considering their inter-module traffic so as
to minimize the system spatial traffic density. In
our non-uniform benchmark the network topol-
ogy and traffic load of the sources is the same as in
the uniform-traffic case (Section 4.1), but the
probability that a module will send a packet to one
of its adjacent neighbors is twice the probability tosend the packet to any other module in the net-
work.
In order to analyze the results of our bench-
marks we define QoS requirements in terms of
throughput and packet end-to-end (ETE) delay for
each class of service. 5 ETE delay is defined as the
sum of the queuing time at the source and travel
time through the network experienced by 99% ofthe packets. The final QNoC configuration must
meet those requirements, which are typically de-

40 50 60 70 80 90 100 110 120 130 14010
0
101
102
103
104
105
106
Total traffic load [Gbps]
Mea
n E
TE
del
ay [
cycl
es]
Mean ETE delay (vs. Total traffic load)
SignalingRealTimeRD/WRBlock Tr.
Ut=18% Ut=24% Ut=28% Ut=34% Ut=41% Ut=44%
Fig. 20. Non-uniform traffic: mean ETE delay of packets at each service level vs. total traffic load from each source using constant
network bandwidth allocation.
E. Bolotin et al. / Journal of Systems Architecture xxx (2003) xxx–xxx 19
ARTICLE IN PRESS
fined by the system architect. In our example, we
have chosen the maximum ETE delay of a Sig-
naling packet to be no more than 20–30 ns, for
Real-Time packets we require ETE delay to be theorder of magnitude of 125 ls, since our Real-Time
is voice connection and it should not be more than
several frames of a 8 KHz clock, and for RD/WR
packets we allow ETE delay �100 ns. In order to
obtain QoS requirements for Block-Transfer
packets we consider an alternative solution of a
typical system bus that traverses the chip and in-
terconnects all modules on the chip, the bus widthis 32 bits and it operates at 50 MHz so that its total
bandwidth is 1.6 Gbps. Just transmission time of
one Block-Transfer packet (32 000 bits) on such a
bus lasts 20 ls. Hence we allow ETE delay of a
Block-Transfer packet in the QNoC to be no more
than several times its transmission time on a typ-
ical system bus, see Table 3.
5. Observations and conclusions
5.1. Uniform traffic scenario results
We used the design process described in Section
4 and applied a uniform traffic load. The modules
were placed in a full mesh. Relative traffic load on
all the links of the mesh is shown in Fig. 9. Row
and column coordinates represent x–y indices of
the network routers, for instance point (0,0) cor-
responds to router_00 at Fig. 8, and bar columns
between them represent inter-router links relativeload. For example, links (0,0)fi (1,0) and
(2,0)fi (3,0) have the smallest load in the system,
denoted by 1 unit. Other link loads are measured
relative to the load on those two links. The highest
relative load in the mesh is on link (1,3)!(2,3),
reaching 9.3. This load distribution originates
from traffic distribution and module locations

Fig. 21. Relative cost of three compared interconnection architectures (system bus, QNoC and point-to-point interconnect) in terms of
area and power for uniform traffic design example. Relative cost of QNoC is one and the cost of system bus and PTP interconnect is
measured relatively to QNoC costs.
20 E. Bolotin et al. / Journal of Systems Architecture xxx (2003) xxx–xxx
ARTICLE IN PRESS
(which are symmetric in our case) and from X–Ycoordinates routing, as described in Section 4.
Next, link bandwidth was allocated according
to the ratios shown in Fig. 9. That allocation led to
balanced utilization of the mesh links. We appliedthe uniform traffic load described in Table 3 (92.16
Gbps) and simulated several total network band-
width allocation levels. ETE delay was measured
at each destination module according to packet
service levels. ETE delay was measured in clock
cycles of the link (since we assume that links op-
erate at 1 GHz, each cycle represents a delay of 1
ns). The total network bandwidth allocations andobtained results are summarized in Table 4 and
can be viewed in Figs. 10–13.
In the first two cases (Figs. 10 and 11) the net-
work is underutilized and delivers better perfor-
mance than required. By reducing bandwidth (and
thus reducing cost) we obtain a network that op-
erates at 30.4% utilization (Fig. 12). It can be seen
that this network configuration delivers the re-quired QoS. Specifically, 99.9% of the Signaling
packets arrived with ETE delay of less than 20 ns
(as required), 99.9% of Real-Time packets arrived
with ETE delay of less than 250 ns (over-per-
forming, we only required less than 125 ls), 99% of
RD/WR packets arrived with ETE delay of less
than 80 ns (as required) and 99.9% of Block-
Transfer packets arrived with ETE delay of less
than 50 ls. That is 2.5 times the transmission time
of this packet on an assumed system bus. If we try
to reduce the cost any further, the network will not
be able to satisfy our QoS requirements as
shown in Fig. 13, where requirements for delay ofSignaling and Block-Transfer packets are not
met.
In order to estimate the cost of QNoC systems
we use the cost metrics described in Section 3.
Total wire-length of the links considering data and
control wires is �4 m. The cost of the routers is
estimated by flip-flop count which results in �10 K
flip-flops. Power dissipation is calculated using Eq.(3): PNoC;uniform ¼ 1:2P0.
Another important issue is network behavior in
terms of delay as a function of traffic load. We
chose a fixed network configuration and bandwidth
allocation and applied various traffic loads by re-
ducing and expanding packet inter-arrival time for
each service level. Fig. 14 shows the mean ETE
delay of packets at each service level as a functionof traffic load in the network. One can observe that
while the traffic load is growing, ETE delay of
Block-Transfer and RD/WR packets grows expo-
nentially, but the delay of delay-constrained traffic
(Real-Time and Signaling) remains nearly con-
stant. Since network resources are kept constant,
network utilization grows when higher traffic load
is applied (from 16% to 42% in the figure).

E. Bolotin et al. / Journal of Systems Architecture xxx (2003) xxx–xxx 21
ARTICLE IN PRESS
5.2. Non-uniform traffic scenario results
Results for non-uniform traffic are shown in
Fig. 15. It can be observed that the ratios between
links loads are smaller than in the uniform sce-nario (maximum link load ratio is 7.25, vs. 9.3 in
uniform) and the overall traffic distribution is
more balanced because of the higher locality in
network traffic.
Again, we applied the non-uniform traffic load
described in Section 4.2 (92.16 Gbps) and simu-
lated several total network bandwidth allocation
levels. ETE delay was measured at each destina-tion module according to packet service levels. The
total network bandwidth allocations and obtained
results are summarized in Table 5 and can be
viewed in Figs. 16–19.
It can be seen that the network was underuti-
lized in the first two cases (8.2% and 16.5% utili-
zation). Thus we reduced network capacity
further, and it can be seen that the networkoperating at 33.5% utilization (Fig. 18) was deliv-
ering the required QoS. In particular, 99.9% of
Signaling packets arrived with ETE delay of less
than 20 ns (as required), 99.9% of Real-Time
packets arrived with ETE delay of less than 270 ns,
99.9% of RD/WR packets arrived with ETE de-
lay of less than 150 ns and 99% of Block-
Transfer packets arrived with ETE delay less than45 ls. That is 2.3 times the transmission time of the
same packet on a system bus. If we try to reduce
the cost any further, the network will not be able
to satisfy our QoS requirements, for example
for Signaling and Block-Transfer packets (see
Fig. 19).
The fact that network traffic in the non-uniform
scenario is more local makes it possible to providethe required QoS using less network resources
compared with the uniform scenario. Indeed, total
wire length of the links considering data and
control wires in this case is �3.5 m, compared with
4 m in the uniform scenario. This is a 13% re-
duction in the wire cost of the links. Power dissi-
pation is calculated using Eq. (3): PNoC;non�uniform ¼1:15P0, compared with 1.2P0 in the uniform trafficcase, which is 4% reduction in power dissipation.
Fig. 20 shows the mean ETE delay of packets at
each service level as a function of traffic load in the
network. These results are similar to the uniform
traffic case.
5.3. Comparison with alternative solutions
In this section we compare the cost of QNoCarchitecture in terms of area and power with the
cost of alternative interconnection solutions that
provide the same QoS: A shared bus and dedicated
point-to-point (PTP) links. We assume a 12 · 12mm chip comprising 16 modules.
5.3.1. Shared bus
A shared bus in the uniform traffic load designexample would have to deliver total traffic load of
92.16 Gbps. Let us also assume that this bus op-
erates at 50 MHz and that it will deliver the re-
quired QoS under utilization of 50% (a very
optimistic assumption for the given QoS require-
ments). In order to be competitive with QNoC
performance, such a bus would require at least
3700 wires. The bus has to connect to all moduleson the chip, and as a result its length would be �25
mm. In practice, shared system buses are multi-
plexed and there are actually two unidirectional
buses. Even if we neglect the significant cost of the
multiplexing logic, we obtain a total wire length of
�180 m for such a bi-directional bus, as compared
with the 4 m of the QNoC. Power dissipation on
such a bus is calculated using Eq. (3) again:Pbus;uniform ¼ 4:5P0, as compared with �1.2P0 of theQNoC.
5.3.2. Dedicated point-to-point links
We assume that each module is connected to all
other modules by dedicated wires. We further as-
sume that point-to-point links operate at 100
MHz. In order to provide the required perfor-mance (several times the transmission time of
Block-Transfer packet on a system bus), the PTP
link should consist of �6 wires (five data wires and
one control wire) and should operate with 80%
utilization. Total length of wires that interconnect
all 16 modules on chip is �11.4 m. Power dissi-
pation is Pptp;uniform ¼ 0:9P0.The comparison of the alternative interconnec-
tion architectures for the uniform traffic example is

22 E. Bolotin et al. / Journal of Systems Architecture xxx (2003) xxx–xxx
ARTICLE IN PRESS
summarized in Fig. 21. It should be noted that the
cost of QNoC is several times lower than the cost
of bus, both in terms of power dissipation and wire
length. The PTP area is also higher than that of the
QNoC. Theoretically, a PTP interconnect should
consume the same power as the QNoC, becausethe same traffic is transmitted along the same
Manhattan distances and no power is wasted on
idle links. However, because of smaller overhead
of control wires, the power dissipation of point-to-
point solution is slightly lower than in QNoC.
For the non-uniform example, the cost of the
bus remains the same, because in the bus each
transaction is propagated all over the chip and itcannot benefit from higher traffic locality. QNoC
cost is reduced (13% reduction in our example)
because it benefits directly from traffic locality
since less traffic has to be transferred for longer
distances. PTP interconnect will also benefit from
traffic locality, but its cost remains higher.
Bus and PTP solutions cost will rise rapidly in
more complicated design examples (with morecommunicating modules). Buses have no parallel-
ism, hence capacitance will grow, frequency will
degrade and many more wires will be needed to
compensate for the frequency degradation and to
satisfy the growing communication demands. The
same is true for PTP solution: wire cost will grow
quadratically with the number of modules and
the power cost will be similar to the power cost ofthe QNoC. On the other hand, QNoC is more
scalable and it benefits from the parallelism
and spatial reuse of the network links and from
the fact that links will still be short and cheap
and would be still able to operate at a high fre-
quency.
6. Conclusions
In this paper we have defined Quality of Service
(QoS) and cost model for communications in
Systems on Chip (SoC), and have derived related
Network on Chip (NoC) architecture and design
process. SoC inter-module communication traffic
has been classified into four classes of service:Signaling (for inter-module control signals), Real-
Time (for delay-constrained bit streams), RD/WR
(for short data access) and Block-Transfer (for
large data bursts). The proposed Quality-of-Ser-
vice NoC (QNoC) design process analyzes the
communication traffic of the target SoC and de-
rives QoS requirements (in terms of delay andthroughput) for each of the four service classes. A
customized QNoC architecture is then created by
modifying a generic network architecture. The
customization process minimizes the network cost
(in area and power) while maintaining the required
QoS.
The generic network is based on a two-dimen-
sional planar mesh and fixed shortest path (X–Ybased) multi-class wormhole routing. Once com-
munication requirements of the target SoC have
been identified, the network is customized as fol-
lows: The SoC modules are placed so as to mini-
mize spatial traffic density, unnecessary mesh links
and switching nodes are removed, and bandwidth
is allocated to the remaining links and switches
according to their relative load so that link utili-zation is balanced. The result is a low cost cus-
tomized QNoC for the target SoC which
guarantees that QoS requirements are met.
A 16-module example SoC has been presented
and analyzed. We have considered both uniform
and non-uniform traffic patterns. In each case we
have computed the corresponding QoS require-
ments, and have demonstrated how an appro-priate network (with uniform link utilization but
non-uniform bandwidth allocation) can be de-
rived.
The proposed QNoC has also been compared
to the shared bus and point-to-point interconnect
alternatives. We have shown that the QNoC ar-
chitecture requires a much shorter total wire length
than the two other options, and while being on parwith a point-to-point architecture in terms of
power, it clearly outperforms shared buses.
Acknowledgements
We are grateful to Intel for the support of our
research project. We also would like to thank the
E. Bolotin et al. / Journal of Systems Architecture xxx (2003) xxx–xxx 23
ARTICLE IN PRESS
anonymous reviewers for their useful comments
and suggestions.
References
[1] W.J. Dally, B. Towles, Route packets, not wires: on-chip
interconnection networks, DAC 2001, June 18–22, 2001,
Las Vegas, Nevada, USA.
[2] M. Sgroi, M. Sheets, A. Mihal, K. Keutzer, S. Malik, J.
Rabaey, A. Sangiovanni-Vincentelli, Addressing the sys-
tem-on-a-chip interconnect woes through communication-
based design, in: Design Automation Conference, DAC
�01, June 2001.
[3] L Benini, G.D. Micheli, Networks on chips: a new SoC
paradigm, IEEE Computer 35 (1) (2002) 70–78.
[4] S. Kumar, A. Jantsch, J.-P. Soininen, M. Forsell, M.
Millberg, J. Oberg, K. Tiensyrja, A. Hemani, A network on
chip architecture and design methodology, in: Proceedings
of the IEEE Computer Society Annual Symposium on
VLSI, 2002 (ISVLSI.02).
[5] A. Hemani, A. Jantsch, S. Kumar, A. Postula, J. Oberg, M.
Millberg, D. Lindqvist, Network on a chip: an architecture
for billion transistor era, in: Proceeding of the IEEE
NorChip Conference, November 2000.
[6] P. Guerrier, A. Greiner, A generic architecture for on-chip
packet-switched interconnections, in: Design, Automation
and Test in Europe Conference and Exhibition 2000,
Proceedings, 2000, pp. 250–256.
[7] E. Rijpkema, K. Goosens, P. Wielage, A router architec-
ture for networks on silicon, in: Proceedings of Progress
2001, 2nd Workshop on Embedded Systems.
[8] K. Goossens, J. van Meerbergen, A. Peeters, P. Wielage,
Networks on silicon: combining best-effort and guaranteed
services, in: DATE 2002, Design Automation and Test
Conference, March, 2002.
[9] A. Andrei Radulescu, K. Goossens, in: S. Bhattacharyya,
E. Deprettere, J. Teich (Eds.), Communication Services for
Networks on Silicon Domain-Specific Processors: Systems,
Architectures, Modeling, and Simulation, Marcel Dekker,
2003.
[10] P. Wielage, K. Goossens, Networks on silicon: blessing or
nightmare? Euromicro Symposium on Digital System
Design (DSD 2002), Dortmund, Germany, September
2002.
[11] W.J. Bainbridge, S.B. Furber, Chain: a delay insensitive
chip area, Micro IEEE 22 (5) (2002) 16–23.
[12] AMBA Specification, Arm Inc, May 1999.
[13] The CoreConnect Bus Architecture, IBM, 1999.
[14] D. Wingard, MicroNetwork-based integration of SOCs, in:
Proceedings of the 38th Design Automation Conference,
June 2001.
[15] C.H. Sequin, R.M. Fujimoto, X-tree and Y-components,
VLSI architecture, Prentice Hall International, 1983, pp.
70–78.
[16] J. Rexford, J. Hall, K.G. Shin, A router architecture for
real-time communication in Multicomputer networks,
IEEE Transactions on Computers 47 (10) (1998).
[17] S.S. Mukherjee, P. Bannon, S. Lang, A. Spink, D. Webb,
Compaq Computer Corp., The alpha 21364 network
architecture, IEEE Micro (January–February) (2002) 26–
35.
[18] W.J. Dally, C.L. Seitz, The torus routing chip, Distributed
Computing (1986) 187–196.
[19] InfiniBandTM Architecture Specification, vol. 1, Release
1.0, October 24, 2000.
[20] C.B. Stunkel, J. Herring, B. Abali, R. Sivaram, A new
switch chip or IBM RS/6000 SP systems, in: Proceedings
of the 1999 Conference on Supercomputing, January
1999.
[21] W.J. Dally, A VLSI Architecture for Concurrent Data
Structures, Kluwer Academic Publishers, 1987.
[22] L.M. Ni, P.K. McKinley, A survey of wormhole routing
techniques in direct networks, IEEE Computer 2 (1993)
62–75.
[23] OPNET Modeler, www.opnet.com.
Evgeny Bolotin received his B.Sc. inElectrical Engineering from the Tech-nion in 2000. Currently he is pursuinghis graduate studies in Electrical En-gineering from the Technion. His re-search interests are Network on Chip,VLSI Architectures and ComputerNetworks. Between 1998 and 2002, hewas with Infineon Tel-Aviv DesignCenter, where he served as a VLSIdesign engineer developing communi-cation Systems on Chip.
Israel Cidon is a Professor in the Fac-ulty of Electrical Engineering at theTechnion––Israel Institute of Tech-nology and the head of the Center forCommunication and InformationTechnologies. He holds a B.Sc. andD.Sc. in Electrical Engineering fromthe Technion (1980 and 1984 respec-tively). His research interests are in thefield of converged networks, wire lineand wireless network architectures,quality of service and distributed al-gorithms. Between 1985 and 1994, hewas with by IBM Thomas J. Watson
Research Center NY, where he served as the Manager of theNetwork Architecture and Algorithms group, leading researchand implementations of converged multi-media wide area andlocal area networks. In 1994 and 1995, he was manager ofHigh-Speed Networking at Sun Microsystems Labs, CA, wherehe founded Sun�s first networking research group and leadprojects in ATM fast signaling and switch architecture.He was afounding editor for the IEEE/ACM Transactions on Net-working and Editor for Network Algorithms for the IEEETransactions on Communications. He was the recipient of theIBM Outstanding Innovation Awards for his work on thePARIS project and topology update algorithms (1989 and 1993respectively). He has authored over 120 journal and conferencepapers and holds 15 US patents.

24 E. Bolotin et al. / Journal of Systems Architecture xxx (2003) xxx–xxx
ARTICLE IN PRESS
Ran Ginosar received his B.Sc inElectrical Engineering and ComputerEngineering from the Technion in1978, and his PhD in Electrical Engi-neering and Computer Science fromPrinceton University in 1982. Heworked at AT&T Bell Laboratories in1982–1983, and joined the Technionfaculty in 1983. He was a visiting As-sociate Professor with the Universityof Utah in 1989–1990, and a visitingfaculty with Intel Research Labs in1997–1999. He co-founded four com-panies in the areas of electronic imag-
ing, medical devices, and wireless communications. He serves asthe head of the VLSI Systems Research Center at the Technion,and his research interests include VLSI architecture, asyn-chronous logic, electronic imaging, and bio-chips.
Avinoam Kolodny received his D.Sc. inElectrical Engineering from the Tech-nion in 1980. He worked on silicontechnology development and on designautomation at Intel Corp., in Israeland in California. His research inter-ests include VLSI design and CAD.