&qp p- &&a, 3/3-&6 - pollution prevention regional...
TRANSCRIPT
3
i
I
THE IMPACT OF DISPOSING HOUSEHOLD CLEANING PRODUCTS
IN WASTEWATER TREATMENT SYSTEMS
Prepared for
THE SOAP AND DETERGENT ASSOCIATION New York, New York 10016
26 March 1996
&Qp p- &&A, 3/3-&6 Daniel E. Edwards, Ph.D. ' b ate Project Manager
Prepared by
ROY F. WESTON, INC. Fate and Effect Laboratory
254 Welsh Pool Road Lionville, Pennsylvania 1 934 1 - 1345
Work Order Number 0582 1-005-00 1

.
TABLE OF CONTENTS
Section
1 . EXECUTIVE SUMMARY ......................................................................................... 1
2 . INTRODUCTION ........................................................................................................ 2
3 . WASTEWATER TREATMENT SYSTEMS ........................................................... 3
3.1. 3.2. Septic Tanks ....................................................................................................... 6 3.3. 3.4.
Publicly Owned Wastewater Treatment Works (POTW) .................................. 4
Concentrations of Product Ingredients in Wastewater ..................................... 10 Patterns of Disposal ......................................................................................... 12
4 . REVIEW OF METHODS TO MEASURE TOXICITY TO WASTEWATER TREATMENT MICROORGANISMS .................................................................... 13
4.1. Consumption of Oxygen .................................................................................. 14
4.1.1. OECD 209 ............................................................................................ 14 4.1.2. BOD,,, ................................................................................................... 15 4.1.3. Other Respirometric Methods .............................................................. 16
Production of Anaerobic Gases ........................................................................ 16 Removal of a Reference Compound ................................................................ 17 Wastewater Treatment Simulation ................................................................... 18
4.2. 4.3. 4.4.
5 . CASE STUDIES RELEVANT TO SEPTIC TANK MICROORGANISMS ....... 18
5.1. Yang etul . (1979) ............................................................................................ 19 5.2. Vaishnav and McCabe (1 996) .......................................................................... 20 5.3. Gross (1987) ..................................................................................................... 21 5.4. BooMand. et al . (1992) ..................................................................................... 23 5.5. Summary of Case Studies ................................................................................ 24
6 . CONCLUSIONS ........................................................................................................ 26
7 . REFERENCES ........................................................................................................... 27 L
8 . FIGURES ................................................................................................................... 3 0
.. 11 Find Version
LIST OF TABLES
Table Page
1.
2.
3.
4.
Summary of state regulations on minimum septic tank capacities. ..................................... 7
Impact of two cleaning products on gas production by anaerobic sludge. (Vaishnav and McCabe, 1996) ........................................................................................... 21
Table 3. Results of field study on impact of cleaning products on septic tank coliforms. (Gross 1987) ...................................................,...................................................................23
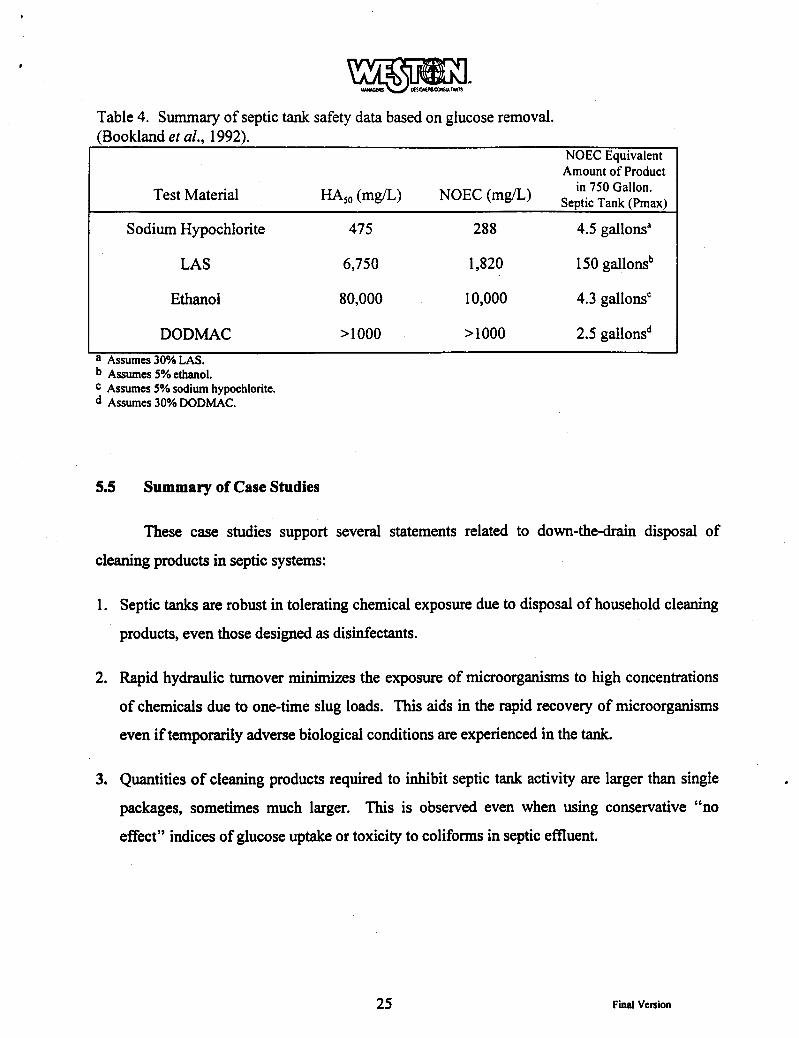
Summary of septic tank safety data based on glucose removal. (Bookland et al. 1992) ....................................................................................................... 25
LIST OF FIGURES
Fieure Pape
1. Response of unacclimated methanogens to an anionic surfactant. (From Yang, et al., 1979) ................................................................................................... 30
2. Response of anaerobic filter to an anionic surfactant. (From Yang, et al., 1979) ............. 31
iii Find Version
SECTION 1
EXECUTIVE SUMMARY
Biological wastewater treatment can be impaired by inhibitory concentrations of
chemicals %re in the influent wastewater. The concern has been expressed that household
cleaning products can reach these inhibitory concentrations and, therefore, should be disposed
by means other than down-the-drain. The objective of this paper is examine the validity of this
concern by reviewing the relevant biological characteristics of wastewater treatment, predicting
maximum concentrations of household cleaning products in wastewater, and listing the
laboratory procedures used to determine the safety of substances to wastewater treatment
microorganisms.
Publicly Owned Wastewater Treatment Works (POTW) accept community-wide
household wastewater along with commercial (and often some industrial) wastewater. POTW
are generally designed to accept 100 gallons of wastewater per resident per day and their
capacity is measured in millions of gallons per day (MGD). In this situation, occasional
cleaning product disposal by a small percentage of households would be attenuated by dilution.
Product ingredient concentrations in P O W influent wastewater tend to equilibrate around an
average concentration that can be predicted from the total volume of products sold in the
serviced district.
Approximately 20-25% of US households use on-site septic tank systems to treat their
wastewater. In septic tanks dilution of disposed cleaning products is initially limited to the
volume of the septic tank itself, although the short hydraulic retention time (HRT) of 24-48 hours
will wash out contaminated water in a matter of days. Because of limited dilution and the
potential for increased sludge carry over from damaged septic tanks to clog drainage fields, the
scenario of short-term toxicity to septic tank microorganisms due to cleaning product disposal
appears to present the highest risk.
Toxicity to wastewater treatment microorganisms is conservatively assayed in the
laboratory by standard tests examining microbial activities such as consumption of oxygen,
production of anaerobic gases, andor removal of a readily biodegradable reference compound.
1 Find Version

These types of tests are considered to be conservative because inhibition of these activities does
not necessarily translate into wastewater treatment failure or sludge carryover from septic tanks.
However, if the concentration of the test substance is maintained below the No Observed Effect
Concentration (NOEC) in these screening level tests, this is powerful evidence that no toxicity
will occur in the wastewater treatment process. In special cases, wastewater treatment simulators
or laboratory-scale septic tanks may be used to determine the impact of a test substance on unit
process operation.
There are relatively few published studies examining the impact of disposing household
chemicals in septic tanks. Four case studies examining the impact of household chemicals with anti-microbial properties on septic tank microorganisms are reviewed as part of this work. Case
studies support the idea that these household chemicals can be disposed in whole-package
quantities with little or no observed effect on microbial activity and septic tank operation.
SECTION 2
INTRODUCTION
Living microorganisms are key to biological wastewater treatment processes. As with
any living system, wastewater treatment organisms require food and favorable environmental
conditions. Optimization of these conditions for wastewater treatment microorganisms will
result in efficient waste removal. A biologically adverse environment could be created by
releases of toxic concentrations of substances into influent water. This may result in the
inhibition of microorganisms possibly resulting in wastewater treatment interference or failure.
In severe cases of bacterial loss, the wastewater treatment units may need to be restarted with
new inoculum or the microorganisms may require a significant period of recovery to rebuild
populations. In any case, the wastewater treatment capability of the system may be
compromised for a period of time. Frequent upsets or chronic inhibition due to low levels of
toxicity may lead to long term poor performance of wastewater treatment units.
2 Final Version

The majority of failures in publicly owned treatment works (POTW) are caused by
mechanical failures, hydraulic deficiencies, lack of maintenance, and interference by undesired
microorganisms. When upsets are caused by toxicity, the cause is usually large slug doses of
chemicals from industrial sources (Hiinel 1988). The concern has been raised that household
cleaning products may cause toxic upsets to wastewater treatment microorganisms in POTW
and household septic tanks, especially in cases where whole containers of product are disposed
by pouring down the drain.
The purpose of this literature review is to evaluate the impact of disposing cleaning
products down the drain on wastewater treatment processes. First, wastewater treatment
processes will be reviewed briefly to provide a background. Patterns of cleaning product
disposal will be discussed, especially in terms of dilution, to identify the wastewater treatment
process most likely to be impacted by cleaning product disposal. Finally, case studies using
“worst case” assumptions will be reviewed to determine whether disposal of cleaning products
have been found to upset wastewater treatment biological processes.
SECTION 3
WASTEWATER TREATMENT SYSTEMS
As of 1992, 75.5% of the United States population is connected to publicly owned
wastewater treatment works (US Bureau of the Census, 1993). The remaining population utilizes
on-site treatment such as septic tanks, cesspools, chemical toilets, or no treatment at all. The
following sections briefly describe treatment processes in order to provide a context for the
disposal of cleaning product ingredients.
3 Final Version
3.1 Publicly Owned Wastewater Treatment Works (POTW)
POTW are facilities designed to treat wastewater on a community level. Typically, these
systems are designed to treated 100 gallons per day per capita of the serviced customers
(Benefield and Randall, 1980). For example, for a moderate sized facility designed for a
population of 60,000 people, the minimum capacity would be 6 million gallons per day (MGD)..
Wastewater comes from a multitude of residential, institutional, commercial and industrial
sources.
POTW treatment processes are generally divided into three categories: primary, secondary, and tertiary. Primary treatment refers to a series of initial treatment steps subjected to
the wastewater entering the plant. The first step in primary treatment consists of coarse
screening to remove large objects and a grit chamber where the flow is slowed sufficiently to
settle dense particles such as sand and gravel. A primary clarifier is next, which is a large
quiescent tank where suspended solids that settle to the bottom as sludge and grease that floats to
the surface are removed. Effluent from the primary clarifier exits though overtlows and is
conveyed to secondary treatment. In the past, many plants would chlorinate this effluent and
discharge without further treatment. Modem wastewater engineering practices and water quality
regulations have made this latter practice unusual.
The primary goal of secondary treatment is the removal of biochemical oxygen demand
(BOD) and the oxidation of ammonium (NH,'). These goals are accomplished using aerobic
biological treatment, most commonly in the activated sludge or trickling filter configurations.
The following description of aerobic biological treatment is from a paper by Rittmann (1987).
The most common methods of aerobic treatment are the activated-sludge and the trickling filter
processes. Although each performs the same oxidation reactions and accumulates similar microorganisms, they differ in the manner in which cells are retained. In the activated-sludge
process, microorganisms must accumulate into relatively large aggregates, called flocs. Because
they are much larger and more dense than single bacterial cells, the flocs can settle out in a
quiescent settler after they exit the aeration tank. After settling, most of the settled cell mass is
collected and some of the cell mass is returned to the aeration tank to allow reproduction and
.
4 Final Version

subsequent regeneration of healthy microorganisms for the biological treatment process. In
trickling filter systems, the cell mass is retained directly in the filter; it is attached to fixed, solid
surfaces. This attached cell mass is called a biofilm. Organic contaminants and NH,' removal,
oxygen use, new cell mass growth, and biofilm retention all occur in the trickling filter. The
wastewater moves from the trickling filter to a settler to improve the quality of the effluents, but
the settler is not used for the return of cell mass.
The effluent from secondary treatment is commonly released to a receiving water.
However, more stringent treatment may occasionally be required. In this case, advanced
secondary or tertiary treatment may be applied. Advanced secondary or tertiary treatment may
employ further biological processes or include one or more physicallchemical steps including the
chemical precipitation, ion exchange, mechanical filtration, carbon adsorption, ozonation,
ultraviolet disinfection, chlorination, or other processes. The end product of tertiary treatment is
a high quality potable or near potable water.
One of the major byproducts of biological wastewater treatment is sludge. The major
sources of sludge are: settled and floating materials from primary clarifiers, waste activated
sludge from settling basins, and sloughed sludge from trickling filters. Sludge handling and
disposal represents a major part of the wastewater treatment process. A variety of options are
available for sludge disposal, for example they may be anaerobically digested, landfilled, applied
to agricultural land, incinerated, or dried and used as fertilizer. These steps may be used alone or
in combination.
The advantages of pretreating sludge by anaerobic digestion are the further
biodegradation of adsorbed contaminants, reduced sludge mass, destruction of pathogens,
destruction of plant seeds, and reduction of nuisance odors. The following discussion of sludge
and anaerobic digestion is summarized from Benefield and Randall (1980). Primary sludge
produced during the treatment of municipal wastewater consists primarily of solid particles of a
predominately organic nature, whereas secondary sludge consists primarily of excess biomass
generated as a result of organic removal in the biological process. Raw sludges of both types are
composed mainly of water with a solids content of 0.5 to 5.0% depending upon the origin of the
5 Final Version

solids and the method of removal. The end products of anaerobic sludge digestion are methane,
carbon dioxide, and new bacterial cells created by strictly anaerobic bacteria. The digested
sludge can then be disposed by the means mentioned earlier. The supernatant is generally high
in nutrients due to organic materials solubilized from the sludge. This liquid may be sent back
through the aerobic system for treatment.
3.2 Septic Tanks
The large majority of on-site wastewater treatment systems are septic tank systems (EPA
1987). In contrast to POTW’s, most septic tank systems receive wastewater from single-family
residences, although some are designed for multiple dwelling residences and commercial
business. Septic tank systems gained widespread usage in the United States during the 1940’s
and 1950’s in both rural and suburban settings. Septic tank design and construction is regulated
according to state specifications. Minimum septic tank capacities are summarized on a state-by-
state basis in Table 1. In summary, 28 states require the minimum usable septic tank volume to
be in the range of 750-900 gallons. A total of 18 states require a G m u m of 1000 gallons.
Three states are regulated on a county or district basis. One state (Louisiana) allows a minimum
500 gallon septic tank for one-bedroom dwellings, but even in that case, the typical septic tank
would be expected to be larger since the primary design criteria for septic tank volume is 2.5
times the estimated daily flow.
A large amount of effort was expended during the 1950’s on research to refine the design
and management of septic systems. Most of the techniques learned during this period have stood
the test of time and, except for the introduction of plastic tanks, there have been few additional
modifications. Several of the historic references on septic tanks have been included in this paper
in order to illustrate how tong some of these practices have been known. The following sections
include general information about septic tanks taken from these sources: Mackenzie 1950,
Weibel, et al. 1954, Canter and b o x 1986, and devillien 1987.
6 Find Version
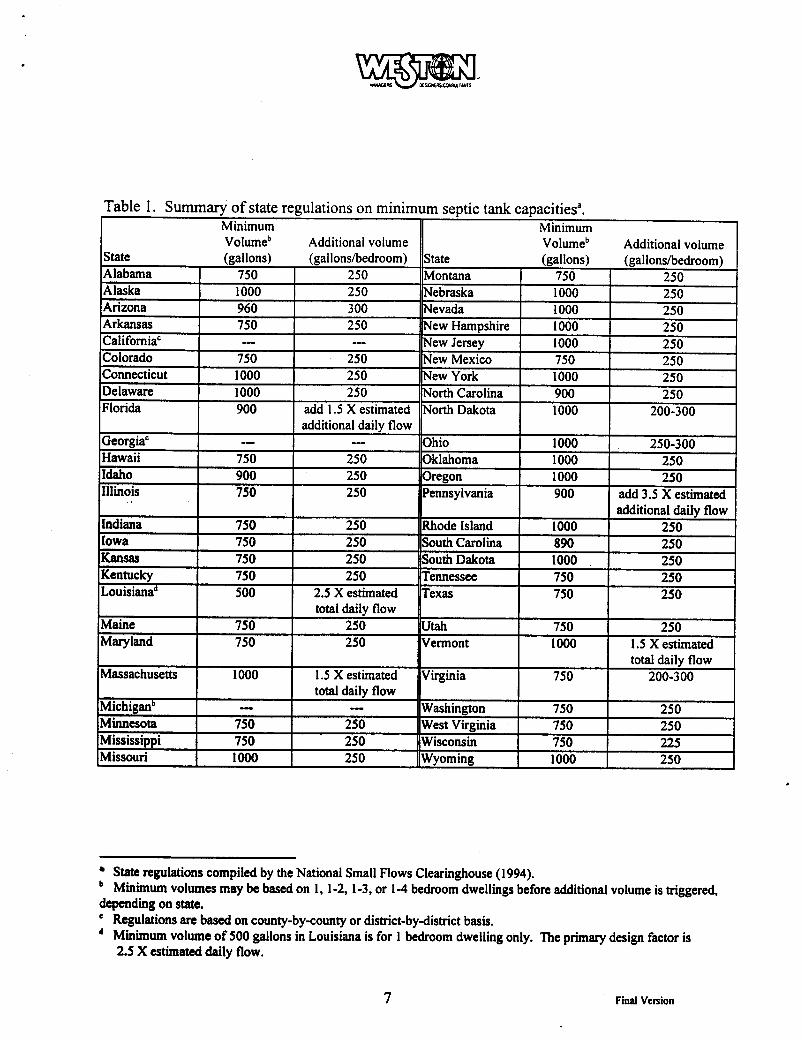
State regulations compiled by the National Small Flows Clearinghouse (1994).
depending on state. Minimum volumes may be based on 1, 1-2, 1-3, or 1-4 bedroom dwellings before additional volume is triggered,
Regulations arc based on county-by-county or district-by-district basis. Minimum volume of 500 gallons in Louisiana is for 1 bedroom dwelling only. The primary design factor is 2.5 X estimated daily flow.
7 Find Version

A septic tank system is typically composed of two unit processes: 1) the septic tank; 2)
the absorption field. Both processes must work properly for the septic system to adequately treat
household waste water.
The primary purpose of a septic tank is to separate solids from the wastewater. The
decreased solids loading to the tile field results in an extended tile field life. The septic tank is
made of concrete, brick, or reinforced plastic. Steel tanks had been used historically, but have
gone out of favor due to corrosion problems. Plastic tanks are currently the most popular
because of their light weight and resistance to corrosion. The septic tank is designed to hold
household wastewater for a hydraulic retention time (HRT) of at least 24 hours. A septic tank may have one, two, or more compartments connected in series by submerged openings. The
advantage of compartmentalization is that it reduces solids carryover into the absorption field
during peak flows. This is most important for multi-household septic systems since a large
amount of household wastewater flow (45%) usually occurs within a peak four-hour period
(de Villiers 1987). The inlet to a septic tank is designed to dissipate energy from the flowing
water by having a reduced slope (I -2% maximum) for at least 10 meters prior to the septic tank.
To M e r reduce the disturbance of the liquid within the septic tank, the inlet tube discharges
below the liquid level in the septic tank.
Wastewater entering the septic tank separates into three distinct layers according to
relative density. The top layer is a floating scum composed primarily of biosolids, fats, oils and
grease. The bottom layer contains sludge and any other settled materials. The middle layer is
composed of relatively clarified water. Effluent is drained fiom the middle layer into the
absorption field by a submerged outlet tube. The septic tank must be vented to the surface to
reduce the accumulation of gases produced during anaerobic biological processes.
Limited biological treatment also occurs in the septic tank by anoxic/anaerobic processes.
Treatment of the aqueous phase is limited due to a short HRT. The rate of sludge build-up is
more rapid than digestion; therefore, it is necessary to remove sludge and scum by pumping the
tank out every few years to prevent solids from accumulation to the point where they begin to
wry over into the absorption field. However, digestion of solids can significantly reduce the
8 Final Version
rate of sludge build-up (Truesdale and Mann, 1968), effectively extending the periods between
sludge removal. Failure to routinely remove sludge may result in the carryover of solids and
possible clogging and failure of the absorption field.
An absorption field is typically an area of soil containing a system of perforated drain
pipes (also called tiles) usually surrounded by gravel to improve water dispersion. The pipes
must be located below the frost line, but in a biologically active aerobic zone. The absorption
field receives the effluent from the septic tank and distributes it into the soil. Normal soil
microorganisms and physicakhemical processes treat the water. Site selection is very important
for absorption fields. Soils exhibiting low permeability, shallow soils over restrictive layers,
high water tables, etc. are unsuitable for typical absorption fields and site-specific altemative
systems may be necessary.
Assuming that a septic system is designed and installed properly (tank is proper size, soil
drainage conditions are good, etc.), the most common failure of septic systems is clogging of the
absorption field (Mitchell 1976). This failure is quickly recognized by the homeowner due to
back up of sewage or gurgling of pipes in the house, ponding of wastewater andor unusually
lush vegetative growth in the yard near the septic system. Decreases in soil permeability have
been shown to be directly proportional to the suspended solids of the septic tank effluent
(Mackenzie 1950). The most common cause of high suspended solids in septic tank effluent is
failure to routinely pump out excess sludge from the septic tank. Failed absorption fields may
need to be reinstated, often (at high cost) in another location. Since septic tanks are primarily
designed for solids separation, chemical induced reduction of anaerobic respiration will have
little effect on wastewater treatment and may not reasonably be expected to cause direct failure
of the system. Chemicals concentrated in the sludge layer can reduce the digestion rate, causing
more rapid sludge accumulation. Reduced sludge digestion necessitates more frequent clean-
outs or a greater risk of absorption field clogging.
In the short term, harsh chemical slug loading can disrupt the settling process or cause
sludge bulking, leading to rapid clogging of the drainage field. This phenomenon has been
reported in some old literature to occur from large doses of caustic septic tank additives such as
9 Final Venion

sodium hydroxide (Mackenzie 1950). According to one report, the addition of 25 pounds of
sodium hydroxide caused previously granulated sludge to bulk into the consistency of heavy
motor oil (Weibel et al. 1954). Reports of septic tank failure due to such extreme measures
should not be confused with the disposal of relatively minute amounts of ingredients in
household cleaning products.
3.3 Concentrations of Product Ingredients in Wastewater
Consumer products are not composed of single chemicals. Household cleaning products
are generally formulations of active ingredients, a carrier (such as water), and additives which
improve mixing and application or otherwise enhance the chemical performance. Following
disposal, each component of these mixtures pursues its individual fate in the environment.
Since certain household cleaning products are designed to have anti-microbial properties, the
active ingredients providing these properties would logically present the greatest risk of
inhibiting residential wastewater treatment biological processes.
The microbial toxicity of cleaning product ingredients should be evaluated in the context
of typical and worst case exposure concentrations under normal use and disposal practices.
Some cleaning products, such as hand dish washing detergents, will enter the disposal system
on a daily basis in small quantities. Others will follow disposal of washwaters on a weekly
basis. Pouring an entire package of a cleaning product down the drain represents the worst case
scenario.
In the case of POTWs, overall fluctuations in concentrations due to routine household use
and disposal would be expected to be dampened by the presence of many POTW users. Because
of the damping effect that occurs in POTWs, the disposal of a single container of household
cleaning product under a worst case scenario would not impact the operation of the treatment
works.
A simple mathematical method to predict the wastewater concentrations of consumer
product ingredients was developed by Holman (1981). This method uses general assumptions
about per capita product and water usage to provide an estimate of average product ingredient
10 Final Version

*
concentration in wastewater. This estimate is considered to be conservative since it assumes that
all of the product is disposed down the drain and none is consumed during use or disposed by
other routes. The concentration of a product ingredient in municipal wastewater can be estimated
by the following equation:
X * P C,, =- Y * Q
Where: C,, = concentration of product ingredient in municipal wastewater (mg/L).
X = quantity of product marketed (mg/day)
P = product ingredient fraction in product (% by weight + 100)
Y = population of market area (number of people)
Q = per capita wastewater flow rate (Llday).
The quantities X and P are available to the manufacturers of the products and Y is
available through census data. The quantity Q is variable according to geographic region and
water use patterns. For estimation purposes, the per capita flow of 400 L/day is generally used
for United States estimates (Cowan et al. 1992). More precise flow data may be obtained for
specific wastewater treatment plants by consulting their records.
The general product ingredient category of surfactants may be used as a general example
to illustrate the application of equation 1. Surfactants are key ingredients in almost all cleaning
product applications including laundry detergents, dishwashing detergents and drying and
antispotting products, and hard surface cleaners. Over 1 billion kilograms (9.8 million tons) of
total non-soap surfactants were sold in the United States for use in household cleaning product
formulations in 1992 (United States Intemational Trade Commission 1994). No other single
group of cleaning product ingredients would be expected to exceed the concentration of
surfactants in average household wastewater. Assuming the 1992 United States population of
260 million people produces wastewater at a rate of 400 L/day per capita, the average
concentration of total surfactants calculated by equation 1 is 26 mg surfactant per liter of
wastewater. This is a conservative calculation since some surfactant may biodegrade in sewers
and some are used in products which are not typically disposed down the drain, such as
11 Final Version
automotive or agricultural cleaning products. The result of this calculation is consistent with the
high end of the ranges of surfactant concentration in residential community wastewater reported
in reviews by Swisher (1987) and Srinivasarao et al. (1992).
In cases of on-site wastewater treatment, such as septic tanks, the lack of dilution fiom
other households precludes dampening of high concentrations during periods of peak usage or
disposal events. The dampening in this case is due only to the wastewater coming from other
uses in the household. Maximum ingredient concentrations due to disposal of unused product
into septic tanks can be more directly calculated. For example, if a liquid cleaning product
contains 10% (w/v) of an ingredient, disposal of one gallon into a 1000 gallon septic tank would
lead to a maximum concentration of the ingredient of 100 mg/L in the aqueous phase, assuming
the septic tank is completely mixed. Subsequent household water use would dilute and flush out
this material creating lower concentrations. This type of disposal into a septic tank can
reasonably be expected to represent the worst case scenario in terms of concentrations of
cleaning product ingredients in a wastewater treatment system.
3.4 Patterns of Disposal
In order to understand the frequency of this worst-case scenario the question remains:
how often are cleaning products disposed without usage? In order to answer this question, SDA
(NPD Group, Inc., 1995) recently commissioned a market research group to survey 20,000
randomly selected US households. The following points from the summary of findings of the
study are relevant to this report:
Among the 13,697 returned surveys (68.5%):
0 8% reported disposing at least one unused cleaning product within the past 3 months.
0 23% reported using septic systems.
0 There was no difference in disposal patterns between those who used septic systems and those who used sewer systems.
12 Final Version

0 Among the 8% who reported disposing products:
0 The average number of products disposed over the three month period was 2.43.
0 67% disposed of product by leaving it in the container and placing it in the trash, 10% were poured down the drain. No other single disposal pathway accounted for more than 1 % of disposal.
0 Liquids in bottles were the most frequently disposed products overall (40%) and were also the most frequent product to be poured down the drain. Solids, aerosols and gels were generally disposed in the container and placed in the trash.
The survey did not attempt to estimate the percent of the product remaining in the
container when disposed, but it does point out that down-the-drain disposal is performed
infrequently. This is particularly true for higher volume products which tend to be used up rather
than dumped out (NPD Group, Inc., 1995). Nonetheless, cleaning products are occasionally
poured down the drain, therefore, manufacturers routinely address the impact of cleaning
products on wastewater treatment systems. Section 4 briefly describes the major methods used
for this purpose.
SECTION 4
REVIEW OF METHODS TO MEASURE TOXICITY TO WASTEWATER
TREATMENT MICROORGANISMS
The objective of wastewater treatment microbial toxicity tests is to determine the
concentration at which a compound impairs the ability of the microorganisms to treat
wastewater. If this concentration is greater than the expected exposure concentrations, then the
compound is not expected to have a negative impact on the activity of wastewater treatment
microorganisms. In general, there are three major categories of testing approaches: effects on
respiration (or gas production from anaerobic microorganisms); effects on removal of other
compounds; and effects on performance during wastewater treatment simulations. These
effects can be examined in both aerobic and anaerobic systems.
13 Final Version

4.1 Consumption of Oxygen
4.11 OECD209
The only test currently specifically addressing wastewater treatment microorganism
toxicity in US or European regulatory guidelines is OECD procedure number 209: “Activated
sludge, respiration inhibition test” (OECD 1984). This test is designed as a simple screening
tool to assess the impact of a chemical on the overall respiration rate of activated sludge.
A solution containing an excess of nutrients is added to a beaker with microbial inoculum
and various volumes of test substance stock solution. The microbial inoculum (seed) is
activated sludge fiom a municipal facility treating primarily domestic wastewater. Controls
without test substance are used in the test design to measure the background activity of the
sludge. An inhibitor of respiration (3,5-dichlorophenol) is included as a negative control to
assess sludge sensitivity to chemical inhibition. The 50% inhibition concentration of the
standard inhibitor must be within a specified range in order for the test to be considered valid.
Each mixture of sludge, nutrient solution, test solution, and dilution water is aerated for a
set period of time (usually 3 hours). The set-up of each vessel is offset over time so that data
can be collected after the precise incubation time. At the appropriate time for each vessel, the
rate of dissolved oxygen (DO) consumption is measured. The “inhibitory effect” is defined by
comparison to duplicate controls using the following equation:
I - 2R, x IO0 = percent inhibition . - 4, +&
where:
Rs = oxygen consumption rate (mg/O,/L/Hour) at tested concentration of test substance
R c l = oxygen consumption rate (mg/02/L/Hour), control 1
Rc2 = oxygen consumption rate (mg/O,/L/Hour), control 2
The percent inhibition is plotted as a function of test substance concentration. The 50%
inhibition concentration is determined fiom the resulting graph.
14 Final Version

OECD 209 provides
inoculum such as would
a measure of the overall impact of a chemical on a high strength
be encountered in activated sludge mixed liquor. This high
concentration of sludge could buffer toxicity by adsorption of the test compound onto sludge
solids. The high overall respiration rate of a variety of species consuming the abundant carbon
could also mask some toxicity to individual species. The inhibition that is masked in this test
could potentially become important in biodegradation tests using more dilute inoculum.
4.12 BOD,,,
A test somewhat similar to the OECD test has been presented by Marks (1973). This test
is a variation of the classic biochemical oxygen demand (BOD) test and is known as the BOD
microbial toxicity test or BOD,,,. In the BOD,,, test a relatively dilute seed is prepared from
domestic activated sludge. The seed is defined as 5 mL of a sludge culture that is fed daily with
domestic sewage and whose “oxygen consumption rate is in the range of 1 to 3 mg/liter/h.”
The seed is combined with a series of volumes of a test substance stock solution (or mixed
waste stream of interest) in standard BOD bottles with a single concentration of a reference
compound (glucose). The remaining volume in the BOD bottles is filled with dilution water
and aerated to saturate the water with oxygen. The concentration of glucose is designed to be
sufficient for the microorganisms to deplete one-half of the dissolved oxygen (DO) present in
the mixture if no inhibition is encountered. Each BOD bottle is incubated at 2OoC for three days
without further aeration. The DO is then measured in each bottle and plotted as a h c t i o n of
test substance concentration. The lowest concentration of test substance that causes a reduction
in the oxygen consumption rate compared to a control is defined as the “threshold inhibition
level.” Concentrations of the test substance below the threshold are considered to be acceptable
for wastewater treatment systems. A higher concentration of sludge is suggested if data are
needed within a time h e shorter than 3 days.
15 Final Version
4.13 Other Respirometric Methods
Numerous variations on methods measuring the impacts of chemicals on oxygen
consumption have been published as biodegradation tests (Swisher 1987). Many oxygen
consumption tests utilize respirometers. A respirometer is a device that continuously monitors
oxygen consumption and/or carbon dioxide generation in a test vessel. Respirometers can be
used to measure real-time effects of substances on biological respiration in a continuously
aerated system (Eckenfelder 1980). Unfortunately, respirometric tests using sophisticated
apparatus have historically been expensive relative to standard BOD systems and require
significant skill on the part of the analyst. Recent technical advances in respirometers and
computerization are leading to wider usage of these instruments in BOD and biodegradation
applications (Mahendraker and Viraraghavan 1995). /
4.2 Production of Anaerobic Gases
Anaerobic biological treatment is a major unit process in wastewater treatment
throughout the world, primarily in the form of sludge digesters and household septic tanks. Since appreciable quantities of oxygen are not consumed (or present) in anaerobic systems,
respiration tests based on dissolved oxygen are not applicable. In the place of oxygen
consumption, gas production voIume is the most common measurement of anaerobic activity.
The validity of gas production as an indicator of anaerobic activity is contingent on the presence
of an active methane producing (methanogenic) consortium of bacteria. The test system must be
completely protected from exposure to oxygen, which is toxic to anaerobic bacteria producing
methane. Oxygen contamination in the test system can also lead to negative gas pressure due to
absorption of oxygen into the test liquid. Examples of procedures used to evaluate anaerobic gas
production are provided later in this paper as part of case studies reported by Yang et al. (1979)
and Vaishnav and McCabe (1 996).
16 Final Version

4.3 Removal of a Reference Compound
An alternative to respiration measurements is measuring the effect of a chemical on the
removal of a reference compound. The matrix containing the test chemical and a microbial seed
(usually activated sludge, but anaerobic inoculum such as septage can be used to assess
anaerobic systems) is analyzed for the reference compound after a defined exposure period. The
test compound may be one that is known to be biodegradable or chosen to address specific
concerns.
A general test for inhibition of activated sludge using removal of ''C-glucose is described
by Larson and Schaeffer (1 982). These authors recognized that respiration measurements could
have limitations such as being non-specific, relatively time consuming, difficult to interpret for
biodegradable compounds, and potentially misleading by masking modes of toxicity such as
uncoupling of oxidative phosphorylation. The suggested alternative to respiration
measurements is removal of ''C-glucose from solution following the exposure of activated
sludge to a potential toxicant for 15 minutes.
The sludge is obtained from a P O W receiving primarily domestic wastewater, aerated,
and used within two hours of collection. Aliquots of the sludge are placed in open beakers on a
rotary shaking table with various concentrations of test substance stock solutions. After a 5
minute equilibration period, an aliquot of ''C-glucose solution is added to each mixture.
Equilibration is continued for an additional 15 minutes, then terminated by the addition of
hydrochloric acid. Samples of each mixture are filtered and assayed for *4C activity by liquid
scintillation counting (LSC) and the percent removal of the ''C-glucose is calculated.
An initial range finding test is followed by a definitive test with a narrower range of
concentrations. The concentration of chemical inhibiting glucose removal by 50% (ICso) is
calculated and normalized to the control response by using an empirical non-linear regression
model.
17 Final Version

4.4 Wastewater Treatment Simulation
Laboratory-scale wastewater treatment simulations performed to determine the
treatability of a test substance can also provide important information on the longer term impact
of chemicals in wastewater treatment. Simulation tests such as continuous activated sludge
(CAS), porous pot (ASTM, draft method), and coupled units (OECD 303A, 1984), can provide
insight into potential problems that can occur at wastewater treatment facilities. Simulation
tests assessing the impact of cleaning product ingredients on septic tanks have been reported in
literature (Pearson et al., 1991; Holman and Hopping, 1980; Truesdale and Mann, 1968).
Potential operating problems can include sustained foaming, accumulation of the test substance
on solid surfaces, etc. These factors are generally included as subjective “visible adverse
effects” along with quantitative measurements of general unit performance such as chemical
oxygen demand (COD) removal, total suspended solids (TSS) removal, etc. Unfortunately, in
order to determine the toxic concentration of a test substance, the concentration must be
increased until the unit fails, a procedure usually avoided during costly treatability tests.
Therefore, failure concentrations are not usually identified (except by accident), but at least safe
operation at the nominal concentration can be demonstrated.
SECTION 5
CASE STUDIES RELEVANT TO SEPTIC TANK MICROORGANISMS
It is generally recognized that normal use levels of household cleaning agents and
disinfectants do not impair septic tank fhction (Gross 1987, Truesdale and Mann 1968). There
have been few studies in the published research literature specifically examining the impact of
disposing quantities of household chemicals on wastewater treatment systems, although the
procedures listed in Section 4 are commonly conducted by manufacturers to provide data for
safety assurance of new or reformulated products.
18 Final Version

5.1 Yangetal. 1979
In a report entitled “Recovery of Anaerobic Digestion after Exposure to Toxicants” Yang
et al. (1 979) provide a detailed literature review on previously published data relating toxicity of
various chemicals to anaerobic wastewater treatment microorganisms. The authors also
performed their own experiments examining the toxicity of over 30 chemicals representing
heavy metals, inorganics, various organic chemicals common to industry, and antibiotics. This study was undertaken to test the previously widely held perception that methane fermentation
cannot tolerate chronic or slug doses of toxicants. an
“anaerobic toxicity assay (ATA)” and an anaerobic filter assay. The ATA was designed as a
short term test to determine the impact of single doses of chemical into an unacclimated system.
The anaerobic filter assay was used in a continuous flow mode that allowed long term operation
and acclimation by microorganisms.
Two types of assays were used:
The inoculum sludge for each test was originally sampled fiom a municipal digester, then
maintained in a laboratory digester for an extended period (years) with acetic acid as a sole
source of carbon. In the ATA test, fi@ mL of this sludge was anaerobically added to a serum
vial, followed by 2000 mg/L of acetate as acetic acid or 8,000 or 16,000 mg/L of acetate as
calcium acetate. Test substances were added at various concentrations to the bottles and gas
production was measured and compared to controls without test substances added. This method
bears some similarity to the anaerobic biodegradation screening test listed by the USEPA
(1 994).
The anaerobic filter assay was a flow-through system in which a feed solution was passed
through a packed bed of 1 cm diameter gravel in a plexiglass tube. The feed solution was a
nutrient salt solution containing acetate at 2000 mg/L or 3300 mg/L. The feed solution inflow
rate approximated a one day hydraulic retention time. Gas production and COD removal were
measured over time from each filter unit.
Under an ATA test using unacclimated sludge (Figure l), 25 mg/L of an anionic
surfactant (Trade name “WXN”, produced by American Cyanamid Corporation) reduced gas
production to about 80% of the control. At 50 mg/L, the gas production rate gradually declined
19 Final Vcnion
for the first 10 days then subsequently increased. At 100 mg/L, the initial gas production rate
was about 20% of the control. Subsequently, it decreased and later showed acclimation after 20
days. Gas production ceased after 10 days at 12% of the control volume in the system with 250
mg/L of anionic surfactant. Note that in this ATA system, the mixed liquor suspended solids
(MLSS) were measured at 600 mg/L, significantly lower than typical anaerobic digesters where
solids typically range on the order of 1-5% (w/v) which is equivalent to 10,000-50,000 mg/L.
The low MLSS level could have exhibited toxicity at lower chemical concentrations than would
be seen in actual systems. In the anaerobic filter system, continuous additions of 15 and
30 mg/L of the anionic surfactant did not produce sustained inhibition (Figure 2). However, 60
mg/L for 28 days produced a gradual decrease in gas production until the surfactant additions
were stopped (Figure 2). Gas production remained -50-60% of the earlier maximum levels
until beginning to improve approximately 30 days after the last surfactant addition. The study
was terminated before complete recovery was evident.
The test systems used by Yang et al. (1979) were not exactly representative of the
operational parameters of real-world septic tanks; however, this work provides an early example
of the use of gas production techniques to examine toxicity to methanogens and documents the
ability of these microorganisms to acclimate and recover from loading of chemicals in toxic
concentrations.
5.2 Vaishnav and McCabe (1996)
Inhibition of anaerobic gas production from cellulose degradation is used by Vaishnav
and McCabe (1996) to assess safety of cleaning products to anaerobic microorganisms. In this
procedure, various concentrations of the test compound are added to incubation vessels (250 mL
flasks) containing constant amounts of anaerobic digester sludge, cellulose, and a synthetic
sewage feed mixture. The vessel is sealed and the headspace is connected by tubing to a second
vessel containing water. Water displacement into a third vessel is measured and used as an
indicator of anaerobic respiration. The concentration of test substance inhibiting anaerobic
respiration by 50% over a 96 hour exposure period (EC,,) is calculated, along with the No
Observed Effect Concentration (NOEC). Sodium chloride is used as a reference compound.
20 Final Version

Using the NOEC value derived from these test procedures and worst case scenario of
disposing an entire full-container of a granular all-fabric bleach and a general purpose cleaner
(trade names withheld at manufacturer’s request) directly into a 750 gallon septic tank, Vaishnav
and McCabe calculated whether the product concentration in the septic tank would exceed the
NOEC. As Table 2 describes, the worst case predicted septic tank concentrations of neither
product exceeds the NOEC. Therefore, it is unlikely that disposing an entire container of either
product will cause harm to septic tank microbes.
Granular all-fabric bleach”
General purpose cleaner”
Table 2. Impact of two cleaning products on gas production by anaerobic sludge. (Vaishnav and McCabe, 1996).
Product I NOEC I Worst Case Concentration 1 625 mg/L
10,000 mg/L 750 mg/L r
356-mg/L
~ ~~
’ Assumes 64 02. container. Assumes 1 gallon container.
53 Gross (1987)
In a report presenting data on the impact of disposal of household cleaning products on
septic tanks, Gross (1987) examined chlorine bleach, Lysol” (a disinfectant), and Drano” (a drain opener), which are products that they identified as materials of concern. They suspected these
common household products had the potential to harm septic tank operation due to their
anti-microbial properties.
The first step in this study was to establish the concentration of each product required to
“kill all of the bacteria” One liter samples of septic tank effluent were subjected to interaction
with various concentrations of the chemicals. They were allowed to interact for about one hour
and then analyzed for total coliforms following standard procedures. The statement “kill all of
the bacteria” is used in quotes because this study only considered coliforms, which are naturally
present within digestive tracts and are used as indicators of fecal contamination. These bacteria
would be expected to be only minor members of the septic tank consortium and would not be
expected to significantly contribute to the wastewater treatment performance of the septic tank.
21 Find Version
Furthermore, because these bacteria are not natural inhabitants of the environment outside of the
digestive tract, coliforms are not acclimated to the conditions and chemical fluctuations of the
septic tank and would be expected to be much more sensitive to chemical upset. The
concentrations required to eliminate coliforms in effluent samples were 1.85 mL/L for chlorine
bleach, 5 mL/L for Lysol, and 3 mg/L of Drano.
Four septic tanks were used in a field study to assess the impact of these levels of the
products on septic tank operation. The volumes of these tanks were 400 and 375 gallons, for
septic tanks C, and D, respectively. Prior to the field test, the tanks were pumped out and then
operated for two weeks to allow return to normal operation. The cleaning products were injected
into the tanks by flushing down the toilet. Samples of septic tanks liquid were taken from the
tanks periodically and tested for coliforms until the coliform population was found to reach pre-
dosing levels. When the concentrations of bleach, Lysol, and Drano equivalent to those
determined in the first part of the experiment were flushed into tanks C an D, coliform
populations were temporarily reduced, but populations to approximate pre-dosing levels within
60 hours (Table 3). The pH, BOD,, and total suspended solids of septic tank effluents were not
impacted by the chemical treatments (data not shown).
The conclusion of this report was once-per-week slug loads at the concentrations
used would cause little harm to the septic tank’s bacteriologic action since the longest recovery
time is 60 hours.
22 Final Version
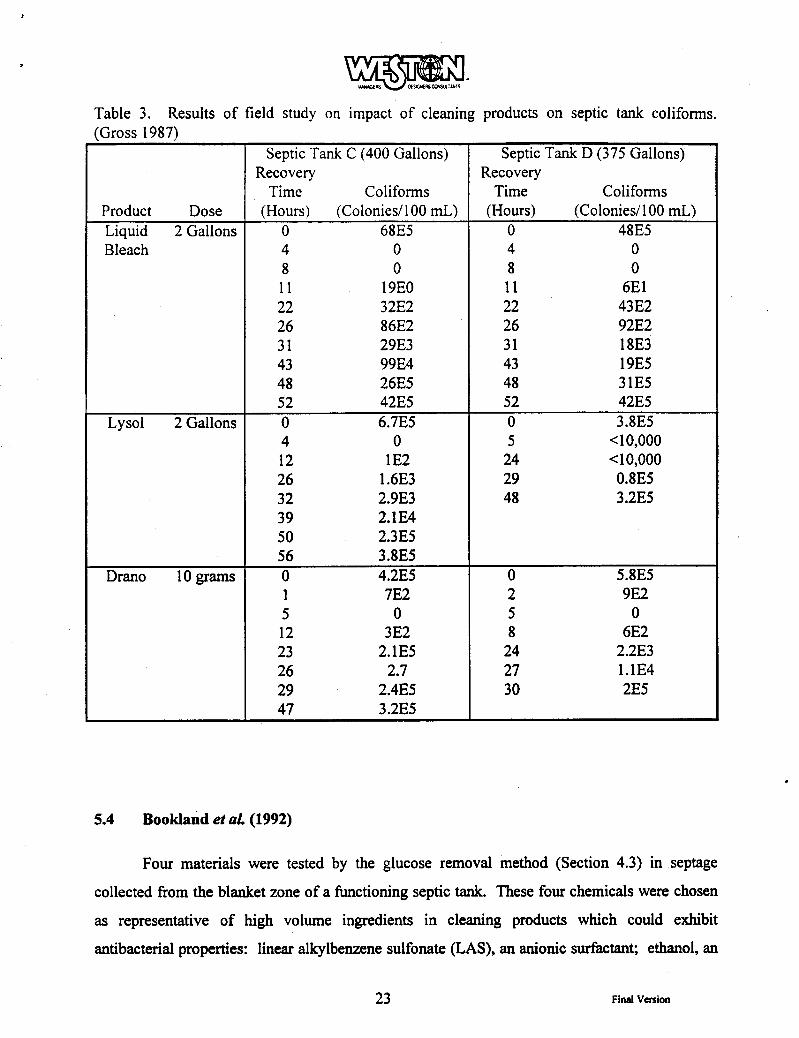
Table 3. (Gross 1987)
Results of field study on impact of cleaning products on septic tank coliforms.
Bleach
Lysol 2 Gallons
Drano lograms
Septic Tank C (400 Gallons)
Time Coliforms
0 68E5 4 0 8 0 11 19E0 22 32E2 26 86E2 31 29E3 43 99E4 48 26E5 52 42E5 0 6.7E5 4 0 12 1 E2 26 1.6E3 32 2.9E3 39 2.1E4 50 2.3E5 56 3.8E5 0 4.2E5 1 7E2 5 0 12 3E2 23 2.1 E5 26 2.7 29 2.4E5 47 3.2E5
Recovery
(Hours) (Colonies/100 mL)
Septic Tank D (375 Gallons) Recovery
(Hours) (Colonies/100 mL) Time Coliforms
0 48E5 4 0 8 0 11 6E1 22 43E2 26 92E2 31 18E3 43 19E5 48 31E5 52 42E5 0 3.8E5 5 <10,000
24 <10,000 29 0.8E5 48 3.2E5
0 5.8E5 2 9E2 5 0 8 6E2 24 2.2E3 27 1.1e4 30 2E5
5.4 Bookland et aL (1992)
Four materials were tested by the glucose removal method (Section 4.3) in septage
collected fiom the blanket zone of a functioning septic tank. These four chemicals were chosen
as representative of high volume ingredients in cleaning products which could exhibit
antibacterial properties: linear alkylbenzene sulfonate (LAS), an anionic surfactant; ethanol, an
23 Final Version

organic solvent; sodium hypochlorite, a bleach; and DODMAC, a cationic surfactant. The
results of this study are reported in Table 3 as HA,, (heterotrophic activity reduced by 50% as
measured by a 50% reduction in glucose uptake) and as the NOEC (concentration having no
effect on glucose uptake). Note that the glucose removal method is conservative because it
measures a specific activity and not lethality of the microorganisms.
These data were used to calculate the maximum ingredient concentration (ICmax) that
can be disposed into a septic system that would not be expected to cause an adverse effect in a
750 gallon septic tank (See Section 3.2 for discussion of septic tank volumes):
ICmax = NOEC (mg/L) x 3.785 L/gallon x 750 gallons per tank
The maximum amount of product (Pmax) that can be safely disposed is calculated by:
Pmax = ICmax/PICmax ( m u )
where PICmax is the maximum product ingredient concentration.
For example, if ethanol is used in cleaning products at a maximum concentration of
5% NOEC (weightlweight), its NOEC would be converted to a Pmax as follows:
ICmax = 10,000 mg/L ethanol (NOEC) x 3.785 L/gallon x 750 gallondtank = 28,388 g ethanoVtank
Pmax = 28,388 @tank x 100 mL product4 g ethanol x 1 WlOOO mL x 1 galJ3.785 L = 150 gal.
Therefore, up to 150 gallons of product containing 5% ethanol can be added to a 750 gallon
septic tank without adversely affecting heterotrophic activity.
Similar calculations illustrate that up to 4.5 gallons of anionic surfactant product
containing 30% LAS, 4.3 gallons of bleach containing 5% sodium hypochlorite, and 2.5 gallons
of cationic surfactant product containing 30% DODMAC can be added to a 750 gallon septic
tank without adversely affecting heterotrophic activity (Table 3).
24 Final Version
t
Table 4. Summary of septic tank safety data based on glucose removal. (Bookland et al., 1992).
NOEC Equivalent Amount of Product
Sodium Hypochlorite 475 288 4.5 gallons”
LAS 6,750 1,820 150 gallonsb
Ethanol 80,000 10,000 4.3 gallons‘
DODMAC > 1000 > 1000 2.5 gallonsd a Assumes 30% LAS. b Assumes 5% ethanol. C Assumes 5% sodium hypochlorite. d Assumes 30% DODMAC.
5.5 Summary of Case Studies
These case studies support several statements related to down-the-drain disposal of
cleaning products in septic systems:
1.
2.
3.
Septic tanks are robust in tolerating chemical exposure due to disposal of household cleaning
products, even those designed as disinfectants.
Rapid hydraulic turnover minimizes the exposure of microorganisms to high concentrations
of chemicals due to one-time slug loads. This aids in the rapid recovery of microorganisms
even if temporarily adverse biological conditions are experienced in the tank.
Quantities of cleaning products required to inhibit septic tank activity are larger than single
packages, sometimes much larger. This is observed even when using conservative “no
effect” indices of glucose uptake or toxicity to coliforms in septic effluent.
25 Final Version
SECTION 6
SUMMARY AND CONCLUSIONS
Due to the huge amount of dilution in POTW, disposing single household quantities of
cleaning products that are normally mixed with water will not impact their concentration in
POTW influent. Approximately 25% of households in the US use on-site waste treatment, most
commonly configured as septic tankjabsorption field systems. In this case, dilution is limited to
the volume of the septic tank and subsequent household water usage. It is generally accepted
that normal usage concentrations of unused cleaning products do not create problems in septic
tanks, but it is possible to temporarily elevate product concentrations in septic tanks by pouring
an entire package down-the drain. A recent survey shows that disposing unused cleaning down-
the-drain is an infrequent practice. The worst case scenario of product disposal in wastewater
treatment is the disposal of a completely unused package of product in a minimum size septic
tank. If a product does not impact waste treatment under this scenario, it may be assumed to be
safe for other common use and disposal scenarios.
A variety of testing methods are available to assess the safety of disposing unused
household cleaning products in wastewater treatment systems. These tests range from small
scale screening tests examining single endpoints such as respiration or gas production, to large
pilot-scale systems evaluating the impact of the chemicals on wastewater treatment performance
and operational parameters. Two common screening tests applied to septic tank microorganisms
evaluate the impact of substances on gas production and glucose uptake, respectively. Both of
these screening tests provide highly conservative indices, since they measure impact on specific
metabolic activities rather than the overall function of the septic tank, which tend to be more
robust.
Available data have shown that disposal of household quantities of cleaning products
such as drain openers, bleach, and detergents do not interfere with septic tank function.
Screening tests indicate that disposal of whole packages of these products result in maximum
concentrations in septic tanks that are well within the no-effect concentrations for gas production
and glucose uptake. This literature review did not reveal any case studies or reports of septic
26 Final Version

tank failure following disposal of cleaning products. In general normal dilution appears to
adequately provide safety for operation of biological waste treatment following the disposal of
cleaning products. This appears to be true even under the worst case scenario of disposing whole
packages of products into relatively small septic tanks.
SECTION 7
REFERENCES
APHA. 1989. (American Public Health Association, American Water Works Association, and Water Pollution Control Federation). Standard Metho& for the Examination of Water and Wastewater. l? edition. APHA. Washington, DC.
Benefield, L.D. and C. W. Randall. 1980. Biological Process Design for Wastewater Treatment. Prentice-Hall, Inc., Englewood Cliffs, NJ.
Bookland, EA, D. C. McAvoy, D. L. Wilke, R T. Williams and E. C. Schaeffer. 1992. Screening level tests for determining effects on septic tank functions. Paper presented at 13th Annual Meeting of the Society of Environmental Toxicology and Chemistry (November 8-1 2), Cincinnati, OH.
Canter, L. W., and R C. Knox. 1986. Septic tank system eflects on groundwater quality. Lewis Publishers, Inc. Chelsea, MI.
Cowen, C. E., T. M. Rothgeb, R J. Larson, W. I. Fanta, B. E. Domeyer, T. C. J. Feijel. 1992. Environmental risk assessment of perfume raw materials in aquatic and terrestrial envirOnments. Proceedings j?om the Sixth International Information &change. Research Institute for Fragrance Materials, Inc., Princeton, NJ.
De Walle, F.B., D. Kalman, D. Norman, J. Sung, and G. Plews. 1985. Determination of toxic chemicals in effluent fiom household septic tanks. US. EPA Report #EPA/600/2-85/050. Reproduced by National Tech Inform. Service, Dept Commerce. Springfield, VA.
deVillers, D.C. 1987. Septic tank systems. National Building Research Institute. Pretoria, South Mea. NTIS Number PB89-177570
Eckenfelder, W. W. 1980. Principles of Water Qualify Management. CBI Publishing Company, Inc. Boston, MA.
EPA. 1994. Anaerobic biodegradability of organic chemicals. 40 CFR 5796.3140. Code of Federal Regulations. Office of the Federal Register. Washington, DC.
27 Final Venion

EPA. 1987. Statistical Abstract of the Unsewered US. Population. (based on 1980 Census). PB88-113352
Gross, M. A. 1987. Assessment of the Effects of Household Chemicals upon Individual Septic Tank Performances. Technical Completion Report Project G- 12 12-07. Water Resources Research Center. University of Arkansas, Fayetteville, AR.
Hiinel, K. 1988. Biological Treatment of Sewage by the Activated Sludge Process. John Wiley & Sons. New York.
Holman, W. F. 1981. Estimating the environmental concentrations of consumer product components. pp. 159-182 in Branson, D. R. and K. L. Dickson, (eds). Aquatic Toxicology and Hazard Assessment: Fourth Conference. ASTM STP 73 7. American Society for Testing and Materials, Philadelphia, PA.
Holman, W. F. and W. D. Hopping. 1980. Treatability of type A zeolite in wastewater-Part 11. Journal WCPF 52:2887-2905.
Larson, RJ. and S. L. Schaeffer. 1982. A rapid method for determining the toxicity of chemicals to activated sludge. Water Research 16: 675-680.
Mackenzie, V. G. 1950. Fundamentals governing septic tank design and installation. Report No. PB-2-17-582. Environmental Health Center, U. S. Public Health Service, Cincinnati, OH. NTIS Number D-20,193.
Mahendraker, V. and T. Viraraghavan. 1995. Respirometry in environmental engineering. J. Environ. Sei. Health A30:713-734.
Marks, PJ. 1973. Microbiological inhibition testing procedure. pp. 22 1-226 Biological Methods for the Assessment of Water Qualir;v, ASTM STP 528. American Society for Testing and Materials, Philadelphia, PA.
Mitchell, D. 1976. Improving design criteria for septic tank systems. Project Completion Report Project A-027-ARK. Water Resources Research Center. University of Arkansas, Fayetteville, AR.
National Small Flown Clearinghouse. 1994. Septic Tanks, from the State Regulations. Morgantown, W.
NPD Group, Inc. 1995. Consumer disposal of household cleaning products. Report prepared for The Soap and Detergent Association. New York.
OECD. 198 1. Simulation test - aerobic sewage treatment: coupled units test. Test method 303A OECD Guidelines for Testing of Chemicals. Organkition for Economic Cooperation and Development. Paris, France.
28 Final Version
OECD. 1984. Activated sludge, respiration inhibition test. Test method 209. OECD Guidelines for Testing of Chemicals. Organization for Economic cooperation and Development. Paris, France.
Pearson, F.H., H.R. McLean, S. A. Klein. 1991. Pilot-scale septic tank treatment of preservative-laden waste. Res. J: Water Pollut. Control Fed. 63:999-1011.
Rittman, B.R 1987. Aerobic biological treatment. Environ. Sci. Technol. 21 : 128-1 36.
Srinivasariao, C., S. K. Dentel and H.E. Allen. 1992. Impacts of surfactants on sludge Presented before the Division of Environmental Chemistry, management processes.
American Chemical Society. San Francisco, California. April 5-1 0.
Swisher, RD. 1987. Surfactant Biodegradation (2nd ed.). Marcel Dekker, Inc. New York.
Truesdale, G. A. and H. T. Mann. 1968. Synthetic detergents and septic tanks. The Surveyor and Municipal Engineer 1 3 1 : 28-3 3.
U.S. International Trade Commission. 1994. S’thetic Organic Chemicals: United States Production and Sales, 1992. USITC Publication 2720. Washington, DC.
U.S. Bureau of the Census. 1993. Statistical Abstract of the United States: (113th edition). Washington, DC.
Vaishnar, D. D. and J. W. McCabe. 1996. Development of an anaerobic sludge respiration inhibition test and its use to assess septic tank safety of consumer products. Environ. Tox. Chem. In Press.
Weibel, S. R, T. W. Bendixen, and J. B. Coulter. 1954. Studies on Household Sewage U.S. Department of Health, Education, and Welfare, Disposal System:
Cincinnati, OH. Part 1.1.
Yang, J., G.F. Parkin, and RE. Speece. 1979. Recovery of anaerobic digestion after exposure to toxicants. Final Report. US. Dept of Energy Report # DOHCU40049-I. Reproduced by National Technical Information Service, U.S. Dept of Commerce, Springfield, VA.
29 Final Version
SECTION 8
FIGURES
30 Find Version
400
350
300
250
200
150
100
50
0 0 5 10 15 20 25
Time (Days)
Figure 1 . Response of unacclimated methanogens to an anionic surfactant. (From Yang, et ul. 1979).
31 Final Version
1800 4
1400 4
E 0 .- Y
y 1000
0, a
800 d
I 1 1 1 1 1
0 20 40 60 80 100 120
Time (Days)
Figure 2. Response of anaerobic filter to an anionic surfactant. (From Yang, et ul. 1979)
32 Final Version