qpsma: a semi-automatic software for whole-body tumor...
TRANSCRIPT

1
qPSMA: a semi-automatic software for whole-body tumor burden assessment in prostate
cancer using 68Ga-PSMA11 PET/CT
Andrei Gafita1, Marie Bieth1,2, Markus Krönke1, Giles Tetteh2, Fernando Navarro2, Hui Wang1,
Elisabeth Günther1, Bjoern Menze2, Wolfgang A Weber1, Matthias Eiber1
1Department of Nuclear Medicine, Klinikum rechts der Isar, Technical University Munich, Germany
2Department of Informatics, Technical University Munich, Germany
Corresponding author: Andrei Gafita, MD
Department of Nuclear Medicine, Klinikum rechts der Isar
Technical University Munich
Ismaninger Straße 22
81675 Munich, Germany
Tel.: +49 (0) 89-4140-2963
Fax.: +49 (0)89-4140-4950
E-mail: [email protected]
Word count: 5220
Running title: qPSMA: semiautomatic software
Financial support: M.E. received funding from the SFB 824 (DFG Sonderforschungsbereich 824,
Project B11) from the Deutsche Forschungsgemeinschaft, Bonn, Germany. Siemens Medical
Solutions (Erlangen, Germany) provided the continuous bed motion option for the Biograph mCT
as part of an academic collaboration.
Journal of Nuclear Medicine, published on March 8, 2019 as doi:10.2967/jnumed.118.224055by on June 4, 2020. For personal use only. jnm.snmjournals.org Downloaded from
2
ABSTRACT
Aim: To introduce and validate qPSMA, a semi-automatic software for whole-body tumor burden
assessment in prostate cancer patients using 68Ga-Prostate-specific membrane antigen (PSMA)11
PET/CT.
Material & Methods: qPSMA reads hybrid PET/CT images in DICOM format. Its pipeline was
written using Python and C++ languages. Bone mask, based on computer tomography (CT) and
normal uptake mask including organs with physiological 68Ga-PSMA11 uptake are automatically
computed. A standardized uptake value (SUV)-threshold of 3 and a liver-based threshold are used
to segment bone and soft-tissue lesions, respectively. Manual corrections can be applied using
different tools. Multiple output parameters are computed, i.e. PSMA-ligand positive tumor volume
(PSMA-TV), PSMA-ligand positive total lesion (PSMA-TL), PSMA-SUVmean and PSMA-
SUVmax. Twenty 68Ga-PSMA11 PET/CT datasets were used to validate and evaluate the
performance characteristics of qPSMA. Four analyses were performed: (1) validation of the semi-
automatic algorithm for liver background activity determination, (2) assessment of intra- and
interobserver variability, (3) validation of data from qPSMA by comparison with Syngo.via
(Siemens Medical Solutions), and (4) assessment of computational time and comparison of PSMA
PET-derived parameters with serum prostate-specific antigen (PSA).
Results: Automatic liver background calculation resulted in a mean relative difference of 0.74%
(intraclass correlation coefficient (ICC) 0.996, 95%CI: 0.989;0.998) compared to METAVOL.
Intra- and interobserver variability analyses showed high agreement (all ICC above 0.990).
Comparison of quantitative output parameters was performed for 68 lesions. Paired t test showed
by on June 4, 2020. For personal use only. jnm.snmjournals.org Downloaded from
3
no significant differences between the values obtained with the two software packages. The ICC
(95%CI) estimates obtained for PSMA-TV, PSMA-TL, SUVmean and SUVmax were 1.000
(1.000;1.000), 1.000 (1.000;1.000), 0.995 (0.992;0.997) and 0.999 (0.999;1.000), respectively. The
first and second read for intra-observer variability resulted in mean computational times of 13.63
(range: 8.22-25.45) and 9.27 (range: 8.10-12.15) minutes, respectively (p=0.001). High significant
correlations were found between serum PSA-value and both PSMA-TV (r=0.72, p<0.001) and
PSMA-TL (r=0.66, p=0.002).
Conclusion: Semi-automatic analyses of whole-body tumor burden in 68Ga-PSMA11 PET/CT is
feasible. qPSMA is a robust software that can assist physicians to quantify tumor load in heavily
metastasized prostate cancer patients.
Key words: PSMA, tumor segmentation, qPSMA, PET/CT
by on June 4, 2020. For personal use only. jnm.snmjournals.org Downloaded from

4
INTRODUCTION
Prostate cancer (PC) is a significant health problem being recorded as the leading malignancy
diagnosed and second to third leading cause of cancer death in men (1,2). In loco-regional stage
the relative 5-year survival rate is 99%, whilst in patients with metastatic prostate cancer it
dramatically decreases to 29% (3). Therefore, metastatic disease has become an important entity
in diagnosis and treatment of PC. PET-imaging plays an important role in evaluating disease extent
and treatment response. Prostate Cancer Working Group 3 (4) recommends determining
radiographic response to treatment by using RECIST 1.1 (5) for extraskeletal disease evaluation
and qualitative interpretation of bone scan as the standard for bone lesions assessment.
Development of a quantitative image-derived biomarker exploiting recent advances in PET-
imaging to assess tumor burden based on tumor activity is an unmet clinical need in PC. It is
expected to be crucial for accurate evaluation of therapy response.
Prostate-specific membrane antigen (PSMA), also known as glutamate carboxypeptidase II,
is a non-secreted transmembrane glycoprotein (6,7) that is weakly expressed in healthy prostate
tissue but strongly upregulated in prostate cancer cells (7). In the last years, molecular imaging
targeting PSMA has become of great interest in PC diagnostics (8). 68Ga-PSMA11 PET/CT is a
novel imaging technique, which showed enhanced accuracy compared to conventional imaging
modalities in detecting PC lesions (9-11). Consequently it is a promising technique to allow tumor
load quantification as candidate image-based biomarker in PC. However, in patients with high
tumor load, manual quantification is time-consuming and a semi-automatic tool would
considerably reduce the segmentation time. A first step towards a semi-automatic tumor burden
assessment in PC was described in Bieth et al. (12), who proposed a tool that quantifies
by on June 4, 2020. For personal use only. jnm.snmjournals.org Downloaded from
5
involvement of skeleton in prostate cancer inspired by the bone scan index (BSI) using 68Ga-
PSMA11 PET/CT.
We introduce qPSMA as further development of this first approach into a software that
allows whole-body semi-automatic tumor burden assessment, i.e. skeletal, lymph node and visceral
metastases. We aimed to describe and validate its use in metastatic prostate cancer.
MATERIAL AND METHODS
General Description
qPSMA reads images in DICOM format. PET and CT are co-registered automatically using
the information contained in DICOM headers. The pipeline was written using Python and C++
languages. The software is running on Ubuntu and can be installed via a virtual machine on
Windows or macOS. After finishing the computation, the entire work including the PET, CT and
the labels can be saved into one MATLAB file (.mat). Considering the intra- and inter-variability
in reconstructing different types of PET/CT datasets, an image interpolation algorithm using cubic
B-spline curves was implemented (13). Due to a lack of standardization in protocol scanning,
anatomical segments (i.e. head, arms and legs) are not always entirely contained in the field of
view of PET/CT images. To allow for intra- and inter-patient comparison, the reader can define a
specific volume between certain slices to be included in the final statistics. At the end of
computation, the maximum intensity projection (MIP) of PET image including the segmentation
labels can be displayed. The software includes the possibility to use different standardized uptake
value (SUV)-thresholds for skeleton and soft-tissue lesions. This is based on the observation that
bone metastases reveal lower PSMA-expression compared to lymph nodes metastases (14).
by on June 4, 2020. For personal use only. jnm.snmjournals.org Downloaded from

6
Accordingly, 68Ga-PSMA11 PET imaging showed higher PSMA-uptake for lymph nodes
metastases as compared to skeleton lesions (15).
Software Workflow
Figure 1 displays the proposed six-steps workflow of qPSMA for the whole-body tumor
segmentation.
Bone mask. The mask incorporates the skeleton, which is firstly segmented on the CT. The
segmentation method relies on pixel intensities and different morphological operations, as
described (12,16). When necessary, manual corrections can be subsequently applied. As the CT
and PET are co-registered, the bone mask is automatically transposed to PET images to determine
the location of skeleton.
Normal uptake mask. Normal uptake mask includes the organs that typically exhibit high
physiological PSMA uptake, namely salivary glands, liver, spleen, kidneys and urinary bladder. A
Vantage Point Forest algorithm was trained to automatically compute the normal uptake mask, as
described (16).
Liver background activity. In accordance with PERCIST 1.0 (17) the SUVmean within a 3-cm
spherical volume of interest (VOI) within the right liver lobe is used to obtain the liver background
activity. To minimise the intra- and inter-user variability, this 3-cm VOI is semi-automatically
placed, using an algorithm that showed high reliability and reproducibility in evaluating liver
background activity (18).
Bone lesions segmentation. 68Ga-PSMA11 does not usually lead to relevant unspecific uptake
within the skeleton. Bieth et al. (12), described a SUVthr_bone of 3 as useful for bone lesion
segmentation to omit low background uptake. This threshold is applied restricted to voxels within
the transposed bone mask from CT. Due to the spillover effect and frequent misalignments between
by on June 4, 2020. For personal use only. jnm.snmjournals.org Downloaded from

7
the CT and PET images (e.g. due to breathing), part of bone lesions can be located outside the bone
mask and consequently will be improperly segmented as soft-tissue lesions. To overcome this
issue, an automated algorithm adds uptake outside the bone mask but in conjunction to a bone
lesions to this bone lesions. Supplemental Figure 1 displays an example of a bone lesion, which is
partially located outside the bone mask, before and after application of the ‘Extend bone lesion’
algorithm.
Soft-tissue lesions segmentation. A separate fixed SUV-threshold for soft-tissue (st) lesions
(SUVthr_st) can be applied. The software automatically displays the measured liver background
activity (SUVmean+SD values) to assist the user in choosing the SUVthr_st. The rationale for choosing
a liver-based threshold a) parallels the recommendation of liver uptake as background as
established in PROMISE criteria (19) and b) its physiological 68Ga-PSMA11 uptake, with no
detectable PSMA-expression by immunohistochemistry (7).
This approach allows use of a patient and scan-individualised threshold. To obtain an
accurate value taking into account the so-called tumor sink effect the following formula is
recommended. The value 4.30 represent the average liver SUVmean value obtained in 80
consecutive patients.
𝑆𝑈𝑉4.30
𝑆𝑈𝑉𝑆𝑈𝑉 𝑆𝐷
After determination the SUVthr_st, all voxels that show SUV > SUVthr_st and are located
outside of bone and normal uptake masks are automatically segmented as soft-tissue lesions.
Manual corrections. Usually, the manual corrections are necessary to delineate the intestine
from abdominal PSMA-ligand positive lymph nodes and to remove false-positive uptake within
structures with unspecific uptake such as aorta, esophagus, ureter, rectum, etc. Typical pitfalls in
PSMA-ligand PET-imaging (e.g. celiac and other ganglia, adrenal glands) should be taken into
by on June 4, 2020. For personal use only. jnm.snmjournals.org Downloaded from
8
account (20). Different tools, such as ‘brush’, ‘erase’, ‘remove in contour’, ‘remove whole
structure’ assist the user in manual corrections. Figure 2 displays two examples of manual
corrections that are often required.
Output parameters. Multiple output parameters are possible and specified in the algorithm.
PSMA-Tumor Volume (PSMA-TV), similar to metabolic tumor volume (MTV) from FDG-PET,
represents the volume of all PSMA-ligand positive tumor-voxels. PSMA-Total lesion (PSMA-TL),
similar to total lesion glycolysis (TLG) from FDG-PET, represents the total PSMA-activity from
all tumor-voxels. PSMA-SUVmean is the average SUV in all PSMA-ligand positive tumor-voxels
and PSMA-SUVmax is the voxel with the highest PSMA-expression in the tumor. They are
calculated as following, where N is the number of v tumor-voxels.
𝑃𝑆𝑀𝐴-𝑇𝑉 𝑉𝑜𝑥𝑒𝑙 𝑣
𝑃𝑆𝑀𝐴-𝑆𝑈𝑉1𝑁
𝑆𝑈𝑉 𝑣
𝑃𝑆𝑀𝐴-𝑇𝐿 𝑃𝑆𝑀𝐴-𝑇𝑉 𝑃𝑆𝑀𝐴-𝑆𝑈𝑉
PSMA-𝑆𝑈𝑉 𝑀𝑎𝑥 𝑆𝑈𝑉 𝑣
All four PET-derived parameters can be calculated separately for soft-tissue lesions
(stPSMA-TV, stPSMA-TL, stPSMA-SUVmean, stPSMA-SUVmax) and skeleton lesions
(bonePSMA-TV, bonePSMA-TL, bonePSMA-SUVmean, bonePSMA-SUVmax). They are added up
by on June 4, 2020. For personal use only. jnm.snmjournals.org Downloaded from
9
to the parameters describing whole-body tumor load (wbPSMA-TV, wbPSMA-TL, wbPSMA-
SUVmean, wbPSMA-SUVmax).
Technical Validation
Four analyses were performed to validate and evaluate the performance characteristics of
qPSMA using 20 68Ga-PSMA11 PET/CT datasets.
Liver threshold validation. The purpose was to validate proper implementation of the semi-
automatic algorithm. The liver-based SUVthr_st was calculated using both qPSMA and the open-
source software METAVOL in which it was originally implemented (18).
Intra- and inter-observer variability. The objective of these analyses was to evaluate the
reliability using qPSMA. For inter-variability evaluation, two trained readers used qPSMA and
applied manual corrections independently. To evaluate intra-observer reliability, one trained reader
analysed the datasets twice at an interval of 4 weeks. For both analyses all computational steps and
recommendations were followed as described above. An SUVthr_bone of 3 and a liver-based SUVthr_st
were used. To allow for intra-patient comparison, only slices including the trunk between first
thoracic vertebrae and lower end of the ischium (both easily recognized on CT) were included.
Values validation. The objective of this analysis was to validate the values of the outcome
parameters. Lesions selected from the 20 68Ga-PSMA11 PET/CTs were individually segmented
using qPSMA and a commercial available software (Syngo.via, Siemens Medical Solutions,
Erlangen, Germany).
Feasibility. To evaluate the practicability and learning curve of using qPSMA, the time spent
to analyse the datasets included in the intra-user variability for both reads was counted.
Computational time was counted from loading of the bone mask until the output parameters were
obtained. To assess the feasibility of introducing PSMA-ligand PET-derived tumor burden
by on June 4, 2020. For personal use only. jnm.snmjournals.org Downloaded from
10
parameters into a clinical setting, correlations between serum prostate-specific antigen (PSA) value
and wbPSMA-TV, wbPSMA-TV were evaluated. PSA values were obtained at 2 weeks of 68Ga-
PSMA11 PET/CT acquisition.
68Ga-PSMA11 PET/CT datasets
All 68Ga-PSMA11 PET/CT scans were performed at our institution prior to 177Lu-PSMA
RLT for metastatic castration-resistant PC. Patients characteristics including age and metastases
sites are presented in Table 1. All patients signed a written consent for evaluation of their data. The
institutional review board of the Technical University Munich approved this retrospective analysis
(permit 5665/13). 68Ga-PSMA11 was administered in compliance with The German Medicinal
Products Act, AMG §13(2b), and in accordance with the responsible regulatory body (Government
of Oberbayern). 68Ga-PSMA11 was synthesized and PET/CT images were obtained, as described
previously (9). The transaxial pixel size was 4.07 mm for PET and 1.52 mm for CT, with a 5 mm
slice thickness for both.
Statistical Analysis
Values were reported as mean (range). Relative differences (%) were calculated dividing the
absolute value of the differences within the measurements by the average of the two measurements,
all multiplied by 100. Means and 95% confidence interval (95%CI) of the relative differences were
reported. Paired t-test was used when the values were considered as paired. Intraclass correlation
(ICC) estimates and 95%CI were calculated based on a single rater, absolute agreement and 2-way
mixed effect model (21). Spearman’s rank correlations were performed to assess the correlations
between tumor burden parameters. In each analysis, p value <0.05 was considered statistically
by on June 4, 2020. For personal use only. jnm.snmjournals.org Downloaded from
11
significant. All statistical analyses were performed using IBM SPSS Statistics v22.0 (IBM Corp.,
USA).
RESULTS
Liver threshold validation. The mean of SUVthr_st computed with METAVOL and qPSMA
were 5.18 vs 5.14. Paired t test did not show a significant difference (p=0.14). Mean (95%CI) of
relative difference was 0.74 (-0.22;1.72) %. The ICC (95%CI) estimate was 0.996 (0.989;0.998).
Figure 3 illustrates the Bland–Altman plot of the differences between SUVthr_st obtained with both
software.
Intra- and inter-observer variability. The absolute mean values, mean (95%CI) of the
differences and ICC (95%CI) in PSMA-TV, PSMA-TL, PSMA-SUVmean and PSMA-SUVmax for
bone and soft-tissue are presented in Table 2.
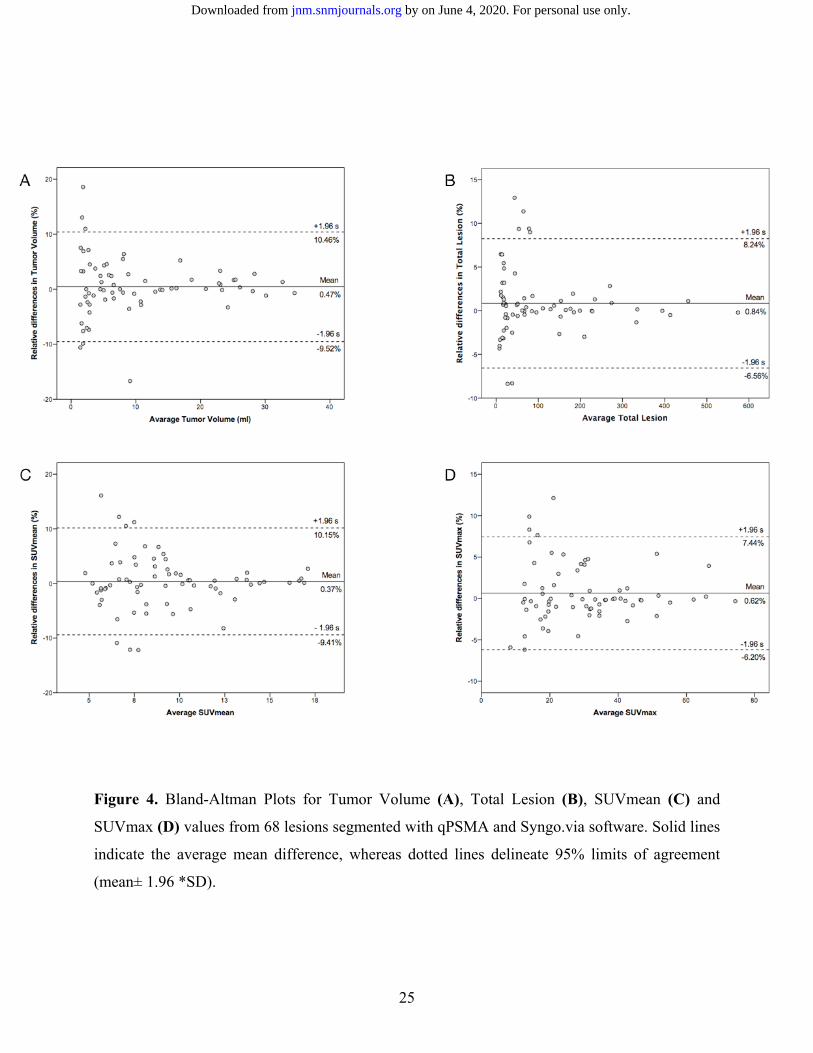
Values validation. Sixty-eight representative lesions were segmented using both qPSMA
and Syngo.via software. The mean values obtained for PSMA-TV, PSMA-TL, SUVmean and
SUVmax were 10.27 vs 10.23ml, 108.4 vs 107.8, 9.33 vs 9.31 and 30.03 vs 29.87, respectively.
Paired t test did not show significant differences (p>0.05). Mean (95%CI) relative difference were
0.47 (-0.78;1.72) %, 0.84 (-0.07, 1.75) %, 0.37 (-0.83;1.57) %, and 0.62 (-0.21;1.47) % for PSMA-
TV, PSMA-TL, SUVmean and SUVmax, respectively. ICC (95%CI) estimates were 1.000
(0.999;1.000), 1.000 (1.000;1.000), 0.997 (0.994;0.998) and 0.999 (0.999;1.000), respectively.
Figure 4 illustrates the Bland–Altman plots of the differences between values obtained with both
software.
by on June 4, 2020. For personal use only. jnm.snmjournals.org Downloaded from

12
Feasibility. The mean computational time was 13.63 (range: 8.22-25.45) and 9.27 (range:
8.10-12.15) minutes for the first and second read, respectively. The differences in computational
time were significant different (p=0.001). Based on the hardware used (Intel Core i7 4.2GHz, 32GB
RAM) the time loading masks and liver-threshold was approximatively six minutes. At baseline,
mean (range) of serum PSA, wbPSMA-TV and wbPSMA-TL were 369 (1-2222) ng/ml, 827 (7-
3076) mL, and 7005 (62-26304), respectively. High significant correlations were found between
PSA and both, wbPSMA-TV (r=0.72, p<0.001) and wbPSMA-TL (r=0.66, p=0.002).
DISCUSSION
To the best of our knowledge, the introduction of qPSMA as a software for whole-body
tumor segmentation is a novel approach towards semi-automatic analysis of PET-data in prostate
cancer. Basically, qPSMA integrates various segmentation procedures and PET-quantification into
one package to facilitate PSMA-ligand PET tumor burden assessment. In detail, a fixed SUV-
threshold is used having liver background activity as a reference for physiological PSMA-ligand
uptake, as recommended in PROMISE (19) and computed by using a 3-cm VOI as recommended
in PERCIST (17). To minimize the inter-user variability, a semi-automatic algorithm was
incorporated to place the VOI within the right liver lobe (18). As novelty, we introduced two
different thresholds for bone and soft-tissue lesions segmentation. This takes into consideration
their different PSMA-ligand uptake (14,15).
The results of our investigation indicate that semi-automatic evaluation of bone, soft-tissue
and whole-body tumor load in heavily metastasized prostate cancer patients is feasible. qPSMA is
a robust software with considerable training effect for the user. Values obtained with our in-house
developed tool are in high agreement with a commercial software. Its application is of high interest
by on June 4, 2020. For personal use only. jnm.snmjournals.org Downloaded from
13
in the setting of PSMA-theranostics, where PSMA-ligand PET imaging is typically used for
pretreatment evaluation as well as treatment response assessment.
Quantification of FDG PET imaging is increasingly used applying metabolic tumor volume
(MTV) and total lesion glycolysis (TLG) as predictor parameters for treatment outcome (22,23).
A first approach in whole-body tumor burden assessment using 68Ga-PSMA11 PET/CT has
been introduced in Schmuck et al. (24) using an isocontour SUV-threshold method. Due to time
consuming process, only patients with low tumor load (<10 lesions) were manually analysed. This
resulted in relatively low mean PSMA-TV and PSMA-TL of 3.4mL and 33.2 per patient,
respectively. Schmidkonz et al. (25) extended the work by analyzing patients with higher tumor
burden (PSMA-TV and PSMA-TL of 7.4mL and 73.8, respectively). No segmentation time was
reported in both works. Nevertheless, such manual segmentation method is time consuming,
making whole-body tumor burden assessment in heavily metastasized patients not feasible.
Therefore, a semi-automatic method would pave the way towards a whole-body tumor load
quantification in prostate cancer patients. In the present study the mean analysed PSMA-TV and
PSMA-TL were 823mL and 7273, respectively. This indicates that our patient cohort was much
more advanced than previous reports in literature using manual segmentation (24,25). Furthermore,
this could also explain the stronger correlations that we obtained between serum PSA and PSMA-
ligand PET-derived parameters compared to the previously described (24,25). While these two
reports analyzed patients with biochemical recurrence, our study investigates patients with
mCRPC.
Our data indicate that a certain amount of training can reduce the time needed for manual
correction as for the second analysis of the same dataset the time was significantly reduced (13.63
vs 9.27 minutes). Though further improvements are warranted, the current time needed per patient
to be analyzed is very likely to has a large advantage compared to a manual approach. Notably, as
by on June 4, 2020. For personal use only. jnm.snmjournals.org Downloaded from

14
qPSMA employs fully automatic steps as well as manual correction, the time needed to process a
dataset also depends on the specific hardware.
The technical validation of qPSMA resulted in a reliable and reproducible data for different
items: the implementation of automatic liver background calculation our data exhibits excellent
agreement (ICC of 0.996) compared METAVOL as first tool for this task and only a minimal
deviation of 0.74% using a Bland-Altman plot. Quantitative data produced by qPSMA are in high
concordance (all ICC >0.997) with output from a commercial system (Syngo.via). In data shown
using Bland-Altman plots a bias below 1% was found in all four parameters. Interestingly, by
increasing lesions volume and uptake the bias is decreasing, which shows that lesions with high
volumes and high SUV had a higher concordance. This finding confirms that small lesions exhibit
higher SUV variability (26). For SUVmax we found a mean difference of 0.6%, which is in
concordance with a mean difference up to 0.5% obtained in a comparison between four commercial
software (27). In terms of reliability, qPSMA offers high intra- and interobserver agreement with
superb ICC estimates and no significant differences between users.
No segmentation method has been yet established for PET as the gold standard. Fixed-
threshold and isocontour relative-threshold have been largely used in PET quantification (22-24).
However, it has been shown that despite different results using various segmentation methods or
partial volume effect correction, no significant impact on the predictive or prognostic power of
PET-derived parameters could be found (28,29). As a consequence, we focused more on the
development of a semi-automatic algorithm that allows for whole-body tumor burden assessment
in heavily metastasized patients than in deeply analyzing differences between segmentation
methods.
We are aware that the presence of liver metastases can interfere with the liver-based
threshold as based on our experience the semi-automatic algorithm has always placed the 3-cm
by on June 4, 2020. For personal use only. jnm.snmjournals.org Downloaded from
15
VOI in healthy tissue. In patients with diffuse liver involvement this can lead to incorrect results.
Supplemental Figure 2 displays two examples of SUVthr_st being computed in patients with liver
metastases. The average liver SUVmean obtained in the present study (4.30) and used to compute
SUVthr_st is in concordance with data reported by Gaertner et al. (4.19) (30).
Currently EBONI (31) is the only software-tool available and published for automatic
PSMA-ligand PET image assessment. However, it was introduced as a tool focusing on skeletal
tumor load only based on its approach to fully-automatically extract PET-data based on its location
within the skeleton on the corresponding CT. A fixed SUV-threshold of 2.5 was found to be the
optimal cut-off for bone lesion segmentation. This is in concordance with the SUVthr_bone of 3 that
has been proposed in qPSMA. A drawback of EBONI is the fact that it does not correct for
misalignments between the PET and CT and thus can miss parts of bone lesions which project
outside the bone mask due to breathing, movement etc. In qPSMA. a specific algorithm is
implemented which allows automatic recognition of those parts of bone lesion which lie outside
the bone mask due to misalignments. Secondly, use of EBONI is limited to PET/CTs with no
intravenous or positive oral contrast agents as they increase density (Hounsfield Units) of certain
structures (e.g. intestine, vessels) and will be falsely annotated as bone lesions. This is related to
its implementation using automatic masking from the CT dataset with no further corrections. In
qPSMA, a machine learning algorithm for bone mask has been trained using multiple features (e.g.
HU, shape) (16) in addition to manual corrections.
Comparing to Syngo.via, in qPSMA are introduced as novelty the bone and normal uptake
masks. The software package can be installed via a virtual machine on any computer. Due to the
interpolation algorithm, any PET/CT data can be open and analysed. Therefore, the tool can be
used at any institution, which could enable a more accurate assessment of radiographic response in
the framework of PSMA-targeted radioligand therapies. Although, due to the use of different
by on June 4, 2020. For personal use only. jnm.snmjournals.org Downloaded from
16
PET/CT scanners and reconstruction methods, it is recommended for each institution to firstly
assess the average liver SUVmean in a sufficient large cohort and subsequently adapt the SUVthr_st
formula.
Several limitations of the current version of qPSMA as well as our analyses have to be
noted. First drawback is the use of liver-based threshold, which limits its use in diffuse liver
involvement. Additionally, adaptions might be necessary for PSMA-ligands that are mainly liver-
excreted (e.g. PSMA-1007). Second, lesions with lower PSMA-uptake than liver background
activity are missed by the algorithm. Even though currently SUV-based threshold is the state-of-
art in PET segmentation, it has been shown that SUV is susceptible to the use of different scanners
and reconstruction methods (32). To overcome these issues, for the next version of the software
we will focus on shifting from the thresholding to convolutional neural networks, which have
already shown enhanced accuracy in PET segmentation, as compared to conventional methods
(33).
CONCLUSION
qPSMA is a user-friendly and reliable semi-automatic software tool which allows
assessment of bone, soft-tissue and whole-body tumor burden assessment in prostate cancer. Its
application to 68Ga-PSMA11 PET/CT is feasible, robust and can assist physicians to quantify
whole-body tumor load in heavily metastasized patients within an acceptable timeframe. It is the
first step towards further analyses of PSMA-ligand PET imaging as potential image-derived
biomarker in prostate cancer, especially within the PSMA-theranostics framework.
CONFLICT OF INTEREST
No potential conflicts of interest relevant to this article exist.
by on June 4, 2020. For personal use only. jnm.snmjournals.org Downloaded from

17
REFERENCES 1. Ferlay J, Steliarova‐Foucher E, Lortet‐Tieulent J, et al. Cancer incidence and mortality patterns in Europe: estimates for 40 countries in 2012. Eur J Cancer. 2013;49:1374‐1403. 2. Key Statistics for Prostate Cancer | Prostate Cancer Facts. https://www.cancer.org/cancer/prostate‐cancer/about/key‐statistics.html. Accessed 28 October, 2018. 3. Survival Rates for Prostate Cancer. 2018. https://www.cancer.org/cancer/prostate‐cancer/detection‐diagnosis‐staging/survival‐rates.html. Accessed 28 October, 2018. 4. Scher HI, Morris MJ, Stadler WM, et al. Trial design and objectives for castration‐resistant prostate cancer: Updated recommendations from the prostate cancer clinical trials working group 3. J Clin Oncol. 2016;34:1402‐1418. 5. Schwartz LH, Litiere S, de Vries E, et al. RECIST 1.1‐update and clarification: From the RECIST committee. Eur J Cancer. 2016;62:132‐137. 6. Israeli RS, Powell CT, Corr JG, Fair WR, Heston WD. Expression of the prostate‐specific membrane antigen. Cancer Res. 1994;54:1807‐1811. 7. Silver DA, Pellicer I, Fair WR, Heston WD, Cordon‐Cardo C. Prostate‐specific membrane antigen expression in normal and malignant human tissues. Clin Cancer Res. 1997;3:81‐85. 8. Eiber M, Fendler WP, Rowe SP, et al. Prostate‐specific membrane antigen ligands for imaging and therapy. J Nucl Med. 2017;58:67s‐76s. 9. Eiber M, Maurer T, Souvatzoglou M, et al. Evaluation of hybrid (6)(8)Ga‐PSMA ligand PET/CT in 248 patients with biochemical recurrence after radical prostatectomy. J Nucl Med. 2015;56:668‐674. 10. Afshar‐Oromieh A, Avtzi E, Giesel FL, et al. The diagnostic value of PET/CT imaging with the 68Ga‐labelled PSMA ligand HBED‐CC in the diagnosis of recurrent prostate cancer. Eur J Nucl Med Mol Imaging. 2015;42:197‐209. 11. Rahbar K, Weckesser M, Huss S, et al. Correlation of intraprostatic tumor extent with (6)(8)Ga‐PSMA distribution in patients with prostate cancer. J Nucl Med. 2016;57:563‐567. 12. Bieth M, Kronke M, Tauber R, et al. Exploring new multimodal quantitative imaging indices for the assessment of osseous tumor burden in prostate cancer using (68)Ga‐PSMA PET/CT. J Nucl Med. 2017;58:1632‐1637.
by on June 4, 2020. For personal use only. jnm.snmjournals.org Downloaded from

18
13. Pan J. Image interpolation using spline curves. http://cadcam.eng.sunysb.edu/~purwar/Teaching/MEC572/Term_Papers/Jiahui_Pan_TermPaper.pdf. Accessed 28 October, 2018. 14. Schmittgen TD, Teske S, Vessella RL, True LD, Zakrajsek BA. Expression of prostate specific membrane antigen and three alternatively spliced variants of PSMA in prostate cancer patients. Int J Cancer. 2003;107:323‐329. 15. Freitag MT, Radtke JP, Hadaschik BA, et al. Comparison of hybrid (68)Ga‐PSMA PET/MRI and (68)Ga‐PSMA PET/CT in the evaluation of lymph node and bone metastases of prostate cancer. Eur J Nucl Med Mol Imaging. 2016;43:70‐83. 16. Bieth M, Peter L, Nekolla SG, et al. Segmentation of skeleton and organs in whole‐body CT images via iterative trilateration. IEEE Trans Med Imaging. 2017;36:2276‐2286. 17. Wahl RL, Jacene H, Kasamon Y, Lodge MA. From RECIST to PERCIST: Evolving considerations for PET response criteria in solid tumors. J Nucl Med. 2009;50 Suppl 1:122s‐150s. 18. Hirata K, Kobayashi K, Wong KP, et al. A semi‐automated technique determining the liver standardized uptake value reference for tumor delineation in FDG PET‐CT. PLoS One. 2014;9:e105682. 19. Eiber M, Herrmann K, Calais J, et al. Prostate cancer molecular imaging standardized evaluation (PROMISE): Proposed miTNM classification for the interpretation of PSMA‐ligand PET/CT. J Nucl Med. 2018;59:469‐478. 20. Hofman MS, Hicks RJ, Maurer T, Eiber M. Prostate‐specific membrane antigen PET: clinical utility in prostate cancer, normal patterns, pearls, and pitfalls. Radiographics. 2018;38:200‐217. 21. Koo TK, Li MY. A guideline of selecting and reporting intraclass correlation coefficients for reliability research. J Chiropr Med. 2016;15:155‐163. 22. Rogasch JMM, Hundsdoerfer P, Hofheinz F, et al. Pretherapeutic FDG‐PET total metabolic tumor volume predicts response to induction therapy in pediatric Hodgkin's lymphoma. BMC Cancer. 2018;18:521. 23. Mikhaeel NG, Smith D, Dunn JT, et al. Combination of baseline metabolic tumour volume and early response on PET/CT improves progression‐free survival prediction in DLBCL. Eur J Nucl Med Mol Imaging. 2016;43:1209‐1219. 24. Schmuck S, von Klot CA, Henkenberens C, et al. Initial experience with volumetric (68)Ga‐PSMA I&T PET/CT for assessment of whole‐body tumor burden as a quantitative imaging biomarker in patients with prostate cancer. J Nucl Med. 2017;58:1962‐1968.
by on June 4, 2020. For personal use only. jnm.snmjournals.org Downloaded from

19
25. Schmidkonz C, Cordes M, Schmidt D, et al. (68)Ga‐PSMA‐11 PET/CT‐derived metabolic parameters for determination of whole‐body tumor burden and treatment response in prostate cancer. Eur J Nucl Med Mol Imaging. 2018;45:1862‐1872. 26. Brendle C, Kupferschlager J, Nikolaou K, la Fougere C, Gatidis S, Pfannenberg C. Is the standard uptake value (SUV) appropriate for quantification in clinical PET imaging? ‐ Variability induced by different SUV measurements and varying reconstruction methods. Eur J Radiol. 2015;84:158‐162. 27. Arain Z, Lodge M, Wahl R. A comparison of SUV parameters across four commercial software platforms [abstract]. J Nucl Med. 2015;56:580. 28. Kanoun S, Tal I, Berriolo‐Riedinger A, et al. Influence of software tool and methodological aspects of total metabolic tumor volume calculation on baseline [18F]FDG PET to predict survival in hodgkin lymphoma. PLoS One. 2015;10:e0140830. 29. Hatt M, Le Pogam A, Visvikis D, Pradier O, Cheze Le Rest C. Impact of partial‐volume effect correction on the predictive and prognostic value of baseline 18F‐FDG PET images in esophageal cancer. J Nucl Med. 2012;53:12‐20. 30. Gaertner FC, Halabi K, Ahmadzadehfar H, et al. Uptake of PSMA‐ligands in normal tissues is dependent on tumor load in patients with prostate cancer. Oncotarget. 2017;8:55094‐55103. 31. Hammes J, Tager P, Drzezga A. EBONI: A tool for automated quantification of bone metastasis load in PSMA PET/CT. J Nucl Med. 2018;59:1070‐1075. 32. Adams MC, Turkington TG, Wilson JM, Wong TZ. A systematic review of the factors affecting accuracy of SUV measurements. AJR Am J Roentgenol. 2010;195:310‐320. 33. Hatt M, Laurent B, Ouahabi A, et al. The first MICCAI challenge on PET tumor segmentation. Med Image Anal. 2018;44:177‐195.
by on June 4, 2020. For personal use only. jnm.snmjournals.org Downloaded from

20
TABLES
Table 1. Patients characteristics
No. patients 20
Age, years, mean (range) 73 (65-84)
PSA, ng/ml, mean (range) 369 (1-2222)
Site of metastasis, Pat. No.
lymph node, overall 12
lymph node only 1
bone, overall 19
bone only 1
bone and lymph node 12
local recurrence 4
visceral, overall 3
by on June 4, 2020. For personal use only. jnm.snmjournals.org Downloaded from

21
Table 2. Intra- and inter-observer analyses
Output
Parameters
Intra-observer analysis Inter-observer analysis
Mean values
Read 1 vs. Read 2
Mean (95%CI)
of differences (%)
ICC (95%CI)
Paired t
test
Mean values
User 1 vs. User 2
Mean (95%CI)
of differences (%)
ICC (95%CI)
Paired t test
bPSMA-TV (ml) 801.9 vs. 800.4 -2.22 (-5.72;1.25) 1.000 (0.999;1.000)
all
p > 0.05
801.9 vs. 800.1 2.53 (-2.60;7.68) 1.000 (1.000;1.000)
all
p > 0.05
bPSMA-TL 6397 vs. 6393 -2.94 (-7.75;1.86) 1.000 (0.999;1.000) 61397 vs. 6392 2.37 (-1.93;6.68) 1.000 (1.000;1.000)
bPSMA-SUVmean 7.34 vs. 7.39 -0.73 (-2.24;0.77) 0.998 (0.998;1.000) 7.34 vs. 7.33 -0.16 (-1.99;1.67) 0.998 (0.996;0.999)
bPSMA-SUVmax 38.43 vs. 38.45 -0.07 (-0.38;0.22) 1.000 (0.999;1.000) 38.43 vs. 38.43 0.05 (-0.20;0.31) 1.000 (1.000;1.000)
stPSMA-TV (ml) 67.8 vs. 68.6 3.10 (-8.24;14.45) 1.000 (0.999;1.000) 67.8 vs. 67.1 9.05 (-1.49;19.61) 0.999 (0.998;1.000)
stPSMA-TL 1026 vs. 1033 5.22 (-4.87;15.31) 1.000 (0.999;1.000) 1026 vs. 1016 8.70 (-1.37;18.77) 1.000 (0.999;1.000)
stPSMA-SUVmean 9.95 vs. 9.96 -0.43 (-1.86;0.98) 1.000 (0.999;1.000) 9.95 vs.9.92 -0.49 (-1.88;0.90) 0.999 (0.996;0.999)
stPSMA-SUVmax 31.23 vs. 31.20 0.18 (-0.15;0.53) 1.000 (1.000;1.000) 31.23 vs. 33.21 0.32 (-0.25;0.89) 1.000 (1.000;1.000)
by on June 4, 2020. For personal use only. jnm
.snmjournals.org
Dow
nloaded from

22
FIGURES
Figure 1. The six-step workflow of qPSMA.
Firstly, bone mask (A) and normal uptake mask (B)
are automatically computed. Then, SUVthr_st is
semi-automatically computed based on liver
background activity (C). Bone lesions are
segmented using SUVthr_bone (D), while soft-tissue
lesions are segmented using the SUVthr_st,
previously calculated at the third step (E). Finally,
the output parameters are obtained by performing
general statistics (F).
A
B
C
D
E
F
by on June 4, 2020. For personal use only. jnm.snmjournals.org Downloaded from

23
Figure 2. Examples of manual corrections in two mCRPC patients. (A) Due to their large
connections with the intestine, retroperitoneal lymph nodes were wrongly classified as normal
uptake and not taken into account when applied SUVthr_st. After correcting the normal uptake
label, the lymph nodes were segmented as soft-tissue lesions. (B) Ureter segmented as soft-tissue
lesions and manually changed to normal uptake label.
A B
by on June 4, 2020. For personal use only. jnm.snmjournals.org Downloaded from

24
Figure 3. Bland-Altman plot of qPSMA and METAVOL agreement on semi-automatic
computation of SUVthr_st. Solid line indicates the average mean difference, whereas dotted lines
delineate 95% limits of agreement (mean±1.96 *SD). No systematic difference between the two
software was found.
by on June 4, 2020. For personal use only. jnm.snmjournals.org Downloaded from
25
Figure 4. Bland-Altman Plots for Tumor Volume (A), Total Lesion (B), SUVmean (C) and
SUVmax (D) values from 68 lesions segmented with qPSMA and Syngo.via software. Solid lines
indicate the average mean difference, whereas dotted lines delineate 95% limits of agreement
(mean± 1.96 *SD).
by on June 4, 2020. For personal use only. jnm.snmjournals.org Downloaded from
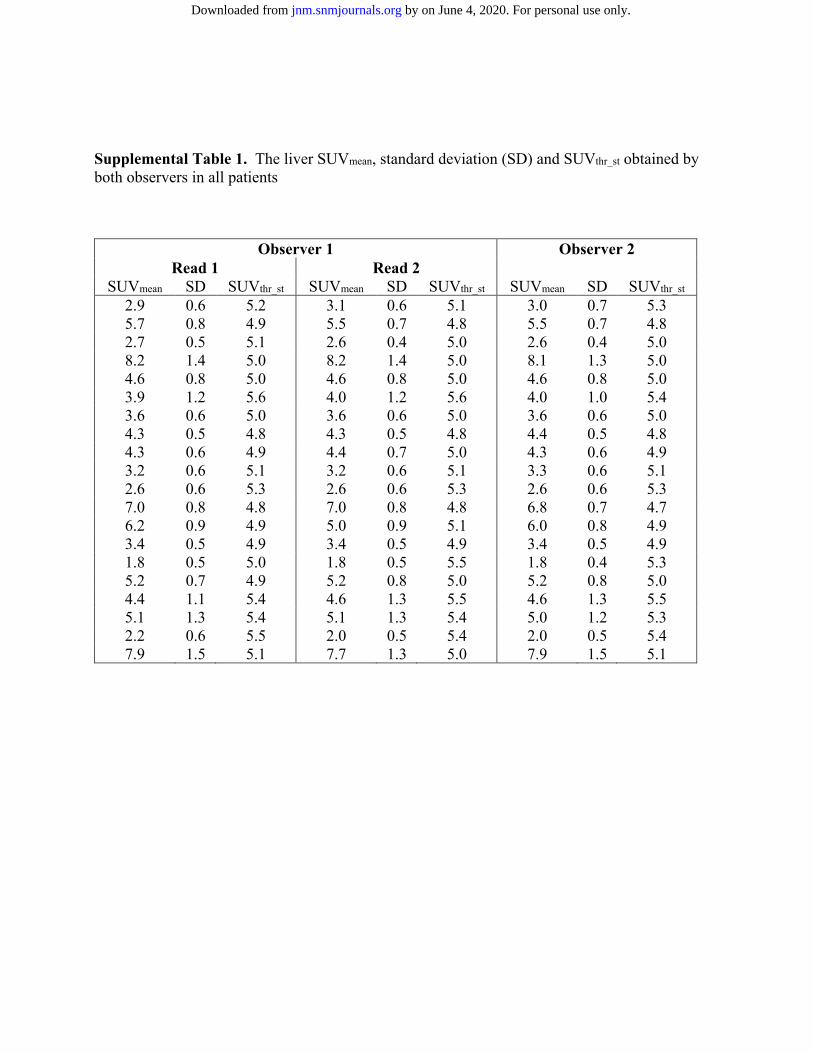
Supplemental Table 1. The liver SUVmean, standard deviation (SD) and SUVthr_st obtained by both observers in all patients
Observer 1 Observer 2 Read 1 Read 2
SUVmean SD SUVthr_st SUVmean SD SUVthr_st SUVmean SD SUVthr_st 2.9 0.6 5.2 3.1 0.6 5.1 3.0 0.7 5.3 5.7 0.8 4.9 5.5 0.7 4.8 5.5 0.7 4.8 2.7 0.5 5.1 2.6 0.4 5.0 2.6 0.4 5.0 8.2 1.4 5.0 8.2 1.4 5.0 8.1 1.3 5.0 4.6 0.8 5.0 4.6 0.8 5.0 4.6 0.8 5.0 3.9 1.2 5.6 4.0 1.2 5.6 4.0 1.0 5.4 3.6 0.6 5.0 3.6 0.6 5.0 3.6 0.6 5.0 4.3 0.5 4.8 4.3 0.5 4.8 4.4 0.5 4.8 4.3 0.6 4.9 4.4 0.7 5.0 4.3 0.6 4.9 3.2 0.6 5.1 3.2 0.6 5.1 3.3 0.6 5.1 2.6 0.6 5.3 2.6 0.6 5.3 2.6 0.6 5.3 7.0 0.8 4.8 7.0 0.8 4.8 6.8 0.7 4.7 6.2 0.9 4.9 5.0 0.9 5.1 6.0 0.8 4.9 3.4 0.5 4.9 3.4 0.5 4.9 3.4 0.5 4.9 1.8 0.5 5.0 1.8 0.5 5.5 1.8 0.4 5.3 5.2 0.7 4.9 5.2 0.8 5.0 5.2 0.8 5.0 4.4 1.1 5.4 4.6 1.3 5.5 4.6 1.3 5.5 5.1 1.3 5.4 5.1 1.3 5.4 5.0 1.2 5.3 2.2 0.6 5.5 2.0 0.5 5.4 2.0 0.5 5.4 7.9 1.5 5.1 7.7 1.3 5.0 7.9 1.5 5.1
by on June 4, 2020. For personal use only. jnm.snmjournals.org Downloaded from
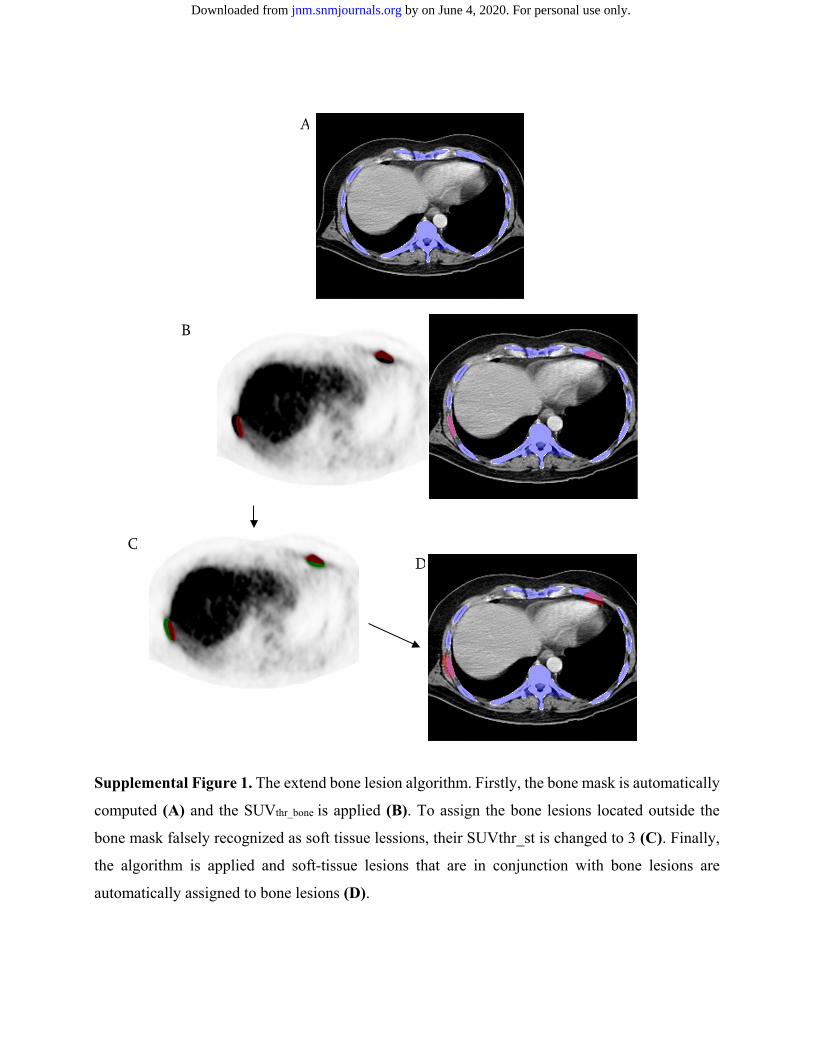
Supplemental Figure 1. The extend bone lesion algorithm. Firstly, the bone mask is automatically
computed (A) and the SUVthr_bone is applied (B). To assign the bone lesions located outside the
bone mask falsely recognized as soft tissue lessions, their SUVthr_st is changed to 3 (C). Finally,
the algorithm is applied and soft-tissue lesions that are in conjunction with bone lesions are
automatically assigned to bone lesions (D).
A
B
C D
by on June 4, 2020. For personal use only. jnm.snmjournals.org Downloaded from

Supplemental Figure 2. Example of SUVthr_st computation in two mCRPC patients with liver
involvement. Yellow discs represent the automatically computed 3-cm spherical VOI within right
liver lobe. The SUVthr_st values were 5.2 (A) and 5.0 (B). Liver metastases were subsequently
segmented (green labels).
A B
by on June 4, 2020. For personal use only. jnm.snmjournals.org Downloaded from

Doi: 10.2967/jnumed.118.224055Published online: March 8, 2019.J Nucl Med. and Matthias EiberAndrei Gafita, Marie Bieth, Markus Kroenke, Giles Tetteh, Elisabeth Guenther, Bjoern Menze, Wolfgang Andreas Weber
Ga-PSMA11 PET/CT68prostate cancer using qPSMA: a semi-automatic software for whole-body tumor burden assessment in
http://jnm.snmjournals.org/content/early/2019/02/28/jnumed.118.224055This article and updated information are available at:
http://jnm.snmjournals.org/site/subscriptions/online.xhtml
Information about subscriptions to JNM can be found at:
http://jnm.snmjournals.org/site/misc/permission.xhtmlInformation about reproducing figures, tables, or other portions of this article can be found online at:
and the final, published version.proofreading, and author review. This process may lead to differences between the accepted version of the manuscript
ahead of print area, they will be prepared for print and online publication, which includes copyediting, typesetting,JNMcopyedited, nor have they appeared in a print or online issue of the journal. Once the accepted manuscripts appear in the
. They have not beenJNM ahead of print articles have been peer reviewed and accepted for publication in JNM
(Print ISSN: 0161-5505, Online ISSN: 2159-662X)1850 Samuel Morse Drive, Reston, VA 20190.SNMMI | Society of Nuclear Medicine and Molecular Imaging
is published monthly.The Journal of Nuclear Medicine
© Copyright 2019 SNMMI; all rights reserved.
by on June 4, 2020. For personal use only. jnm.snmjournals.org Downloaded from