qrs detection using k-nearest neighbor algorithm (knn) and...
TRANSCRIPT

Journal of Advanced Research (2012) xxx, xxx–xxx
Cairo University
Journal of Advanced Research
ORIGINAL ARTICLE
QRS detection using K-Nearest Neighbor algorithm
(KNN) and evaluation on standard ECG databases
Indu Saini a,*, Dilbag Singh b, Arun Khosla a
a Department of Electronics and Communication Engineering, Dr. B.R. Ambedkar National Institute of Technology Jalandhar,Jalandhar 144 011, Indiab Department of Instrumentation and Control Engineering, Dr. B.R. Ambedkar National Institute of Technology Jalandhar,Jalandhar 144 011, India
Received 24 March 2012; revised 10 May 2012; accepted 30 May 2012
*
26
E-
Pe
Pst
20
ht
KEYWORDS
ECG;
QRS detection;
KNN;
Classifier;
Cross-validation;
Gradient
Corresponding author. Tel
90320/932.
mail address: indu.saini1@g
er review under responsibilit
Production an
lease cite this article in prandard ECG databases, J
90-1232 ª 2012 Cairo Unive
tp://dx.doi.org/10.1016/j.jare
.: +91
mail.com
y of Cari
d hostin
ess as: SAdv R
rsity. Pro
.2012.05.0
Abstract The performance of computer aided ECG analysis depends on the precise and accurate
delineation of QRS-complexes. This paper presents an application of K-Nearest Neighbor (KNN)
algorithm as a classifier for detection of QRS-complex in ECG. The proposed algorithm is evalu-
ated on two manually annotated standard databases such as CSE and MIT-BIH Arrhythmia data-
base. In this work, a digital band-pass filter is used to reduce false detection caused by interference
present in ECG signal and further gradient of the signal is used as a feature for QRS-detection. In
addition the accuracy of KNN based classifier is largely dependent on the value of K and type of
distance metric. The value of K = 3 and Euclidean distance metric has been proposed for the
KNN classifier, using fivefold cross-validation. The detection rates of 99.89% and 99.81% are
achieved for CSE and MIT-BIH databases respectively. The QRS detector obtained a sensitivity
Se = 99.86% and specificity Sp= 99.86% for CSE database, and Se = 99.81% and
Sp= 99.86% for MIT-BIH Arrhythmia database. A comparison is also made between proposed
algorithm and other published work using CSE and MIT-BIH Arrhythmia databases. These results
clearly establishes KNN algorithm for reliable and accurate QRS-detection.ª 2012 Cairo University. Production and hosting by Elsevier B.V. All rights reserved.
9876950214; fax: +91 181
(I. Saini).
o University.
g by Elsevier
aini I et al., QRS detection uses (2012), http://dx.doi.org/10.
duction and hosting by Elsevier B
07
Introduction
The function of human body is frequently associated with sig-nals of electrical, chemical, or acoustic origin. These signalsconvey information which may not be immediately perceived
but which is hidden in the signal’s structure and reflect proper-ties of their associated underlying biological systems. Extract-
ing K-Nearest Neighbor algorithm (KNN) and evaluation on1016/j.jare.2012.05.007
.V. All rights reserved.
2 I. Saini et al.
ing useful information from these biomedical signals has beenfound very helpful in explaining and identifying various path-ological conditions. The most important category of the
biomedical signal is the signals which are originated from theheart’s electrical activity. The heart is the one of the mostimportant organs of the human body hence it is termed as a
vital organ. It responds to body’s needs by adjusting its ratemoment to moment, relative to respiration, physical activity,the sleep cycle and other factors. Thus for determining the
heart’s ongoing functional variability there is a need of long-term measurements, computer driven calculations and detec-tion of subtle cyclical patterns. This electrical activity of thehuman heart, though it is quite low in amplitude (about
1 mV) can be detected on the body surface and recorded asan electrocardiogram (ECG) signal. The ECG, i.e. voltagemeasured as a function of time, arise because active tissues
within the heart generate electrical currents, which flow mostintensively within the heart muscle itself, and with lesser inten-sity throughout the body. The flow of current creates voltages
between the sites on the body surface where the electrodes areplaced. In this regard the ECG has been established as a fastand reliable tool for deciphering the current status of the heart
and has been also widely used in prognosis and diagnosis ofvarious cardiovascular diseases and abnormalities such asmyocardial ischemia and infarction, ventricular hypertrophy,and conduction problems. In general the normal ECG signal
consists of P, QRS and T waves and in particular the QRS-complex reflects the electrical activity within the heart duringthe ventricular contraction, the time of its occurrence as well
as its shape provide much information about the current stateof the heart. The QRS interval is a measure of the total dura-tion of ventricular tissue depolarization. The normal QRS
interval is 0.06–0.10 s in the adult. Due to its characteristicshape it serves as the basis for the automated determinationof the heart rate, as an entry point for classification schemes
of the cardiac disease diagnosis. Thus, QRS detection providesthe fundamental reference for almost all automated ECG anal-ysis algorithms. The ECG signal is only of the order of 1 mV inamplitude, thus it is most susceptible to interference from bio-
logical and environmental sources such as motion artifacts,skin potentials, muscle noise, power-line interference, andradio frequency interference. These types of interferences are
always accompanying the ECG acquisition and recording.That is why removal or suppression of the noise is requiredto be performed before QRS detection. A wide diversity of
algorithms have been reported in the literature, based onmathematical transformation [1–3] and pattern recognition[4], artificial neural networks [5–7], statistical methods [8,9],for QRS detection. The heuristic methods [10–12] were also
widely used in classifying the ECG signals. But the perfor-mance of these heuristic approaches is based on the amplechoice of the bandwidth of the band pass filtering and the
duration of the moving window used for integration. However,this choice is not, completely successful since large bandwidthpasses large amount of noise whereas narrow bandwidth
attenuates the QRS high frequency component. Similarly,large moving window duration increases the false positiveQRS-complexes detected while small duration causes missed
QRS-complexes. This is mainly due to the time variant charac-teristic of the QRS-complex. Later on wavelet transform (WT)was proposed to overcome the drawbacks of this fixed filteringbandwidth and moving window duration [13–16]. In order to
Please cite this article in press as: Saini I et al., QRS detection usstandard ECG databases, J Adv Res (2012), http://dx.doi.org/10.
further improve the detection accuracy, new signal analysistechnique based on empirical mode decomposition has beenproposed for detection of QRS-complexes [17].
Friesen et al. [18] have presented a comparison of nine QRSdetection algorithms based on: (i) amplitude and first deriva-tive, (ii) first derivative only, (iii) first and second derivative
and (iv) digital filtering.Kohler et al. [19] proposed an extensive review of various
approaches of QRS detection based on: (i) signal derivatives
and digital filters, (ii) wavelet-based QRS detection, (iii) neuralnetwork approaches, (iv) additional approaches like adaptivefilters, hidden Markov models, mathematical morphology,matched filters, genetic algorithms, Hilbert transform-based
QRS detection, etc.Previously, KNN method has been used in applications
such as data mining, statistical pattern recognition, image pro-
cessing, recognition of handwriting, ECG disease classifica-tion. This work is primarily motivated by the desire todesign an algorithm for precise and accurate delineation of
QRS-complexes which serves as a reference for the perfor-mance of automated ECG analysis. Thus, the aim of this workis to explore the merits of KNN algorithm as an ECG delinea-
tor and to demonstrate its superior performance over otherpublished works for CSE database and MIT-BIH Arrhythmiadatabase (the golden standard for QRS detection).
The KNN method is an instance based learning method
that stores all available data points (examples) and classifiesnew data points based on similarity measure. The idea under-lying the KNN method is to assign new unclassified examples
to the class to which the majority of its K nearest neighbors be-longs. This algorithm proves to be very effective, in terms ofreducing the misclassification error, when the number of sam-
ples in training dataset is large. Another advantage of theKNN method over many other supervised learning methodslike support vector machine (SVM), decision tree, neural net-
work, etc., is that it can easily deal with problems in whichthe class size is three and higher [20].
In KNN, the each training data consists of a set of vectorsand every vector has its own positive or negative class label,
where K represents the number of neighbors. In all the classi-fication techniques based on KNN, the classification accuracylargely depends on the value of K and the type of distance met-
rics used for computing nearest distance. Thus, in this work,an attempt has also been made to find out the optimal valueof K and distance metric using fivefold cross-validation for
achieving the highest classification accuracy. After evaluating
these best possible values of K and distance metric, a KNNalgorithm has been used for QRS detection.
Further, the accuracy of the KNN algorithm can be se-
verely degraded by the presence of (i) noisy data, (ii) irrelevantfeatures, and (iii) non-consistency of feature scales with theirimportance. Thus, for an efficient KNN based classification,
(i) digital filtering has been used to reduce the noise, and (ii)the gradient of the signal has been used as a feature for QRSdetection which serves to reduce the computational burden
on the KNN classifier.
Overview of K-Nearest Neighbor algorithm
The KNN is one of prospective statistical classification algo-rithms used for classifying objects based on closest training
ing K-Nearest Neighbor algorithm (KNN) and evaluation on1016/j.jare.2012.05.007
KNN based QRS detection in ECG signal 3
examples in the feature space. It is a lazy learning algorithmwhere the KNN function is approximated locally and all com-putations are deferred until classification. No actual model or
learning is performed during the training phase, although atraining dataset is required, it is used solely to populate a sam-ple of the search space with instances whose class is known, for
this reason, this algorithm is also known as lazy learning algo-rithm. It means that the training data points are not used to doany generalization and all the training data is needed during
the testing phase. When an instance whose class is unknownis presented for evaluation, the algorithm computes its K clos-est neighbors, and the class is assigned by voting among thoseneighbors. In KNN algorithm, training phase is very fast but
testing phase is costly in terms of both time and memory [21].The KNN algorithm consists of two phases: Training phase
and Classification phase. In training phase, the training exam-
ples are vectors (each with a class label) in a multidimensionalfeature space. In this phase, the feature vectors and class labelsof training samples are stored. In the classification phase, K is
a user-defined constant, a query or test point (unlabelled vec-tor) is classified by assigning a label, which is the most recur-rent among the K training samples nearest to that query
point. In other words, the KNN method compares the querypoint or an input feature vector with a library of reference vec-tors, and the query point is labeled with the nearest class of li-brary feature vector. This way of categorizing query points
based on their distance to points in a training data set is a sim-ple, yet an effective way of classifying new points.
Parameter K and distance metric
One of the advantages of the KNN method in classifying theobjects is that it requires only few parameters to tune: K and
the distance metric, for achieving sufficiently high classificationaccuracy. Thus, in KNN based implementations the bestchoice of K and distance metric for computing the nearest dis-
tance is a critical task. Generally, larger values of K reduce theeffect of noise on the classification, but make boundaries be-tween classes less distinct. The special case where the class ispredicted to be the class of the closest training sample (i.e.
when K= 1) is called the nearest neighbor algorithm. In bin-ary classification problems, it is helpful to choose K to be anodd number as it avoids tied votes. Thus, the value of K is de-
fined in such a way that it produces the highest correct classi-fication rate [21]. In this work the different values of K whichhave been tested are 1, 3, 5, 7 and 9. Further, the different dis-
tance metrics which are used in this work are Euclidean dis-tance, City Block and Correlation. The brief explanation ofthese distance metrics is as follows:
Distance metrics
Given an [mx · n] data matrix X, which is treated as[mx(1 · n)] row vectors x1, x2, . . . , xmx, and [my · n] data ma-
trix Y, which is treated as [my(1 · n)] row vectorsy1, y2, . . . , ymy, the various distances between the vector xsand yt are defined as follows:
Euclidean distance metric (EU)
This is the most usual way of computing a distance betweentwo objects. It examines the root of square differences between
Please cite this article in press as: Saini I et al., QRS detection usstandard ECG databases, J Adv Res (2012), http://dx.doi.org/10.
coordinates of a pair of objects and is defined using the follow-ing equation [22]:
dst ¼ffiffiffiffiffiffiffiffiffiffiffiffiffiffiffiffiffiffiffiffiffiffiffiffiffiffiffiffiffiffiffiffiffiXn
j¼1ðxsj � ytjÞ
2q
ð1Þ
City Block distance metric (CB)
It is based on Taxicab geometry, first considered by Hermann
Minkowski in the 19th century, is a form of geometry in whichthe usual metric of Euclidean geometry is replaced by a newmetric in which the distance between two points is the sum
of the absolute differences of their coordinates defined usingthe following equation:
dst ¼Xnj¼1jxsj � ytjj ð2Þ
The City Block distance metric is also known as Manhattandistance, boxcar distance, absolute value distance. It represents
distance between points in a city road grid. While the Euclid-ean corresponds to the length of the shortest path between twopoints (i.e. ‘‘as the crow flies’’), the City Block distance refersto the sum of distances along each dimension (i.e. ‘‘walking
round the block’’).
Correlation distance metric (CO)
It is one minus the sample correlation between points (treatedas sequences of values) and is defined using the followingequation:
dst ¼ 1� ðxs � xsÞðyt � ytÞ0ffiffiffiffiffiffiffiffiffiffiffiffiffiffiffiffiffiffiffiffiffiffiffiffiffiffiffiffiffiffiffiffiffiffiffiffiffi
ðxs � xsÞðxs � xsÞ0p ffiffiffiffiffiffiffiffiffiffiffiffiffiffiffiffiffiffiffiffiffiffiffiffiffiffiffiffiffiffiffiffiffiffiffiffi
ðyt � ytÞðyt � ytÞ0p ð3Þ
where
xs ¼1
n
Xj
xsj and yt ¼1
n
Xj
ysj
It is important to mention here that the performance of clas-sifiers is usually dependent upon the value of K and distancemetric. In this work these values are evolved through cross-
validation, which involves the determination of classificationaccuracy for multiple partitions of the input samples used intraining. The cross-validation is mainly used in settingswhere the goal is prediction, and one wants to estimate
how accurately a predictive model will perform in practice.In general, one round of cross-validation involves partition-ing a sample of data into complementary subsets, perform-
ing the analysis on one subset called the training set, andvalidating the analysis on the other subset called the testingset or validation set. Further, to reduce variability, multiple
rounds of cross-validation are performed using different par-titions, and the validation results are averaged over therounds.
In k-fold cross-validation, the original sample is randomlypartitioned into k subsamples. Of the k subsamples, a singlesubsample is retained as the validation data for testing themodel, and the remaining (k � 1) subsamples are used as train-
ing data. The cross-validation process is then repeated k-times(the folds), with each of the k subsamples used exactly once as
ing K-Nearest Neighbor algorithm (KNN) and evaluation on1016/j.jare.2012.05.007
4 I. Saini et al.
the validation data. The k results from the folds then can beaveraged to produce a single estimation.
Methodology
In this section, we describe the proposed algorithm for thedetection of QRS-complex in CSE and MIT-BIH databases
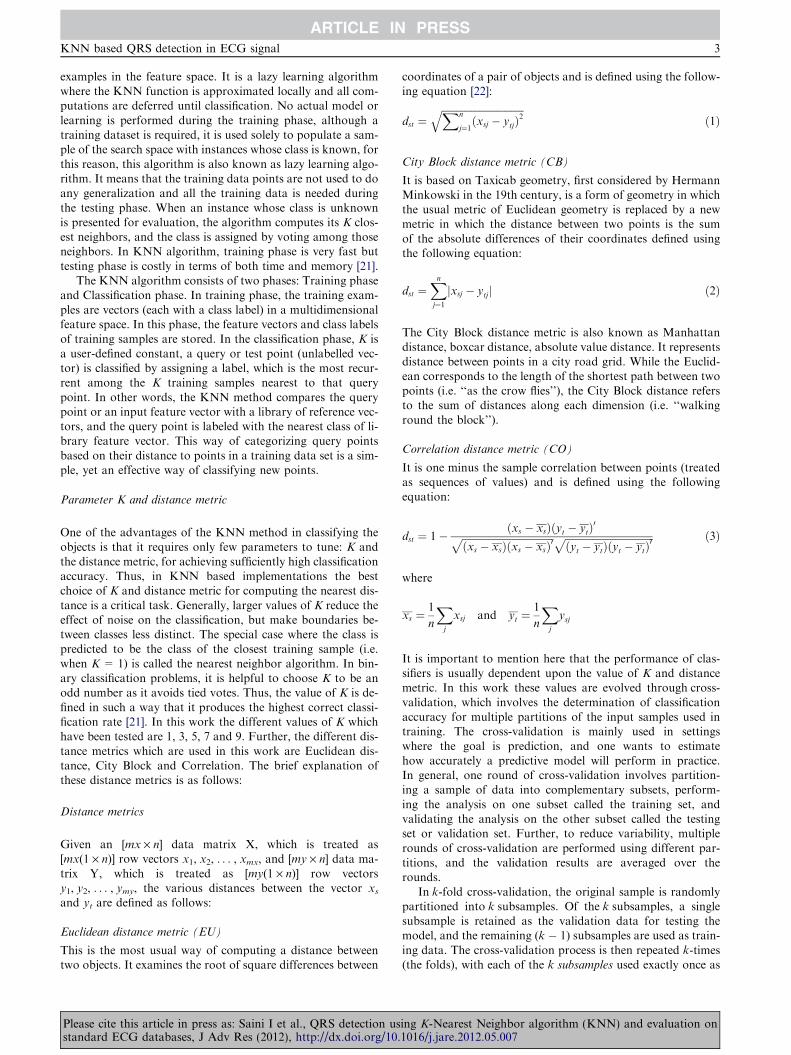
using KNN classifier. The algorithm schematic and the resultsfor 12-lead ECG CSE database are shown in Figs. 1 and 2respectively. Although the algorithm is designed for use on
12-lead ECG data at a time using CSE database and on 2-leadECG data using MIT-BIH database, the results for one leadare included here (in this case lead V6 of record no.
MO1_036 of CSE database) to demonstrate its effectivenessin identification of QRS-complex in ECG wave.
ECG databases
The databases used for the validation of the algorithm forQRS detection are CSE and MIT-BIH Arrhythmia.
CSE is Common Standards for Quantitative Electrocardi-
ography Database. There are three CSE reference data sets[23]. The first data set (CSE DS-1) consists of 3-lead ECGs,and has been recorded simultaneously in the standard
sequence. In the second data set (CSE DS-2), all the leads,i.e. standard 12 leads plus 3 Frank leads are recorded simulta-neously. A third CSE database (DS-3) has been developed for
Filtered Raw CSE and MIT-BIH Databases
Band Pass Filter
(5-12 Hz)
G
Fig. 1 Schematic representation of intermediat
Fig. 2 Results obtained at each step of the algorithm for lead V6 of r
(c) gradient curve of the ECG signal and (d) QRS locations.
Please cite this article in press as: Saini I et al., QRS detection usstandard ECG databases, J Adv Res (2012), http://dx.doi.org/10.
the assessment of diagnostic ECG and evaluates the perfor-mance of computer measurement programs. This databasecomprises multi-lead recordings of the standard ECG. All
the data have been sampled at 500 Hz. The multi-lead mea-surement database is composed of original and artificialECG recordings. This database has been split into two equal
sets, i.e. data set three and data set four. Each set consists ofECG recordings of 125 patients. File name starts with thecharacter MA and MO. The record length for these cases is
in principle 10 s for each lead. These ECGs have been analyzedby a group of five referee cardiologists and eleven computerprogrammers. In this paper CSE DS-3 original 125 files hasbeen used for QRS detection.
MIT-BIH Arrhythmia database was also considered forvalidation of this proposed algorithm. This database consistsof 48 half-hour recordings for a total of 24 h of ECG data.
Each one has a duration of 30 min and include two leads –the modified limb lead-II and one of the modified leads V1,V2, V4 or V5 [24], sampled at 360 Hz with resolution of
5 lV/bit. Two cardiologists have annotated all beats. This24 h MIT-BIH database contains more than 109,000 beats.
ECG signal pre-processing
A raw digital ECG signal of a record is acquired as shown inFig. 2a. This signal is often contaminated by disturbance suchas power-line interference; muscle noise and baseline wander.
In order to attenuate noise, the signal is bandpass filtered.
QRS-complex Detection
Gradient Curve
radient KNN Classifier
e steps for KNN algorithm implementation.
ecord MO1_036 of CSE database: (a) raw ECG, (b) filtered ECG,
ing K-Nearest Neighbor algorithm (KNN) and evaluation on1016/j.jare.2012.05.007

Tangent
Curve y(x)
y
A
x
Normal
Fig. 3 Gradient of a curve.
KNN based QRS detection in ECG signal 5
Bandpass filter
The bandpass filter reduces the influence of muscle noise,
50 Hz interference, baseline wander, and T-wave interference.The desirable passband to maximize the QRS energy isapproximately 5–15 Hz. For the databases used in this work,
a bandpass filter is used to achieve 3 dB passband from 5 to12 Hz, and is composed of cascaded highpass and lowpass fil-ters [11].
Lowpass filter
A lowpass filter is designed with a cut-off frequency of 11 Hzand the gain of 36 with filter processing delay of six samples.
The transfer function of the second order lowpass filter is
HðzÞ ¼ ð1� z�6Þ2
ð1� z�1Þ2ð4Þ
The amplitude response is
jHðwTÞj ¼ sin2ð3xTÞsin2ðxT=2Þ
ð5Þ
where T is the sampling period. The difference equation of the
filter is
yðnTÞ ¼ 2yðnT� TÞ � yðnT� 2TÞ þ xðnTÞ � 2xðnT� 6TÞ þ xðnT� 12TÞ ð6Þ
Table 1 Averaged classification accuracy using fivefold cross-
validation for different values of K and distance metrics.
Distance metrics K= 1 K= 3 K= 5 K= 7 K= 9
Euclidean (EU) 99.67 99.76 99.73 99.73 99.72
City Block (CB) 99.55 99.73 99.71 99.71 99.71
Correlation (CO) 99.58 99.74 99.73 99.72 99.72
Highpass filter
The design of the highpass filter is based on subtracting theoutput of a first-order lowpass filter from an allpass filter.
The low cut-off frequency of the filter is about 5 Hz, the gainis 32 and the delay is 16 samples.
The transfer function for such a highpass filter is
HðzÞ ¼ ð�1þ 32z�16 þ z�32Þð1þ z�1Þ ð7Þ
The amplitude response is
HðwTÞ ¼ ½256þ sin2ð16xTÞ�1=2
cosðxT=2Þ
���������� ð8Þ
The difference equation is
yðnTÞ ¼ 32xðnT� 16TÞ � ½yðnT� TÞ þ xðnTÞ � xðnT� 32TÞ� ð9Þ
The filtered ECG signal after removal of power-line interfer-ence and baseline wander is shown in Fig. 2b.
QRS-complex detection algorithm using gradient as feature
signal
Gradient calculation
The gradient is a vector, has both direction and units, thatpoints in the direction of the greatest rate of increase of the
scalar field, and whose magnitude is the greatest rate ofchange. The gradient of any function f, defined using Eq.(10) is the vector field whose components are the partial
derivatives of f.
rf ¼ @f
@x1
; . . . ;@f
@xn
� �ð10Þ
Please cite this article in press as: Saini I et al., QRS detection usstandard ECG databases, J Adv Res (2012), http://dx.doi.org/10.
In mathematics, gradient is widely used in measuring the de-gree of inclination, steepness or the rate of ascent or descent.A higher gradient value indicates a steeper incline. Thus it isclear that if the gradient of any signal under test is calculated,
then any part of the signal which is having a high slope willhave a higher value of gradient. The gradient of the curve asshown in Fig. 3, at point A is the same as that of the tangent
at point A. Drawing tangents is a rather cumbersome methodof obtaining gradients. Hence, the solution is differentiation.Differentiation allows to find the rate of change. Here in case
of ECG signal, it allows to find the rate of change of amplitudeof QRS-complex with respect to time samples. Thus, the QRS-complex as the most prominent wave component of ECGwave, having high slope and amplitude as compared to the rest
of the wave components results in higher value of gradientthan non-QRS regions. Further, the gradient also assists inthe formation of decision boundaries and this in turn helps
in reducing the computational burden of a classifier. Thereforebased upon this fact, in this part of the work an attempt hasbeen made to use the gradient as a feature vector for the detec-
tion of QRS-complexes [25].The gradient at each point in the ECG signal, will show the
direction the signal rises most quickly and the magnitude of
the gradient will determine how fast the signal rises in thatdirection. Moreover, the gradient is also being used to measurehow a signal changes in other directions, rather than just thedirection of greatest change, i.e. in the region of QRS-complex.
Thus in order to enhance the signal in the region of QRS-com-plex, the gradient of an ECG signal at each sampling instant iscalculated using Eq. (10). The gradient values so obtained are
then normalized as depicted in Fig. 2c [9].
Selection of K and distance metric
It is not known beforehand which value of K and the type of
distance metric are the best for this problem of componentwave detection. Thus, the objective of this part of the workis to obtain best value of K and optimal distance metric, using
ing K-Nearest Neighbor algorithm (KNN) and evaluation on1016/j.jare.2012.05.007

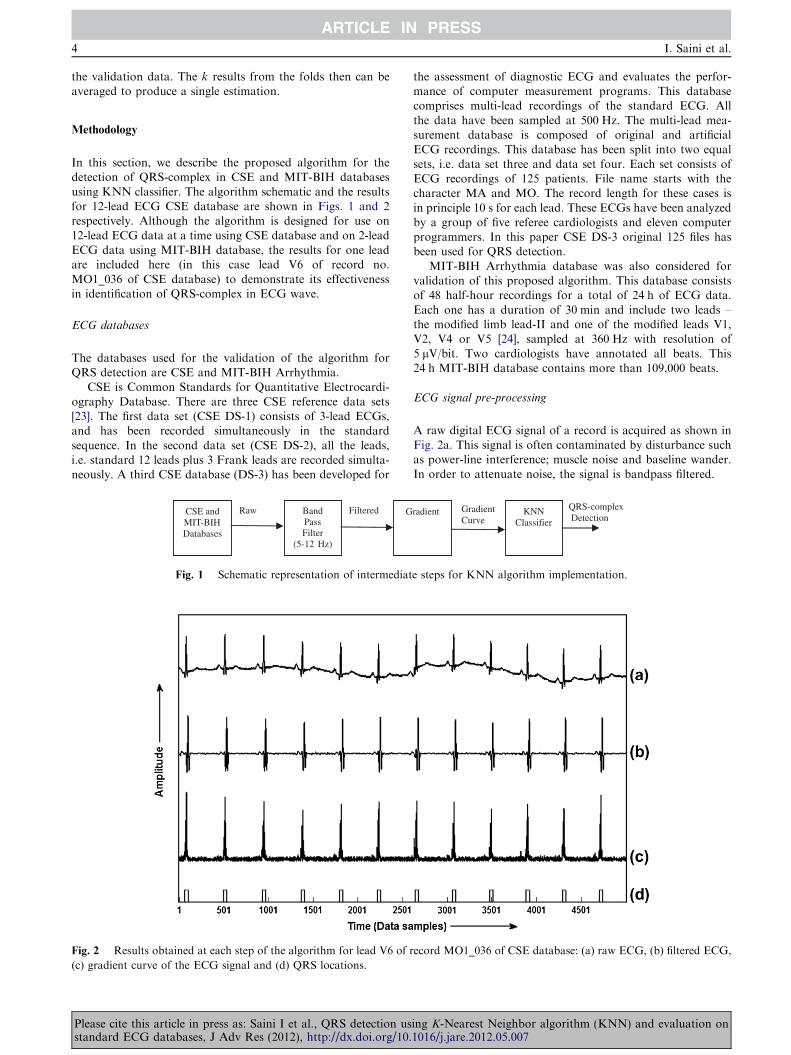
Table 2 Results of evaluating the KNN algorithm using CSE database.
Record Actual peak Detected peak TP FP FN Detection rate (%)
MO1_001 11 11 11 – – 100
MO1_002 19 19 19 – – 100
MO1_003 17 17 17 – – 100
MO1_004 12 12 12 – – 100
MO1_005 17 17 17 – – 100
MO1_006 16 16 16 – – 100
MO1_007 17 17 17 – – 100
MO1_008 10 10 10 – – 100
MO1_009 12 12 12 – – 100
MO1_010 07 07 07 – – 100
MO1_011 15 15 15 – – 100
MO1_012 13 13 13 – – 100
MO1_013 12 12 12 – – 100
MO1_014 08 08 08 – – 100
MO1_015 06 06 06 – – 100
MO1_016 16 16 16 – – 100
MO1_017 10 10 10 – – 100
MO1_018 15 15 15 – – 100
MO1_019 13 13 13 – – 100
MO1_020 22 22 22 – – 100
MO1_021 07 07 07 – – 100
MO1_022 12 12 12 – – 100
MO1_023 08 08 08 – – 100
MO1_024 09 09 09 – – 100
MO1_025 10 10 10 – – 100
MO1_026 13 13 13 – – 100
MO1_027 14 14 14 – – 100
MO1_028 10 10 10 – – 100
MO1_029 10 10 10 – – 100
MO1_030 12 12 12 – – 100
MO1_031 11 11 11 – – 100
MO1_032 14 14 14 – – 100
MO1_033 09 09 09 – – 100
MO1_034 12 12 12 – – 100
MO1_035 11 11 11 – – 100
MO1_036 12 12 12 – – 100
MO1_037 13 13 13 – – 100
MO1_038 11 11 11 – – 100
MO1_039 09 09 09 – – 100
MO1_040 12 12 12 – – 100
MO1_041 11 11 11 – – 100
MO1_042 11 11 11 – – 100
MO1_043 10 10 10 – – 100
MO1_044 08 08 08 – – 100
MO1_045 13 13 13 – – 100
MO1_046 12 12 12 – – 100
MO1_047 16 16 16 – – 100
MO1_048 10 10 10 – – 100
MO1_049 11 11 11 – – 100
MO1_050 08 08 08 – – 100
MO1_051 20 20 20 – – 100
MO1_052 15 15 15 – – 100
MO1_053 17 16 16 – 01 94.11
MO1_054 07 07 07 – – 100
MO1_055 09 09 09 – – 100
MO1_056 10 10 10 – – 100
MO1_057 10 10 10 – – 100
MO1_058 15 15 15 – – 100
MO1_059 08 08 08 – – 100
MO1_060 12 12 12 – – 100
MO1_061 13 13 13 – – 100
MO1_062 11 11 11 – – 100
MO1_063 09 09 09 – – 100
MO1_064 11 11 11 – – 100
6 I. Saini et al.
Please cite this article in press as: Saini I et al., QRS detection using K-Nearest Neighbor algorithm (KNN) and evaluation onstandard ECG databases, J Adv Res (2012), http://dx.doi.org/10.1016/j.jare.2012.05.007
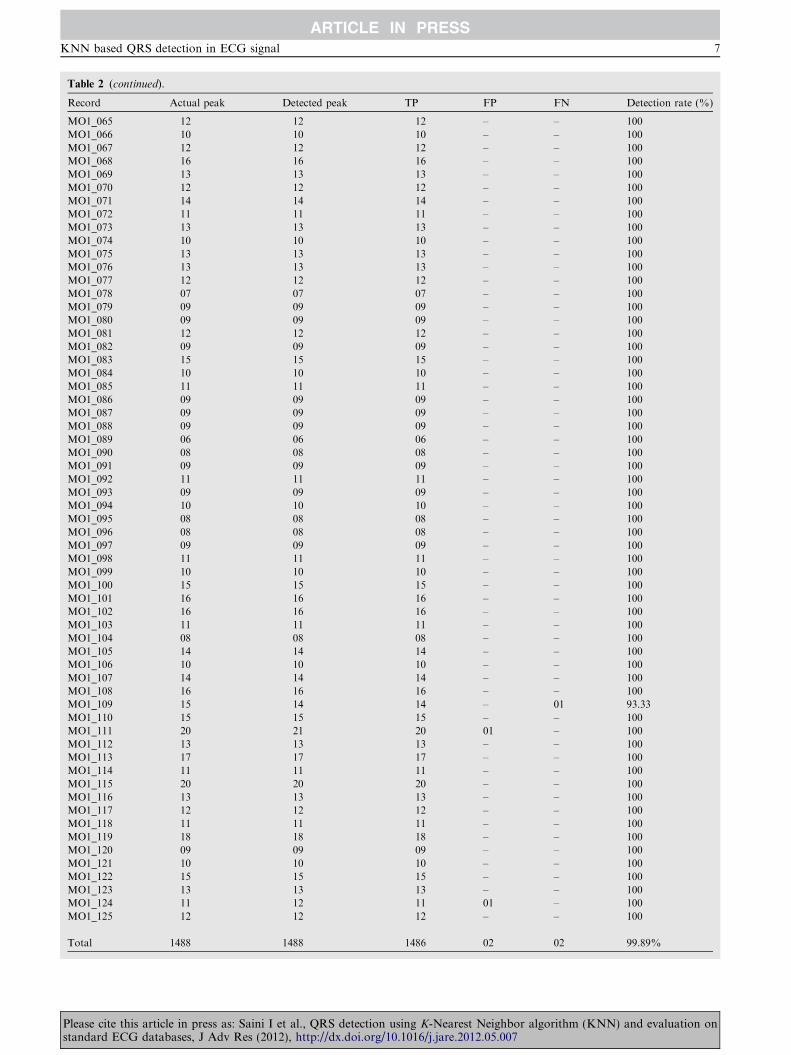
Table 2 (continued).
Record Actual peak Detected peak TP FP FN Detection rate (%)
MO1_065 12 12 12 – – 100
MO1_066 10 10 10 – – 100
MO1_067 12 12 12 – – 100
MO1_068 16 16 16 – – 100
MO1_069 13 13 13 – – 100
MO1_070 12 12 12 – – 100
MO1_071 14 14 14 – – 100
MO1_072 11 11 11 – – 100
MO1_073 13 13 13 – – 100
MO1_074 10 10 10 – – 100
MO1_075 13 13 13 – – 100
MO1_076 13 13 13 – – 100
MO1_077 12 12 12 – – 100
MO1_078 07 07 07 – – 100
MO1_079 09 09 09 – – 100
MO1_080 09 09 09 – – 100
MO1_081 12 12 12 – – 100
MO1_082 09 09 09 – – 100
MO1_083 15 15 15 – – 100
MO1_084 10 10 10 – – 100
MO1_085 11 11 11 – – 100
MO1_086 09 09 09 – – 100
MO1_087 09 09 09 – – 100
MO1_088 09 09 09 – – 100
MO1_089 06 06 06 – – 100
MO1_090 08 08 08 – – 100
MO1_091 09 09 09 – – 100
MO1_092 11 11 11 – – 100
MO1_093 09 09 09 – – 100
MO1_094 10 10 10 – – 100
MO1_095 08 08 08 – – 100
MO1_096 08 08 08 – – 100
MO1_097 09 09 09 – – 100
MO1_098 11 11 11 – – 100
MO1_099 10 10 10 – – 100
MO1_100 15 15 15 – – 100
MO1_101 16 16 16 – – 100
MO1_102 16 16 16 – – 100
MO1_103 11 11 11 – – 100
MO1_104 08 08 08 – – 100
MO1_105 14 14 14 – – 100
MO1_106 10 10 10 – – 100
MO1_107 14 14 14 – – 100
MO1_108 16 16 16 – – 100
MO1_109 15 14 14 – 01 93.33
MO1_110 15 15 15 – – 100
MO1_111 20 21 20 01 – 100
MO1_112 13 13 13 – – 100
MO1_113 17 17 17 – – 100
MO1_114 11 11 11 – – 100
MO1_115 20 20 20 – – 100
MO1_116 13 13 13 – – 100
MO1_117 12 12 12 – – 100
MO1_118 11 11 11 – – 100
MO1_119 18 18 18 – – 100
MO1_120 09 09 09 – – 100
MO1_121 10 10 10 – – 100
MO1_122 15 15 15 – – 100
MO1_123 13 13 13 – – 100
MO1_124 11 12 11 01 – 100
MO1_125 12 12 12 – – 100
Total 1488 1488 1486 02 02 99.89%
KNN based QRS detection in ECG signal 7
Please cite this article in press as: Saini I et al., QRS detection using K-Nearest Neighbor algorithm (KNN) and evaluation onstandard ECG databases, J Adv Res (2012), http://dx.doi.org/10.1016/j.jare.2012.05.007
8 I. Saini et al.
cross-validation, so that the classifier can accurately predict theunknown data (testing data). In the present study fivefoldcross-validation approach has been used to select the best K
value and type of distance metric. In this approach, the origi-nal sample/data is randomly partitioned into five subsamples,of the five subsamples, a single subsample is retained as the
validation data for testing the classifier, and the remain-ing subsamples are used as training data. The cross-validationprocess is then repeated five times (the folds), with each of
the five subsamples used exactly once as the validation data.The results from the fivefolds are then averaged to produce asingle estimation. Thus, each instance of the whole trainingset is predicted once so the cross-validation accuracy is the per-
centage of data which are correctly classified.Using fivefold cross-validation algorithm the results which
are obtained in terms of averaged classification accuracy, for
five different values of K, i.e. 1, 3, 5, 7 and 9 using three differ-ent methods of computing the nearest distance, i.e. Euclidean(EU), City-Block (CB), and Correlation (CO), are shown in
Table 1. After analyzing the results given in Table 1, it is foundthat the averaged classification accuracy obtained using EUdistance metric for K= 3 is highest, i.e. 99.76% in comparison
Fig. 4 QRS detection in record
Table 3 Comparison of proposed KNN algorithm with other QRS
Database QRS detector
CSE database KNN algorithm
SVM algorithm
Length and energy transformation
Time recursive prediction technique
K-means algorithm
Bottom up approach
Mathematical morphology
An integrated pattern recognition method
Predictive neural network based technique to detect Q
Please cite this article in press as: Saini I et al., QRS detection usstandard ECG databases, J Adv Res (2012), http://dx.doi.org/10.
to CB (99.73%) and CO (99.74%) distance metrics for thesame value of K. Also the averaged classification rate obtainedusing EU method is higher than CB and CO methods for all
the values of K. Thus it has been established that in terms ofclassification accuracy obtained using fivefold cross-validation,the optimal value of K is 3 and type of distance metric is
Euclidean.
Training phase
After obtaining the optimal value of K and type of distance
metric, the KNN classifier is now trained. The record no.MA1_001 of CSE database and record no. 100 of MIT-BIHdatabase were used for training the classifier.
The training phase for KNN consists of storing all knowninstances and their class labels. Here, in this phase, a [m · n]training matrix is formed, consisting of m training instances
of n features. The number of training instances (m) is equalto the number of samples of selected portions of ECGs, i.e.for CSE database the value of m= 5000 and for MIT-BIHdatabase m = 650,000. The value of n, which is the normalized
gradient value of each lead of the ECG at a training instance,for a CSE 12-lead ECG database is taken as 12, whereas for
MO1_008 of CSE database.
detection algorithms using CSE database.
Reference Detection rate (%)
Using proposed algorithm 99.89
[9] 99.75
[26] 99.60
[1] 99.00
[27] 98.66
[4] 98.49
[28] 99.38
[29] 99.83
RS complexes [5] 98.96
ing K-Nearest Neighbor algorithm (KNN) and evaluation on1016/j.jare.2012.05.007
KNN based QRS detection in ECG signal 9
MIT-BIH Arrhythmia 2-lead database is 2. If the training in-stance belongs to QRS region, the training label vector is setto 1 and if it belongs to non-QRS region it is set to �1.
Classification phase
A basic rule in classification analysis is that the testing is notmade for data samples that are used for training or learning.
Instead, testing is made for samples that are kept out of train-ing process. This was due to the reason that if testing is made
1 501 1001 1501 2001 2501-101
Time (Data sam
Am
plitu
de
FP
Fig. 6 QRS detection in record
Fig. 5 QRS detection in record
Please cite this article in press as: Saini I et al., QRS detection usstandard ECG databases, J Adv Res (2012), http://dx.doi.org/10.
for samples used in training or learning, the accuracy will beartificially biased upward.
Thus based upon this rule, after training the KNN, each re-
cord of the CSE and MIT-BIH databases is tested for thedetection of the QRS-complexes. Here, in case of CSE data-base, 10 s duration data has been used for testing while for
MIT-BIH database whole file of 30 min duration is used fortesting. After testing, a train of 1’s is obtained at the outputof KNN classifier. Then this train of 1’s is picked and by using
3001 3501 4001 4501
ples)
L2
aVR
aVL
aVF
V1
V2
V5
V4
V3
QRSLocation
L1
V6
L3
MO1_124 of CSE database.
MO1_109 of CSE database.
ing K-Nearest Neighbor algorithm (KNN) and evaluation on1016/j.jare.2012.05.007

10 I. Saini et al.
their duration, average pulse duration of 1’s is evaluated.Those trains of 1’s, whose duration turns out to be more thanthe average pulse duration are detected as QRS-complex and
the other are discarded. The locations of the QRS-complexes,as detected by KNN, are shown by the curve Fig. 2d.
Results and discussion
Although patterns of QRS-complexes hold considerablepromise for clarifying issues in clinical applications, the inac-
curate detection and quantification of these patterns may
Table 4 Results of evaluating the KNN algorithm using MIT-BIH
Data no. Actual peaks Detected peaks
100 2273 2273
101 1865 1865
102 2187 2187
103 2084 2084
104 2229 2218
105 2572 2557
106 2027 2033
107 2137 2137
108 1763 1753
109 2532 2532
111 2124 2124
112 2539 2539
113 1795 1795
114 1879 1879
115 1953 1953
116 2412 2411
117 1535 1537
118 2278 2280
119 1987 1997
121 1863 1863
122 2476 2476
123 1518 1518
124 1619 1619
200 2601 2598
201 1963 1947
202 2136 2145
203 2980 2975
205 2656 2654
207 2332 2325
208 2955 2955
209 3005 3006
210 2650 2645
212 2748 2749
213 3251 3254
214 2262 2264
215 3363 3364
217 2208 2202
219 2154 2146
220 2048 2049
221 2427 2427
222 2483 2476
223 2605 2604
228 2053 2052
230 2256 2255
231 1571 1571
232 1780 1779
233 3079 3079
234 2753 2755
48 patients 109,966 109,910
Please cite this article in press as: Saini I et al., QRS detection usstandard ECG databases, J Adv Res (2012), http://dx.doi.org/10.
obscure critical issues and may impede rather than fosterthe development of computerized ECG analysis in clinicalsettings. Thus by keeping this thing in consideration, the
evaluation of the performance of the proposed algorithmfor QRS-complex detection has been done using 125 original12-leads ECG recording of dataset-3 of CSE multi-lead mea-
surement library and 48 half-an-hour 2-leads recording ofMIT-BIH Arrhythmia database. Here, detection is said tobe true positive (TP) if the algorithm correctly detects the
QRS-complex, false negative (FN) if algorithm fails to iden-tify QRS-complex, and false positive (FP) if the algorithm
Arrhythmia database.
TP FP FN Det. rate (%)
2273 00 00 100
1865 00 00 100
2187 00 00 100
2084 00 00 100
2214 04 15 99.33
2560 01 12 99.53
2026 07 01 99.95
2137 00 00 100
1751 02 12 99.32
2532 00 00 100
2124 00 00 100
2538 01 01 99.96
1795 00 00 100
1872 07 07 99.63
1953 00 00 100
2411 00 01 99.96
1535 02 00 100
2278 02 00 100
1987 10 00 100
1863 00 00 100
2476 00 00 100
1518 00 00 100
1619 00 00 100
2583 15 18 99.31
1943 04 20 98.98
2135 10 01 99.95
2965 10 15 99.49
2653 01 03 99.88
2312 13 20 99.14
2951 04 04 99.86
3004 02 01 99.96
2643 02 07 99.73
2747 02 01 99.96
3249 05 02 99.94
2262 02 00 100
3361 03 02 99.94
2199 03 09 99.59
2144 02 10 99.53
2045 04 03 99.85
2423 04 04 99.83
2468 08 15 99.39
2598 06 07 99.73
2047 05 06 99.70
2255 00 01 99.95
1571 00 00 100
1776 03 04 99.77
3075 04 04 99.87
2752 03 01 99.96
109,759 151 207 99.81
ing K-Nearest Neighbor algorithm (KNN) and evaluation on1016/j.jare.2012.05.007
KNN based QRS detection in ECG signal 11
detects non-QRS-complex as QRS-complex. Further, theparameters which are used to evaluate the performance ofour proposed algorithm are: detection rate, sensitivity (Se)
and specificity (Sp). The detection rate, sensitivity and spec-ificity have been calculated using the Eqs. (11)–(13) respec-tively [10].
Detection rate ¼ ðActual beats� failed beatsÞðActual beatsÞ ð11Þ
Sensitivity; Se ¼TP
ðTPþ FNÞ ð12Þ
Specificity; Sp ¼TP
ðTPþ FPÞ ð13Þ
The quantitative values of the results of QRS detection usingproposed algorithm for all the records of CSE database, i.e.
from MO1_001 to MO1_125 are given in Table 2. After ana-lyzing the results given in Table 2 it has been found that thisalgorithm correctly detects the QRS-complexes in all the re-
cords except in record no. MO1_053, MO1_109, MO1_111and MO1_124. In MO1_053 and MO1_109 it detects 01 FNbeat each and in MO1_111 and MO1_124 it detects 01 FP beat
each. Further, by using Eqs. (11)–(13), the detection rate of99.89%, Se of 99.86% and Sp of 99.86% has been achieved.In addition a comparative table showing the results of QRS
detection using our proposed algorithm and other publishedworks for CSE data base is also given in Table 3[9,26,1,27,4,28,29,5]. The results clearly show that the pro-posed algorithm gives the improved detection rate of
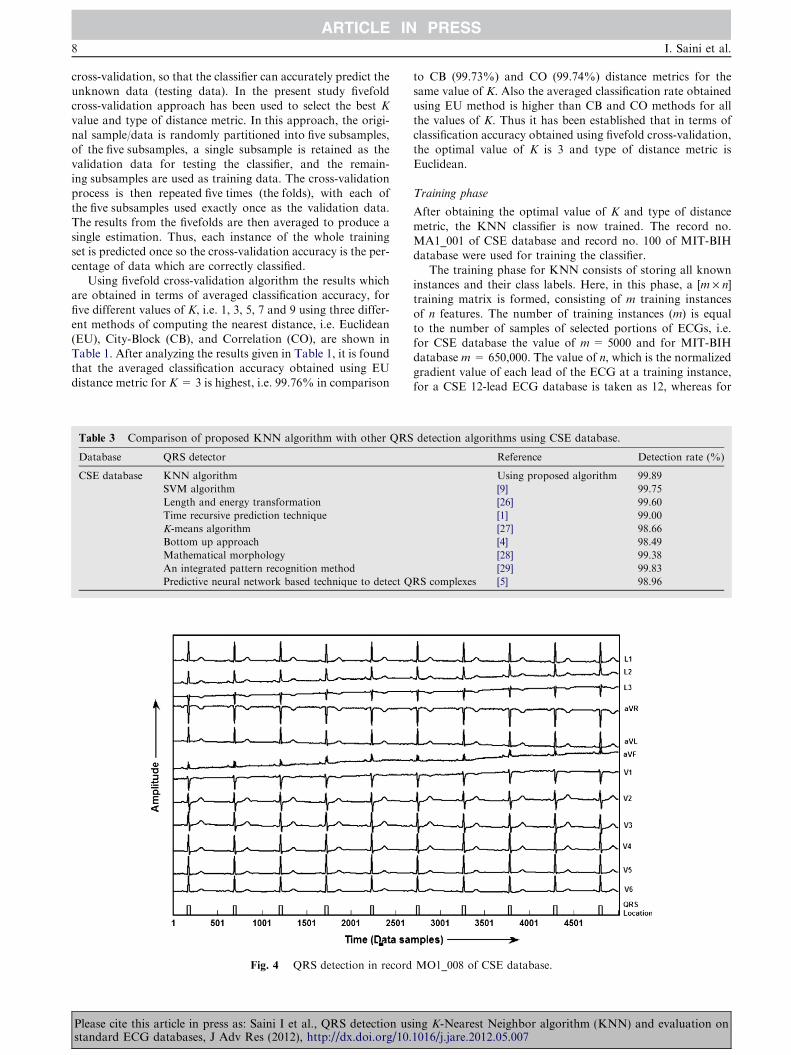
99.89%. In terms of visual representation of the results, the re-sults for record number MO1_008 of all the 12-leads of CSEdatabase is shown in Fig. 4. It has been seen that the proposed
classifier detects all the QRS-complexes without any false po-
Fig. 7 QRS detection in record no. 201
Please cite this article in press as: Saini I et al., QRS detection usstandard ECG databases, J Adv Res (2012), http://dx.doi.org/10.
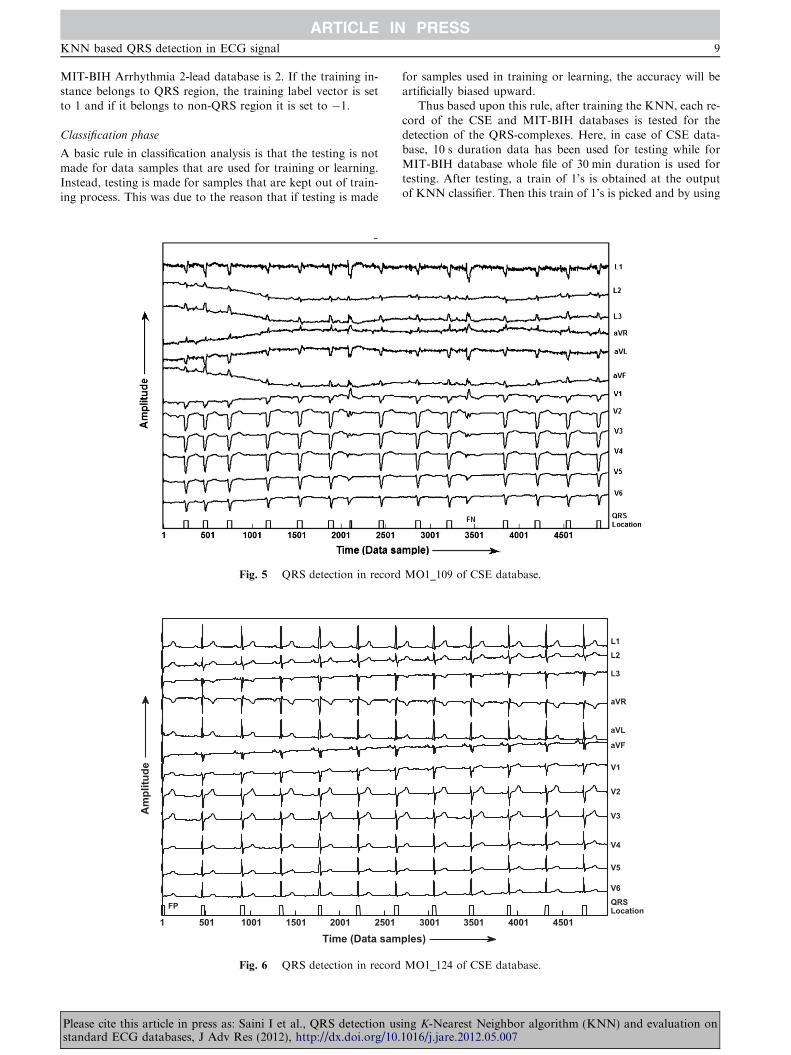
sitive and false negative detection. Further, the results of
QRS detection for record number MO1_109 of CSE databaseis given in Fig. 5, demonstrates that the proposed KNN clas-sifier fails to detect one QRS-complex, due to its very low
amplitude in most of the leads, and it is termed as false nega-tive (FN). However, all the QRS-complexes are accurately de-tected. Similarly the results for the detection of QRS-complexes of record number MO1_124 of CSE database
shown in Fig. 6, reveals that the algorithm detects one extranon-QRS-complex, termed as false positive (FP).
Furthermore, in order to validate the results, same algo-
rithm has been applied to MIT-BIH Arrhythmia databasefor QRS detection. The results given in Table 4, summarizesthe performance of our proposed algorithm. It has been shown
that the detection rate of 99.81% is achieved with 151 false po-sitive (FP) beats and 207 false negative (FN) beats. In addition,the Se of 99.81% and Sp of 99.86% has been achieved usingthis algorithm. In addition, the results of QRS detection for re-
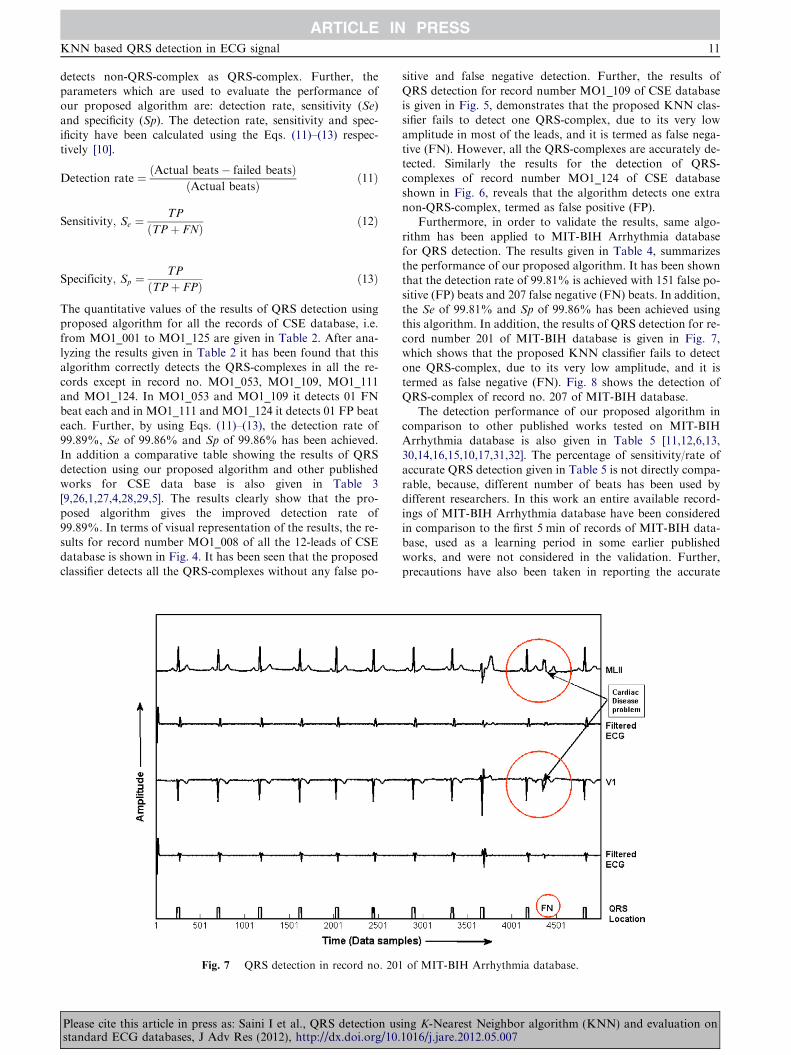
cord number 201 of MIT-BIH database is given in Fig. 7,which shows that the proposed KNN classifier fails to detectone QRS-complex, due to its very low amplitude, and it is
termed as false negative (FN). Fig. 8 shows the detection ofQRS-complex of record no. 207 of MIT-BIH database.
The detection performance of our proposed algorithm in
comparison to other published works tested on MIT-BIHArrhythmia database is also given in Table 5 [11,12,6,13,30,14,16,15,10,17,31,32]. The percentage of sensitivity/rate of
accurate QRS detection given in Table 5 is not directly compa-rable, because, different number of beats has been used bydifferent researchers. In this work an entire available record-ings of MIT-BIH Arrhythmia database have been considered
in comparison to the first 5 min of records of MIT-BIH data-base, used as a learning period in some earlier publishedworks, and were not considered in the validation. Further,
precautions have also been taken in reporting the accurate
of MIT-BIH Arrhythmia database.
ing K-Nearest Neighbor algorithm (KNN) and evaluation on1016/j.jare.2012.05.007
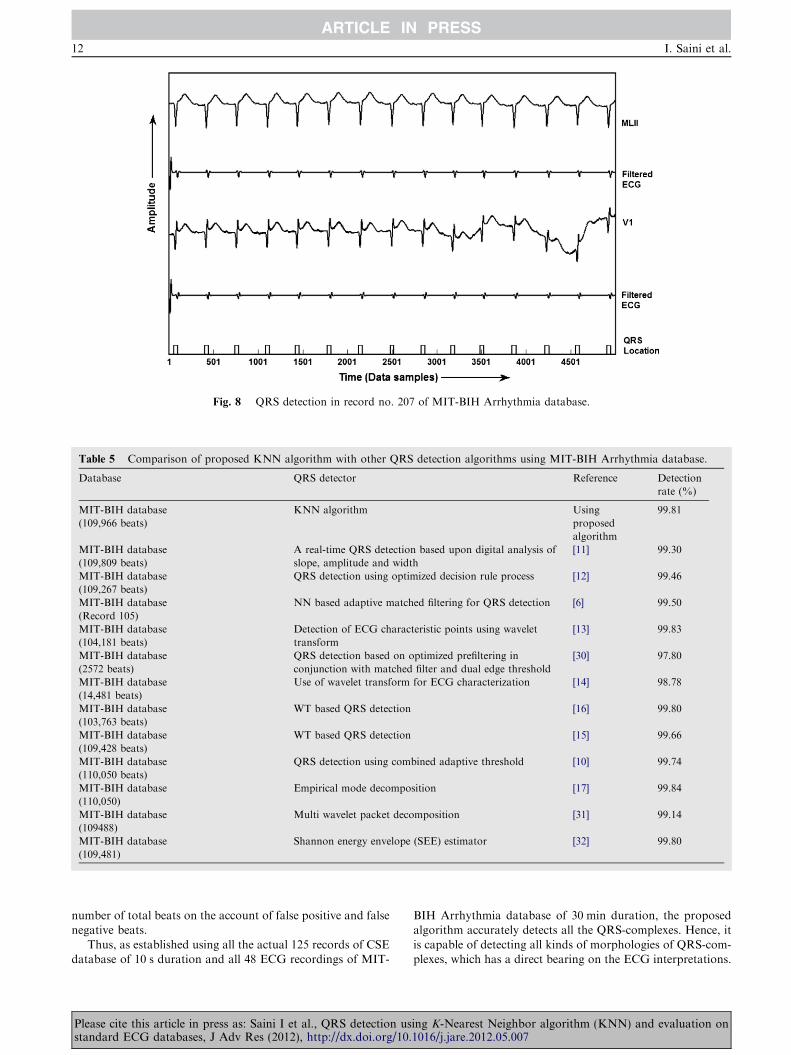
Fig. 8 QRS detection in record no. 207 of MIT-BIH Arrhythmia database.
Table 5 Comparison of proposed KNN algorithm with other QRS detection algorithms using MIT-BIH Arrhythmia database.
Database QRS detector Reference Detection
rate (%)
MIT-BIH database
(109,966 beats)
KNN algorithm Using
proposed
algorithm
99.81
MIT-BIH database
(109,809 beats)
A real-time QRS detection based upon digital analysis of
slope, amplitude and width
[11] 99.30
MIT-BIH database
(109,267 beats)
QRS detection using optimized decision rule process [12] 99.46
MIT-BIH database
(Record 105)
NN based adaptive matched filtering for QRS detection [6] 99.50
MIT-BIH database
(104,181 beats)
Detection of ECG characteristic points using wavelet
transform
[13] 99.83
MIT-BIH database
(2572 beats)
QRS detection based on optimized prefiltering in
conjunction with matched filter and dual edge threshold
[30] 97.80
MIT-BIH database
(14,481 beats)
Use of wavelet transform for ECG characterization [14] 98.78
MIT-BIH database
(103,763 beats)
WT based QRS detection [16] 99.80
MIT-BIH database
(109,428 beats)
WT based QRS detection [15] 99.66
MIT-BIH database
(110,050 beats)
QRS detection using combined adaptive threshold [10] 99.74
MIT-BIH database
(110,050)
Empirical mode decomposition [17] 99.84
MIT-BIH database
(109488)
Multi wavelet packet decomposition [31] 99.14
MIT-BIH database
(109,481)
Shannon energy envelope (SEE) estimator [32] 99.80
12 I. Saini et al.
number of total beats on the account of false positive and falsenegative beats.
Thus, as established using all the actual 125 records of CSEdatabase of 10 s duration and all 48 ECG recordings of MIT-
Please cite this article in press as: Saini I et al., QRS detection usstandard ECG databases, J Adv Res (2012), http://dx.doi.org/10.
BIH Arrhythmia database of 30 min duration, the proposedalgorithm accurately detects all the QRS-complexes. Hence, it
is capable of detecting all kinds of morphologies of QRS-com-plexes, which has a direct bearing on the ECG interpretations.
ing K-Nearest Neighbor algorithm (KNN) and evaluation on1016/j.jare.2012.05.007

KNN based QRS detection in ECG signal 13
Conclusion
The present paper lays much emphasis on (i) the algorithmicconsiderations of proposed algorithm, (ii) its methodological
aspects related to the classification and (iii) its capabilities ofdetecting QRS-complexes leading to the ability to preciselydiscriminate between pathologies. This paper proposes a
new method for QRS detection using KNN classifier. The re-sults has been validated on two different standard annotatedECG databases, (i) 125 original 12-leads ECG recording ofdataset-3 of CSE multi-lead measurement library and (ii) 48
half-an-hour 2-leads recording of MIT-BIH Arrhythmiadatabase. The purpose of using these databases of differentsampling rates is to take into consideration the wide diversity
of morphologies of ECG signals. In this work gradient of anECG signal has been calculated and used for the generationof a feature signal for the KNN classifier. Further, for the
accurate detection of QRS-complexes, an optimal value ofK, i.e. 3 and type of distance metric for computing the near-est distance, i.e. Euclidean has been proposed using fivefold
cross-validation for the KNN classifier. The efficacy of theproposed value of K and type of distance metric has beendemonstrated by performing the comparative analysis be-tween five different values of K, i.e. 1, 3, 5, 7 and 9 and three
types of distance metrics, i.e. Euclidian, City block and Cor-relation distance. Looking to the performance of the pro-posed algorithm, which gives the detection rate of 99.89%
on CSE DS-3 and 99.81% on MIT-BIH Arrhythmia dat-abases, prove the efficacy of KNN algorithm for the accurateand reliable detection of QRS-complexes. Further, the train-
ing done on a dataset is equally applicable for other datasetshaving same sample rate.
The results have also been compared with other contem-
porary published works and authenticated that this algorithmoutperforms the other existing algorithms (which includeseven the algorithms designed exclusively for real-time applica-tions) for the detection of QRS-complexes. Thus, it is possi-
ble that this algorithm of QRS detection is capable ofenhancing specific rhythms in ECG signals, which are in turnproves helpful in accurately detecting the QRS-complexes.
Hence, this method of detection of QRS-complexes leads toa better visual and automated ECG analysis, which is notonly desirable in basic physiology studies, but also a prere-
quisite for a widespread utilization of QRS detection tech-niques in clinical studies like heart rate variability, wheresimplicity and effectiveness of information are of primaryimportance.
References
[1] Kyrkos A, Giakoumakis EA, Carayannis G. QRS detection
through time recursive prediction technique. Signal Process
1988;15:429–36.
[2] Murthy ISN, Prasad GSSD. Analysis ECG from pole zero
models. IEEE Trans Biomed Eng 1992;39:741–51.
[3] Mehta SS, Lingayat NS. Combined entropy based method for
detection of QRS complexes in 12-lead electrocardiogram using
SVM. Comput Biol Med 2008;38:138–45.
[4] Trahanias PE, Skordalalkis E. Bottom up approach to the ECG
pattern-recognition problem. Med Biol Eng Comput
1989;27:221–9.
Please cite this article in press as: Saini I et al., QRS detection usstandard ECG databases, J Adv Res (2012), http://dx.doi.org/10.
[5] Vijaya G, Vinod K, Verma HK. ANN-based QRS-complex
analysis of ECG. J Med Eng Technol 1998;22:160–7.
[6] Xue Q, Hu YM, Tompkins WJ. Neural network based adaptive
matched filtering for QRS detection. IEEE Trans Biomed Eng
1992;39:317–29.
[7] Mehta SS, Dave V, Vyas SD, Chouhan VS. Detection of QRS-
complexes in 12-lead ECG using error back propagation neural
network. In: Int cong on bio and med eng, Singapore; 2002.
[8] Mehta SS, Lingayat NS. Development of entropy based
algorithm for cardiac beat detection in 12-lead
electrocardiogram. Signal Process 2007;87:3190–201.
[9] Mehta SS, Lingayat NS. Development of SVM based
classification techniques for the Delineation of wave
components in 12-lead electrocardiogram. Biomed Signal
Process Control 2008;3:341–9.
[10] Christov Ivaylo I. Real time electrocardiogram QRS detection
using combine adaptive threshold. Biomed Eng 2004;3:28
[Online].
[11] Pan J, Tompkins WJ. A real time QRS detection algorithm.
IEEE Trans Biomed Eng 1985;32:230–6.
[12] Hamilton PS, Tompkin WJ. Quantitative investigation of QRS
detection rules using MIT/BIH Arrhythmia database. IEEE
Trans BME 1986;33:1157–65.
[13] Li C, Zheng C, Tai C. Detection of ECG characteristic points
using wavelet transforms. IEEE Trans BME 1995;42:21–8.
[14] Sahambi JS, Tondon SN, Bhat RKP. Using wavelet transforms
for ECG characterization – an on-line digital signal processing
system. IEEE Eng Med Biol 1997:77–83.
[15] Pablo JM, Almeida R, Olmos SS, Rocha AP, Laguna P. A
wavelet-based ECG delineator: evaluation on standard
database. IEEE Trans BME 2004;51:570–80.
[16] Saxena SC, Vinod K, Hamde ST. QRS detection using new
wavelets. J Med Eng Technol 2002;26:7–15.
[17] Hadj Slimane Z-E, Amine N-A. QRS complex detection using
empirical mode decomposition. Digital Signal Process
2010;20:1221–8.
[18] Friesen GM, Thomas CJ, Jadallah MA, Yates SL, Quint SR,
Nagle HT. A comparison of the noise sensitivity of nine QRS
detection algorithm. IEEE Trans Biomed Eng 1990;37:85–98.
[19] Kohler B-U, Hennig C, Orglmeister R. The principles of
software QRS detection. IEEE Eng Med Biol Mag
2002;21:42–57.
[20] Yazdani A, Ebrahimi T, Hoffmann U. Classification of EEG
signals using Dempster Shafer theory and a K-nearest neighbor
classifier. In: Proc of the 4th int IEEE EMBS conf on neural
engineering, Antalya, Turkey; April 29–May 2, 2009. p. 327–30.
[21] Thirumuruganathan S. A detailed introduction to K-nearest
neighbor (KNN) algorithm; 2010.
[22] Karimifard S, Ahmadian A, Khoshnevisan M, Nambakhsh MS.
Morphological heart arrhythmia detection using Hermitian
basis functions and KNN classifier. In: Proceedings of the
28th IEEE EMBS annual international conference, New York
City, USA; August 30–September 3, 2006 p. 1367–70.
[23] Willems JL, Arnaud P, Van Bemmel JH, Bourdillon PJ, Degani
R, Denis B, et al. A reference database for multilead
electrocardiographic computer measurement programs. J Am
Coll Cardiol 1987;10:1313–21.
[24] Massachusetts Institute of Technology. MIT-BIH ECG
database. <http://www.physionet.org/cgi-bin/atm/ATM>.
[25] Chouhan VS, Mehta SS. Detection of QRS complexes in 12-lead
ECG using adaptive quantized threshold. Int J Comput Sci
Network Security 2008;8(1):155–63.
[26] Gritzali F. Towards a generalized scheme for QRS detection in
ECG waveforms. Signal Process 1998;15:183–92.
[27] Mehta SS, Shete DA, Lingayat NS, Chouhan VS. K-means
algorithm for the detection and delineation of QRS-complexes
in electrocardiogram. Elsevier IRBM 2010;31:48–54.
ing K-Nearest Neighbor algorithm (KNN) and evaluation on1016/j.jare.2012.05.007
14 I. Saini et al.
[28] Trahanias PE. An approach to QRS-complex detection using
mathematical morphology. IEEE Trans Biomed Eng
1993;40:201–5.
[29] MehtaSS,SaxenaSC,VermaHK.Computer-aided interpretation
of ECG for diagnostics. Int J Syst Sci 1996;27:43–58.
[30] Antti Ruha, Sallinen S, Nissila S. A real-time microprocessor
QRS detector system with a 1ms timing accuracy for the
measurement of ambulatory HRV. IEEE Trans BME
1997;44:159–67.
Please cite this article in press as: Saini I et al., QRS detection usstandard ECG databases, J Adv Res (2012), http://dx.doi.org/10.
[31] Chouakri SA, Bereksi-Reguig F, Taleb-Ahmed A. QRS complex
detection based on multiwavelet packet decomposition. Appl
Math Comput 2011;217:9508–25.
[32] Sabarimalai MM, Soman KP. A novel method for detecting R-
peaks in electrocardiogram (ECG) signal. Biomed. Signal
Process. Control 2012;7(2):112–28.
ing K-Nearest Neighbor algorithm (KNN) and evaluation on1016/j.jare.2012.05.007