qs return on investment report - topmba.com€¦ · talent acquisition and management at the...
TRANSCRIPT

QS Return on Investment ReportNorth American Full-Time MBA 2015
Nunzio Quacquarelli (MA University of Cambridge, MBA Wharton) Mansoor Iqbal (BA University of Leicester, MA University College London)
Benjamin Clayton (BA University of Cambridge)Daniel Kahn (BSc, BA Salford University)
Unlocking the value of the world’s top business schools
2
Share this report
About the Contributors
Editor-in-chief: Nunzio Quacquarelli is the founder and managing director of QS Quacquarelli
Symonds Ltd, publishers of TopMBA.com and organizers of the QS World MBA Tour. He holds an
MA from the University of Cambridge and an MBA from the Wharton School.
Editor: Mansoor is the editor of TopMBA.com and this report. He is a higher and business education
specialist with a background in consumer journalism, and has worked at QS since 2011. Mansoor
studied English literature at both BA and MA level.
Analyst: Benjamin Clayton, the report’s author, is a data analyst in the QS Intelligence Unit. His
research focuses on business education, particularly the MBA, as well as language contact and
the growth of English as a method of instruction. He works in QS’s London office.
Analyst: Daniel Kahn is a researcher with QS Quacquarelli Symonds Ltd, and heads up the data
collection team for the QS Global Business School Return on Investment Report. Before joining
QS he worked for the telecommunications company, Alcatel.

3
Share this report
Contents
1.0. Introduction 42.0 Fast Facts 63.0 Methodology 84.0 Full-Time MBA–The Employer Value 13
4.1. Salary Uplift 154.2. Percentage Employed on Graduation 164.3. Fostering Entrepreneurship 17
5.0. MBA Tuition Costs 186.0. MBA vs. Master’s Degrees 19
6.1. Comparing Salaries 216.2. Comparing the MBA & Master’s Value Proposition 23
7.0. Business School Return on Investment in North America 267.1. Payback period 267.2. 10-Year ROI 287.3. 20-Year ROI 29
8.0. Conclusion 30
4
Share this report
Why an MBA ROI report?
At no point in the long history of the MBA has
the value of the degree been simultaneously
more questioned, and yet more difficult to
ascertain. QS’s extensive applicant research
has identified a growing desire among
prospective MBAs to be able to estimate
the return they can expect on their business
school investment and to have a clearer
view of placement results across schools.
This series of reports are an attempt to
help applicants better understand the
value of the full-time MBA degree, as well
as differences in ROI across countries,
individual schools, and between the full-
time MBA and other graduate degrees.
This particular report covers North American
(limited to the US & Canada) business
schools, following on from our report
focusing on European business schools
published in January 2015. Other regions
will follow and the methodology will evolve
over time as we collect feedback from
schools and MBA students.
What have we found?
Studying a full-time MBA in North America
is as wise an investment as it always has
been. The return on investment for elite
MBA programs in the US & Canada remains
strong, tending to outstrip that of their
European counterparts over longer periods
of time, though higher average tuition
fees – especially for elite courses – can be
a barrier to entry.
Graduates from business schools across
North America are proof of the value of
the traditional full-time MBA, amid intense
competition from master’s programs
and a splintering of the MBA market into
multiple formats including online, part-
time, executive, and accelerated programs.
Employment rates and salaries for MBA
graduates are much higher than those for
graduates of other master’s programs,
reflecting the value employers place on
both the degree and the work experience
MBA graduates bring.
1.0. Introduction
5
Share this report
Every year for the last 25 years, we have
conducted the QS Global Employer Survey.
It is the largest and most comprehensive
employer survey of its kind, with over
30,000 respondents to the edition on which
our 2015/16 research is based. Among
these, nearly 4,000 declared themselves
to be MBA employers, providing QS with
unparalleled insight into demand for
MBAs, and the salaries on offer. This data,
along with extensive information collected
directly from business schools, provides
QS with the unique ability to evaluate
current business school placement results
and project them forward – the key to an
informed estimate of ROI.
In the pages that follow, you’ll find a great
deal of information on 85 top business
schools across North America that responded
to our request for information. QS has
chosen to publish tables without producing
an overall ranking, as the specific rank order
varies significantly depending on the unit of
measurement. We look at payback period,
10-year return on investment, 20-year
return on investment, and salary uplift on
graduation. So we have chosen to present
all these measures and allow the reader to
decide which metric matters most.
The ROI of an MBA is one the key motivations
for taking on the challenge and expense
of the degree; it’s our aim to shed light on
what this highly in-demand yet challenging
qualification could do for your career – but
it is up to individual readers to determine
what sort of return they are looking for.
How did we find it?

6
Share this report
2.0 Fast Facts
ð Employers value the full-time MBA more
than any other graduate business quali-
fication. For a graduate of a North Amer-
ican MBA program, the average salary is
$91,417. This compares very favorably
to the average North American master’s
graduate, at $59,769.
ð Anecdotal evidence, interviews with
recruiters, and the QS Global Employer
Survey all suggest that 2015 will have
been another strong year for growth in
MBA recruitment. Lori Cox, director of
talent acquisition and management at
the international consulting firm Kurt
Salmon states that, “As the result of new
business requirements, we have signif-
icantly ramped up our MBA recruiting
efforts in the past year or two.”
ð It is unsurprising that the US & Canada’s
tried and tested two-year course model
remains predominant. The average ROI
over 10 years on a North American MBA
is $0.50 million. 20 years post-MBA,
the average ROI of North American pro-
grams is $2.57 million.
ð The value of the full-time (FT) MBA in
the US & Canada is further emphasized
by the fact that on average 85% of FT
MBA graduates have a job within three
months of graduation, though difficul-
ties with work visa arrangements in the
US & Canada mean international MBA
students aren’t always able to work in
the region after completing their studies
at a North American business school.
ð A total of 28 business schools in North
America boast 20-year ROIs of $3 million
or more: Stanford, Harvard, Sloan, Whar-
ton, Booth, Columbia, Tuck, Haas, Ander-
son, Yale, Fuqua, Kellogg, S.C. Johnson,
Darden, Stern, Tepper, Goizueta, Mays,
Kelley, McDonough, Questrom, Ross,
Kenan-Flagler, McCombs, Jones, Schel-
ler, Fisher, and Marshall.
ð MBA graduates in North America, on aver-
age, recoup their business school invest-
ment in 44 months. At five schools in the
US & Canada, graduates can start earning
a return on their investment in less than
30 months: Mays (22), Haskayne (25),
Katz (25), Hough (28), and Goizueta (29).
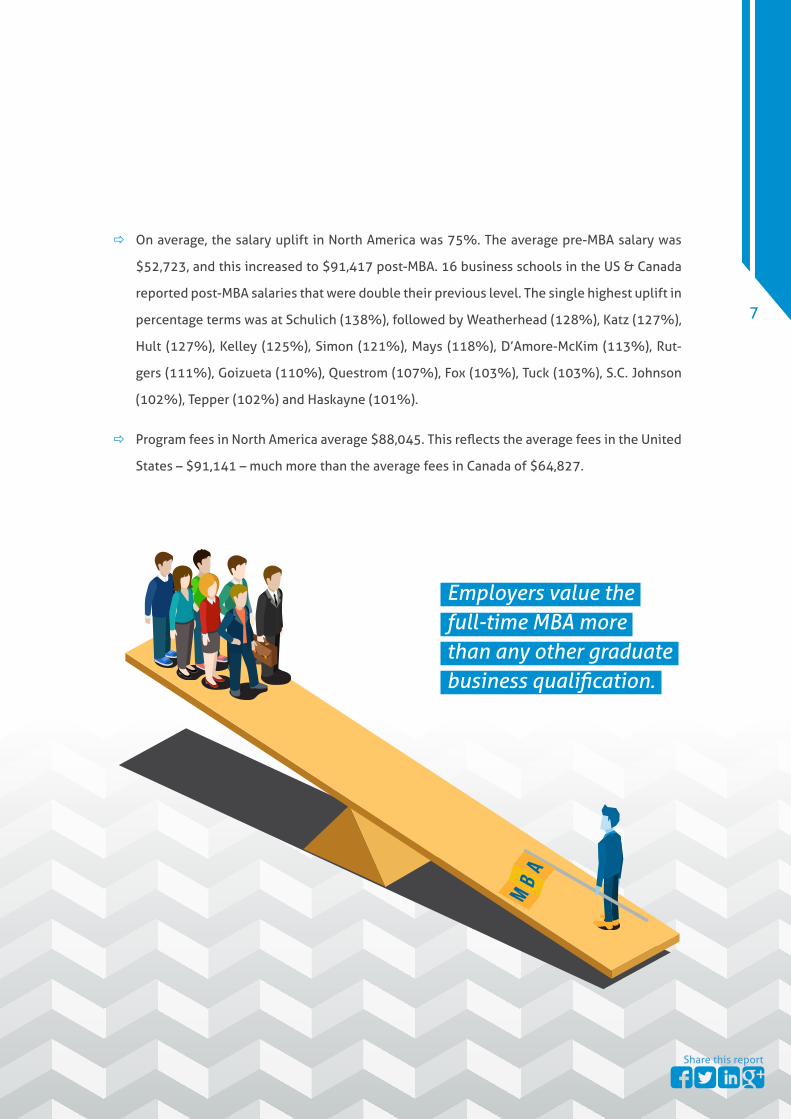
Employers value the full-time MBA morethan any other graduatebusiness qualification.
7
Share this report
ð On average, the salary uplift in North America was 75%. The average pre-MBA salary was
$52,723, and this increased to $91,417 post-MBA. 16 business schools in the US & Canada
reported post-MBA salaries that were double their previous level. The single highest uplift in
percentage terms was at Schulich (138%), followed by Weatherhead (128%), Katz (127%),
Hult (127%), Kelley (125%), Simon (121%), Mays (118%), D’Amore-McKim (113%), Rut-
gers (111%), Goizueta (110%), Questrom (107%), Fox (103%), Tuck (103%), S.C. Johnson
(102%), Tepper (102%) and Haskayne (101%).
ð Program fees in North America average $88,045. This reflects the average fees in the United
States – $91,141 – much more than the average fees in Canada of $64,827.

8
Share this report
All methodologies that measure ‘return
on investment’ (ROI) do so by first calcu-
lating the investment, then determining
the return. If you invest $100 in a stock on
January 1 and the stock is worth $105 by
December 31, after paying a $3 dividend,
the return is easy to calculate: the year-end
value of the stock plus dividend, minus the
original investment. In this case, the one-
year ROI was $8, or 8%.
Calculating a return on investment for grad-
uate business education is much more com-
plex, requiring a number of assumptions
about the future that may or may not turn
out to be true. The results are only as good
as the assumptions and the data used in the
calculations. One method used by many
media organizations is to calculate how long
it would take a graduate to recoup his or
her investment. In such simplified models,
which ignore inflation and other variables, if
tuition fees for a two-year MBA program are
$100,000, and students have a pre-MBA sal-
ary of $50,000 a year, the total investment is
$200,000. If graduates increase their salary
by an average of $50,000 a year, it will take
the typical student four years after gradua-
tion to recoup the $200,000 investment.
QS has sought to produce a more sophis-
ticated and rigorous measure of return on
investment. We have also sought to take a
longer-term perspective – a typical MBA
graduate will work for at least a further 20
years post-MBA and will receive a return
in each year of work. So why not calcu-
late the total return on the degree for 10,
or even 20 years after graduation? That’s
what we have set out to do for all 200
schools listed in our Global 200 Business
Schools Report. QS acknowledges that the
accuracy of the ROI estimate diminishes
the longer the time period, but we believe
there is valuable insight in providing this
‘lifetime’ perspective.
Starting with the list of 90 North Ameri-
can schools that feature in the Global 200
report, we eliminated those that declined
to participate and those for which we lacked
adequate data, narrowing the list to 85 for
this North American ROI report.
For each school, we first calculated the busi-
ness school ‘investment’ – adding together
the total cost of the MBA program with the
average forgone pre-MBA salary. For exam-
ple, for the MBA at Stanford GSB – a two-year
3.0 Methodology
9
Share this report
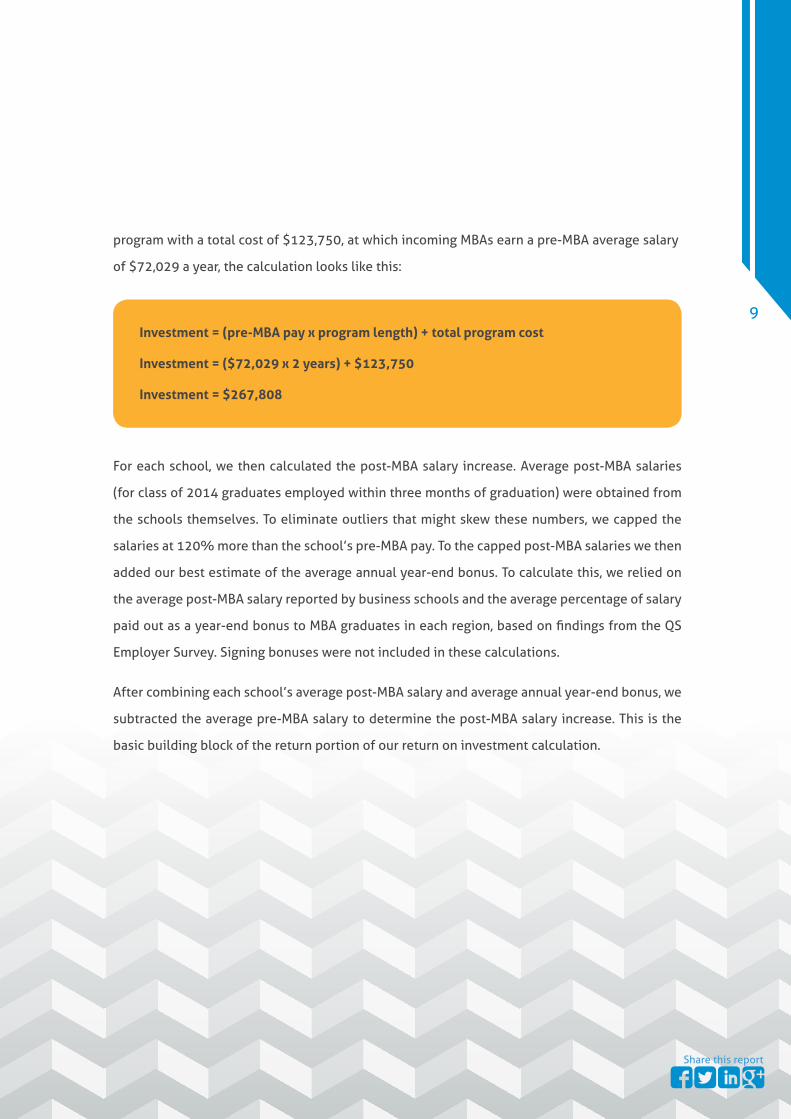
program with a total cost of $123,750, at which incoming MBAs earn a pre-MBA average salary
of $72,029 a year, the calculation looks like this:
Investment = (pre-MBA pay x program length) + total program cost
Investment = ($72,029 x 2 years) + $123,750
Investment = $267,808
For each school, we then calculated the post-MBA salary increase. Average post-MBA salaries
(for class of 2014 graduates employed within three months of graduation) were obtained from
the schools themselves. To eliminate outliers that might skew these numbers, we capped the
salaries at 120% more than the school’s pre-MBA pay. To the capped post-MBA salaries we then
added our best estimate of the average annual year-end bonus. To calculate this, we relied on
the average post-MBA salary reported by business schools and the average percentage of salary
paid out as a year-end bonus to MBA graduates in each region, based on findings from the QS
Employer Survey. Signing bonuses were not included in these calculations.
After combining each school’s average post-MBA salary and average annual year-end bonus, we
subtracted the average pre-MBA salary to determine the post-MBA salary increase. This is the
basic building block of the return portion of our return on investment calculation.
10
Share this report
ð Currency: Throughout this report, all amounts are listed in US dollars to allow ease of com-
parison across borders and because of the relative strength and stability of this currency as
a unit of measure. Most schools provided data in US$; data reported in Canadian dollars was
converted using the exchange rate of C$0.93 to US$1.00 (the relevant exchange rate for the
cohorts in question).
ð Living expenses: We have not included living expenses, as the student would incur these
even if not enrolled in an MBA program, and evidence suggests that MBA students tend to
live more frugally than they would if still in employment.
ð Tuition and financial aid: It is assumed that all candidates paid full tuition. QS recognizes
that a significant number of MBAs receive partial scholarships or financial aid and such aid
will have a significant positive impact on both payback period and ROI.
ð Tax: Tax has not been taken into account in these calculations.
Cost assumptions
Salary assumptions
ð Salary inflation: For the purposes of the ROI calculation we assumed that the average pay
of non-MBAs would increase at a rate of 3% per year, while the minimum expected rate of
pay increase of MBAs would be 5% (this minimum post MBA salary inflation is based on the
lower range reported by MBA employers responding to the QS Employer Survey).
ð Employer demand: Evidence suggests that a school’s reputation with employers positively
impacts the earning potential for graduates, so we awarded a bonus of as much as 3% per
year for schools that fared well in the QS Global 200 Business School Report (based on the
opinions of actively-hiring MBA employers and academics in the field of business & man-
agement). Those ranking in the top five globally received the full 3%, while those ranked 6
to 13 received 2.9%, those ranked 14 to 21 received 2.8%, and so on.

11
Share this report
ð Entrepreneurship: Research has shown
that MBA graduates who go on to start
their own businesses earn less in the
early years than those who follow a tra-
ditional MBA career path, but are likely
to earn more over their lifetime. We
awarded an additional bonus of up to
3% per year to salary growth, for the
first 10 years, to MBA programs where a
large percentage of graduates follow an
entrepreneurial path. Schools, reporting
that entrepreneurs accounted for 15 to
21% of their graduating class, received
the full 3%, while schools with fewer
entrepreneurs were awarded smaller
bonuses. Schools reporting less than 3%
of their graduating class starting their
own business received zero bonus.
ð Average period to find a job: We have
assumed the average time it takes for
graduates to find a job varies between
schools as a function of the percentage
employed three months after gradua-
tion. The lower the percentage of class
employed three months after gradua-
tion, the longer it is assumed the average
graduate of that school will have to wait
to begin to accrue positive earnings.
ð Industry and geography of employment:
QS does have data on the variation in
earnings of MBA graduates by indus-
try and by destination of employment.
However, for the purpose of simplifi-
cation, we have not incorporated this
data in this report. It is our intention to
allow candidates to calculate personal
ROIs based on their intended location
and industry of work.
12
Share this report
Outputs
ð 10 Year NPV: The present value of incre-
mental earnings derived from an MBA 10
years post graduation.
ð 20 year NPV: The present value of incre-
mental earnings derived from an MBA 20
years post graduation.
ð Payback Period: The average number
of months it takes a typical student to
recoup their business school invest-
ment post graduation.
ð Monthly returns are then calculated. We use a net present value (NPV) calculation to con-
vert the future income stream to 2015 US dollars using a discount rate of 2%. A net present
value represents how much extra an MBA graduate can expect to earn during a given time
period, above and beyond what they would likely have earned without an MBA. The follow-
ing outputs are derived.
13
Share this report
4.0 Full-Time MBA–The Employer Value
The question of an MBA’s ‘employer value’
is an unusual one. Unlike most other
higher education credentials, even other
professional degrees, where value is largely
determined by the knowledge and skills
acquired by the student, the MBA’s value
is seen by many in terms of employment
outcomes. The degree, in short, is worth
whatever it will fetch in the labor markets.
By that narrow yardstick the MBA has been
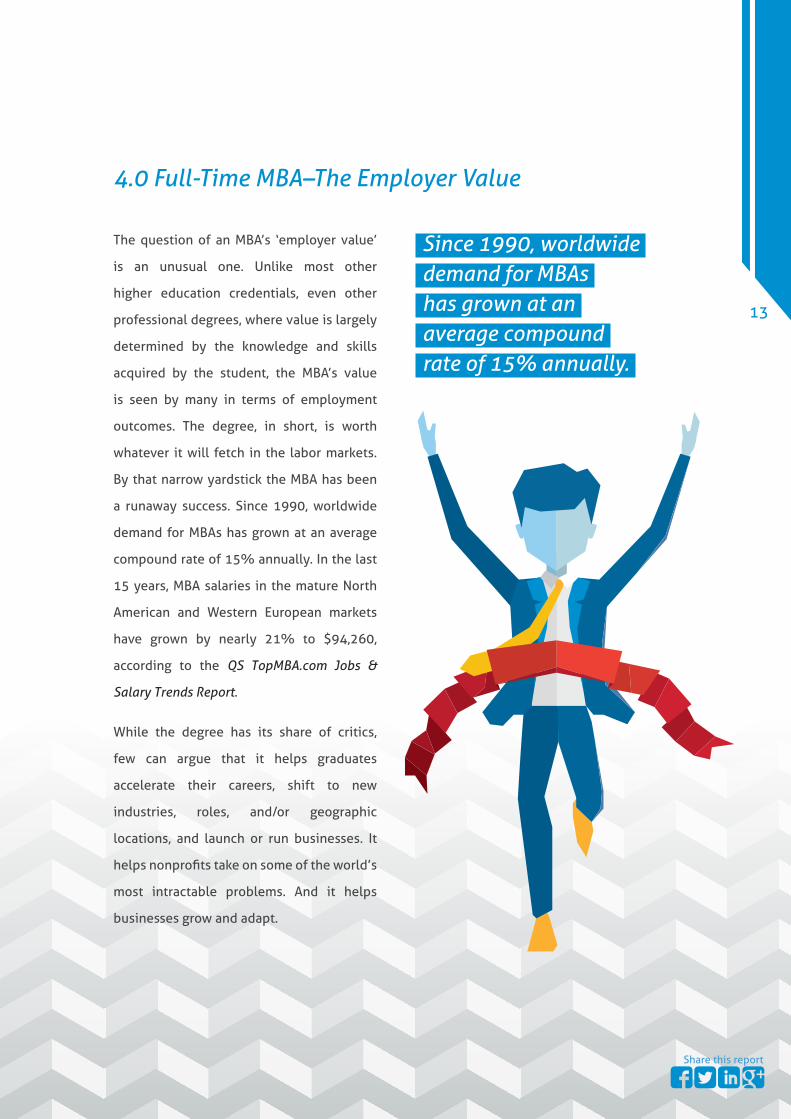
a runaway success. Since 1990, worldwide
demand for MBAs has grown at an average
compound rate of 15% annually. In the last
15 years, MBA salaries in the mature North
American and Western European markets
have grown by nearly 21% to $94,260,
according to the QS TopMBA.com Jobs &
Salary Trends Report.
While the degree has its share of critics,
few can argue that it helps graduates
accelerate their careers, shift to new
industries, roles, and/or geographic
locations, and launch or run businesses. It
helps nonprofits take on some of the world’s
most intractable problems. And it helps
businesses grow and adapt.
Since 1990, worldwide demand for MBAs has grown at an average compound rate of 15% annually.
14
Share this report
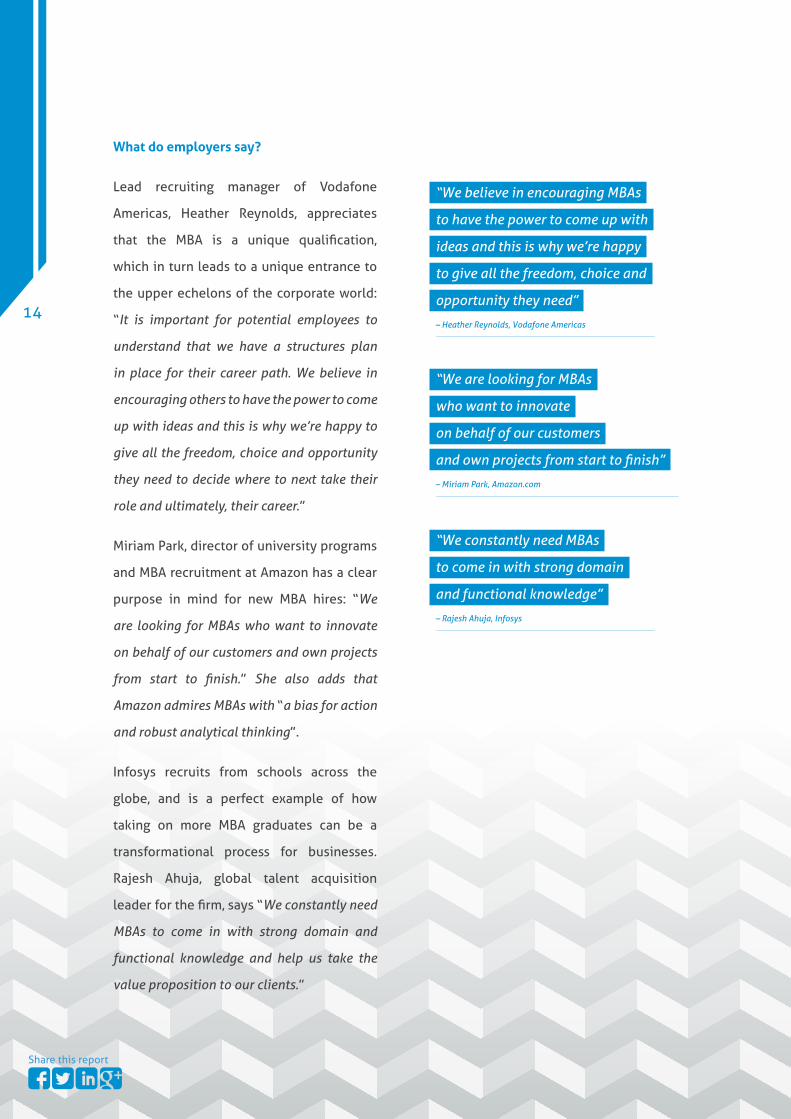
What do employers say?
Lead recruiting manager of Vodafone
Americas, Heather Reynolds, appreciates
that the MBA is a unique qualification,
which in turn leads to a unique entrance to
the upper echelons of the corporate world:
“It is important for potential employees to
understand that we have a structures plan
in place for their career path. We believe in
encouraging others to have the power to come
up with ideas and this is why we’re happy to
give all the freedom, choice and opportunity
they need to decide where to next take their
role and ultimately, their career.”
Miriam Park, director of university programs
and MBA recruitment at Amazon has a clear
purpose in mind for new MBA hires: “We
are looking for MBAs who want to innovate
on behalf of our customers and own projects
from start to finish.” She also adds that
Amazon admires MBAs with “a bias for action
and robust analytical thinking”.
Infosys recruits from schools across the
globe, and is a perfect example of how
taking on more MBA graduates can be a
transformational process for businesses.
Rajesh Ahuja, global talent acquisition
leader for the firm, says “We constantly need
MBAs to come in with strong domain and
functional knowledge and help us take the
value proposition to our clients.”
“We are looking for MBAs
who want to innovate
on behalf of our customers
and own projects from start to finish”
– Miriam Park, Amazon.com
“We believe in encouraging MBAs
to have the power to come up with
ideas and this is why we’re happy
to give all the freedom, choice and
opportunity they need”
– Heather Reynolds, Vodafone Americas
“We constantly need MBAs
to come in with strong domain
and functional knowledge”
– Rajesh Ahuja, Infosys

15
Share this report
Salary uplift is a good basic indicator of how employers value the MBA. As with any investment,
business school students seek a financial return in the form of higher salaries and bonuses.
It is safe to say that virtually every MBA graduate achieves that goal. Across the 85 North
American schools in our study, the average salary increase at graduation amounted to
$38,694, an increase of 75%.
Post-MBA pay increases were highest in the US, with an average increase of $40,761. Canadian
MBA graduates received an average increase of $23,190.
Individual schools with the biggest post-MBA salary increases were:
4.1. Salary Uplift
Top 20 %
Schulich School of Business, York University 138%
Weatherhead School of Management, Case Western Reserve University 128%
Katz Graduate School of Business, University of Pittsburgh 127%
Hult International Business School 127%
Kelley School of Business, Indiana University 125%
Simon Business School, University of Rochester 121%
Mays Business School, Texas A&M University 118%
D'Amore-McKim School of Business, Northeastern University 113%
Rutgers Business School, Rutgers University 111%
Goizueta Business School, Emory University 110%
Questrom School of Business, Boston University 107%
Fox School of Business, Temple University 103%
Tuck School of Business, Dartmouth College 103%
S.C. Johnson Graduate School of Management, Cornell University 102%
Tepper School of Business, Carnegie Mellon University 102%
Haskayne School of Business, University of Calgary 101%
Anderson School of Management, University of California, Los Angeles 97%
Hough Graduate School of Business, University of Florida 97%
Columbia Business School, Columbia University 95%
McDonough School of Business, Georgetown University 94%
Salary uplift

16
Share this report
A crucial indicator of the value of the MBA is found in employment statistics. The fact that
85% of MBA graduates from the US & Canada are employed three months after graduation is
testament to the employability of MBAs. Typically 45% of MBA graduates seek to change career
either by function, industry or geography, this making this statistic even more remarkable.
Despite continuing economic instability in some regions, schools are still seeing a strong
recruiter presence on campus. Sue Kline of MIT Sloan’s career development office says, “Right
now we’re not seeing any downturn in interest among companies wanting to recruit on campus.
So far the students have fared really well in the market.”
The MBA is an intensely career-focused degree, so it should come as no surprise that it
continues to boast such a high placement rate. Only nine of the 85 schools in our analysis
had an average placement rate of 70% or below within three months of graduation, while the
regional average was 85%. Schools in the US had a similar placement rate to those in Canada:
86% and 84% respectively.
4.2. Percentage Employed on Graduation
Top 20 %
Booth School of Business, University of Chicago 97.2
Olin School of Business, Washington University in St. Louis 96.9
Katz Graduate School of Business, University of Pittsburgh 96.2
Mays Business School, Texas A&M University 96.1
Foster School of Business, University of Washington 95.8
Broad College of Business, Michigan State University 95.6
Wharton School, University of Pennsylvania 95.6
Fox School of Business, Temple University 95.2
Simon Business School, University of Rochester 95
Sobey School of Business, Saint Mary's University 95
Goizueta Business School, Emory University 94.8
D'Amore-McKim School of Business, Northeastern University 93.8
Tuck School of Business, Dartmouth College 93.8
Rutgers Business School, Rutgers University 93.5
Darden School of Business, University of Virginia 93.4
Tippie College Of Business, University of Iowa 93
Scheller College of Business, Georgia Institute of Technology 92.9
Fisher College of Business, Ohio State University 92.8
Sloan School of Management, Massachusetts Institute of Technology 92.8
Hough Graduate School of Business, University of Florida 92.6
Employed within three months of graduation
17
Share this report
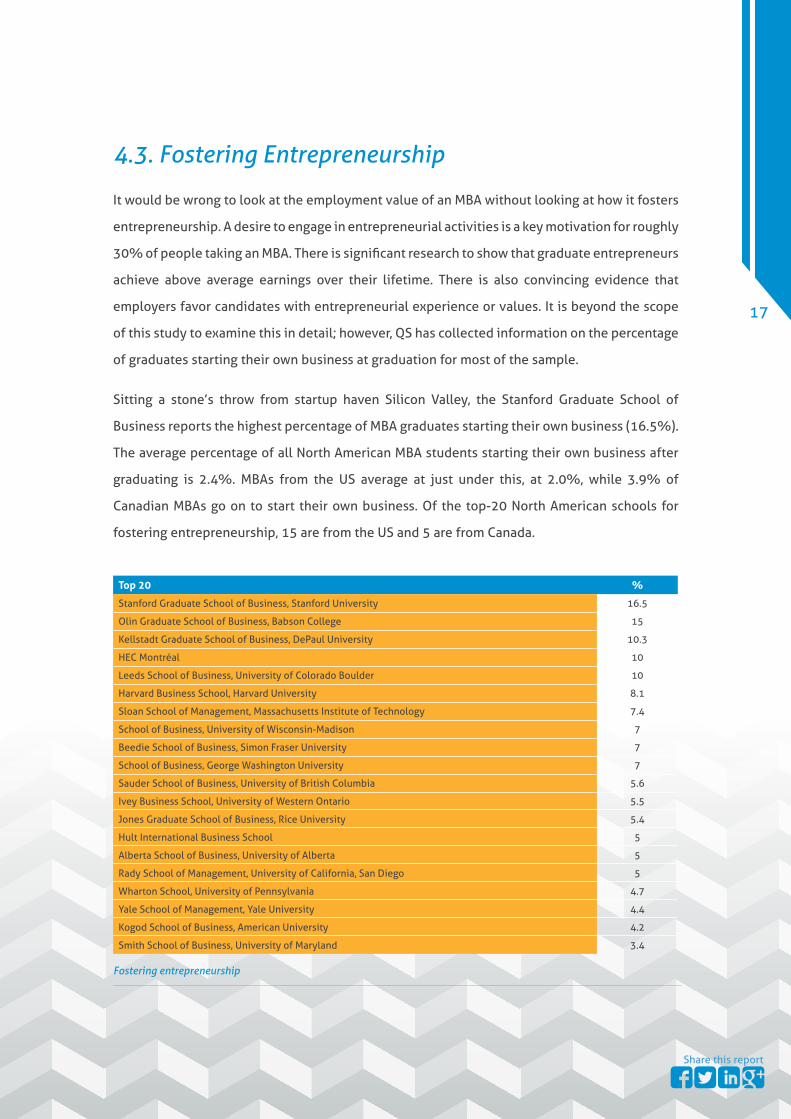
Fostering entrepreneurship
It would be wrong to look at the employment value of an MBA without looking at how it fosters
entrepreneurship. A desire to engage in entrepreneurial activities is a key motivation for roughly
30% of people taking an MBA. There is significant research to show that graduate entrepreneurs
achieve above average earnings over their lifetime. There is also convincing evidence that
employers favor candidates with entrepreneurial experience or values. It is beyond the scope
of this study to examine this in detail; however, QS has collected information on the percentage
of graduates starting their own business at graduation for most of the sample.
Sitting a stone’s throw from startup haven Silicon Valley, the Stanford Graduate School of
Business reports the highest percentage of MBA graduates starting their own business (16.5%).
The average percentage of all North American MBA students starting their own business after
graduating is 2.4%. MBAs from the US average at just under this, at 2.0%, while 3.9% of
Canadian MBAs go on to start their own business. Of the top-20 North American schools for
fostering entrepreneurship, 15 are from the US and 5 are from Canada.
4.3. Fostering Entrepreneurship
Top 20 %
Stanford Graduate School of Business, Stanford University 16.5
Olin Graduate School of Business, Babson College 15
Kellstadt Graduate School of Business, DePaul University 10.3
HEC Montréal 10
Leeds School of Business, University of Colorado Boulder 10
Harvard Business School, Harvard University 8.1
Sloan School of Management, Massachusetts Institute of Technology 7.4
School of Business, University of Wisconsin-Madison 7
Beedie School of Business, Simon Fraser University 7
School of Business, George Washington University 7
Sauder School of Business, University of British Columbia 5.6
Ivey Business School, University of Western Ontario 5.5
Jones Graduate School of Business, Rice University 5.4
Hult International Business School 5
Alberta School of Business, University of Alberta 5
Rady School of Management, University of California, San Diego 5
Wharton School, University of Pennsylvania 4.7
Yale School of Management, Yale University 4.4
Kogod School of Business, American University 4.2
Smith School of Business, University of Maryland 3.4
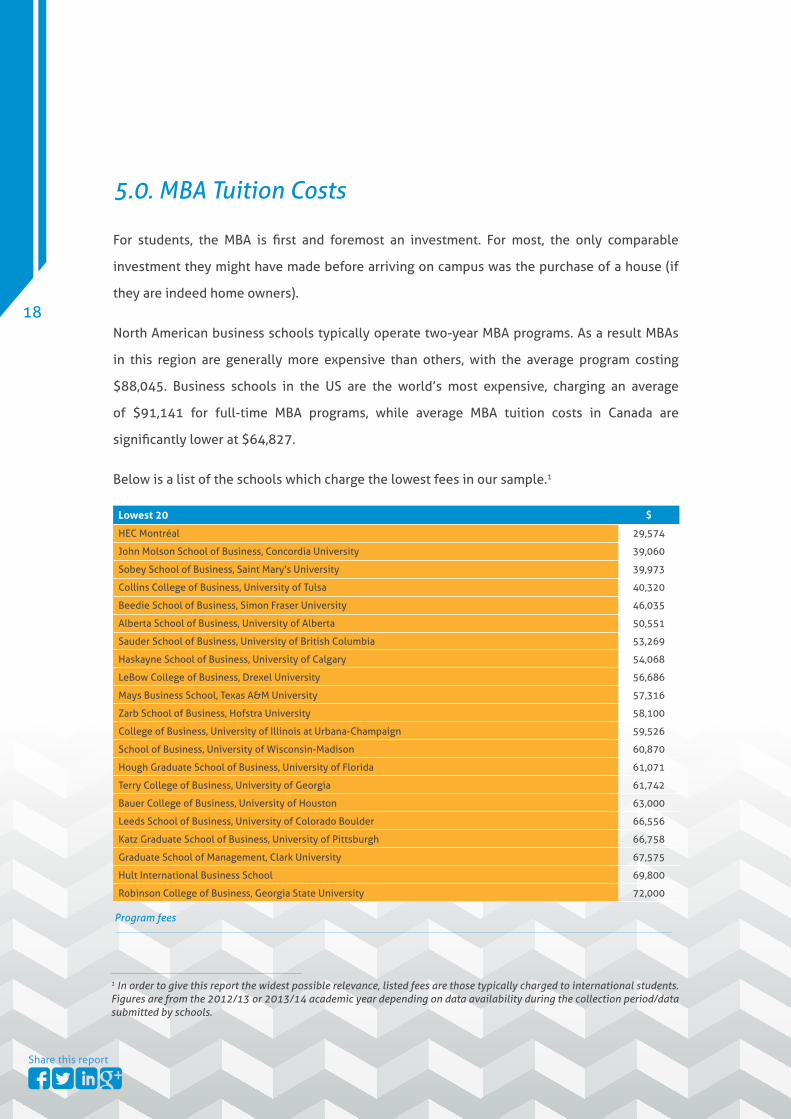
5.0. MBA Tuition Costs
For students, the MBA is first and foremost an investment. For most, the only comparable
investment they might have made before arriving on campus was the purchase of a house (if
they are indeed home owners).
North American business schools typically operate two-year MBA programs. As a result MBAs
in this region are generally more expensive than others, with the average program costing
$88,045. Business schools in the US are the world’s most expensive, charging an average
of $91,141 for full-time MBA programs, while average MBA tuition costs in Canada are
significantly lower at $64,827.
Below is a list of the schools which charge the lowest fees in our sample.1
Lowest 20 $
HEC Montréal 29,574
John Molson School of Business, Concordia University 39,060
Sobey School of Business, Saint Mary's University 39,973
Collins College of Business, University of Tulsa 40,320
Beedie School of Business, Simon Fraser University 46,035
Alberta School of Business, University of Alberta 50,551
Sauder School of Business, University of British Columbia 53,269
Haskayne School of Business, University of Calgary 54,068
LeBow College of Business, Drexel University 56,686
Mays Business School, Texas A&M University 57,316
Zarb School of Business, Hofstra University 58,100
College of Business, University of Illinois at Urbana- Champaign 59,526
School of Business, University of Wisconsin-Madison 60,870
Hough Graduate School of Business, University of Florida 61,071
Terry College of Business, University of Georgia 61,742
Bauer College of Business, University of Houston 63,000
Leeds School of Business, University of Colorado Boulder 66,556
Katz Graduate School of Business, University of Pittsburgh 66,758
Graduate School of Management, Clark University 67,575
Hult International Business School 69,800
Robinson College of Business, Georgia State University 72,000
Program fees
1 In order to give this report the widest possible relevance, listed fees are those typically charged to international students. Figures are from the 2012/13 or 2013/14 academic year depending on data availability during the collection period/data submitted by schools.
18
Share this report

6.0. MBA vs. Master’s Degrees – Comparing Salaries & More
The choices that confront a graduate
business applicant these days are far more
complex, and far more daunting, than they
were just a few short years ago. Full-time or
part-time; executive, or online? Domestic or
international? Which country? Which school?
Which specialization? How to pay for it all?
Today, in addition to those concerns, many
applicants are not limiting themselves to the
MBA, but are considering instead master’s
degrees of varying degrees of specialization .
These programs, frequently half the length
of the traditional two-year MBA, are designed
for younger applicants with little or no work
experience seeking training in any number
of disciplines from finance & accounting, to
marketing, to risk management to business
analytics, and more.
Such programs are becoming increasingly
popular, especially in Europe and North
America, where enrollment growth
for specialized master’s programs is
outstripping that of traditional MBA
programs. The Association to Advance
Collegiate Schools of Business (AACSB)
compared a controlled set of accredited
schools that answered its surveys in 2008-
09 and 2013-14, and found that worldwide
enrollment growth in specialized master’s
programs was up 42.6%, compared to 0.7%
for MBA programs in all formats. Specialized
master’s enrollment was up 17.8% in Asia
compared to 5.3% for MBA enrollment
and 43.2% in Europe compared to 18.9%
for MBA enrollment. In North America,
specialized master’s enrollment increased
by 49.5% for the five-year period, while
MBA enrollment declined by 5.4%.
The QS TopMBA.com Applicant Survey
2015 showed that 79% of applicants
were interested in studying full-time and
32% part-time MBA programs (multiple
options were permitted). These are not
the only formats available, though: 19%
were interested in online learning, and
11% in distance learning, while 17% were
interested in executive MBAs. Compared
to previous years, this means there’s
more interest in almost all study modes
except the full-time MBA.
The increase in applications to specialized
master’s degrees reflects a growing demand
for graduate-level education in general, as
well as an alternative to seeking full-time
19
Share this report

employment immediately after graduation.
A full-time MBA, which has far more
potential for increasing lifetime earnings,
requires some years of work experience
(typically two or three at least) and so many
graduates are faced with a choice – invest in
a specialist master’s today, or get a job and
wait for to take an MBA in a few years. Some
may plan to do both a master’s (in a non-
business & management field) and an MBA.
To simplify this choice, one can say that
specialized degrees will prepare graduates
for technical roles or specific functions
but tend not to develop the same breadth
of skills. The MBA prepares graduates
for positions in senior management, by
cultivating both technical and soft skills,
building on the maturity of the candidates.
Since MBAs have far more work experience
by the time they graduate, MBA salaries
at graduation are considerably higher.
According to survey data collected for the
QS TopMBA Jobs & Salary Trends Report
2015/16, MBAs earn a mean annual salary
of $97,300 in the US & Canada. The 2015
GMAC Corporate Recruiters Survey Report
reports a median starting salary in the US
for MBAs of $100,000. In this same report,
GMAC reported that specialized master’s
graduates earned a median of $64,300
in the US, while the QS Global Employer
Survey put this figure at $59,800. While
both degrees resulted in a salary increase,
choosing a specialized master’s degree
straight out of college resulted in a smaller
increase spread out a longer period of time,
while an MBA taken a few years later – years
spent in work, importantly – results in a
much larger increase over a quicker period.
The following tables show the salary
premium that MBA graduates achieve over
those with specialized master’s degrees.
20
Share this report

6.1. Comparing Salaries by Country and IndustryMBA and specialized master’s salaries, 2011-2015
Average MBA and specialized master’s degrees salaries, 2011-2015
2011 2012 2013 2014 2015
MBA $85,300 $89,400 $90,000 $97,700 $97,300
Master’s $54,400 $56,100 $55,140 $57,900 $59,800
Source: QS Global Employer Survey
Source: QS Global Employer Survey
Country MBA Master’s MBA Premium (%)
Regional average $92,900 $57,100 63%
Canada $87,575 $55,900 57%
US $93,700 $57,400 63%
21
Share this report

MBA and specialized master’s degrees salaries by industry, 2011-2015
(Western European & North American average)
Industry Sector MBA Master’s
Aerospace & Defense $86,601 $52,368
Construction & Property $106,164 $48,871
Consulting & Professional Services
$88,541 $49,095
Consumer Goods $91,088 $52,624
Education $78,172 $46,210
Electronics / High Technology $92,410 $60,594
Energy $105,835 $52,345
Financial Services / Banking
$96,007 $54,873
IT / Computer Services $89,052 $55,323
Law $82,500 $48,811
Manufacturing & Engineering $85,720 $52,097
Industry Sector MBA Master’s
Media & Entertainment $84,904 $47,033
Metals / Mining $131,945 $45,573
Pharmaceuticals & Biotech $98,786 $51,821
Government & Nonprofit $83,445 $53,403
Recruitment / HR $88,019 $40,108
Retail $82,373 $45,292
Telecommunications $91,332 $48,435
Transportation & Distribution $83,910 $45,446
Travel & Hospitality $79,228 $33,499
Utilities $79,359 $46,992
Source: QS Global Employer Survey
The table below compares the average salaries reported by employers to QS by industry sector,
for MBA-level entry compared to master’s-level entry.
22
Share this report

6.2. Comparing the MBA & Master’s Value Proposition
The opportunities for MBAs at elite
employers are still stronger than graduates
of specialized master’s courses. The 2015
GMAC Corporate Recruiters Survey Report
found that 84% of employers were planning
to hire MBAs, a growth of 10% from the
previous year. Demand for specialized
master’s graduates had either stayed stable
or decreased from last year, with 51%
looking for Master in Management graduates,
46% for Master of Finance graduates, and
44% for Master of Accounting graduates.
Why is this the case? Part of it is surely
work experience. QS’s research shows that
recruiters prefer candidates with three to
eight years of experience to those with less
than three years, 61% to 28%. These figures
have held steady for at least four years.
Interestingly, when GMAC tallied the
percentage of MBA students with early job
offers it found little difference between
those returning to their pre-MBA industries
and those seeking positions in a new one.
While the pay for these inexperienced
career switchers may be less, the findings
strongly suggest that employers believe
MBA programs add significant value and are
willing to act on that belief by making offers
to graduates who don’t have a great deal of
experience in their industry.
Amy Wittmayer, career services director
at UNC Kenan-Flagler has this advice for
prospective MBAs: “Interview and research
people in multiple career paths. Find out
what they enjoy most about their jobs.
Learn what motivates them. Visit their
offices. This homework will pay off once you
join a business school.”
One thing that separates full-time MBA
programs from specialized master’s degrees
is participation in the kind of extracurricular
bonding experiences that result in deep
attachments between students. Students
in specialized master’s programs are less
likely to seek a career change – particularly
given that many will not have started a
career-proper yet. Those who have are
more likely to seek advancement within
their existing industry, or even at the same
company, a fact that results in a different
approach to networking.
Students in specialized master’s programs
do, in fact, develop networks – in some cases
even global networks – but they are narrowly
focused on specific industries or functions,
such as finance, risk management, or
business analytics. “Students in the full-time
MBA program as well as in the MS programs
develop networks,” says Roy Lee, assistant
dean of global programs at New York
23
Share this report

University’s Stern School of Business. “But
the character of the networks is different.”
Another thing that sets MBA programs
apart are internships. The internship is an
established talent pipeline from schools
to companies, particularly important for
career switchers or those with little or no
experience in their target industry. Of the
employers surveyed by GMAC in 2015,
67% had employed MBA interns and 85%
of these employers went on to offer one or
more of these interns a full-time position.
By comparison, 50% of companies in the US
had master’s level business interns, though
a similar proportion of these (83%) offered
at least one a full-time job upon graduation.
While significantly more employers had non-
MBA interns this year than last year (when
the figure stood at 29%), MBA students are
still at a clear advantage when it comes to
finding internships.
Sheryle Dirks, associate dean for career
management at Duke University’s Fuqua
School of Business, says internships help
employers determine if the student is a good
fit before committing to an offer, adding that
interns serve as natural ambassadors for the
employer back on campus and can assist in
recruiting. “An MBA intern offers benefits to
an employer that pay off in both the short
and long term,” she reflects. “A talented
MBA brings fresh eyes and an extra set of
hands to immediate business challenges
and can productively move forward projects
that might otherwise be left undone. In
the process, company leaders see the
student in action for several months, which
provides a more in-depth ‘test drive’ than a
traditional hiring process.”
Finally, while a specialized degree leads to
technical roles that might be off limits to
most MBAs, the fact is an MBA specialization
can open those doors as well. But the reverse
isn’t true; an MBA is unrivalled in its ability
to provide a general management toolkit.
At General Electric’s prestigious Experienced
Commercial Leadership Program, a training
program for the company’s future sales and
marketing leaders, about 60% of the 88
graduates hired in 2014 were MBA holders,
compared to 40% with technical master’s
At General Electric’s prestigious Experienced Commercial Leadership Program, a training program for the company’s future sales and marketing leaders, about 60% of the 88 graduates hired in 2014 were MBA holders
24
Share this report
degrees, according to Heather Giese, who
runs the program. Different GE business units
do, however, prefer different candidates; the
financial services arm, GE Capital, prefers
MBAs, while GE Aviation and GE Power &
Water prefer those with technical master’s.
“ECLP was designed to be our experienced
sales and marketing leadership talent
pipeline,” Giese said. “So bringing external
thought leaders and new world skills
gained from five to eight years of industry
experience and master’s programs was a
key parameter needed to satisfy our unmet
hiring needs internally.”
“Interview and research people in multiple
career paths” – Amy Wittmayer, UNC Kenan-
Flagler Business School
“A talented MBA brings fresh eyes and an
extra set of hands to immediate business
challenges and can productively move
forward projects that might otherwise be left
undone.” – Sheryle Dirks, Duke University
Fuqua School of Business
25
Share this report
North American business schools still offer
a fantastic return on investment, despite
higher tuition fees presenting what can be
an imposing barrier to entry. In more than
half of the schools we analyzed for this
report, MBAs could expect to see an average
ROI of over $500,000 within 10 years of
graduation. This is due both to the strength
of the economy in the US & Canada and
the continuing appeal of the two-year MBA
curriculum to elite employers worldwide.
In terms of post-MBA salaries, students in
both the US and Canada do well. Graduates
of US business schools average $93,967 –
a 77% increase on their pre-MBA salaries.
The average graduate of a Canadian school
earns $77,292 after their MBA – a 47%
salary uplift. In all, 30 schools in North
America report an average post-MBA salary
above $100,000 – and five even make
it above $120,000. These are Stanford
GSB ($129,618), Harvard Business School
($127,236), the Wharton School ($123,431),
Berkeley Haas ($121,816) and MIT Sloan
($121,277). The highest average post-MBA
salary at a Canadian school was earned by
graduates of the Haskayne School at the
University of Calgary, at $94,264.
7.0. Business School Return on Investment in North America
7.1. Payback period
MBA graduates from North America
can expect to have paid back their MBA
investment roughly three and a half years
post-graduation. Since graduates of one-
year programs forgo only half the salary that
graduates of two-year programs do, their
business school investment is smaller and
their payback period tends to be quicker.
North America’s high MBA fees and above-
average length mean their average payback
period is 44 months. Although two of
Canada’s business schools make the top 10
for shortest payback period, its MBAs have a
higher average payback period (51) than the
USA (43), despite having significantly lower
average tuition fees than their southern
peers. Five schools in North America have a
payback period of less than 30 months.
26
Share this report
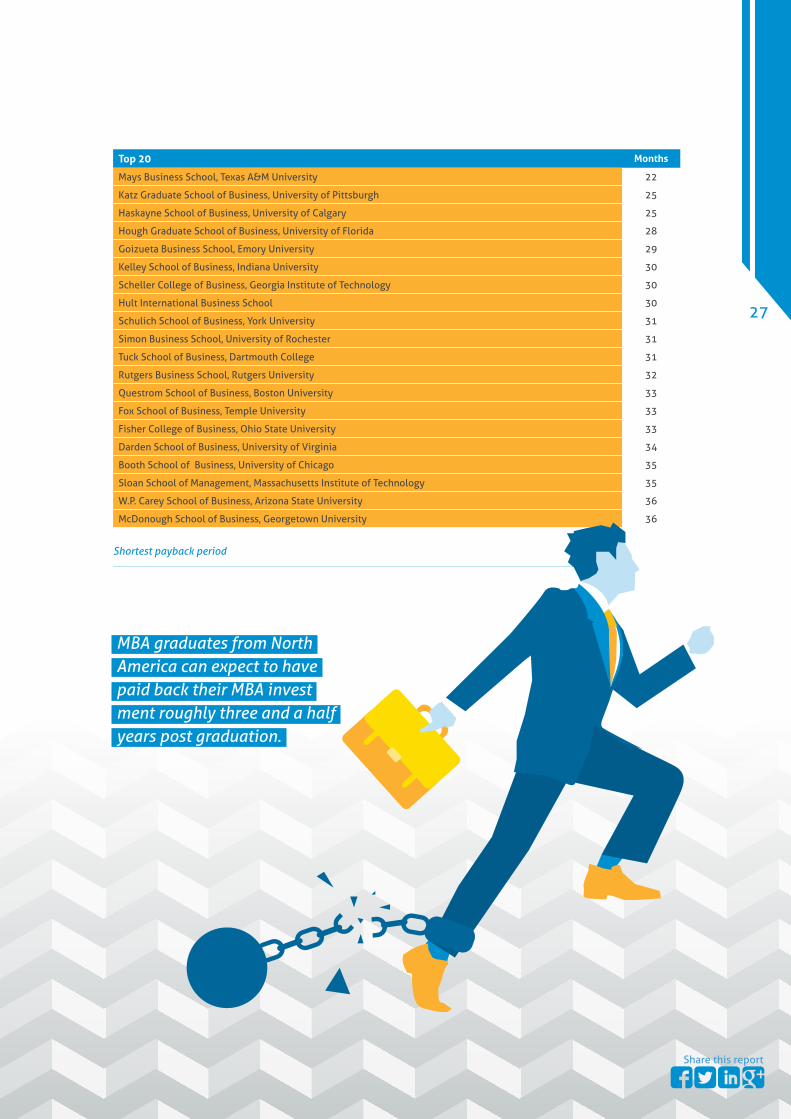
Top 20 Months
Mays Business School, Texas A&M University 22
Katz Graduate School of Business, University of Pittsburgh 25
Haskayne School of Business, University of Calgary 25
Hough Graduate School of Business, University of Florida 28
Goizueta Business School, Emory University 29
Kelley School of Business, Indiana University 30
Scheller College of Business, Georgia Institute of Technology 30
Hult International Business School 30
Schulich School of Business, York University 31
Simon Business School, University of Rochester 31
Tuck School of Business, Dartmouth College 31
Rutgers Business School, Rutgers University 32
Questrom School of Business, Boston University 33
Fox School of Business, Temple University 33
Fisher College of Business, Ohio State University 33
Darden School of Business, University of Virginia 34
Booth School of Business, University of Chicago 35
Sloan School of Management, Massachusetts Institute of Technology 35
W.P. Carey School of Business, Arizona State University 36
McDonough School of Business, Georgetown University 36
Shortest payback period
MBA graduates from North America can expect to have paid back their MBA investment roughly three and a half years post graduation.
27
Share this report

Over 10 years, the average return on an MBA from a North American business school was
$500,131. US schools had a higher average ROI ($527,050) than their Canadian counterparts
($298,236). The highest performing business school in the US was Stanford GSB, which was also
the only school in North America to boast a 10-year ROI higher than $1,000,000.
The Canadian school with the highest 10-year ROI was the University of Calgary’s Haskayne
School, at $644,572 – which places 25th in the region. While this means no Canadian schools
appeared in the top 20 for 10-year ROI, it is worth noting their lower course fees make it easier
to make the investment in the first place.
7.2. 10-Year ROI
Top 20 $
Stanford Graduate School of Business, Stanford University 1,076,395
Harvard Business School, Harvard University 949,907
Sloan School of Management, Massachusetts Institute of Technology 896,280
Mays Business School, Texas A&M University 850,191
Tuck School of Business, Dartmouth College 845,554
Booth School of Business, University of Chicago 834,554
Wharton School, University of Pennsylvania 818,881
Columbia Business School, Columbia University 818,388
Goizueta Business School, Emory University 767,361
Anderson School of Management, University of California, Los Angeles 757,558
Darden School of Business, University of Virginia 756,721
Kelley School of Business, Indiana University 753,576
S.C. Johnson Graduate School of Management, Cornell University 743,422
Tepper School of Business, Carnegie Mellon University 736,900
Haas School of Business, University of California Berkeley 734,148
Fuqua School of Business, Duke University 717,366
Yale School of Management, Yale University 705,051
Questrom School of Business, Boston University 701,862
Scheller College of Business, Georgia Institute of Technology 701,005
McDonough School of Business, Georgetown University 698,023
10-year ROI
28
Share this report

20 years on from graduation, North American MBAs enjoyed an average ROI of $2.57 million.
This average rises to $2.71 million when looking at the US alone ($1.50 million for Canada).
QS cannot claim precision in producing a figure for 20-year ROI. Any assumptions, however
informed, are going to be subject to change over such a long period of analysis.
North America – and the Western world as a whole – has been going through a prolonged
period of economic uncertainty. With that said, the economies of the US & Canada have held
up reasonably well despite recent troubles in the eurozone and China’s stock market crash.
Even with all the difficulties of producing such a long-term analysis, it is useful because it
demonstrates, in our opinion, a good estimate of the average real lifetime value of MBAs being
produced by these schools. We recommend allowing perhaps a 20% margin of error.
7.3. 20-Year ROI
Top 20 $
Stanford Graduate School of Business, Stanford University 6,055,081
Harvard Business School, Harvard University 5,038,346
Sloan School of Management, Massachusetts Institute of Technology 4,684,105
Wharton School, University of Pennsylvania 4,346,314
Booth School of Business, University of Chicago 4,159,643
Columbia Business School, Columbia University 4,109,711
Tuck School of Business, Dartmouth College 3,989,372
Haas School of Business, University of California Berkeley 3,893,509
Anderson School of Management, University of California, Los Angeles 3,789,947
Yale School of Management, Yale University 3,741,738
Fuqua School of Business, Duke University 3,739,300
Kellogg School of Management, Northwestern University 3,733,604
S.C. Johnson Graduate School of Management, Cornell University 3,608,327
Darden School of Business, University of Virginia 3,606,929
Stern School of Business, New York University 3,564,885
Tepper School of Business, Carnegie Mellon University 3,563,977
Goizueta Business School, Emory University 3,538,782
Mays Business School, Texas A&M University 3,533,716
Kelley School of Business, Indiana University 3,512,177
McDonough School of Business, Georgetown University 3,362,668
20-year ROI
29
Share this report
This report sets out to respond to MBA
applicant demand for clarity on the
average financial return achieved by taking
a full-time MBA at a recognized North
American business school.
Employers value the full-time MBA more than
any other graduate business qualification.
The average salary for a North American MBA
graduate is $97,300 compared to $59,800
for a master’s graduate. The MBA salary
uplift in these two countries averaged 75%,
and the payback period for the 85 schools in
our study was 44 months.
Over the course of a career, this post-MBA
salary increase adds up. The average ROI for
MBAs in the US & Canada is $0.50 million
over 10 years. At the 20-year mark, the
average ROI of MBAs in the US & Canada is
$2.57 million. This ranges between $0.30
million and $6.06 million across the 85 of
the schools studied in our sample.
This is a very healthy picture, and one that
should leave recent MBA students and
graduates, as well as prospective students,
feeling very optimistic about their future.
8.0. Conclusion
30
Share this report

31
Share this report
QS Quacquarelli Symonds Ltd
QS Quacquarelli Symonds was founded in 1990 and has established itself as the leading global provider of specialist higher education and careers information and solutions. Education and
career decisions are too important to leave to chance, so QS ensures that candidates have access to the best tools and the best independent expert information before making a decision.
QS organizes the largest business education event in the world, the QS World MBA Tour and boasts an extensive product range including print and online publications. It produces a range of annual primary research reports including the QS TopMBA.com Applicant Survey, the QS TopMBA.com Jobs and Salary Trends Report and the QS Global 200 Business Schools Report, as well as the
globally renowned QS World University Rankings®.
Website: www.TopMBA.com
All information © QS Quacquarelli Symonds Ltd 2015