qt group oyj - amazon web services · qt group plc demerger from digia, ... fy 2017 fy 2016 change...
TRANSCRIPT

Qt Group Plc ANALYST PRESENTATION FOR FINANCIAL REPORT 2017
February 16, 2018
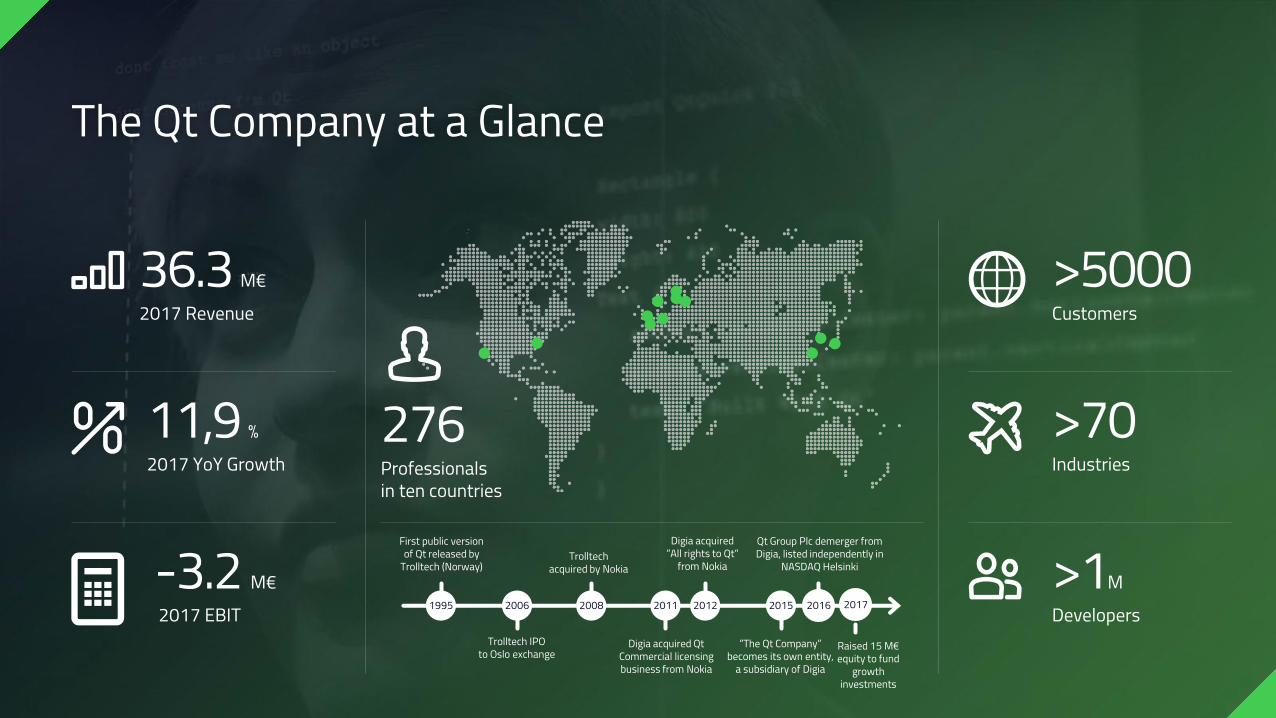
The Qt Company at a Glance
36.3 M€2017 Revenue
11,9 %2017 YoY Growth
-3.2 M€ 2017 EBIT 1995
276Professionalsin ten countries
>5000Customers
>70Industries
>1MDevelopers2006 2008 2011 2012 2015 2016
Trolltech IPOto Oslo exchange
First public versionof Qt released by
Trolltech (Norway)Trolltech
acquired by Nokia
Digia acquired Qt Commercial licensing business from Nokia
Digia acquired”All rights to Qt”
from Nokia
”The Qt Company”becomes its own entity,
a subsidiary of Digia
Qt Group Plc demerger from Digia, listed independently in
NASDAQ Helsinki
2017
Raised 15 M€ equity to fund
growthinvestments
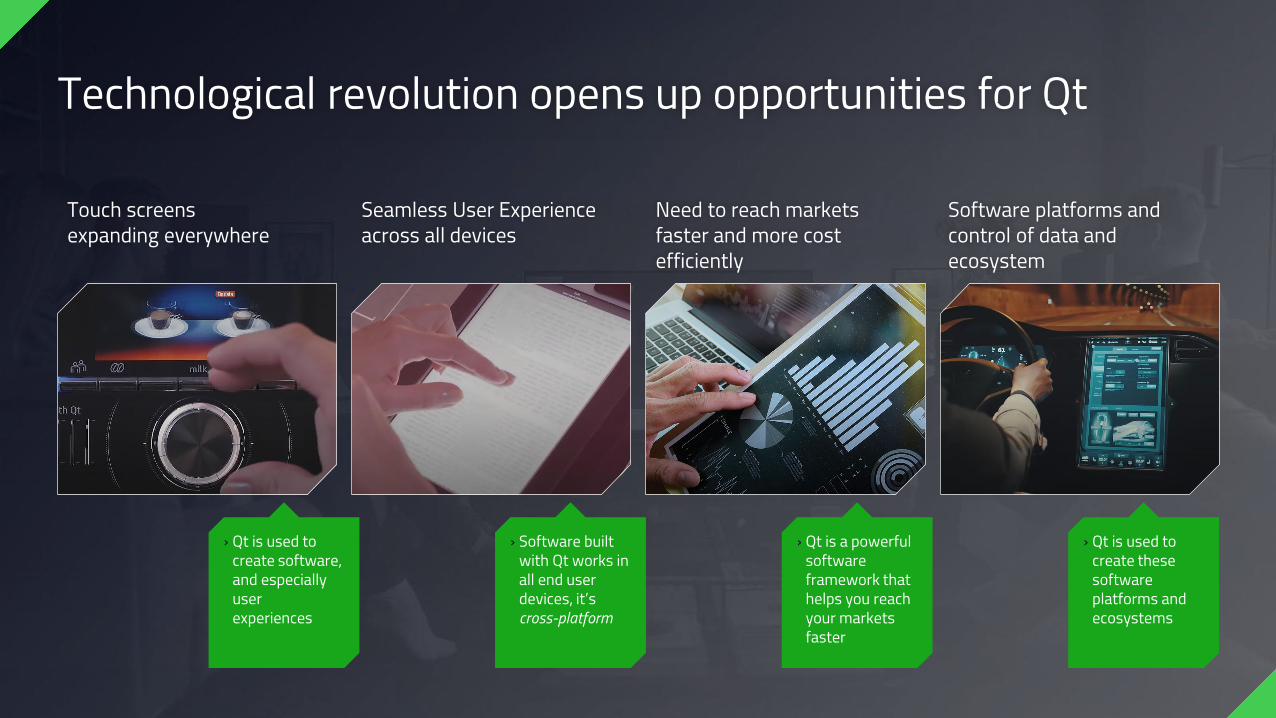
Technological revolution opens up opportunities for Qt
› Software built with Qt works in all end user devices, it’s cross-platform
› Qt is a powerful software framework that helps you reach your markets faster
› Qt is used to create these software platforms and ecosystems
› Qt is used to create software, and especially user experiences
Touch screensexpanding everywhere
Seamless User Experience across all devices
Need to reach markets faster and more cost efficiently
Software platforms and control of data and ecosystem
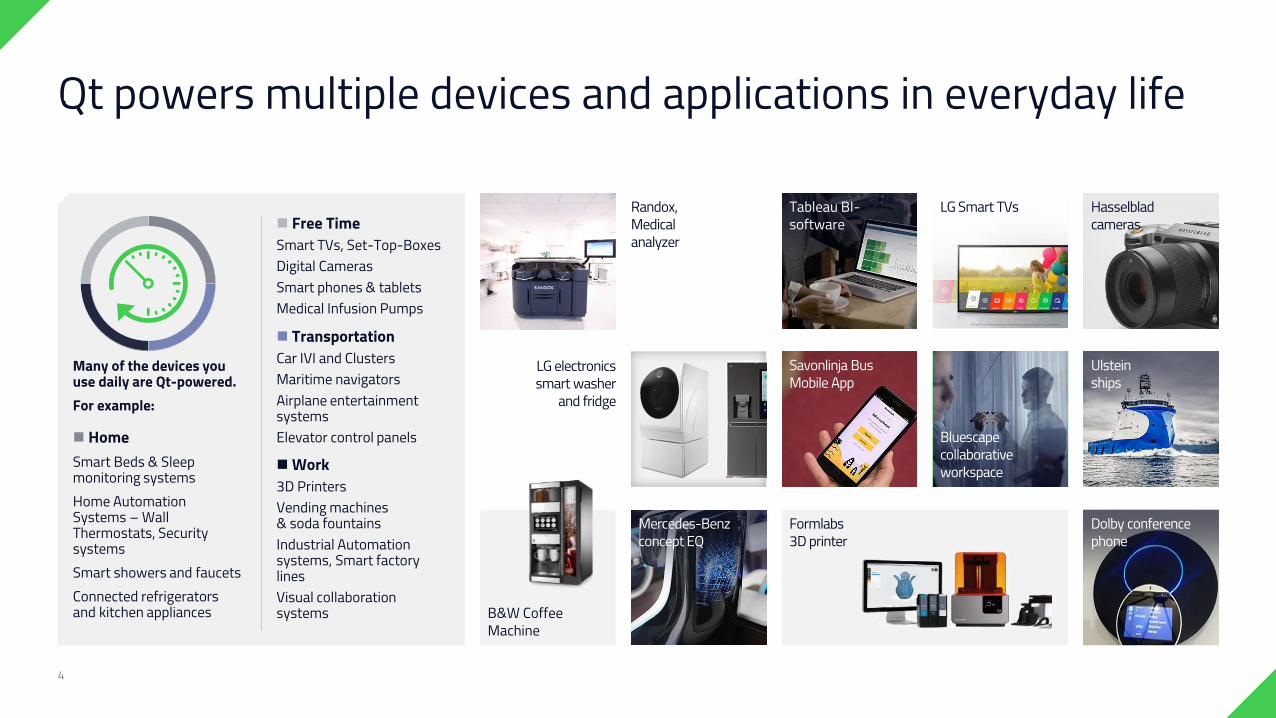
Qt powers multiple devices and applications in everyday life
4
HomeSmart Beds & Sleepmonitoring systemsHome AutomationSystems – Wall Thermostats, Security systems Smart showers and faucetsConnected refrigeratorsand kitchen appliances
TransportationCar IVI and ClustersMaritime navigatorsAirplane entertainment systemsElevator control panels Work3D PrintersVending machines& soda fountainsIndustrial Automation systems, Smart factory linesVisual collaboration systems
Free TimeSmart TVs, Set-Top-BoxesDigital CamerasSmart phones & tabletsMedical Infusion Pumps
Savonlinja BusMobile App
LG Smart TVs Hasselblad cameras
Ulsteinships
LG electronicssmart washer
and fridge
B&W CoffeeMachine
Formlabs3D printer
Mercedes-Benzconcept EQ
Dolby conferencephone
Bluescapecollaborativeworkspace
Randox,Medicalanalyzer
Tableau BI-software
Many of the devices you use daily are Qt-powered.For example:

Solid baseline business - accelerated growth from industries
5
EMBEDDED› Steady growth through dev seats› Large growth potential (# of devices)
ACCELERATED GROWTH FROM INDUSTRIES› More $/device› Industry position› Market share
DESKTOP› Big part of baseline business and
Maintenance & Support revenue stream
› Important for multi-screen experiences
› Moderate growth(# of developers)
MOBILE› Supporting technology
for multi-screen IoT systems
› Maintenance
SERVICES› Delivering consultancy
services to ensure customer success
› Supporting Sales
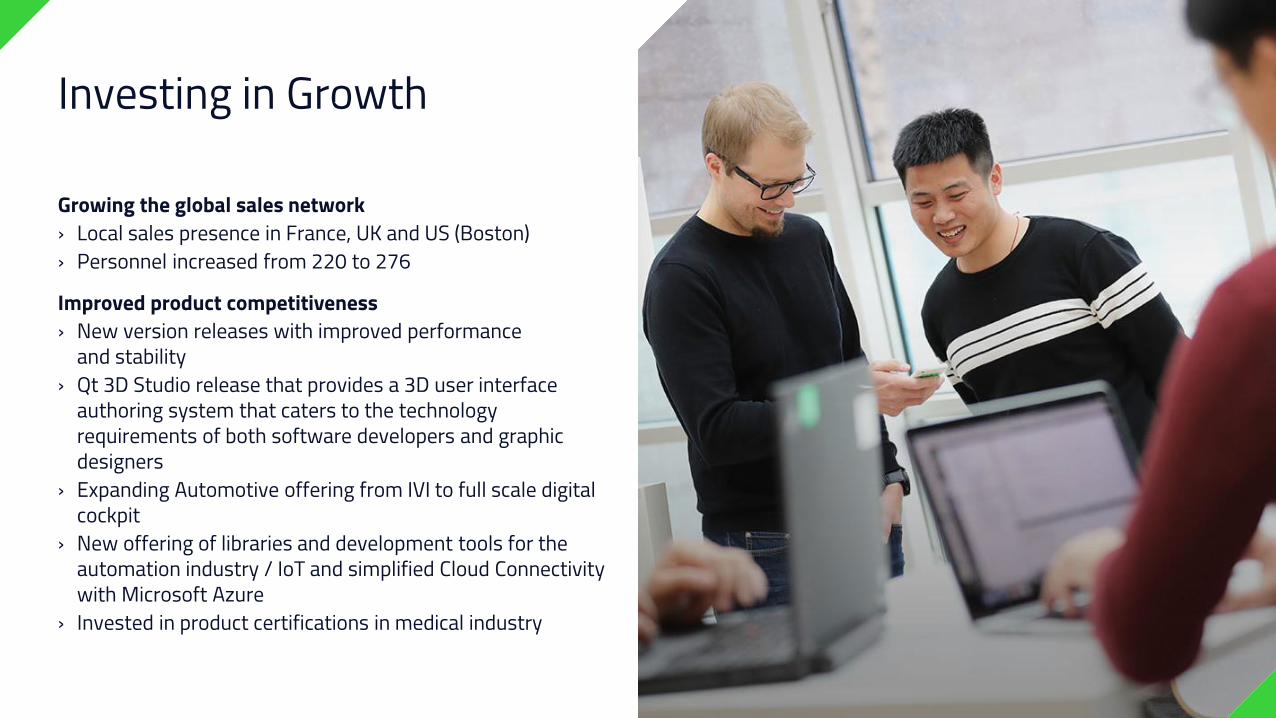
Growing the global sales network › Local sales presence in France, UK and US (Boston) › Personnel increased from 220 to 276
Improved product competitiveness› New version releases with improved performance
and stability › Qt 3D Studio release that provides a 3D user interface
authoring system that caters to the technology requirements of both software developers and graphic designers
› Expanding Automotive offering from IVI to full scale digital cockpit
› New offering of libraries and development tools for the automation industry / IoT and simplified Cloud Connectivity with Microsoft Azure
› Invested in product certifications in medical industry
Investing in Growth

The Qt World Summit in Berlin,October 9-121.000 attendees40 different countries and 30 industries19 partners and more than 90 presentations
7
Strengthening Qt Ecosystem
Customerkeynotes:
DaimlerBehind the scenes of a show car:Rapid UI/UX prototyping andproduction
Panasonic ITSFuture of VehicleHMI Systems
HasselbladITSUsing Qt to Build Next GenerationIntuitive High End Cameras
QualcommAn IDE forEmbedded Devices
Quantitative Imaging SystemsImaging Tissue Architecture:The Next Frontier in Batting Cancer
AmazonGame Engine Evolution:from Tech to UX
Financials 2017
26934
32395
36259
2015
2016
2017
9
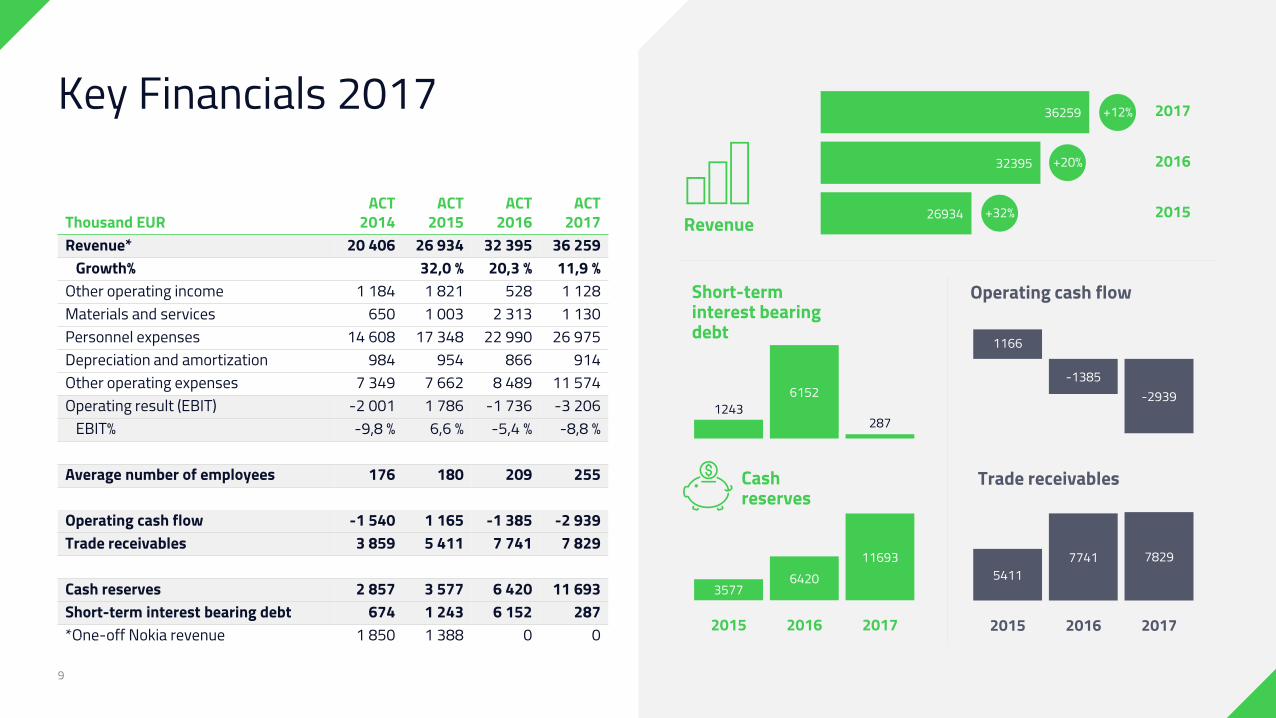
Key Financials 2017
54117741 7829
2015 2016 2017
1166
-1385-2939
Operating cash flow
Trade receivables
Revenue
12436152
287
Short-term interest bearing debt
35776420
11693
2015 2016 2017
Cashreserves
+32%
+20%
Thousand EURACT
2014ACT
2015ACT
2016ACT
2017Revenue* 20 406 26 934 32 395 36 259
Growth% 32,0 % 20,3 % 11,9 %Other operating income 1 184 1 821 528 1 128Materials and services 650 1 003 2 313 1 130Personnel expenses 14 608 17 348 22 990 26 975Depreciation and amortization 984 954 866 914Other operating expenses 7 349 7 662 8 489 11 574Operating result (EBIT) -2 001 1 786 -1 736 -3 206
EBIT% -9,8 % 6,6 % -5,4 % -8,8 %
Average number of employees 176 180 209 255
Operating cash flow -1 540 1 165 -1 385 -2 939Trade receivables 3 859 5 411 7 741 7 829
Cash reserves 2 857 3 577 6 420 11 693Short-term interest bearing debt 674 1 243 6 152 287*One-off Nokia revenue 1 850 1 388 0 0
+12%
M€Q4
2017Q4
2016 ChangeFY
2017FY
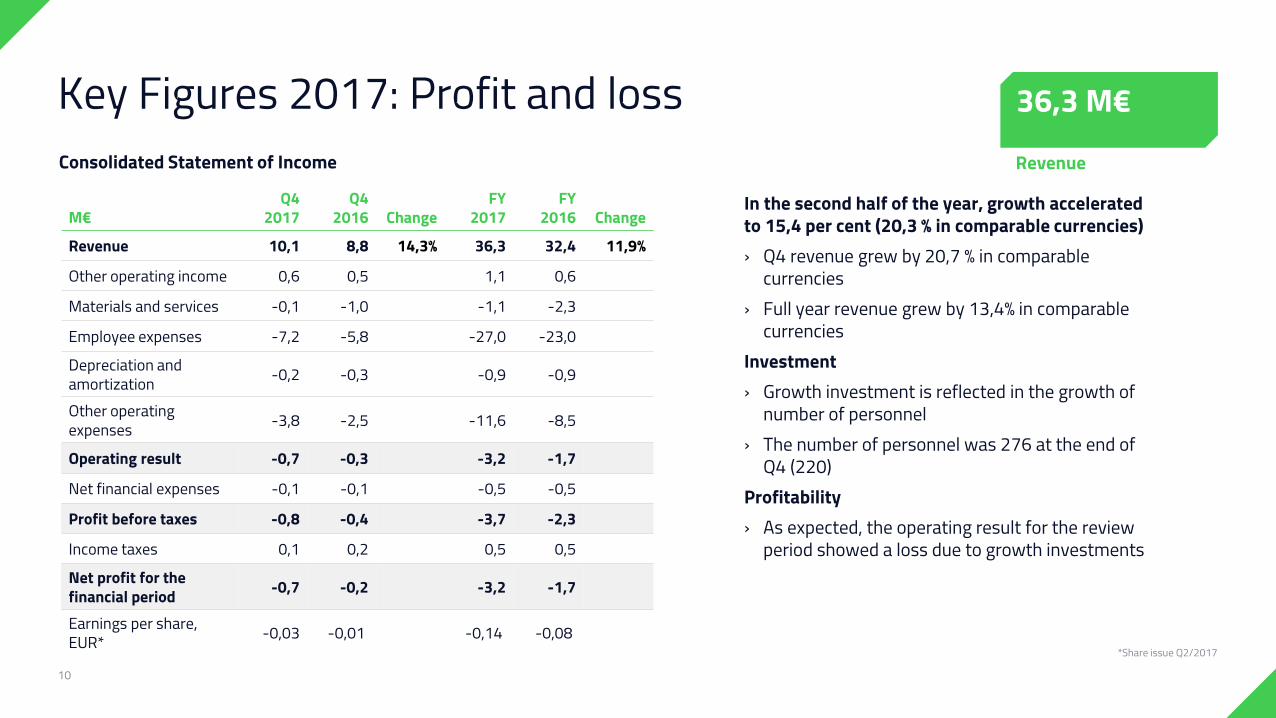
2016 ChangeRevenue 10,1 8,8 14,3% 36,3 32,4 11,9%Other operating income 0,6 0,5 1,1 0,6Materials and services -0,1 -1,0 -1,1 -2,3Employee expenses -7,2 -5,8 -27,0 -23,0Depreciation and amortization -0,2 -0,3 -0,9 -0,9
Other operating expenses -3,8 -2,5 -11,6 -8,5
Operating result -0,7 -0,3 -3,2 -1,7Net financial expenses -0,1 -0,1 -0,5 -0,5Profit before taxes -0,8 -0,4 -3,7 -2,3Income taxes 0,1 0,2 0,5 0,5Net profit for the financial period -0,7 -0,2 -3,2 -1,7
Earnings per share, EUR* -0,03 -0,01 -0,14 -0,08
In the second half of the year, growth accelerated to 15,4 per cent (20,3 % in comparable currencies)› Q4 revenue grew by 20,7 % in comparable
currencies› Full year revenue grew by 13,4% in comparable
currenciesInvestment› Growth investment is reflected in the growth of
number of personnel› The number of personnel was 276 at the end of
Q4 (220)Profitability› As expected, the operating result for the review
period showed a loss due to growth investments
10
Key Figures 2017: Profit and loss Consolidated Statement of Income
*Share issue Q2/2017
Revenue
36,3 M€
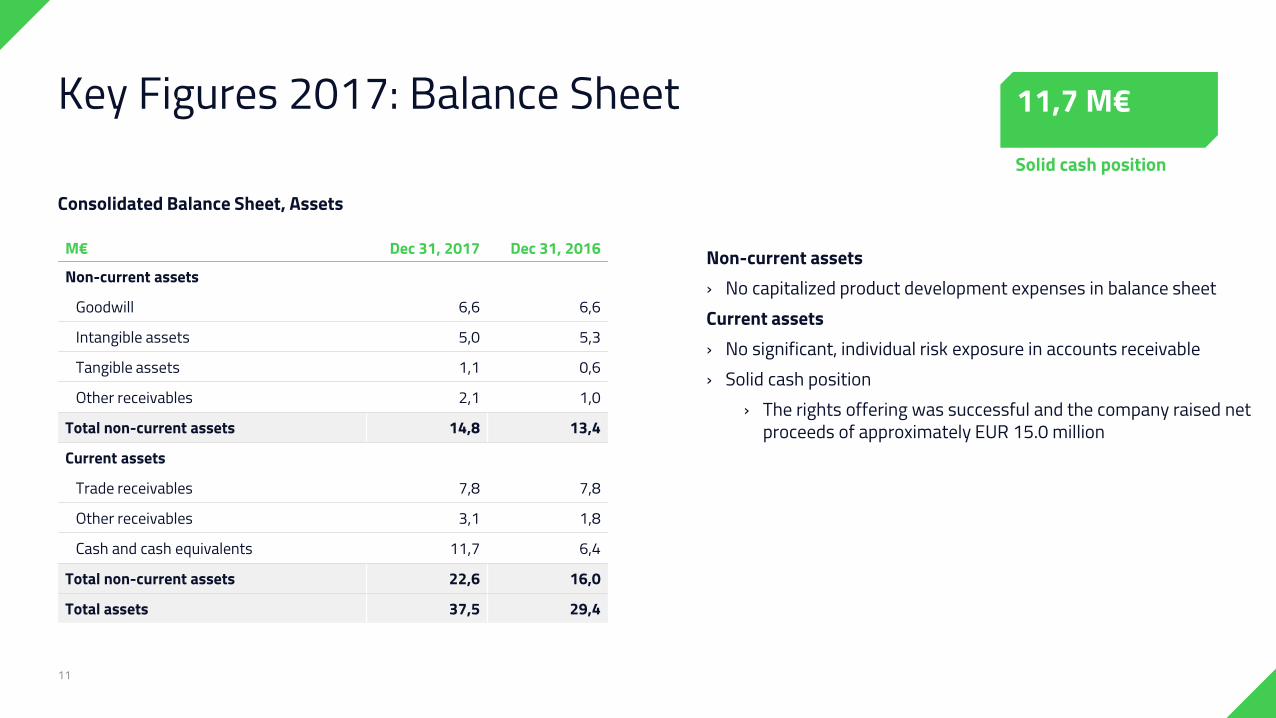
M€ Dec 31, 2017 Dec 31, 2016Non-current assets
Goodwill 6,6 6,6Intangible assets 5,0 5,3Tangible assets 1,1 0,6Other receivables 2,1 1,0
Total non-current assets 14,8 13,4Current assets
Trade receivables 7,8 7,8Other receivables 3,1 1,8Cash and cash equivalents 11,7 6,4
Total non-current assets 22,6 16,0Total assets 37,5 29,4
Non-current assets› No capitalized product development expenses in balance sheetCurrent assets› No significant, individual risk exposure in accounts receivable› Solid cash position
› The rights offering was successful and the company raised net proceeds of approximately EUR 15.0 million
11
Key Figures 2017: Balance Sheet
Consolidated Balance Sheet, Assets
11,7 M€Solid cash position

M€ Dec 31, 2017 Dec 31, 2016Total equity 20,3 8,3Non-current liabilities
Interest-bearing debt 0,4 0,1Deferred tax liabilities 0,3 0,3Advances received 0,8 0,5
Total non-current liabilities 1,5 0,8Current liabilities
Interest-bearing debt 0,3 6,2Advances received 9,1 8,3Trade payables 1,4 0,8Other liabilities 5,0 5,1
Total current liabilities 15,7 20,4Total liabilities 17,2 21,2Total equity and liabilities 37,5 29,4
Equity› Rights offering completed in Q2Current interest bearing liabilities› Ilmarinen loan (6,0 M€) fully repaid in Q2
12
Key Figures 2017: Balance Sheet 15,3 M€Gross proceeds
Rights offering completed in April
Consolidated Balance Sheet, Equity and Liabilities

Strategy execution & Outlook 2018
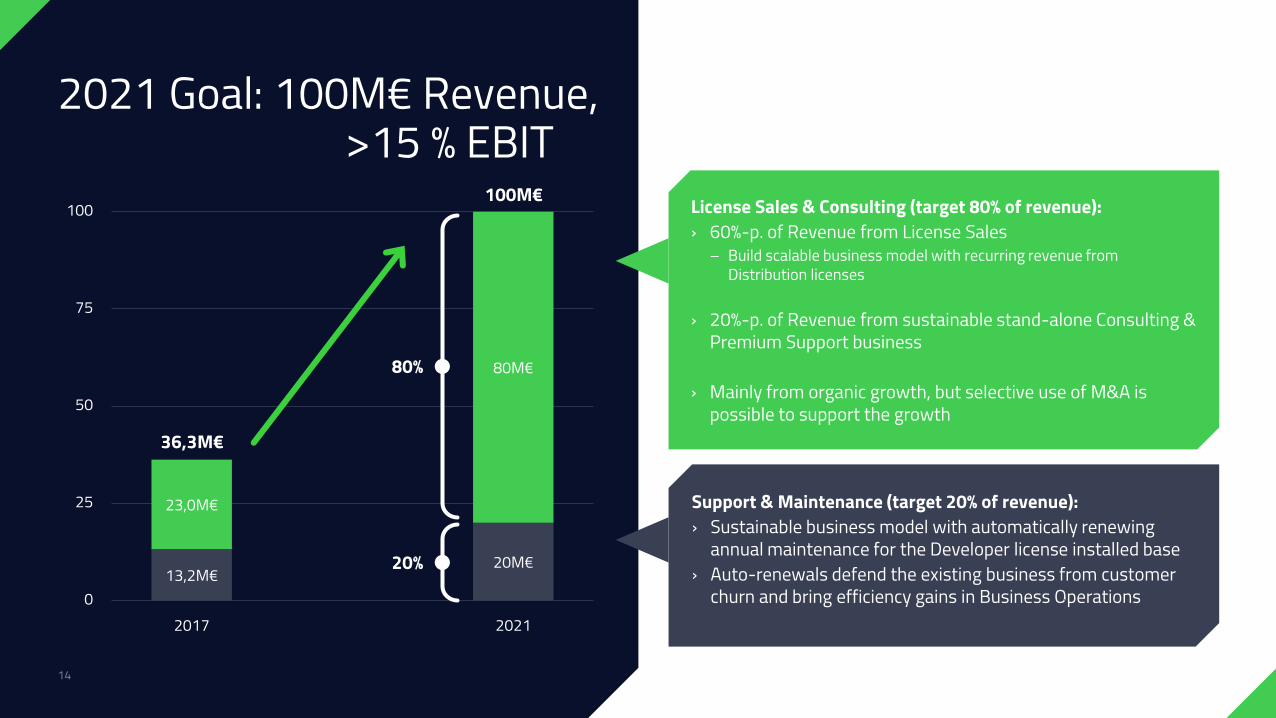
2021 Goal: 100M€ Revenue, >15 % EBIT
14
13,2M€20M€
23,0M€
80M€
0
25
50
75
100
2017 2021
License Sales & Consulting (target 80% of revenue):› 60%-p. of Revenue from License Sales
– Build scalable business model with recurring revenue from Distribution licenses
› 20%-p. of Revenue from sustainable stand-alone Consulting & Premium Support business
› Mainly from organic growth, but selective use of M&A is possible to support the growth
Support & Maintenance (target 20% of revenue): › Sustainable business model with automatically renewing
annual maintenance for the Developer license installed base› Auto-renewals defend the existing business from customer
churn and bring efficiency gains in Business Operations
36,3M€
100M€
80%
20%
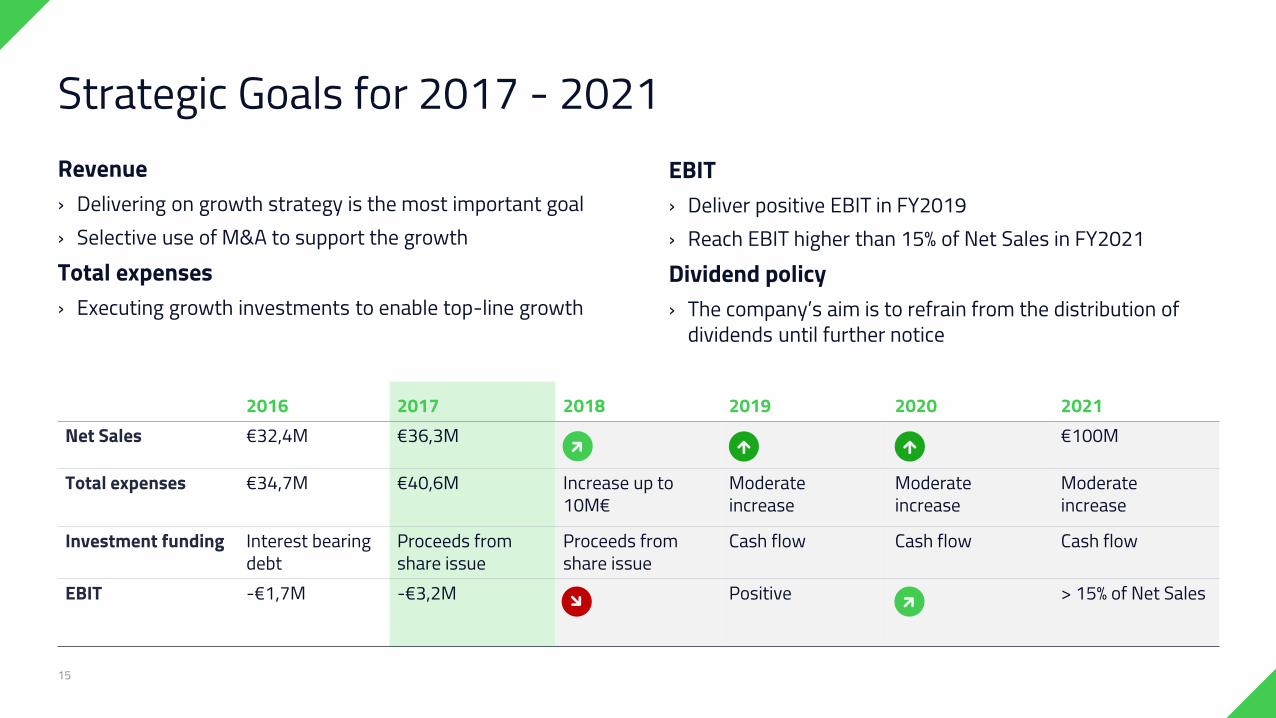
Revenue› Delivering on growth strategy is the most important goal› Selective use of M&A to support the growthTotal expenses› Executing growth investments to enable top-line growth
EBIT› Deliver positive EBIT in FY2019› Reach EBIT higher than 15% of Net Sales in FY2021Dividend policy› The company’s aim is to refrain from the distribution of
dividends until further notice
15
Strategic Goals for 2017 - 2021
2016 2017 2018 2019 2020 2021Net Sales €32,4M €36,3M €100M
Total expenses €34,7M €40,6M Increase up to 10M€
Moderateincrease
Moderateincrease
Moderateincrease
Investment funding Interest bearingdebt
Proceeds fromshare issue
Proceeds fromshare issue
Cash flow Cash flow Cash flow
EBIT -€1,7M -€3,2M Positive > 15% of Net Sales
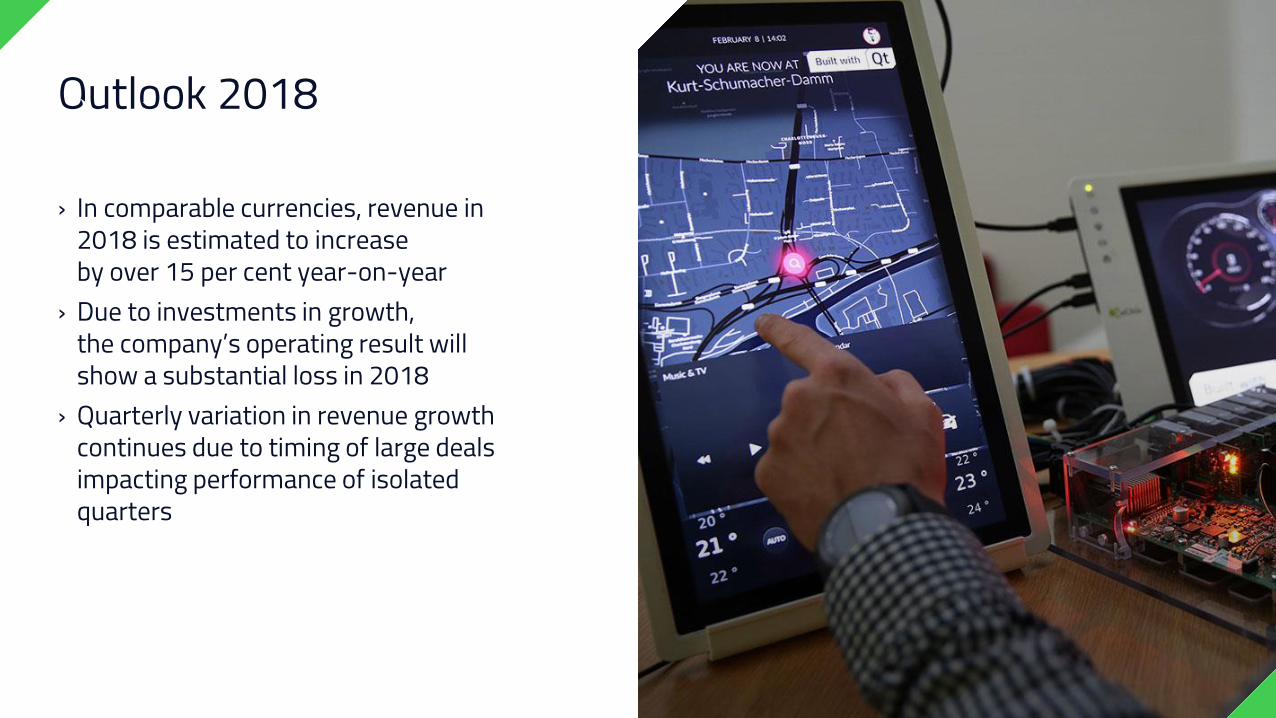
› In comparable currencies, revenue in2018 is estimated to increaseby over 15 per cent year-on-year
› Due to investments in growth,the company’s operating result willshow a substantial loss in 2018
› Quarterly variation in revenue growth continues due to timing of large deals impacting performance of isolatedquarters
Outlook 2018