documentqt
TRANSCRIPT

Introduction To
Statistics

What is Statistics ?
Statistics has become an important subject
having useful applications in various walks of life.
Statistical is a discipline which is concerned with:
1.Designing experiments and collection of data.
2.Summarizing information to aid understanding.
3.Drawing conclusions from data
4.Estimating the present and predicating the
future.

What is Statistics ?
The word Statistics is derived from the
Italian word “StatistaStatista” or Latin word “StatusStatus” ”
both meaning Political State.
The purpose of Statistics is to develop and
apply methodology for extracting useful
knowledge from data.

Meaning of Statistics ?
Statistics is described in two senses:
Plural noun: describes a collection of numerical
data.
Singular noun: describes as a branch of applied
mathematical science pertaining to the collection,
analysis, interpretation or explanation and
presentation of data. It also provides tools for
prediction and forecasting based on data.

Meaning of Statistics ?
“Statistics is a way to get information from data”.

Meaning of Statistics ?Meaning of Statistics ?
“Statistics is a way to get information from data”.
Data:Data: Facts, especially numerical facts, collected together for reference or information.
Statistics:Statistics: is a tool for creating new understanding from a set of numbers.
Information:Information: Knowledge communication concerning some particular facts.

Definition of Statistics ?
“Statistics refers to the body of techniques
which has been developed for the collection,
presentation and analysis of quantitative data
and for the use of such data in decision”.
-Nester &
Wasserman.
“Statistics is a body of methods of making wise wise
decisionsdecisions in the face of uncertainty”.
–W.A Wallis & H.V.
Robert.

“Major activities in Statistics involves:
•Collection of Data
•Organization of Data
•Presentation of data
•Analysis of data
•Interpretation of data.
Definition of Statistics ?

Branches of StatisticsBranches of Statistics

Descriptive Statistics:
is concerned with exploring,
visualizing and summarizing data but without
fitting the data to any models.
Such as- Frequency count, ranges
Means, Mode, Median, Variance & Standard
Deviation.
Branches of StatisticsBranches of Statistics

Inferential Statistics:
are used to draw inferences about
a population from a sample.
There are two methods:1. Estimation
2. Hypothesis
testing.
Estimation:Estimation: Estimate the population mean weight
using the sample mean weight.
Hypothesis testing: Hypothesis testing: Test the claim that the
population mean weight is 74 K.g.
Branches of StatisticsBranches of Statistics

Business Managers & Business Statistics
A very basic role business manager
has to perform is to take business decisions.
Business decision making is a
process of selecting the best out of alternative
opportunities open to firm.
Many business decisions are taken
under the condition of uncertainty & risk.
Use of statistics helps to identify
the uncertainty & reduce risk up to the
extent.
What is Business Statistics?What is Business Statistics?

Business Statistics:
Business Statistics is application of
Statistical tools and techniques in business
Decision making.
Business Statistics is a
science assisting you to make business
decisions under uncertainties, based on some
numerical and measurable scales.
Decision making processes
must be based on data, neither on personal
opinion nor on belief.
What is Business Statistics?What is Business Statistics?

1. Statistics does not deal with individual
measurement
2. Statistics cannot be used to study qualitative
phenomenon
3. Statistical results are true only on an average.
4. Statistical data being approximations, are
mathematically incorrect.
5. Statistical laws are not exact.
6. Statistical table may be misused
7. Statistics is only one of the methods of studying a
problem
Limitations of StatisticsLimitations of Statistics

BasicStatistical Concepts

1. Population
2. Census
3. Sampling & Sampling Principles.
4. Parameter
5. Statistic
Basic Statistical ConceptsBasic Statistical Concepts

The group of individuals or units under
study is called as Population or Universe.
The population may be finite or infinite.
Finite PopulationFinite Population: : consists of finite number of units.
For ex. No. of workers in the factory
Infinite Population: Infinite Population: if it has infinite number of units.
For ex. No. of people seeing television programme.
Population

Information on population can be collected in two
ways:
1. Census method
2. Sample method
Census Method: In census method each any every
element of the population is included in the
investigation.
Sample method: Few representative items of the
universe under study is called as sample.
Census/Sampling Census/Sampling

Merits of Census:
1. Data will be collected from each and every item of population.
2. Accurate and reliable results.
3. Intensive study is possible.
4. Information may be used for further survey.
Limitations Census:
1. Costly method.
2. It requires more money, time, labour & energy.
3. It is not possible where the population is infinite.
4. Sometime only sample method can be used.
Census/Sampling Census/Sampling

Sample:
Finite subgroup of population that is representative
items of the universe under study is called as sample.
Sampling:
The process selecting a Sampling from a population is
called sampling. In sampling representative sample of
elements of a population is selected and then
analyzed.
Sampling Sampling

Sample:
The theory of sampling is based on the principle
of statistical regularity.
It state that a moderately large number of items
chosen at random from a large group are almost sure
on an average to possess the characteristics of the
large group.
Principles of Sampling Principles of Sampling
Following are the principles of Sampling:
1.Principle of Statistical Regularity
2.Principle of large number
3. Principle of validity
4. Principle of optimisation
Principles of Sampling Principles of Sampling

Following are the principles of Sampling:
1.Principle of Statistical Regularity : It state that
a moderately large number of items chosen at random
from a large group are almost sure on an average to
possess the characteristics of the large group.
2.Principle of large number: other things being
stable as the sample size increase the accuracy of
results increase.
Principles of Sampling Principles of Sampling
3.Principle of validity: It state that sampling
method provides valid estimate about the population
parameter.
4.Principle of Optimization: This principle state
desirability of obtaining optimum sample design.
Principles of Sampling Principles of Sampling

ParameterParameter is a characteristic of a population.
The statistical constants of population like
mean(µ), variance(σ2), Skewness (ß1 ), kurtosis (ß2 ),
correlation coefficient (p) etc. are called as
parameter.
Generally the population parameters are
unknown.
Parameter/StatisticParameter/Statistic

Parameter is a characteristic of a population
whereas statisticstatistic is a characteristic of a sample.
Certain measures worked out from sample such
as mean, median, mode or variance, standard
deviation are called statistic(s).
Parameters are the function of population values
while statistics are functions of sample observation.
Generally, the population parameter are
unknown and they can be estimated by appropriate
sample statistics.
StatisticStatistic
Parameter/StatisticParameter/Statistic
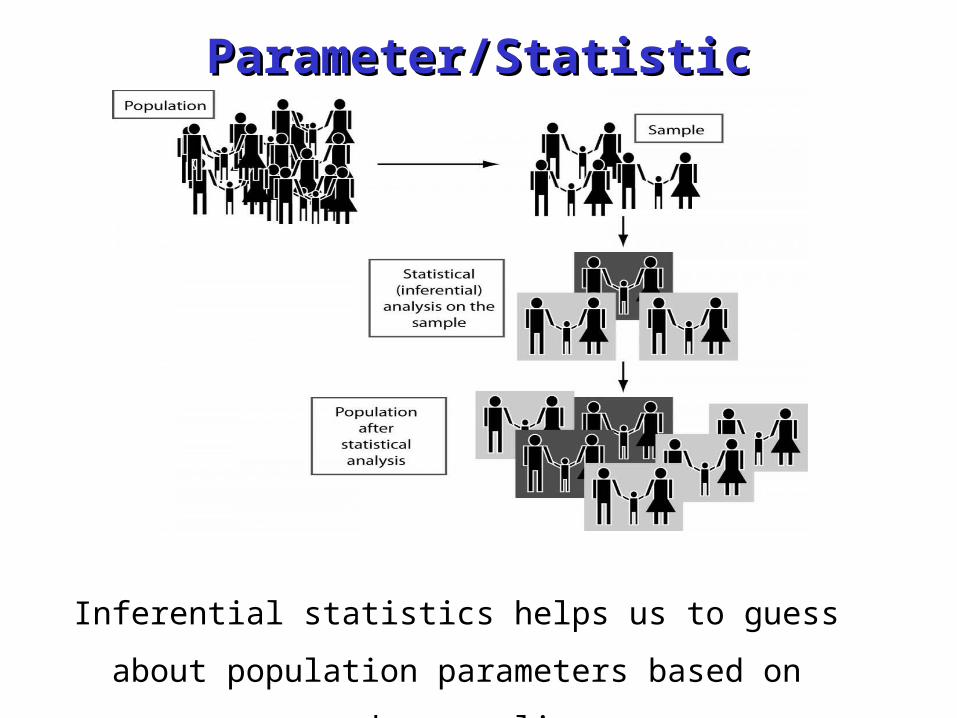
Inferential statistics helps us to guess about
population parameters based on random
sampling.

Sampling:

• The way of selecting the sample is known as
sample design.
– (i) ) Probability Sampling
– (ii) Non Probability Sampling
29
Types of sample design.Types of sample design.

Types of Sampling
Simple Random Sampling
Stratified Random Sampling
Systematic Sampling
Cluster Sampling
Probability Sampling Non Probability Sampling
Snowball Sample
Quota Sample
Convenience Sample
Multi Stage
Sample
Sequential Sample
Judgmental sampling

(ii)Probability Sampling
• Probability sampling is a method of sampling that
ensures that every unit in the population has a
known non zero chance of being included in the
sample.
31
Types of sample design.Types of sample design.

• It is foundation of probability sampling.
• In probability sampling every unit has equal chance
to be included in a sample.
• Sampling with replacement: when the sampling
is with replacement, the units drawn are placed
before the next selection is made.
• Sampling without replacement: when the
sampling is without replacement, the units drawn
are not placed before the next selection is made.
• Lottery method is mostly used method for sample
section. 32
Simple Random Sampling:Simple Random Sampling:

If the population is heterogeneous then
stratified sampling technique is applied so as to
obtain a representative sample.
Under it population will be divided into
number of groups called strata in such a manner that
the units within a stratum are homogeneous and
the units between the strata are heterogeneous.
Then next step is to select a sample
using simple random sample of appropriate size from
each stratum. 33
Stratified Random Sampling:Stratified Random Sampling:

In systematic sampling units are selected from the
population at a uniform interval.
Say, select every 15th name on a list, select every 10th
house on one side of a street and so on.
To facilitate this one has to arrange items in numerical,
alphabetical or in any other manner.
This method can be used only when the complete list of
population is available.
34
Systematic Sampling:Systematic Sampling:

Cluster sampling involves grouping the population
and then selecting the groups or the clusters groups or the clusters rather
than individual elements for inclusion in the sample.
For Example:
1. Suppose some departmental store wishes to sample its
credit card holders.
2. It has issued its cards to 15,000 customers. The sample
size is to be kept say 450.
3. For cluster sampling this list of 15,000 card holders could
be formed into 100 clusters of 150 card holders each. Three
clusters might then be selected for the sample randomly.
Area sampling: Area sampling: If clusters are formed considering
geographic area it is called as Area sampling.35
Cluster Sampling:Cluster Sampling:

Cluster sampling involves grouping the population
and then selecting the groups or the clusters groups or the clusters rather
than individual elements for inclusion in the sample.
For Example:
1. Suppose some departmental store wishes to sample its
credit card holders.
2. It has issued its cards to 15,000 customers. The sample
size is to be kept say 450.
3. For cluster sampling this list of 15,000 card holders could
be formed into 100 clusters of 150 card holders each. Three
clusters might then be selected for the sample randomly.
Area sampling: Area sampling: If clusters are formed considering
geographic area it is called as Area sampling.36
Cluster Sampling:Cluster Sampling:

Multi-stage sampling:Multi-stage sampling:
This is a further development of the idea of cluster sampling.
Under multi-stage sampling the first
stage may be to select large primary sampling units
such as states, then districts, then towns and finally
certain families within towns.
37

Sequential sampling: Sequential sampling:
• This is somewhat a complex sample design.
• Size of the sample is not fixed in advance but is determined according to mathematical decisions on the basis of information yielded as survey progresses.
• This design is usually adopted in the in the context of statistical quality control.
• In practice, several of the methods of sampling described above may well be used in the same study
38

(ii)Non Probability Sampling
• Also known as purposive or deliberate sampling
• This sampling method involves purposive or
deliberate selection of particular units from the
universe for the study.
• It includes two types of Sampling
– Convenience sampling
– Judgment sampling
– Quota sampling39
Types of sample design.Types of sample design.

Convenience sampling: when population
elements are selected for inclusion in the
sample based on the ease of access, it can be
called convenience sampling .
Judgment sampling: the researcher judgment is
used for selecting items which he considered as
representative of the population.
Quota sampling: In this method interviewers are
simply given quota to be filled from different
strata. The actual selection of items, left to the
interviewer’s judgment.40
Non Probability Sampling Non Probability Sampling

Data Measureme
nt

Measurement & scaling Measurement & scaling techniquestechniques
Measurement:
By measurement we mean the process of assigning numbers to objects or observations.
Properties like weight, height, length etc., can be measured directly with some standard unit of measurement etc.
However it is difficulty to measure properties like motivation to succeed, ability to stand against stress etc.
Researcher has to create various scaling technique so that each and every variable under study can be measure accurately.
42

Nominal ScalesNominal Scales
Ordinal ScalesOrdinal Scales
Interval ScalesInterval Scales
Ratio ScalesRatio Scales
Four Basic Scales of Measurement

Nominal scale:Nominal scale:Nominal scale is simply a system of assigning number symbols to events in order to label them.
For ex. Numbers on the cricket players jersey .
These numbers does not have any ordered scale.
These numbers are not useful to conduct any further statistical calculations..
In spite of all this nominal scales are still very useful for classifying major sub-groups of the population.
44

If one describes respondents in a survey according to their occupation such as banker, doctor, computer programmer one has used a nominal scale.
If one has used question as check all the brands you would consider purchasing
I. Sony
II. Videocon
III. Samsung
IV. L. G45
Nominal scale:Nominal scale:

Ordinal scaleOrdinal scale
The ordinal scale places events in order.
Rank orders represent ordinal scales and are
frequently used in research relating to qualitative
phenomena.
A student’s rank in his graduation class involves
the use of an ordinal scale.
The appropriate measure of central tendency is
the median.46

For example if one has used question such, as please rank each brand in terms of your preference such as “1” represent your first choice, and “2” represent your second choice, and so on.SonyVideoconSamsungL.GB.P.LPhillips
The ordinal scale places events in order.
47
Ordinal scaleOrdinal scale

48
Interval scaleInterval scale

Interval scale Interval scale Interval scale Examples:
If customers were asked to evaluate a salesmen performance from the list, such as:
A.Extremely friendly
B.Very friendly
C.Somewhat friendly
D.Somewhat unfriendly
E.Very unfriendly
F.Extremely unfriendly
49

• (c) Interval scale Examples:
Please rate each brand in terms of its overall
performance.
50
Interval scaleInterval scale

(d)Ratio Scale:(d)Ratio Scale:
Ratio scales are the ones in which true zero origin exists such as actual number of purchases in a certain time period, rupees spent, miles traveled etc.
A ratio scale allows the researcher not only to identify the absolute differences between each scale point but also to make absolute comparisons between the responses.
51

(d)Ratio Scale:(d)Ratio Scale:d) Ration scale Examples:
Please indicate your age in year________
Approximately how many times in the last
month have you purchased anything over Rs. 1000
in value at BigBazar?
0 1 2 3 4 5 (More specify_ _ _ _ )
52

ScaleNominal Numbers
Assigned to Runners
Ordinal Rank Orderof Winners
IntervalPerformance
Rating on a
0 to 10 Scale
Ratio Time to Finish, in
Seconds
Primary Scales of Measurement
7 38
ThirdThirdplaceplace
SecoSecondnd
placplacee
FirstFirstplaceplace
FinishFinish
FinishFinish
8.2 9.1 9.6
15.2 14.114.1 13.4

Frequency Tables, Charts,
& Graphs.

IntroductionIntroductionA basic role Business Manager has to
perform at every step is to take decisions. For it he
has to collect huge amount of data. However the
collected data are in a ungrouped & raw format. In
order to facilitate decision making certain
processes need to be done on the data and those
are:
1. Classification & Tabulation
2. Diagrammatic presentation
3. Graphical presentation55

ClassificationClassificationIs the ways of presenting the raw data in an
orderly and systematic manner which helps for
further analysis and interpretation of data.
Classification id the process of arranging
things in groups according to their similarity, or
identity.
For ex. Students in the class can be arranged
according to their: gender, Basic graduation, rural
& urban, experience & inexperience etc. 56

Types of ClassificationTypes of Classification
1.Chronological Classification
2.Geographical Classification
3.Qualitative Classification
4.Quantitative Classification
57

Types of ClassificationTypes of Classification
In ChronologicalChronological Classification the
collected data will be arranged according to the
time of expressed in year, months, weeks etc.
58

Types of ClassificationTypes of Classification
In Geographical Geographical Classification the
collected data will be arranged according to
geographical region.
For ex.
59

Types of ClassificationTypes of Classification
Quantitative Quantitative Classification refers to the
classification of data according to some
quantitative phenomena, such as height, weight
length etc.
In this type of classification there are two important
elements:
1. The variable
2. The Frequency. 60

Frequency DistributionFrequency DistributionThe frequencyThe frequency of an observation is the
number of times that observation occurs
Frequency Frequency distribution is a series when a number of observations with similar of closely related values are put in separate bunches or groups.
Three main reasons for preparing frequency distribution:
1. To estimate frequency of population from the sample data.
2. To facilitate the computation of various statistical data.
3. To facilitate the analysis of data.61

Frequency DistributionFrequency DistributionIn a survey of 40 families in a village, the
number of children per family was recorded and the following data obtained.
1, 0, 3, 2, 1, 5, 6, 2, 2, 1, 0, 3, 4, 2, 1, 6, 3, 2, 1, 5, 3, 3, 2, 4, 2, 2, 3, 0, 2, 1, 4, 5, 3, 3, 4, 4, 1, 2, 4, 5.
It is called as Discrete or ungrouped Frequency Distribution
62

Frequency DistributionFrequency DistributionGrouped frequency:
63

Frequency DistributionFrequency Distribution
Continuous Frequency distributionContinuous Frequency distribution when
variables are in continuous format there is need to
use continuous frequency distribution.
Say age of students: 4-6, 7-9, are not correct, instead of it:
Age in years:
Below 6,
6 or more but less than 9,
9 or more but less than 12, 64

Formation of Frequency Distribution: Continuous dataFormation of Frequency Distribution: Continuous data
1. Class Limit: These are the lowest and highest value(25-29)
2. Class Interval: the difference between upper and lower limit.
Here it is ‘4’.
3. Class of Frequency: the number of observation belonging to a
particular class is known as the frequency of that class.
4. Range: the difference between largest value and smallest value
is called the range and is denoted by ‘R’.
5. Class Mid-point = (Lower limit of the Class + Upper limit of the
Class)/2.
65

Types of Class IntervalsTypes of Class Intervals
1. Exclusive Method
2.Inclusive Method
3.Open-End Classes
66

Exclusive MethodExclusive Method
Profit earned by Companies
67
In this method the upper limit is exclusive and the item of that value is included in the next class.
Say in the above example Company earning 20 lakh profit will be included in the Class internal 20-30.

Inclusive MethodInclusive Method
Profit earned by Companies
68
In this method both upper limit and lower are included in the class.

Open-End classesOpen-End classes
Profit earned by Companies
69
A class limit is missing either at the lower end of the first class interval or at the upper end of the last class interval.

Charts &
Graphical Presentatio
n

Graphical PresentationGraphical Presentation
Charts & Graphics Charts & Graphics are visual aids which gives a
bird’s eye view of a given set of numerical data.
Important graphs are:
1. Histogram
2. Frequency Polygen
3. Frequency curve
4. Pie Chart
5. Bar diagram.
71

Class interval Frequency
0 – 20 13
20 – 40 18
40 – 60 25
60 – 80 15
80 – 100 9
Total 80 f
HistogramHistogram

HistogramHistogramA histogram is a graph that displays the data by using adjacent vertical bars (unless the frequency of a class is 0) of various heights to represent the frequencies of the classes.
A histogram is a simple (vertical) bar chart in which the frequency of observations within a class interval is represented by the corresponding bar.
The class intervals, and hence the width of the bars, will be of equal size

Frequency polygonFrequency polygonA frequency polygon is a line graph of a
grouped frequency distribution
It is constructed by marking the point on the top of each histogram bar at the midpoint of the class interval, then joining these points by straight lines

OgivesOgives
An ogive (or ogive curve) is the graphical
presentation of a cumulative frequency
distribution.
These ogives are classified as ‘less than’ and
‘more than ogives’.
Less than’, cumulative frequencies are plotted
against upper boundaries of their respective
class intervals.Grater than’ cumulative frequencies are plotted against lower boundaries of their respective class intervals.

OgivesOgivesFor Example:

Bar chartsBar chartsA bar chart consists of a series of
rectangular bars where the lengths of the bars represent the magnitudes of the respective quantities.
Types of Bar Diagrams:
1. Simple bar Diagrams
2. Multiple bar diagrams
3. Sub-divided or component bar diagram
4. Percentage bar diagrams
5. Deviation or Bilateral Diagrams.

Bar chartsBar charts1. Simple bar Diagrams
A simple bar diagram can be drawn using horizontal or vertical bar.
In business and economics, it is very a common diagram.
Vertical Bar Diagram

Bar chartsBar charts1. Simple bar Diagrams:
Horizontal Bar Diagram

Bar chartsBar chartsMultiple bar diagrams
Multiple bar diagram
provides more than one
phenomenon and highly
useful for direct comparison.
The bars are drawn
side-by-side and different
columns, shades can be
used for indicating each
variable used.

Bar chartsBar charts
Item of Expenditure
Family A (Income)
Family B (Income)
Food 1500 1500
Clothing 1250 600
Education 1250 900
Miscellaneous 1900 1000
Saving 1000 1000Total 6900 5000
Sub-Divided Bar
Diagram
In these bar diagram,
the bar is divided into
various parts in
proportion to the value
given in the data.

Bar chartsBar charts
Percentage Sub-
Divided Bar
Diagram
Here the components
are not the actual
values but the
percentage of the
whole.
Here each bar
represent 100
percent all bars are of
equal height.

Pie DiagramPie Diagram
Pie Diagram
Pie diagram helps us to show the
portioning of a total into its component parts.
It is used to show classes or groups of data
in proportion to whole data set. The entire pie
represents all the data, while each slice
represents a different class or group within
the whole.

Pie DiagramPie DiagramPie Diagram
Revenue collections for the year 2005-
2006 by government in Rs. (crore)s for
petroleum products are as follows. Draw the pie
diagram.

Pie DiagramPie Diagram