qu. l. bullwhip effect research on global dry bulk
TRANSCRIPT

Erasmus University Rotterdam
MSc in Maritime Economics and Logistics
2013/2014
Analysis on the Volatility of Global Dry Bulk Shipping
Market-Based on the confirmation of the existence of
the bullwhip effect
by
Lingyan Qu
Copyright @ Lingyan Qu

- 2 -
Acknowledgements
The completion of this Master thesis has been fulfilled with my experience of many companies in China and the curiosity. I have to say that it is a long term that I have been through of this thesis, but on the other hand, the harder it is, the more you will appreciate it when it finally arrives. Hereby, I have too many people to say “thanks” to. Without them, I can never make it. I appreciate that many people around me really value knowledge and even more pricelessly, they are willing to help me and share their ideas with me. It was really thankful and touching.
To start with, I want to thank Professor Rommert Dekker, the supervisor of my thesis. He helped me a lot with my thesis and made a lot of useful comments on it. He stressed the intellectual progress and allowed me do this thesis with no constraints. Thank you very much!
Similarly, I am extremely grateful to my dear classmate Jingjing Li, for her valuable guidance and explanation of the model inputs and consistent encouragement throughout my research work. Despite her tight schedule with her thesis as well, she made herself available for my questions and clarified my doubts with a positive and amicable disposition.
Furthermore, I want to express my deepest appreciation to my boyfriend Maoming Sun who is also a student of MEL, for his patient and taking good care of me, otherwise I can’t get along with the MEL courses. Same gratitude goes to Renee, Jakira, Veronique and Mariem from the MEL Office, for their kind assistance. Thank you all.
Last but never the least, I want to give a warm hug to my parents: for your relentless support for and unswerving faith in me, not only when I was writing the thesis but also the time that I decided to come to Netherlands to take this program. Love you.

- 3 -
Abstract
With the growth of world economy and trade as well as the shipping demands, ships are gradually developing towards to the large-scale and professional ones. And therein, affected by the rapid growth of the volume of iron ore and other bulk cargo, the large-scale trend of dry bulk ships is particularly prominent. With the change in the mode of dry bulk trade, the trade structure begins to be complicated and systematic. Moreover, the supply chain structure of dry bulk market is gradually mature. The resulting supply-demand structure of international dry bulk shipping market (hereinafter referred to as dry bulk shipping market) also constantly becomes complicated. As an important component of dry bulk supply chain, the development of dry bulk shipping market cantered on sea shipping service will correspondingly have an important impact on the entire dry bulk supply chain. Dry bulk maritime transport is an important part of dry bulk supply chain, in the face of aggravated market competition; optimizing and managing the supply chain become the important methods for the companies and even for the whole market to gain the superiority and to improve the efficiency. And the bullwhip effect is an inevitable problem when run the complex structure of supply and demand. This thesis is based on the analysis of present situation of global dry bulk shipping market, and combined with the theory of the bullwhip to do discovery, definition and data analysis of bullwhip effect in bulk shipping market. What’s more, on the basis of combining with the characteristics of dry bulk shipping market, the thesis puts forward some reasonable suggestions to the international dry bulk shipping market, in order to reduce the bullwhip effect in the international dry bulk market operation, and achieve the goal of cost control risk.
- 4 -
Table of Contents
Copyright @ Lingyan Qu ......................................................................................... - 1 -
Acknowledgements .................................................................................................. - 2 -
Abstract .................................................................................................................... - 3 -
List of Illustrations, Charts, Diagrams, Tables ....................................................... - 6 -
Chapter 1 Introduction ............................................................................................. - 7 -
1.1Background ...................................................................................................... - 7 - 1.2 Objectives of research ..................................................................................... - 8 - 1.3 Research design .............................................................................................. - 9 -
Chapter 2 literature review .................................................................................... - 10 -
2.1. Research on dry bulk shipping market ...................................................... - 10 - 2.2. Researches on the Bullwhip Effect ............................................................ - 12 -
Chapter 3: International dry bulk market .............................................................. - 16 -
3.1. Current development status quo of the international dry bulk market ............ - 16 - 3.2. Characteristics of international dry bulk market ............................................. - 18 - 3.3. The international dry bulk shipping market and relevant market factors ........ - 21 - 3.4 The characteristics of the international dry bulk shipping market supply capacity . - 23 - 3.5. Studies on uncertainty of dry bulk shipping market ....................................... - 24 - 3.6 Cost impact on the international dry bulk freight rate ...................................... - 25 - 3.7 The influence of supply and demand of international dry bulk freight ............. - 26 - Summary of Chapter 3 ......................................................................................... - 27 -
Chapter4. Bullwhip effect and preliminary analysis of bullwhip effect in the dry bulk shipping market ............................................................................................. - 29 -
4.1 Overview of the bullwhip effect ...................................................................... - 29 - 4.2 Root cause analysis of bullwhip effect ........................................................... - 30 - 4.3 Research on the Bullwhip Effect in the dry bulk shipping market.................... - 33 - 4.4 Harm of the Bullwhip Effect in the dry bulk market ......................................... - 36 - Summary of Chapter4 .......................................................................................... - 37 -
Chapter 5 Methodology GARCH model ................................................................ - 38 -
5.1 GARCH model overview ................................................................................ - 38 - 5.2 Analysis on the applicability of GARCH model ............................................... - 39 - 5.3 Data variance analysis ................................................................................... - 39 - Summary of Chapter 5 ......................................................................................... - 40 -

- 5 -
Chapter 6: Empirical analysis on bullwhip effect in the global dry bulk shipping market ..................................................................................................................... - 41 -
6.1 Dry bulk shipping market volatility analysis .................................................... - 41 - 6.2 Dry bulk shipping market data analysis .......................................................... - 48 - 6.3 The Bullwhip Effect in the dry bulk shipping market ....................................... - 52 - 6.4 Research on decreasing the Bullwhip Effect in the dry bulk shipping market . - 53 - Summary of Chapter 6 ......................................................................................... - 55 -
Chapter 7 Research conclusion and future research .......................................... - 56 -
7.1 Research conclusion ...................................................................................... - 56 - 7.2 Future research ............................................................................................. - 57 -
Bibliography ........................................................................................................... - 58 -
- 6 -
List of Illustrations, Charts, Diagrams, Tables
1. Tab.6.1 1999-2014 BDI Index Per Month 2. Figure 6.2 BDI Index Data 3. Figure 6.3 Descriptive Statistics 4. Tab 6.4 examination Results of ADF Test 5. Figure 6.5 RBDI correlation examination result 6. Tab 6.6Examination Results of Auto-correlation Test 7. Tab 6.7 Examination Result of Arch Test of Residual 8. Tab.6.8 The world economic, trade, dry bulk shipping amount growth statistics 9. Fig6. 9The trend chart of the World Economic, Trade and Dry bulk Demand growth
rate 10. Tab6. 10The Bullwhip Effect in Dry Bulk Market

- 7 -
Chapter 1 Introduction
1.1Background
With the growth of world economy and trade as well as the shipping demands, ships are gradually developing towards to the large-scale and professional ones. However, therein, affected by the rapid growth of the volume of iron ore and other bulk cargo, the large-scale trend of dry bulk ships is particularly prominent. Dating back to 1980, handy-size carrier was still the main dry bulk ship. In early 90s, there were only 30 ships over 200,000 DWT. After 2000, the main ship type began to gradually shift to Capesize vessels. By 2006, the classification standard of Capesize vessels increased to over 100,000 DWT from the previous over 80,000 DWT. The proportion of Capesize vessels in the capacity of dry bulk ships also increased year by year, rising from the 30% in 2000 to 41% in 2013. While by the end of 2013, the number of ships over 200,000 DWT had been more than 300, increasing about 7 times in 20
years.(Liu, 2005)
Changes of ship structure have large influence on dry bulk shipping market (Wang, 2012): first, the unit transportation cost of shipping companies is reduced, while the cost of investment correspondingly increases; second, the shipyard's shipbuilding technology needs to be further improved; third, large-scale ships propose high demand of port, stevedoring and cargo transportation system. Furthermore, the large-scale ships also result in certain effects on the mode of trade, such as the establishment of cargo distribution center, changing the previous mode of dry bulk. Now, with the change in the mode of dry bulk trade, the trade structure begins to be complicated and systematic. Moreover, the supply chain structure of dry bulk market is gradually mature. The resulting supply-demand structure of global dry bulk shipping market (hereinafter referred to as dry bulk shipping market) also constantly becomes complicated. As an important component of dry bulk supply chain, the development of dry bulk shipping market centered on sea shipping service will correspondingly have an important impact on the entire dry bulk supply chain. The dry bulk shipping market not only contains the tangible products of upstream ships, etc., but also contains downstream intangible transportation service. There are many participants, whose statuses and functions are variable, resulting in strong uncertainty of activities in dry bulk shipping market. It may affect the shipping market, even the operation of whole dry bulk supply chain. The uncertainty of dry bulk shipping market mainly shows in following three aspects: first, shipping service is the trade derived demand while world economy is the forerunner of international trade. Therefore, the relationship between supply and demand in the dry bulk shipping market is subject to the international economy environment, unable to be completely controlled by the market itself. Second, in the market structure of dry bulk shipping market, there are parallel interactive economic activities between companies in both vertical and horizontal directions, generating
- 8 -
mutual effects and suppression, but the results of which are usually unpredictable. Third, during the process of information transfer among each participant in the market, there usually exist the information variable and amplified “bullwhip effect”. The existence of this effect, not affected by the internal and external environment, is repeatedly tested in traditional supply chain and similar relationship between supply and demand, which may also exist in dry bulk shipping market (showing up as the volatility of the supply capacity is greater than that of transportation demand). Therefore, this thesis, in above market context, plans to take dry bulk shipping market and market uncertainty as the research subject, emphatically analyzes the volatility of dry bulk shipping market and the supply and demand so as to detect the possible “bullwhip effect” in dry bulk shipping market, as well as further discuss the weakening problem of bullwhip effect.
1.2 Objectives of research
The uncertainty of dry bulk shipping market is mainly reflected in the process of information transmission among each participant in this market, which often exhibits the bullwhip effect of magnifying information variation. This effect which is not affected by internal and external environment, has existed in the traditional supply chain and similar supply and demand relations, which under a repeatedly test. So the bullwhip effect is likely to be in the dry bulk shipping market. So under the background of the market, I use the uncertainty of the dry bulk shipping market as a main research subject, focus on the analysis of the dry bulk shipping market and the volatility of supply and demand change, in order to find out possible existence of bullwhip effect in the dry bulk shipping market and make further discussion on how to weaken of bullwhip effect. The Research Question of this thesis is Is there a bullwhip effect in the global dry bulk shipping market? The Sub questions are as follows: 1. What is the current development status quo of the international dry bulk market? 2. What makes international dry bulk market to have a lot of uncertainties? 3. What is the theory of bullwhip effect? 4. How to weaken bullwhip effect? As the growth of the world economic trade and shipping requirements, the ship is gradually towards the direction of large-scale and specialization. In the transport, under
the interaction of demand and supply of dry bulk,shipping market and frequent
fluctuations of the market competition is extremely intense. Dry bulk of maritime transport is an important part of dry bulk supply chain; it is an important means of intensifying of demand and supply chain optimization and management of the companies and even the entire market to benefit and improving efficiency when facing of market competition. And the bullwhip effect is a complex structure of supply and demand which is an important issue that cannot be avoid in the process of running. At last I want to analysis the results, and combined them with the uncertainty of international dry bulk shipping market analysis, and I will put forward some reasonable suggestions to the international dry bulk shipping market, in order to reduce the bullwhip effect in the international dry bulk market operation, and achieve the goal of

- 9 -
cost control risk in the end.
1.3 Research design
On the basis of the description the dry bulk supply chain, this thesis identified dry bulk shipping market as the main body of research object. In the content, it first described present development situation of dry bulk shipping market and discussed the characteristics of dry bulk shipping market and the supply and demand situation, and then extended to the uncertainty analysis of dry bulk shipping market. On the basis of the analysis, it combined with the basic theory of bullwhip effect, exploring the causes of the bullwhip effect, then it made quantitative analysis which was carried out on the bullwhip effect of its operation from the Angle of the dry bulk shipping market, theoretically proved that bullwhip effect existed in dry bulk shipping market. On the basis of proving the existence of the bullwhip effect theoretically, I introduced a GARCH model to investigate the volatility of dry bulk shipping market. Then it applied the correlation analysis and variance analysis to prove that supply and demand fluctuations of the dry bulk shipping market have the characteristics of the amplification step by step on the basis of doing the simple trend analysis of data. From both data and model calculation results, I can prove that the dry bulk shipping market does exist bullwhip effect of demand variation amplification. Finally in combination with the characteristics of the dry bulk shipping market, the thesis made some reasonable suggestions on weakening the bullwhip effect, expecting to relieve the bullwhip effect, then saving operating costs and reducing market risk.
- 10 -
Chapter 2 literature review
2.1. Research on dry bulk shipping market
At present, there are many famous international shipping agencies in dry bulk shipping market to conduct research. For example, the British shipping consultancy Clarkson and Drewry, Germany Bremen shipping institute of logistics. These institutions publish various statistical data regularly every year, and some special shipping market report in order to analyze the international shipping market seaborne volume and the supply capacity, as well as the forecast of the shipping market trend. About the supply capacity of the dry bulk vessels, there are some statistics institutions do the research that focus on the capacity surplus through shipping capacity usage. UNCTAD’s Review of Maritime Transport made a long-term analysis and research on the dry bulk shipping market and provides the valuable statistical data. In 1934, Tinbergen did the research of how the transport demands and supply capacity will influence the shipping freight. In the Tinbergen model, the freight is a function of transport demand and transport supply, and Transport demand is considered to be completely inelastic. So we can assume that the transport demand elasticity rate is 0. Other reasons such as ship operating costs are treated as constants; if we assume that when reached equilibrium, the demand will be equal to the supply. In 1939, Koopmans studied the change rules of tanker freight rate, and found that when the freight level is low, transport supply price elasticity is sufficient; and when the freight is very high, the elasticity of supply became very insufficient. Koopmans also studied that, from 1920 to the early 1930, the tanker market is at a very prosperous stage, so Koopmans assumed that the transport supply is in direct proportion to the capacity, and each unit capacity of supply depends on the ratio of freight and the cost, then he assumed again that under the condition of market equilibrium, the demand will be equal to supply. Kahre (1977) found that when freight rate rise in dry bulk, the average length of shipping trade would reduced, which made the demand for dry bulk shipping for the unit appeared to be reduced, and on this basis, Wergerland (1981) established Northbulk model of dry bulk shipping market according to the theory that when freight rate rise transport then demand would reduce. Charemza and Gronicki(1981) establish an equilibrium model ,based on considering the transportation market and shipping market may exist unbalanced state, to explain the differences between different structure in dry bulk market. Micael Beenstock (1985) proposed a theoretical model that there is an inter relationship between the ship and freight market, divide the dry bulk shipping market into two parts: ship and cargo and then use the theory of capital market to predict. After that, Beenstock use the proposed theoretical model with Andreas Vergottis (1989) to make a
- 11 -
forecast analysis to the world dry bulk shipping market and tanker market. The researches on the dry bulk market trend focus on the analysis of freight rate. Albert Veenstra and Frases (1997) used the time series and the unit root test to set up the first-order VAR model to do the forecast on freight rate index of different type of dry bulk vessels and different shipping lines. According to Japan's research department of the cruise company forecast, and through the time series prediction method for the main parts of the world in the future from 1999 to 2001, and based on the dry bulk capacity demand and capacity supply trend, Hu(1997)carried on the forecast analysis, and on this basis, he pointed out that the international maritime organization, the flag state, port state, consistent classification society and relevant shipping agencies should take steps to speed up the old ship dismantling and control the speculative shipbuilding in order to prevent freight drop and make stable development of shipping industry. Based on the economic theory that basic supply and demand determines the market, and through the research of world dry bulk market characteristics and research of related factors, Guan (2009) analyzes in detail the world dry bulk shipping market characteristics and the phenomenon of periodic change, and found out that determining factor which affecting the world dry bulk shipping market volatility. Later, Guan H. analyzed the Economic events in the dry bulk shipping market, and found out practical economic events that have occurred in the predictive value of causality, and through the analysis of the technical indicators to further elaborate the understanding of the world dry bulk shipping market. And according to the world dry bulk shipping market volatility cycle factors analysis, Hao Guan put forward the new features of the world dry bulk shipping market fluctuation cycle under the new economic situation. According to the characteristics of the international dry bulk shipping market, Wang (2005) analyzed from two aspects of the international dry bulk shipping market of supply and demand of the market development status and trend in detail. And then he applied of neural network algorithm to forecast the future international dry bulk shipping market supply and demand situation. And by using the method of supply and demand difference, he analyzed the international dry bulk shipping market in the future supply and demand balance condition. Finally, by analyzing the single ship operating economy of the mainstream ship type in the future dry bulk shipping market, and optimized the future mainstream ship type according to the results of the analysis. As an example, Zhang (2001) researched the dry bulk shipping market, specifically for the dry bulk shipping market supply and demand, price forecast model. These models are discussed in the application of dry bulk market, and these sophisticated forecasting models have been put forward to be applied in wider market in addition to the investment decision.
Zhang (2005) makes the analysis on the characters of the dry bulk shipping market,the relevant market, using the econometric methods to analyze quantitative relationship between the capacity requirements and economic development.

- 12 -
2.2. Researches on the Bullwhip Effect
Since the concept of bullwhip effect has been put forward, a lot of research achievements constantly enrich and perfect its theoretical system and research methods. The relevant researches mainly focused on the following aspects: the
existence of the bullwhip effect , the formative factors of bullwhip effect, the influence
of bullwhip effect, the bullwhip effect quantification, weaken and control the bullwhip effect. The studies of the bullwhip effect can be traced back to 1958 for Jay Forrester's work. Through computer simulation model, he confirmed that in a typical supply chain system which includes retailers, wholesalers, and manufacturers, existed the bullwhip effect. Then he analyzed the three main factors in the model, namely, organization structure, the delay of the decisions and actions, management policy, and put forward a series of causes of the bullwhip effect.
Forrester(1961)thought the irrational decision making of the participants in the
supply chain was the root cause of the bullwhip effect. Decision makers exaggerated the retailers’ demand shift too far when they made order to superior suppliers. For example, when customers’ demand became greater, the order shift of from retailers to suppliers were likely to be much greater, because this part of order was not only to satisfied the increased demand of the customers, but also to enlarge the inventory in order to meet the increase of demand in the future, what’s more, it could replenish the inventory consumption during the cargo transportation. With the moving upriver along the supply chain, the demand will be further enlarged. Forrester treated this over-respond trend as the main cause of amplification effect of demand in the supply chain. Another possible reason was the delay in the supply chain, including ordering, transport delay, delay and the manufacturer's production delays, the time delays exacerbated the bullwhip effect in supply chain. Through the model, Forrester points out that even if the expected demand remained unchanged, demand of random fluctuation and the manufacturers’ production capacity limit could also lead to the generation of bullwhip effect. Finally he put the promotion factors into the model, analyzed the promotion effect on the bullwhip effect. After Forrester (1961) studying the main causes of the bullwhip effect, he put forward several measures for enterprise to control bullwhip effect. First, he proposed a fast order processing to reduce the time delay, although this method in the model didn't have too big effect. Second, according to the actual sales information for retailers, the manufacturers made a production plan in order to improve the stability of production. In the simulation model the real sales data reduced the output fluctuations of manufacturer. Last but not least, he put forward demand smooth and inventory adjustment of exponential smoothing in order to reduce the bullwhip effect and discussed the influence of promotion strategy to bullwhip effect. Forrester thought that the understanding of the whole supply chain structure would help the enterprise to control bullwhip effect, supply chain model which built up the simulation dynamic system would help the enterprise management personnel to

- 13 -
conduct the optimization decision-making. Although Forrester’s research was primitive but it had important guiding significance for our current work on bullwhip effect. Mosekidle and Larsen (1988), studied on the supply chain system under different ordering strategy. Through the beer distribution model, they introduced three parameters of the ordering strategy and analyzed the system behaviors under different inventory management strategy. The three parameters ordering strategy of were AT, B, D. AT was a time constant, B was the shortage probability, D was probability of pre-delivery. They thought the differences between supply lines and freight lead to the instability of the beer distribution model. As a result, their research was to find out what would happen when B and D changed between 0 and 1. They changed the value of B and D and did a large number of simulations, revealing the complex dynamic behavior changes. For certain range of parameters, in any given solution within the neighborhood of contains a different solution. In this range, the behavior of the different mix together in such a way: any small changes of B and/or D can had a significantly different solutions. They thought this kind of chaotic behavior was a good explanation of complex dynamic behaviors. Mosekidle and Larsen, according to the different order strategies proved that the variability of dynamic behavior, but they did not fully investigate the cause of the bullwhip effect. Their research suggested that to solve the problem of supply lines and freight was very important to the supply chain. Sterman(1989) established the beer distribution game model, which simulated the beer production and sales. This model was composed of four roles: retailer, distributor, wholesaler and manufacturer, each person played a role. During the game, customer bought beers from retailer and retailer made order to distributor, at the same time, the distributor ordered the beers from wholesaler, at last beer manufacturer produced beers to meet the demand of wholesale orders. Each level of supply chain had delays of ordering and shipping. In the first four weeks, customer demand was 4 units of beers every week, and starting from the fifth week, it increased to 8 units per week, this change creates a disturbance. In the game, other members in the supply chain except from retailer didn't know the real demand of customer. The main purpose of the game was to minimize the total costs, including inventory cost and shortage cost. Regardless of the game participants, location and time factor, Sterman found some regularity. Through the analysis of orders and inventory mode of game participants, he concluded the three characteristics in the beer supply chain. First, orders and inventory level had great volatility and were influenced by this kind of volatility. Second, this kind of volatility successively enlarged from customer to retailer then to manufacturer, the average peak change of order levels of manufacturer was two times higher than the retailer. Third, the time of the order changes to have a peak was shorter than the order time from retailers to the manufacturer. That is to say, there is order time delay. These three points could be regarded as main characteristics of the supply chain bullwhip effect in the real production- sale network.
- 14 -
Towill (1991)considered that in a complex system with many participants , the
bullwhip effect was an error decision-making process of the participants or the a behavior outcome result from the misunderstand of the real market demand. After inspecting the advantages of the lean supply chain, he put forward some measures to weaken the bullwhip effect. To this end, he used Forrester's original model as a benchmark, tried to analyze the bullwhip effect, and put forward the some reasonable solutions. After comparing the several kinds of supply chain design strategies, he proposed a metric which based on the cost of manufacturing. On the basis of the analysis model and he put forward the following conclusions: Shortening the length of supply chain would greatly reduce the manufacturing cost which based on cost. To reduce the bullwhip effect was a kind of important means to promote collaboration among members in supply chain. It included information integration of this supply chain and the sharing of the real demand information in the market Reducing the time delay would improve the efficiency of the supply chain. This included using the JIT technology, such as establishing reduction program and the material management efficiency. In addition, improving the production line and changing the ordering strategy would weaken the bullwhip effect. Towill analyzed the benefits of designing the lean supply chain and implementing simulation. By simulating Forrester model, he compared different solutions and proposed the measurements to reduce the bullwhip effect to the enterprise. In his article, however, did not explain the formative reason of bullwhip effect, although he deduced that including material handling and information delay, any delay would become the factors that cause the bullwhip effect. Most of the conclusions of this article cited many times in his and others literatures. Although most previous studies proved the existence of the bullwhip effect, and discussed the formative reasons, but they did not measure the effect of its financial results to the company. Metters(1997) studied on this issues. His main purpose was to quantify the bullwhip effect and described financial impact of the bullwhip effect to the company. He wanted people to realize the harmful effects of bullwhip effect on corporate performance, and to take measures to weaken the bullwhip effect. Metters proved that the bullwhip effect had important effect on the company's earnings. He thought seasonal demand and forecast error were the main causes of the bullwhip effect In addition; Metters took into consideration of the factors of production capacity in the design of experiment, and proved that no production capacity limit under seasonal factors had a great influence on the production cost. It also showed the limitation of production capacity would be another factor which influenced the bullwhip effect. Lee (1997) analyzed the bullwhip effect through studying on a series real case. He found out the four causes of bullwhip effect: demand forecast update, batch ordering,

- 15 -
price fluctuation, shortage of game. After analyzing the possible reasons, Lee put forward different measures to reduce the bullwhip effect. Such as information sharing, truly reflect the final consumer demand information to all members of the supply chain, Between coordination of price, transportation, and inventory management of supply chain members in order to improve supply chain performance and to shorten the pre-interval and reduce the order cost. Taylor (2000) put forward some countermeasures of weakening bullwhip effect, including selecting a representative from each enterprise to form a demand management team to make joint decisions about safety stock point. Sun (2000) discussed the concept and the cause of the bullwhip effect, and gives a quantitative model, which was used to analysis and comparison with disperse information and concentration of bullwhip effect, and had carried on the quantitative analysis. Fu (2001) examines the causes of the bullwhip effect of supply chain based on the principal-agent theory, pointing out that the root of the bullwhip effect in supply chain and other efficiency loss problem was the structure of the supply chain. That is to say, any pair of seller and the buyer in supply chain had the bidirectional principal-agent relationship, and this relationship was due to the incomplete information and imperfect contract, including the lack of effective incentive and supervisory mechanism that result in both principal-agent had results of repeated time optimal selection problem. In conclusion, the relevant research about bullwhip effect mainly focused on the
following aspects: the existence of the bullwhip effect , the formative factors of
bullwhip effect, the influence of bullwhip effect, the bullwhip effect quantification, weaken and control the bullwhip effect. They thought the irrational decision making of the participants in the supply chain was the root cause of the bullwhip effect; another possible reason was the delay in the supply chain, including ordering, transport delay, delay and the manufacturer's production delays, the time delays exacerbated the bullwhip effect in supply chain. The main characteristics of the supply chain bullwhip effect are: First, orders and inventory level had great volatility and were influenced by this kind of volatility. Second, this kind of volatility successively enlarged from customer to retailer then to manufacturer, the average peak change of order levels of manufacturer was two times higher than the retailer. Third, the time of the order changes to have a peak was shorter than the order time from retailers to the manufacturer. To reduce the bullwhip effect was a kind of important means to promote collaboration among members in supply chain. It included information integration of this supply chain and the sharing of the real demand information in the market and reducing the time delay would improve the efficiency of the supply chain.

- 16 -
Chapter 3: International dry bulk market
3.1. Current development status quo of the international dry bulk market
The cargo in international dry bulk shipping, namely the dry bulk cargo, mean the dry cargo that can be directly installed into the cabin or hold without packaging, which are mainly some primary commodities, such as iron ore, coal, grain, bauxite, apatite, other agricultural products, wood, cement, chemical fertilizer, raw sugar, waste steel, etc.(Zhu ,2009) There, iron ore, coal, grain, bauxite and apatite are also known as five dry bulks, the main supply of cargo in dry bulk shipping. Most of the dry bulk cargos are the raw material of industrial production and the basis of international economic development. For example, iron ore and coal are the raw material of steel manufacturing industry, while steels are the main material of industry, construction industry, automobile industry, merchant ship industry, engineering industry and most of industrial products; bauxite is the material of aluminum industry. In addition, aluminum is the modern industrial raw materials---next in importance to steel; grain is the necessity of human existence; and apatite important fertilizer raw material that crop growth relies on. It can be seen from the importance of dry bulk cargo that international dry bulk shipping plays an important role in the development of world economy. 3.1.1. International dry bulk shipping market and its components International dry bulk shipping market refers to the sum of trading relations on the service of dry bulk shipping between dry bulk shipper and dry bulk carrier. (Drewry, 1996) Almost all the dry bulks are completed by chartering. In history, the company engaging on dry bulk shipping attempted many times to establish monopoly organization similar to liner conference, but all ended in failure. Therefore, dry bulk charter system is composed of carriers owning empty ship for rent, shippers owning cargo to be shipped and brokers or agents that matchmaking charter business. 3.1.2. Basic form of international dry bulk shipping market Due to different forms of chartering, dry bulk shipping market can be divided into four basic forms: voyage charter, time charter, contract of affreightment, and bareboat charter. (Zhang, 2005) The main differences are embodied in the degree of ship owner participating in operation, cast share and the degree of cargo loading in lease, and other aspects. In accordance with the charter period, the whole market can be divided into spot charter market and time charter market. Obviously, the former includes voyage charter and contract of affreightment while the latter includes time charter and bareboat charter. 3.1.3. Overview of international dry bulk market In international shipping, dry bulk shipping always accounts for a very big share. According to Clarkson statistics, before the 80s, dry bulk shipping accounted for over 50% of the total international shipping. After the 80s, with the adjustment of economic structure in developed country and the rising of container shipping, the shares of the

- 17 -
international dry bulk shipping volume in international shipping volume declined, but still remained at around 40%. Since 1993, dry bulk shipping volume has increased from the 2.763 billion tons in 1993 to the 44.308 billion tons in the end of 2013. Meanwhile, there were obvious improvements on corresponding ship capacity and ship tonnage for dry bulk cargo. By the June of 2014, the total ship capacity of global dry bulk cargo had achieved to 739.96 million DWT. Moreover, the new valley type bulk carrier with 300,000 DWT to 400,000 DWT has also been formally put into production in recent two years. (Zhang, 2005) Based on above information, it is not difficult to find that although the dry bulk shipping market often suffered from the impacts of parties, encountering the circumstance of slow development and even loss operation, it always kept moving forward on the whole. 3.1.4 The global dry bulk shipping market routes The international dry bulk shipping routes is mainly determined by the trade flow of the major type of cargo. As we mentioned before, the global dry bulk market is formed by three type of cargo: iron ore, coal and grain. So the trade flow of three types of cargo is the major routes of the global dry bulk shipping routes. From the view of whole trade flow of the global dry bulk shipping market, the leading exporters of iron ore are Brazil, South Africa, Australia, Canada, Sweden, and the main importers are Japan, European Union, China, South Korea's ; the main exporters of coal are the United States, Canada, Australia and South Africa, China, Indonesia, Colombia and main importers are Japan, South Korea, Taiwan and the European Union; the main exporters of grain are United States, Canada, Argentina, Australia, and European Union and the main importing countries are the Middle East countries, Russia, north Africa, Japan, South Korea, China and other countries. Therefore, the important routes of dry bulk shipping are result in specific routes and important ports among these countries.( Manolis,2001) From transport distance point of view, the international dry bulk belongs to world-wide routes; transportation distance is long and with a long cycle time, and generally divided into the Pacific, Atlantic airlines group and the Indian Ocean routes. Its main branch of the route is as follows: 1. Pacific Routes: Far East--- West Coast of North America Route; Far East--- the
Caribbean and East Coast of North America Route; Far East--- West Coast of South America Route; Far East---Australia, New Zealand and Southwest Pacific islands Route; Far East--- Southeast Asia Routes; Australia, New Zealand--- North America Route; East Coast of North America--- Southeast Asia Route.
2. Atlantic Routes: Northwest Europe--- East Coast North America Route; Northwest Europe, East Coast North America ---the Mediterranean, the Suez Canal to the East Route; Northwest Europe, East Coast North America--- the Caribbean Route; Northwest Europe, the Mediterranean---the East Coast of South America Route; Northwest Europe, the Atlantic coast of North America---Cape of Good Hope Route; the East Coast of South America--- Cape of Good Hope Route.
- 18 -
3. The Indian Ocean Routes: Across the Indian Ocean Route; in and out of the Northern Indian Ocean countries Route; in and out of the Persian Gulf coast Route; in and out of East Africa Route.
3.2. Characteristics of international dry bulk market
In international dry bulk shipping market, the dry bulks are usually transported by tramp ships. When operating, there are no fixed routes, affiliated ports, scheduled shipping date and rate, rather than constantly changing the routes, commodity and rate in accordance with the time, place and the transported cargo indicated in charter contract. That is to say, it is a kind of irregular transportation. Thus, from the essence of international dry bulk shipping market, it belongs to the tramp market ((ZHANG,2005), possessing following characteristics: A. Concentrated ship routes Generally speaking, both the supply place and consumption place, including dry bulk shipping, of tramp shipping are relatively concentrated, which has gradually form several stable shipping routes on a global scale, such as the Far East to Brazil, the Australia or US Gulf to Far East, north-western Europe, etc. Over the years, with the gradually increase of transit trade volume, a mature trade and transportation chain has formed in these routes, whose maturity of upstream and downstream structure as well as the degree of completeness have gradually developed towards regular liners. In addition, the route structures are stable and the service quality has also reached a higher level. B. A lot of shop owners and small scale In order to maintain regular transportation and keep certain frequency of dispatching, liner companies must have certain size of fleet. However, unlike liner companies, the international dry bulk shipping companies can put into operation only if it has one ship, whose demands for investment is relatively small. In addition, there is no barrier for new suppliers accessing to the market. As long as the new suppliers raise relatively low funds to purchase ships, or rent ships in chartering market, they can access to the market. Thus, there are a lot of ship owners or shipping operators in the market. C. International dry bulk shipping market is a perfectly competitive and transparent market. Global dry bulk shipping market is a competition market and under an unstable situation, in general, it has the following statistics of the perfect competition market :( Cheng, 1995) First: Low intensive level. The global dry bulk market company is not like the lines company, which must have a fleet scale in order to maintain the regular transport and to keep the regular frequency of dispatching. However, for the dry bulk company, owing only one vessel can start the business and it is much easier to enter the market. It is the reason that there are many ship owners and shipping operators in the global dry bulk shipping market.

- 19 -
However, in recent years, the international dry bulk shipping market has a lot to improve the concentration degree of the shipper. According to the survey of United Nations conference on trade and development ,about two-thirds of the iron ore is associated with multinational companies, They are mainly giants in steel industry, some have iron ore mine, some control the iron ore mine through long-term contracts; and part of coal transportation is also related to steel giants; due to the degree of horizontal integration of the aluminums industry is higher than the steel industry, the transportation of bauxite is associated with multinational company. Grain trade also be controlled by several multinational companies and they have a global sales network, specialized terminals and storage facilities; Apatite production is mainly controlled by state-owned companies in the developing world, but the marketing and the transportation are controlled by a few big fertilizer manufacturers. Some of these multinational companies have their own investment to do the shipbuilding and have the abilities to purchase the ship to operate the shipping business; the others have the medium-term and the long-term charter contract with ship owners in order to get a quite long period time of using the ship. Through the controlling of part of the ship, they can enhance the ability of influencing the shipping market. Second, the homoousia of product is very high. In the global dry bulk shipping market, due to the supply sourcing places of large amount of dry bulk and consumption places are usually concentrated, there are several shipping lines with large and stable transport volume are formed. Such as China---Australia and China---Brazil iron ore lines, Taiwan---Japan and Taiwan---north-western Europe bulk grain lines, etc. The changes of them also reflect the change of the development of the whole global dry bulk shipping market. Every ship owner in the market delivers the goods within the prescribed period of time from the point of departure to the specified destination according to owner's requirements. So the products they provide in this market are do the space displacement of the dry bulk cargo which they accept for carriage. However these processes of transportation basically have no difference, that is, to provide products with high identity. And subtle differences mainly reflects on the service quality, namely, the integrity of shipping goods, integrity and security. Third, basically there are no barriers to entry and exit. The global dry bulk shipping market belongs to the tramp market and in the global dry bulk shipping market; the dry bulk cargo is generally transported by trampers. (Andrew, 2000) When the trampers operate the business, they don’t have fixed routes and affiliated ports; they don’t have regular shipping date and freight rates; they only constantly change the routes, types of cargo and freight rate according to change of time, place, and the goods by the carrier of the charter party. That’s why we call it a kind of irregular transport. For the global dry bulk shipping companies, as long as there is only one ship they can
- 20 -
put it into operation, the requirement of investment is relatively small, and for new suppliers there are no market barriers to entry. Only if the new suppliers collect relatively small fund to purchase a ship or to rent a ship in the chartering market, they can enter the market. (Cheng, 1995) So the global dry bulk shipping market for the owners of cargo and the owners of ship has no virtually market barriers. For ship owners, no matter how much capacity and traffic volume they have, they can be completely free to enter or exit the market, at the same time, the owners of cargo can also free to enter the market. Both of the two sides make a deal through the competition. Fourth, complete information. Under the condition of modern communication technology, the owners of cargo and the ship owners exchange supply and demand information fast and conveniently. And contact range is all around the world, the transparency of trade is quite high. Information transparency makes both sides in this trade can have a fully comparison, preferential elimination and to enhance competitiveness. At the same time, the complete information can help both sides to make optimal decisions during the trade. Therefore, from the above analysis, I thinks that, the global dry bulk shipping market is basically perfect competition market, the supply and demand of this market are highly sensitive to price fluctuations. So it is vital to control the price trend. In terms the market structure, due to the low threshold of accessing to the market, transportation related parties can freely access to the market. At the same time, considering the current development degree of communication and network technology, the relevant information in the market can be transmitted to all parties quickly and high transparently. Therefore, transportation service market has to some extent reflected certain characteristic of perfectly competition. Compared with the monopolistic liner market, its changes are affected more by the market, also directly related to factors of world economy, trade, regional development and industrial development, and so on. In other words, the changes of dry bulk shipping market are affected more by the development of economic trades and the volatility of upstream and downstream industries. D. Derivation The essence of the dry bulk shipping market is to fulfill the corresponding displacement services of cargo transport and transport the traded cargo for contracting parties, the characteristic of which makes it become the derivative market of international trade market. At the same time, combining with the perfect competition of market structure, it can be considered that the tendency of dry bulk shipping market must have certain relevance with the development law of economy and trade. In other words, the development of the dry bulk shipping market, to some extent, is affected by the world economic trade. A lot of relevant researches on world economic fluctuations and the tendency of dry bulk shipping market are carried out at home and abroad. Roughly seeing from the data, dry bulk shipping market will make certain reflection accordingly no matter in economy ascent or descent. E. Periodicity and delay

- 21 -
Because the dry bulk shipping market is closely related to the world economy and trade, dry bulk shipping market, similar to the development of world economy and trade, also possesses the characteristic of cyclical fluctuation. Since modern times, the dry bulk shipping market has experienced several peaks and troughs. And now, it is in trough of a market cycle, the reason of which is the massive economic crisis and recession at worldwide. Cause of generating cyclical fluctuations is the world economy and trade. More immediately, it is due to the constant change of demand and supply. The fluctuations of the cargo transportation demands affect ship owners’ behaviors in immediate and long-term transportation market, while the behaviors can also directly affect the fluctuation of shipbuilding market and shipping trading market providing transport capacity. In turn, after the change of transport capacity, supply and demand will again develop towards to the opposite direction. Seeing from the iterative process, it is just because the change of world economy and trade affect the supply and demand between corresponding cargo and transportation service that affect the change of whole dry bulk shipping market, further reflecting the periodicity similar to dry bulk shipping market. (Veenstra, 1997) In addition, considering the dry bulk shipping market itself also has a long supply chain and operation, it needs certain length of time for the whole market to reflect the supply and demand. Therefore, generally speaking, it usually takes a certain period of time for cargo demand changes caused by the economic trade fluctuation to fully reflect in the dry bulk shipping market. From the historical experience, this kind of delay can even more than one year. It can be seen from the characteristics of above elements that because the dry bulk shipping market has gradually formed a mature market, the supply-demand relationship is the core of whole transportation service from the perspective views of shipping market. The supply-demand relationship level by level is the base of constituting supply and demand chain in shipping market. Before analyzing the supply and demand chain of dry bulk shipping market and discussing demand amplification effect, it should firstly analyze the supply and demand characteristics of shipping market.
3.3. The international dry bulk shipping market and relevant market factors
Based on the brief analysis of international dry bulk shipping market, relevant factors of shipping market can be roughly divided into three aspects of cargo, ships and market auxiliary service. (Jiang., 2002) Next, some key market factors in above three aspects will be briefly analyzed as follows. A. Cargo In the dry bulk shipping market, the cargo volume of iron ore, coal and grain are the first three of dry bulk shipping volume. The three cargos play an important role in dry bulk shipping market, even whole trade market and world economy.(Clarkson statistics) In addition, bauxite, fertilizer, cement, nickel minerals, phosphate ore and even wood, steel and agriculture manufactured cargo also account for large shares in dry bulk shipping market, jointly determining the market demands of dry bulk shipping market. B. Cargo transportation market Cargo transportation market is the backbone of dry bulk shipping market, while ships are only the carrier of transportation. Thus, the cargo transport market plays a main

- 22 -
support role in international dry bulk shipping market. Cargo transport market is the main part of transportation service, usually taking the supply and demand as the core of market. The whole dry bulk cargo transportation market is the trade and transport chain interlaced by consignors, trade agents, transport companies, transport agents and consignees. Recently with the constant development of economic technology, the tendency of large sized ship is obvious and the commodities gradually become diverse, with transport efficiency gradually improved, making certain changes on traditional signal consignor and consignee as well as the dry bulk transportation with simple trade structure. In addition, there also gradually appear the circumstances of cargo distribution with more than one consignees and a single ship with many cargo, making the dry bulk shipping market gradually complicated and hierarchical. C. Ship type and fleet size The ships used to transport solid bulk cargo are collectively called dry bulk carrier. According to the current international shipping market, the fleet size of dry bulk carriers
is second only to tanker fleet. According to market statistic reports(UNCTAD), the
transport capacity of dry bulk carriers at worldwide had achieved to around 739.96 million DWT by the June of 2014. By January 2014, dry bulk carriers over 10,000 DWT had reached 10000. As for the ship type, the current dry bulk fleet classifies the ship type still in accordance with deadweight tonnage of ships. According to the latest classification standard, Handysize ships are of 10,000.39, 999dwt, Handymax ships are of 40,000 - 59,999dwt, Panamax ships are of 60,000.99, 999dwt, Capesize ships are of 100,000dwt+, as well as about 30 super bulkers(the original boundary value classifying each ship type is 35,000/50,000/80,000) over 300,000 dwt. From the perspective view of current ship type, it is evident to see the tendency of large ships by comparing with deadweight capacity of classifying ship types and the number of large sized ships a few years ago. D. Ship market Shipping market belongs to the capital-intensive market, proposing higher requirements on capital investment. Generally speaking, the service life of dry bulk ships is 25 years or so. From the perspective of economy, the depreciation rate and dissipation fee are
very high because of ship’s high value and low life cycle.(Jhon, 1951)The ship
market jointly constituted by markets of new built ships, second-hand ships, chartering ships, disassembling ships and the crew labor, etc. can basically meet ship owner’s demands for management and disposal. Usually, the ship owners need to select operating strategies by combining with present situation of market, prospects and its own conditions. For example, recently dry bulk shipping market has been in a trough with serious excess capacity. At the moment, the ship owners in ship market can operate mainly from two aspects: on the one hand, in order to save cost, they seize the opportunity to disassemble the old ships so as to optimize the fleet structure. On the other hand, in order to reduce the expense, they reduce the orders in new building market, which can not only the present situation of excess market capacity but also reduce the company's operating pressure. In addition, shipping operators invest more to second-hand ship or chartering market in order to supplement their own actual capacity. (Zhang. 2005)
- 23 -
3.4 The characteristics of the international dry bulk shipping market
supply capacity
The international dry bulk shipping market supply capacity is to point to in a certain period of time, with all the carrier of dry bulk ships tonnage, under the condition of all kinds of freight can and is willing to provide the amount of tonnage, also is a certain period of international dry bulk transport business net total dead weight tonnage of the ship. (Xu, 1998)As a special service product, the international dry bulk shipping supply has the following three main features: First, the shipping product is non storage. Shipping enterprise's production activities is by shipping object space position change, don't make new material products. That is to say, the international dry bulk shipping supply production and consumption are simultaneous, transport product does not exist independently from the production process, the characteristics of reserves cannot be decided to transport to take the form of products, and only through capacity increase or decrease to adapt demand change of dry bulk shipping. But capacity growth need longer cycle, inevitable requirement of reserves, to adapt to the change of the market, it is possible to meet the needs of dry bulk shipping growth opportunities, and can result in dry bulk shipping market supply and demand imbalance, especially the risk of oversupply and produce. So, shipping transportation capacity of the advance amount and shipping transportation reserves will become an important subject shipping enterprise management strategy. It is obvious that shipping capacity reserve, the greater the risk, the greater the ability to adapt itself to the requirements of shipping also is larger; On the contrary, the smaller shipping capacity reserve, the smaller the risk, the ability to adapt itself to the requirements of shipping market. Second, the imbalance of shipping supply capacity. The imbalance of international dry bulk shipping supply performance in three aspects: First is the imbalance of supply and demand, this can be reflected in the shortage of capacity or excessive supply capacity, while the latter is more common. What’s more, the international dry bulk shipping supply imbalance is reflected in operation with the peak season and off-season imbalance, so that the supply of capacity in peak and trough of disparity, and it exists the shortage of the capacity and alternate phenomenon of waste. Finally, the international dry bulk shipping supply imbalance performance in transportation direction, which is in different regions and different even the same routes to round trip between distribution is unbalanced. These imbalances are likely to make the dry bulk shipping companies face the risk of no-load loss capacity waste. Therefore, the imbalance of international dry bulk shipping supply is relative to the balance, so it is absolutely for the long term. The rule that keep the appropriate scale and structure of the fleet is the basis for the rational utilization of capacity, reduce waste. Third, the shipping production has spatio-temporal difference. Shipping product cannot be produced in the shipping process, namely in the process of the ship's displacement, but the production and consumption of transportation products is not good, that is to say, the international dry bulk shipping supply relative to the demand, there are differences in time and space, the ship cargo

- 24 -
Or goods to the ship carrying not anytime anywhere can be achieved. If has the goods for shipment in port does not necessarily have corresponding ship is available for use, or vice versa have more ships in port do not have corresponding goods. And supply to provide and satisfy the demand is in dry bulk displacement at the same time, the requirement with the above shipping production of space and time difference, easy cause dry bulk shipping supply must bear capacity loss even light navigation economic risks.
3.5. Studies on uncertainty of dry bulk shipping market
Dry bulk shipping market takes the fulfillment of maritime transport displacement as the core. As a market with characteristic of derivation, it has a wide range and many influence factors. (Guan, 2009) Therefore, it has strong uncertainty. The first is the uncertainty in time. The dry bulk shipping demand is derived from dry bulk trade, while world economy plays a leading role in the trade of dry bulks. Thus, it is doomed to be greatly affected and restricted by the international economic environment in the operation process of dry bulk shipping market. Second, parallel interaction influences the range of uncertainty, also enhancing the uncertainty of dry bulk shipping market. This feature means there exist interaction, influence and restriction among companies in both horizontal and vertical direction in the market. For example, if a shipbuilding company in the market assembles the components provided by suppliers with poor quality to the ship during the process of ship assembling, it may affect the ship’s trial condition and then affect the supply capacity. Meanwhile, the problem can also affect the steel producers in horizontal structure. Although the steel plate is of good quality, it still cannot fulfill the complete shipping with poor quality components. (Xu, 1998)Hence, the influence of this parallel interaction makes the range of uncertainty constantly expend in the market. Third, the uncertainty has resulted in business model presents the characteristic of the large volatility of capacity supply in dry bulk shipping market, making the second-hand ship and chartering transactions, apart from new built ships, are also the important modes of increasing transportation service to influence the original supply of transportation capacity among transportation suppliers in dry bulk shipping market. However, chartering and second-hand ship transactions cannot fundamentally change the whole construction of transportation capacity in the market, still needing to face the problem of delay. Moreover, the mode of adjusting the transportation capacity supply to adapt demands still needs to rely on new building market and ship disassembling market, as well as to face the problem of delay. Thus, there are alternatives for adjusting transportation capacity supply in dry bulk shipping market, but from the perspective of whole market, the uncertainty caused by the delay of transportation capacity fluctuation in still unavoidable. Fourth, from the aspects of transport demand, the dry bulk shipping market is characterized by large batch, low value and gives priority to raw materials (such as iron ore and coal) and primary commodity (such as grain), resulting in the market demander are mainly the primary production and processing and manufacturing companies (such

- 25 -
as steel melting companies, chemical industries, etc.). Compared with other companies, these companies, due to the large scale, single product, fixed customers, rely more on the development of economy. Therefore, it proves that the dry bulk shipping market is more vulnerable to the influence of outside economic and trade conditions and its uncertainty of its operation is relatively strong. Fifth, on the implementation of the dry bulk transportation service, because there are multiple independent behavioral agents in the dry bulk shipping market, as well as each independent behavioral agent facing with different market conditions and environments. Therefore, as for the operating strategy, each party predicts the future operation just depending on the condition of market they stay in, which will generate complicated chaos effect in whole shipping market. Hence, the dry bulk shipping market may make some changes in the internal or external market due to the different demands of different participants on transportation service, affecting the reasonable operation of shipping market. Besides, some possible non-predicted results also increase the risk and uncertainty of market operation. The uncertainty of the dry bulk shipping market can form the demand amplification effect among market behavioral agents. In shipping market, when dry bulk demand information flow is transmitted from the terminal world trade and economic changes to the source---the original ship owner providing ship transportation capacity by means of cargo demander and ship operator, there will be demand information amplification effect, similar to traditional supply chain in the process of information transmit level by level due to various uncertainties in the market. To be specific, direct demand in dry bulk shipping market is the demand for transportation services. However, because transportation service is the derived demand, source demand is international trade demand and the economic development demands at deeper level. Therefore, there is not only the circumstance of the transportation capacity fluctuation more than that of shipping demand on transportation service. Meanwhile, it also reflects upstream information amplification effect of the economy and trade development, as the shipping source demand in shipping market. This effect can also be called “bullwhip effect”. The problem embodied in dry bulk shipping market will be deeply researched and discussed below. Based on the above analysis, in order to deal with the fluctuation and uncertainty in dry bulk shipping market, related parties in shipping market should strengthen communication and cooperation on the basis of parties completing main businesses, penetrating energy to related field so as to form a mature and complete market cooperation system. Next, the article, starting from the perspective of analyzing related characteristics of demand amplification effect, understands the gradually amplified bullwhip effect and discusses the bullwhip effect of dry bulk shipping market from the perspective of theory and practice.
3.6 Cost impact on the international dry bulk freight rate
Freight is the shipping product value of the monetary form; value form determines the

- 26 -
rate of forming. The value of the transportation products can be divided into three parts: First, it has the consumption of the means of transport, technology, equipment, fuel, the value of materials and other means of production, namely, transfer value. Second, the laborers create their own value. Third, the laborer creates value for the society. And, freight rate is also divided into three parts, material consumption spending, Transfer of value of currency performance remuneration spending, currency performance of create value from workers for their labor; Profit, is the currency performance of labor to create value for the society From the perspective of freight, profit accounts for only part of freight revenue. Especially in the international dry bulk shipping market with the characteristic of perfect competition market, shipping companies can only get "normal" profits, and the costs will include the material consumption expenditure, labor remuneration, a large proportion in the freight. International shipping cost is the main basis that shipping companies make freight rate. So the cost of transportation of freight movements has far-reaching influence. Due to the Scarcity and irrefragable of resources, it will cause the growth trends to all kinds of resource price. Such as Marine fuel prices rising trend. Several other projects are also affecting the cost of transportation: tonnage value, the crew fees, port charge, etc. Due to the increase in the opportunity cost of capital, demand for high quality crew rising will cost more training fees, the increasing of port disbursement price, makes a rising trend of transportation cost. Under the action of transport costs rise, the international dry bulk freight rate also has a long-term upward trend.
3.7 The influence of supply and demand of international dry bulk freight
Freight as commodity prices, is affected by shipping market supply and demand as the same as transport services and other commodity prices. Shipping requirements include freight volume, Cargo class structure, haul distance and time requirements. Shipping market supply converting transport services to be capacity of the ship. The main indicator of transport capacity supply is Tonnage, namely owner tonnage of the ship to the shipping market supply quantity. (Zhang, 2005) The international dry bulk freight is a market equilibrium price agreed among the dry bulk suppliers and demanders in the perfect competition of international dry bulk shipping market. The equilibrium market price is the price at which there is no tendency for it to change. When the price is lower than the equilibrium price, quantity demanded will be larger than the quantity supplied. Then, there will be a tendency for the price to increase. And when the price is higher than the equilibrium price, quantity supplied will be larger than quantity demanded. There will be a tendency for the price to decrease. And the Equilibrium market price is attained when the quantity demanded equals quantity supplied. It is sometimes called market clearing price. When the dry bulk shipping market supply and demand both sides strength contrast changes, under the function of market mechanism, the original equilibrium price will be broken, and new market equilibrium, will form a new market price. Supply and demand
- 27 -
will become the cost beyond the second main factor affecting the international dry bulk freight rate. Transportation production is the continue part of circulation domain in production process. (Zhang 2005)It is closely connected with commercial trade activities especially in international shipping area. Marine transport is the main approach to realize global economic communication and international trade. Therefore, shipping requirement is derived from international trade as a derived demand. This characteristic indicates that the development of international shipping market is directly affected by international trade. Hence, the environmental factors that influence international trade are also affecting the need of shipping. What is more, the development of international trade depends on the development of global economy. Global economy is the overarching economic factor that affects the change of international shipping market price. On one hand, it is from the cyclical fluctuation of global economy. Researchers have shown that period of wave of global economy is 4 to 5 years normally. That wave lead to the cyclical fluctuation of international shipping needs. The wave of international shipping needs also cause the wave of shipping price. On the other hand, it is from the economy impact. This impact is paroxysmal and affects more to international shipping. The oil crisis in 1970s is an example. The crisis cause global economic decline. In the meantime, the needs of international shipping were lacking, which lead to the excess of ships. This paroxysmal economic impact causes random wave of shipping price. So it is a vital reason for cyclical fluctuation of shipping price.
Summary of Chapter 3
In this chapter, we talked about the current development status quo of the international dry bulk market; we answered the sub research question: What is the current development status quo of the international dry bulk market? and What makes international dry bulk market to have a lot of uncertainties? Dry bulk shipping market takes the fulfillment of maritime transport displacement as the core. As a market with characteristic of derivation, it has a wide range and many influence factors. Because transportation service is the derived demand, the source demand is international trade demand and the economic development demands at deeper level. Therefore, there is not only the circumstance of the transportation capacity fluctuation more than that of shipping demand on transportation service. Meanwhile, it also reflects upstream information amplification effect of the economy and trade development, as the shipping source demand in shipping market. This effect can also be called “bullwhip effect”. The problem embodied in dry bulk shipping market will be deeply researched and discussed below. Based on the above analysis, in order to deal with the fluctuation and uncertainty in dry bulk shipping market, related parties in shipping market should strengthen communication and cooperation on the basis of parties completing main businesses,

- 28 -
penetrating energy to related field so as to form a mature and complete market cooperation system. Next, the article, starting from the perspective of analyzing related characteristics of demand amplification effect, understands the gradually amplified bullwhip effect and discusses the bullwhip effect of dry bulk shipping market from the perspective of theory and practice.

- 29 -
Chapter4. Bullwhip effect and preliminary analysis of bullwhip effect in
the dry bulk shipping market
4.1 Overview of the bullwhip effect
The Bullwhip effect is also commonly referred to as the demand variability amplification effect mainly used to describe information distortion during the process of information dissemination on the demand and supply chain (Hau, 1994). In other words, some small-scale fluctuations of market demand may encounter a lot of uncertainties during the process that manufacturers develop production plans, which may result in a huge fluctuation upstream. This is similar to a wielding bullwhip. That is to say, slight movements of the bullwhip root will have the whiplash swing dramatically. So this is why the effect is called “bullwhip effect”. Statistics show that the invalid operations which result from the bullwhip effect make the enterprise pay for 12.5% to 25% more. (Kurt, 1993) Fuller's research also showed that in the food industry of America, where the annual value of production is $3000 billion , the invalid inventory among each members ranges from $75 billion to $100 billion caused by the bullwhip effect. The core idea of this effect is that if all members in all sectors of the structure of supply and demand perform production or supply prediction only with information obtained from its adjacent subordinates, demand information distortion will be transferred from
bottom to top along the supply chain, and be progressively enlarged, which is shown
in the picture below.After this transfer process, usually there is a huge gap between the information obtained and accepted by superior suppliers and the real end market information. It is because of this demand amplification effect that uncertainties are generated during the operation process, with possible risks and losses increased.
Resource from: http://en.wikipedia.org/wiki/Bullwhip_effect

- 30 -
Thus, although the bullwhip effect manifests itself in terms of demand uncertainty, this uncertainty actually stems from variability and distorted amplification of demand information in the dissemination process. Bullwhip effect comes into being because of the following reasons. Firstly, demand information distortion occurs during the dissemination process, which results in fluctuations in demand. Since demand is transferred via the chain of supply and demand in the form of information, a slight change at the end of the supply chain will bring about great influences on the demand information obtained by the ultimate supplier. Secondly, from an operational perspective, fluctuations and increases in demand may occur during the process of demand sending out and transferring. For instance, batch order from a higher level, supply limit and short-term game will all aggregate the bullwhip effect. Thirdly, from the point of view of pricing, pricing strategy or price fluctuations of a product will lead to demand changes. For instance, batch orders that reflect scale economy, advance purchases that consider future market changes, will both directly affect the demand stability and rationality, leading to increased market uncertainty and bullwhip effect. Fourthly, when it comes to market incentives, all aspects of the market may be subject to some incentives, leading to more market movements and decreased overall efficiency. In the final analysis it is that some participants abandon the overall market coordination for some short-term benefits. As a result, market operation difficulty rises. Fifthly, participants have problems with market cognition. For instance, the impact on other stages is ignored; there is a lack of communications during the operation process, and a lack of mutual trust; competition for interests and shirking responsibilities, are all not conducive to the sound market development. The uncertainty incurred will often generate bullwhip effect and cause losses. The above analysis shows that the bullwhip effect is present in the structure of supply and demand in the market, and is usually caused by the irrationality and uncertainty arising during the market operation. Based on the analysis, the bullwhip effect needs further analysis in terms of root causes and mechanisms, to better understand the bullwhip effect, and to investigate the existence of the bullwhip effect in the dry bulk shipping market.
4.2 Root cause analysis of bullwhip effect
Bullwhip effect is a product of the supply chain structure. When exploring its root cause, we should also speak from the supply chain structure, which can be seen as the interaction and interdependence between the entities involved.

- 31 -
In the international dry bulk shipping market, when it comes to the impact of the supply chain on the bullwhip effect, agents on the upstream and downstream sides have uncoordinated interests, with incomplete and inaccurate information transferred. (Liu, 2007)As a result, the best solution to operation cannot be put into practice driven by the interests and mutual game. This is the economic reason for the bullwhip effect. As per different structures and sizes, the supply chain can roughly be divided into the chain / tree one and the short and thick / thin and long one. As the supply chain expands in the horizontal and perpendicular directions, the aforesaid principal-agent or supply- demand relationship will continue to increase, which also lead to repeated sub-optimal choices. Each choice means that the results are deviated from the optimal result more. That is why the bullwhip effect of expanded demand in the supply chain
occurs as it rises in the length and width from the perspective of system. (Naise,1994)For several structures of the supply chain, when other conditions remain unchanged, the bullwhip effect of the chain structure is smaller than that of the tree structure. As for the short and thick structure and the thin and long one, the number of parties involved in has to be considered. Generally speaking, when there are often members, the demand information distortion will be more severe due to more processing. When the number of participants is the same, the thick and short structure is relatively more stable. Combined with a brief analysis above, a more detailed analysis will be given as follows on the root cause of the bullwhip effect in terms of economics and system theories: 4.2.1 Economic analysis of the bullwhip effect The supply chain, if explained from the perspective of economics, is an informal organization generated with an organic combination of producers, suppliers, service providers and the demand side, aiming at minimizing the total operating costs while offering supply and demand services. This organization form has certain hierarchical classification and market characteristics. Based on this, the use of economic theory to analyze the operation of the supply chain can help better learn about the root causes of the bullwhip effect. Bullwhip effect is a product of interaction among business strategies of all parties involved in the supply chain. For each participant, its behavior should be the best decision for its own operations out of a rational assumption. That is, a result of decisions and games of rational participants in the supply chain for maximum benefits. According to the principal-agent theory proposed by American economists Berle and Myens, each supply and demand side in the supply chain (adjacent upstream and downstream sides) have a long-term principal-agency relationship, in which the principal and agent are both seeking to maximize their own interests, and making decisions in their best interest. These goals and decisions, however, pose mutual constraints to and have influences on each other. In each of the principal- agency relationship, due to the limitations of the structure and

- 32 -
characteristics of the supply chain, information structure is not completely symmetrical. None of manufacturers' production costs and yields, vendors' selling prices and stocks, real market demand information is part of the information for exchanges. At the same time, restricted by the supply chain structure, this principal- agent contractual relationship goes without the appropriate supervision and incentives; the final decisions of the agent may not conform to the maximum interest goals of the client. In particular, the participants in the same role are either irrelevant or competing with each other. The relationship is looser and a more effective supervision and encouragement is not possible. As the principal-agent objectives and interests are uncoordinated, communications are poor, and contracts are imperfect, an optimal choice cannot be achieved between both parties, which will be enlarged with the cumulative level. The root causes of the bullwhip effect of the supply chain and similar efficiency losses should be the basic structure and mode of operation of the supply chain. 4.2.2 System theory analysis of the Bullwhip Effect In terms of system theory, the supply chain belongs to complicated system. According to the system theory, system structures determine system functions while system functions react to system structures. The Bullwhip Effect is one of the outwards expressions of the supply chain and is determined by system structures. There are mutual relationships among participating bodies of the supply chain, and between the supply chain and the outside environment especially market changes. Mutual relationships among participating bodies of the supply chain are not simple or passive causal relationships but active mutual adaption, and all the participating bodies are trying to adapt to the outside environment. It means each participating body could actively adopt specific strategies and methods that benefit themselves most according to other participant actions and changes of outside environment. However these strategies are based on partial actions and would not give changes or improvements to the whole. As for details, the whole system structure and every part of it are complicated and hierarchical, and are materially different; meanwhile relationship among all parts of the system is complex and generally nonlinear. Based on complexity and non-linearity, interactions among participating bodies of the supply chain can’t be easily added up, which means the overall optimization of the system can’t be achieved by adding up all the participating bodies. In addition, participating bodies of the supply chain are active, dependent or semi-dependent economic bodies, among which there are variable competitions, cooperation or other more complex dynamic demand and supply relationship, making the inner mechanism of the supply chain changing steadily; meanwhile, outside environment influences the operation law of the supply chain, making it continuously changing and adjusting. Therefore, the supply chain and every part of it have great uncertainty. The uncertainty of parts of the supply system would influence the actions of neighboring participating bodies, and as this process continues steadily, partial actions may cause

- 33 -
great changes and influence in the whole supply chains net, causing great negative effect and finally the Bullwhip Effect. Therefore, the primary cause of the Bullwhip Effect is the structure problem of the system; it is a system problem. Because the uncertainty and complexity of the supply chain operation can’t be changed, the Bullwhip Effect of the supply chain does exist objectively.
4.3 Research on the Bullwhip Effect in the dry bulk shipping market
According to the past study on the forming mechanism of the Bullwhip Effect, in supply chains of traditional tangible products, the Bullwhip Effect is causes by several factors below: deviations in demand prediction, cycle batch ordering, advanced purchasing caused by price changes, complicated structure and lack of coordination among participation bodies of the supply chain. The following is research on the forming way and quantification way of the Bullwhip Effect in the dry bulk shipping market combined with basic theories of the Bullwhip Effect and based on the discussion on the dry bulk shipping market above. 4.3.1 Forming of the Bullwhip Effect of the dry bulk shipping market For the dry bulk shipping market, combined with its own characteristics, the forming of the Bullwhip Effect is caused by shipping demand instability, imbalance of the shipping, price undulations, shipping capacity supply instability and short-term games. A. Instability in dry bulk shipping demand predictions According to characteristics of the Bullwhip Effect, its forming in the dry bulk shipping market is mainly determined by the fundamental demand of the shipping market. The demand in dry bulk shipping market is a service derived demand, whose changes are affected by the development of global economies and trades. When global economies develop quickly, fundamental construction would develop rapidly, the demand of industrial materials would be the growth point and global trades would expand accordingly. These changes would make the dry bulk shipping market more active and prosperous. On the contrary, when global economies in stagnation or recession, global trades and fundamental industrial would be impacted, then demand in the dry bulk shipping market would decline, the derivation of which would directly lead to the uncertainty in demand predictions. The derivation disables simple reference to the past demand changes in the dry bulk market to predict market demands; only predictions in primary demand could make the final operation strategies suitable and reasonable. Therefore it’s required to make dual predictions of economies and trades, based on which the shipping demand could be conducted. But dual predictions would bring about even greater changes in the dry bulk shipping demand prediction, leading to greater undulations in shipping demand and shipping capacity supply than economies and trades, thus causing the Bullwhip Effect in the dry bulk shipping market. B. Shipping imbalance in the dry bulk shipping market

- 34 -
In the dry bulk shipping market, the shipping way is batch transport, which generally gathers cargo in the port and transport in ships. The two sides of the trade would generally determine the uni-direction of the transport of most cargo. This leads to the imbalance in the shipping volume in different directions. In actual operation, empty load
shipping means excessive shipping capacity to some extent. (Gong, 2002). In addition
to uni-direction, some dry bulk shipping is seasonal, such as food or coal for heat supply, and the cargo supply cycles would cause shipping capacity demand undulations in different time. These factors would cause shipping capacity excess or lack to some degree in different market situation. The transport imbalance is a specific expression of the Bullwhip Effect formed of the cycle and batch ordering in the traditional supply chains. C. Undulation of the transport price There is obvious price undulation, which refers to the fact that freight rate goes up and down ,in dry bulk shipping market, where there is no public market transport price which
can be shown in the BDI index. Broadly speaking,the relative number formed by the
comparison of any two values can be referred to as the index; Narrowly speaking, the index is a special kind of relative numbers which used to measure the comprehensive changes of multiple projects in different situation. Different index has its own method of calculation. BDI index is calculated from weighted spot transport prices of several main ship routes, reflecting the spot market quotations. BDI index is always the transport price index of raw materials in bulk and relates to the operation situation of dry bulk shipping, global economic and cargo quotations. An obvious increase in the BDI index represents good global economies situation and great international trade volume. And as the BDI index increasing, it can be seen that increases in the shipping price of dry bulk is consistent with those in bulk cargo prices. In recent years, there are great undulations in the BDI index in accordance with continuous changes in global economics, directly showing the continuous changes in transport prices in dry bulk shipping market. Analyzing from the respect of economics, price undulations would lead to advanced purchasing or selected purchasing of the demand side, which applied in the dry bulk shipping market would lead to both sides of large scale trades rationally adjusting the time and quantity of conducting shipping orders based on their own demand and taking the market price undulations into consideration so that causing uncertain transport demand undulations in the dry bulk shipping market. These demand undulations caused from transport price risk aversion have confused the demand in dry bulk shipping service and easily created deviations in demand predictions made by shipping service providers and operators, and therefore in the supply of transport capacity which is adjusted according to its demand, and finally resulted in the Bullwhip Effect which means the excess or insufficient of transport capacity. D. Instability of transport capacity supply The supply of dry bulk shipping market depends on the shipping capacity but not tangible products as traditional supply chains which can be supplemented or stored by rational adjustments in inventory and production efficiency. In addition, the transport capacity adjustment period which mainly relied on the time used from production to
- 35 -
operation, is relatively long. So the supply responses in dry bulk shipping market are hysteretic and not flexible. The renewal of the transport capacity is another cause of the bullwhip effect in the shipping market. The renewal of the transport capacity is reflecting in the long cycle of ship construction, which caused time lag in the operation after putting the ship into the market. When the transport demands growth along with the economic and trade growth, it requires the corresponding growth of transport capacity to satisfy, but the transportation capacity of the renewal need quite a long period. Due to the large investment of ship product and long cycle of usage, the new capacity cannot put into market immediately. The excess capacity cannot withdraw from the market immediately, which has increased the risk of supply exceeds demand in shipping market, and lead to a fluctuation in shipping market excess capacity is always greater than fluctuations in economic and trade growth, and finally causes the bullwhip effect in the shipping market. Inaccurate market demand forecast, will cause forecasting errors of capacity in the shipping market. When the market demand forecasting is high, it will lead to the increase of capacity in the shipping market blindly. The owner's pursuit of high profits will cause a large number of new ordering ships. When there is great shipping demand, ship owners start to product new ships and improve shipping capacity, after which the shipping demand may decreased sharply and the newly increased shipping capacity would be idle. On the contrary, when there is few shipping demand in the market, ship owners start to decrease shipping capacity by disassembling old ships and cutting down orders, after which the demand may turn to increase and the shipping capacity would be insufficient and hard to supplement. Non-storage and hysteretic quality of the shipping service and its supply adjustment lead to the Bullwhip Effect in the shipping market; undulations in economies and trades would bring out changes in the shipping demand of related dry bulks, but adjustments of shipping capacity take time, which means newly increased shipping capacity is not able to enter the market and excessive shipping capacity is not able to exit the market. Therefore, in actual operation there must be preparation before adjustments of shipping capacity, which even adds to the risk of imbalance between supply and demand. As a result undulations in shipping capacity are even more than that in economies and trades and thus it causes the Bullwhip Effect in the shipping capacity supply side in the dry bulk shipping market. E. Market short-term games In the dry bulk shipping market, when the shipping service supply is insufficient, ship companies would be faced with sharply increased orders under short-term games. The owners of cargo would exaggerate their real demand to gain enough shipping space that meets their demand. Under this circumstances that ship companies can’t get real market demand information, they would product more new ships to satisfy the demands of owners of cargo. However one year or two later, when the new shipping capacity is put into market, market demand may have decreased, making the shipping capacity excessive. This caused the Bullwhip Effect in dry bulk shipping service supply chain.

- 36 -
The short-terms games of owners of cargo will destroy the original market balance in supply and demand, thus resulting in short-terms games of shipping service supply side, aggravating the Bullwhip Effect and setting the stage for more loss in the dry bulk shipping market. In conclusion, many factors contribute to the Bullwhip Effect in the dry bulk shipping market, but the primary cause was the information stuff inside the market, which leads to demand predictions deviations, panic to price undulations, short-term games of both supply side and demand side, and finally the unavoidable Bullwhip Effect. 4.3.2 Quantification way of the Bullwhip Effect in the dry bulk market According to the forming characteristics of the Bullwhip Effect in the dry bulk shipping market, the amplification of changes can be measured by the ratio of changes of neighboring supply side and demand side as the quantification of the Bullwhip Effect. As raw materials of manufacture and processing industry, the demand of dry bulks is mainly determined the trade volume of related manufactured goods and reflected by global economies changes. Because of the various kind, value and even size of manufactured goods, it’s difficult to find an inferior demand index directly describing the dry bulk shipping market. So when calculating the Bullwhip Effect of global dry bulk shipping volume shown from bottom to top of the chain, it’s more reasonable to put calculations on global economies. The dry bulk shipping supply should be taken into consideration in addition to the demand to show the Bullwhip Effect from the shipping service demand to the supply through changes in size of the fleet.
4.4 Harm of the Bullwhip Effect in the dry bulk market
The main source of information and decisions of the shipping capacity supply side in the dry bulk shipping market is orders from ship companies, and the shipping capacity adjustments of ship companies are determined by changes of cargo demands in dry bulk trade market. Therefore undulations and uncertainty of dry bulk shipping demand would have great effect on shipping supply because of the Bullwhip Effect in the operation of dry bulk shipping market, leading to excessive shipping capacity with great operation cost, which will bring huge operation pressure to ship owners. The Bullwhip Effect influences the normal operation of the dry bulk shipping market and destroys the balance between demand and supply, which leads to possible incorrect decisions. Either over estimate or under estimate in making decisions would cause imbalance between shipping capacity and shipping volume, harming the economic interests of market participants or even the normal operation of the whole supply chain. So rational analysis and estimate of the Bullwhip Effect in the dry bulk shipping market are required in order to raise effective operation plan and eliminate negative effects from the Bullwhip Effect on the dry bulk shipping market.

- 37 -
Summary of Chapter4
In this chapter we talked about the bullwhip effect and preliminary analysis of bullwhip
effect in the dry bulk shipping market. We answered the sub research question:What
is the theory of bullwhip effect? And many factors contribute to the Bullwhip Effect in the dry bulk shipping market, but the primary cause was the information stuff inside the market, which leads to demand prediction deviations, panic to price undulations, short-term games of both supply side and demand side, and finally the unavoidable Bullwhip Effect. Then we analyzed the harm of the Bullwhip Effect in the dry bulk market and realize the Bullwhip Effect influences the normal operation of the dry bulk shipping market and destroys the balance between demand and supply, which leads to possible incorrect decisions. Either over estimate or under estimate in making decisions would cause imbalance between shipping capacity and shipping volume, harming the economic interests of market participants or even the normal operation of the whole supply chain.

- 38 -
Chapter 5 Methodology GARCH model
The Bullwhip Effect is primarily about market undulations; as for the dry bulk shipping market, it’s about the confused and exaggerated transfer process of information in the supply chain, based on the analysis of dry bulk shipping market undulations. So before the discussion on the Bullwhip Effect, it’s required to explore the undulation property of the dry bulk shipping market. Based on the past work on the undulation property of the finance and stock market, this article adopts the GARCH model and determines the undulation property of the dry bulk shipping market through calculations on the BDI index, which directly shows the price trend of the dry bulk shipping market.
5.1 GARCH model overview
Engle came out with the ARCH (Autoregressive Conditional Heteroskedasticity) mode in 1982. The model is used to analyze conditional heteroskedastic sequences that vary from time. Soon after Engle’s paper, expansion and revision of the ARCH model became a hot topic with lots of achievements about related theories and applications, making the study on this field deeper and deeper. Bollerslev brought in the lagged residual variance to the ARCH (p) model in 1986 and got generalized ARCH model, namely GARCH (p, q) model, after which other generalized models such as GARCH.M, TGARCH, EGARCH came out, making a relatively completed autoregressive conditional heteroskedasticity modeling system. (SU Y, YANG Z.H.,2007) GARCH (Generalized ARCH) model conditional variance is as follows: P is the order of GARCH term; q is the order of ARCH term. When values of both GARCH and ARCH terms are bigger than 1, it makes the GARCH (p, q) model. Generally GARCH (1, 1) model equals ARCH (∞) model, used to describe huge data of time sequences. (Michael S,1998)The formula is as follows:
In the formula,ω>0,αt≥0(i=1,2,...,q), βj≥0(j=1,2,...,p); The necessary and sufficient
condition of GARCH (p, q) model stability is <1, and the more it approaches 1, the stronger the steadiness of sequence undulations. The formula is as follows:
In the formula, ω>0,α≥0,β≥0,α+β<1, α is the return coefficient, β is the hysteresis coefficient. The conditional variance ht consists of the following terms: 1.ω, constant term, is sensible to the length of data horizon, showing the long-term level of undulations.

- 39 -
2.α, return coefficient, ARCH term, showing the rapid response of undulations to the market change if its value is big. 3. β, hysteresis coefficient, GARCH term, showing the long period of undulations is its value is big.
5.2 Analysis on the applicability of GARCH model
Traditional econometric model assumes that the variance is constant in different times. However with the development of the shipping theory and the deepening of the demonstration work, more and more researchers have found that the variance describing uncertainty and predicting decision risks varied from times and relied on the change scope of past errors. So the assumption of independent constant variance in the traditional model is not suitable for the shipping market price changes. Finance data like inflation rate, interest rate and return rate will be involved in Heteroskedasticity problems, showing obvious volatility clustering, which means greater changes concentrate in some certain times and smaller ones concentrate in some other times. Quantities of empirical study show that it’s suitable to model on the undulation property and dependency of shipping time sequences under the GARCH model. (Bollerslev, T 1986)It has the advantage in describing the heteroskedasticity of error terms in the mean equation by the variance equation, thus making the estimation of the mean equation more effective. This article choose the GARCH model that is most generally used as for ARCH models to research the undulation property of the dry bulk shipping market through analyzing the variance change of the shipping price.
5.3 Data variance analysis
According to the concept of the Bullwhip Effect, it is reflected through data undulations in the dry bulk shipping market, which is generally reflected through the data variance. Calculating data undulations through the data variance is to test the difference between two group of data; the more intense the undulations, the greater the variance. So in the dry bulk shipping market the Bullwhip Effect can be measured by the ratio between the shipping supply and demand. The variance test can also be called F test. In the variance test, samples are assumed as random and independent under all circumstances, and sample data is selected from the whole which suits the normal distribution, or the nonparametric analysis will be adopted; meanwhile variances of samples under different treatment conditions are the same, meaning equal effects.
(SU Y, YANG Z.H.,2007)
For samples of shipping supply and demand, if assumed to suit the normal distribution,
the overall variance will be accordingly and ; the sample variance of two sample groups with volume n1 and n2 independently selected from the whole of shipping supply
and demand is accordingly and . Test on the ratio of the two sample variances and the F statistical value is as follow:

- 40 -
The statistical value suits the F distribution with numerator DOF n1-1 and denominator DOF n2-1. If F>1, the undulations of shipping supply is more intense than that of shipping demand, and the demand is exaggerated; the opposite is not.
Summary of Chapter 5
This chapter we introduce the knowledge of GARCH model and Data variance analysis, which is the preparation of next chapter. The advantage of this model is that it can capture a varying variance / forecasting error, which will be needed in our analysis.

- 41 -
Chapter 6: Empirical analysis on bullwhip effect in the global dry bulk
shipping market
6.1 Dry bulk shipping market volatility analysis
6.1.1 Summary of the international dry bulk freight index Freight index refers to the ratio of the price in a certain period of time in the shipping market and the price in benchmark period of time of shipping market, which is used to reflect the dynamic changing in shipping freight rate levels. Freight rate is an important contents of the market, which is also a reflection of market supply and demand, it is the combining point of supply and demand in the international dry bulk shipping market, due to the price of every transaction that freight, according to a charter party to determine the specific ship, routes, cargo, such as time difference will affect the freight, is not the same. What is typically used on international to reflect the international trend of dry bulk shipping market is the freight index. Freight index refers to the ratio of the price in a certain period of time in the shipping market and the price in benchmark period of time of shipping market, which is used to reflect the dynamic changing in shipping freight rate levels. At present, the shipping freight indexes have been published in the world, from the Angle of shipping services, can be divided into tramp freight index and liner ship freight index, the tramp of freight index can be classified as voyage charter freight index time charter index and tanker voyage charter index such as ship freight index. From the point of index providers the indexes mainly include: Baltic Dry Index (BDI), Clarkson Indices, Lloyd’s Ship Manager Freight Indices, German Sea Freight, British Tramp Time Charter Indices etc.. In terms of international dry bulk shipping, the relatively authoritative dry bulk freight index is the Baltic dry freight index released by the British of the Baltic exchange, which is known as the "barometer" of international dry bulk shipping market. Currently the BDI index is the world's most authoritative index of international dry bulk shipping situation, which is also the leading index that reflects the international trade situation. If the index rises dramatically, it means that the economic situation is good, the trade within different countries increases and the boom of the international dry bulk shipping market promotes. (Andrew L, 2000) Full name of BDI (Baltic Dry Index) is the Baltic Dry freight Index. The origin of BDI can be traced back to 1985, which was called the BFI (Baltic Freight Index) at that time. At that time, the Baltic exchange has just set up, in order to be able to reflect and reveal the international dry bulk market supply and demand of transportation price situation. Briefly speaking, the development of the Baltic exchange, in 1523, there was a cafe bar in Britain called "Virginia and the Baltic sea", later in 1744, with the constantly growing

- 42 -
of the bar, the regular customers of the cafe independently created a maritime trade club. And after more than a century development and progress, finally in 1890, the club was official turned into the Baltic exchange, and became a special important place for shipping trade. 6.1.2 Data selection This thesis used the BDI index released by Baltic Exchange as initial data to analyze the dry bulk shipping market, ranging from November, 1999 to June, 2004, added up to 176 months’ data.
Tab.6.1 1999-2014 BDI Index Per Month year Jan. Feb. Mar. Apr.
May June July Aug. Sep. Oct. Nov. Dec.
1999 1351 1319
2000 1319 1531 1660 1628 1566 1616 1642 1652 1739 1759 1672 1599
2001 1504 1537 1438 1459 1389 1386 1049 927 952 861 868 876
2002 908 1031 1082 1027 1042 1005 968 1036 1367 1417 1560 1738
2003 1530 1764 1939 2142 2127 2125 2181 2265 2993 4555 4417 4765
2004 5551 5263 4822 3958 3286 3005 4048 4186 4105 4922 6051 4598
2005 4488 4726 4637 3850 3219 2521 1804 2592 2907 3113 2770 2407
2006 2081 2680 2496 2368 2436 2964 3285 3847 3944 4037 4336 4397
2007 4225 4765 5388 6248 5971 6278 6967 7702 9474 10656
10210
9143
2008 6052 7613 8081 9356 11440
9589 8341 6809 3217 851 715 774
2009 1070 1986 1615 1786 3494 3757 3350 2421 2220 3103 3887 3005
2010 2848 2738 2998 3354 4078 2406 1967 2713 2446 2678 2099 1773
2011 1107 1251 1530 1269 1480 1413 1264 1619 1899 1965 1846 1624
2012 680 750 934 1155 923 1004 897 703 766 1026 1086 699
2013 760 757 910 863 809 1171 1062 1132 2003 1504 1821 2277
2014 1110 1258 1362 943 934 850
Data from: The Baltic Exchange

- 43 -
Figure 6.2 BDI Index Data
As is seen in the historical data table (Fig.6.2), the BDI index undulated fiercely in the sampling time period with unstable developing trend. In real volatility research, the return rate would better reflect the market operation situation compared with the price, and would better meet the statistic demand of the model compared with the price sequence. So we use the BDI Index to take the month average return rate as the research subject and calculate it through logarithmic calculus of differences. Set the return rate after calculus of differences as Rt, the month average shipping price index as p, then Rt=lnpt-lnpt-1. In this thesis, RBDI represented the average month return rate sequence after first-order calculus of differences. As is seen from operated data, the return time sequence would show the trend of regression to the average that great undulations connected to reversed ones, little undulations had responses, too. Therefore it could be concluded that the return rate sequence of RBDI had volatility cluster property similar to the financial time sequence. So the GARCH model generally used in the research of financial time sequence was adopted in the research. 6.1.3 Analysis of statistic character of data A. Sample mean
The sample mean of log return rate is E(Y),which is the mean of the sample return in
the observation period, the computational formula is
t
t
1)( Y
TYE
Y is time series of log return rate, T is the statistical time of sample interval. Sample

- 44 -
mean described average volatility of the return rate in the sample interval, the bigger the value is, the greater the average volatility is. B. Variance
The sample variance of log return rate 2 reflects the deviation degree of the log return
rate from the sample mean, the bigger the value is, the great the degree is. The computational formula is
t
22 ))((1
YEYT
t
C. Skewness The skewness of sample reflects the deflection degree, the value is positive or negative is related the the deflection direction. If the skewness is bigger than zero, the series distribution is right skew; if the skewness is smaller than zero, the series distribution is left skew. The bigger the absolute value of skewness is, the greater deflection degree is. The computational formula is
3
3))((1
t
t YEYT
S
D. Kurtosis The sample kurtosis of return rate is used to determine the shape of the return distribution; generally it is based on the Kurtosis value of the normal distribution (Kurtosis value of the normal distribution is 3). When the Kurtosis value is bigger than 3, it means this distribution has thicker tail then normal distribution; when the Kurtosis value is smaller than 3, it means this distribution has thinner tail then normal distribution. The computational formula is
4
4))((1
1
YEYTK
t
E. Jarque-Bera The Jarque-Bera mainly use to test that whether the series is normal distribution or not. The computational formula is
22 ))3(4
1(
6
KS
KTJB
Using the Eviews software to analysis logarithmic return rate data, I have the descriptive statistics as follow:

- 45 -
Figure 6.3 Descriptive Statistics
As is seen in the chart, the logarithm return rate was positive, the median was bigger than zero; it was left skew in terms of the measure of skewness, which meant more statistics were bigger than average return rate and quite thick tail skew to the left side; in terms of the kurtosis, it was similar to the Gaussian distribution and the peak value was greater than 3, reflecting the heavy tail of Gaussian distribution. In addition, the Jarque-Bera statistic accompany probability was zero and thus rejected to the original hypothesis of Gaussian distribution. 6.1.4 Index volatility and sensitivity analysis 1. Stability analysis The important premise of GARCH model researching the time sequence is the stability of the data sequence. If the random process is unstable, it’s hard to show the primary situation of the time sequence. Generally if the average and variance function varies overtime, it’s unstable; otherwise it’s stable. This article adopted ADF function to examine if the month average return rate index had roots of unity. And the result is as follows:
Tab 6.4 examination Results of ADF Test
As is seen in the chart, according to the Schwartz Criterion lag phase selection standard, when the maximal lag phase was 20, ADF values were smaller than the critical values of 1 percent, 5 percent, 10 percent, where the original hypothesis of roots of unity existing was rejected, reflecting that the BDI return rate was stable and could be analyzed by the GARCH model. 2. Auto-correlation examination

- 46 -
Two common auto-correlation examination methods include ACF and PACF qualitative determinate method and Ljung-Box Q examination method. One is to show characteristics of trailing and truncation; the other one is to set statistical magnitudes and make quantitative comparison. As for the quantitative method, assume that the sequence correlation doesn’t exist, then set a statistical magnitude Q=N (N+2) that suits x2 distribution with DOF p; in the formula, N represents sample size, # represents the square of the K-order auto-correlation coefficient of the return rate. If the original hypothesis is right, Q approximately suits x2 distribution; if statistical magnitude Q is greater than the critical value and the company probability is smaller than the obvious level, the original hypothesis that the sequences uncorrelated is rejected, which verifies the existence of obvious correlation among sequences. RBDI correlation examination result was as follow:
Figure 6.5 RBDI correlation examination result
Q(1) Q(5) Q(10) Q(20)
Q-Stat 160.69 577.62 845.60 947.20
p-value 0.000 0.000 0.000 0.000
Tab 6.6Examination Results of Auto-correlation Test
As is seen in the Tab 6.5, the p-values of any order of Q-Statwas 0, so the original hypothesis was rejected at 1 percent level, which verified the existence of obvious correlation, meaning that the return rate of a certain period was correlated to last periods, namely some kind of transferability. In addition, the cluster property was shown as well, meaning that when impacted by outside environment, undulations became greater, as well as that of the return rate later, and points with great undulations clustered in a certain period and points with little undulations in another period.
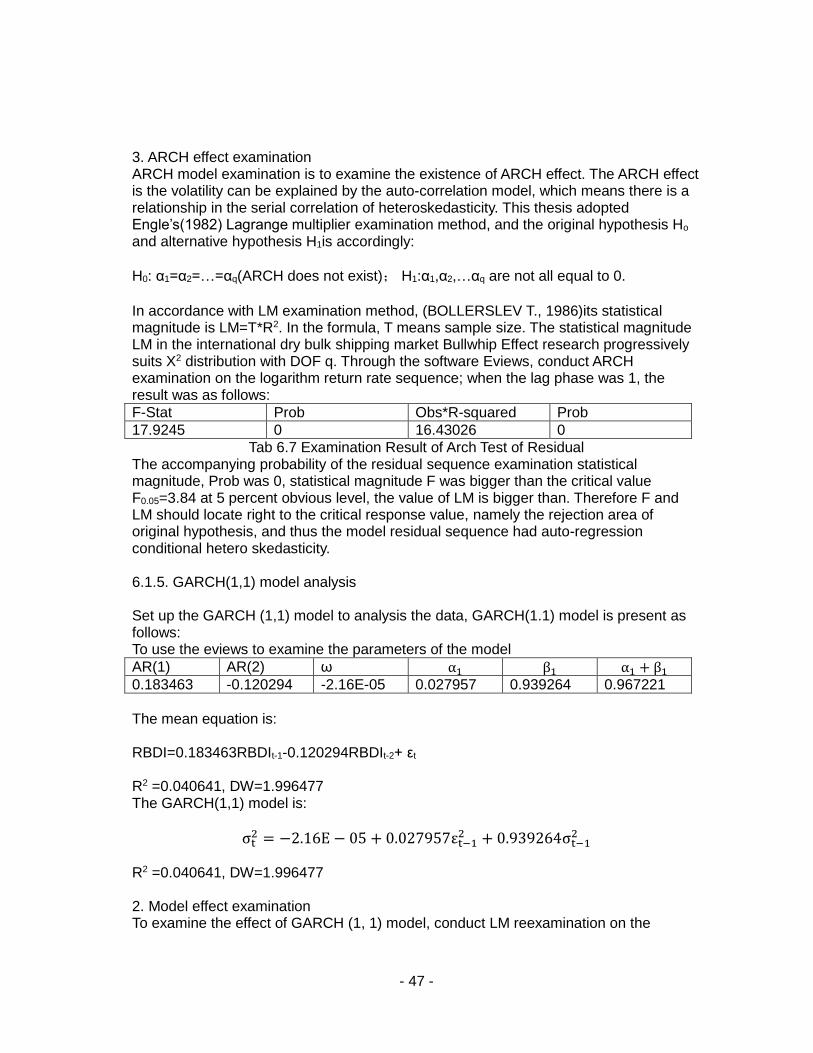
- 47 -
3. ARCH effect examination ARCH model examination is to examine the existence of ARCH effect. The ARCH effect is the volatility can be explained by the auto-correlation model, which means there is a relationship in the serial correlation of heteroskedasticity. This thesis adopted Engle’s(1982) Lagrange multiplier examination method, and the original hypothesis Ho and alternative hypothesis H1is accordingly:
H0: α1=α2=…=αq(ARCH does not exist); H1:α1,α2,…αq are not all equal to 0.
In accordance with LM examination method, (BOLLERSLEV T., 1986)its statistical magnitude is LM=T*R2. In the formula, T means sample size. The statistical magnitude LM in the international dry bulk shipping market Bullwhip Effect research progressively suits X2 distribution with DOF q. Through the software Eviews, conduct ARCH examination on the logarithm return rate sequence; when the lag phase was 1, the result was as follows:
F-Stat Prob Obs*R-squared Prob
17.9245 0 16.43026 0
Tab 6.7 Examination Result of Arch Test of Residual The accompanying probability of the residual sequence examination statistical magnitude, Prob was 0, statistical magnitude F was bigger than the critical value F0.05=3.84 at 5 percent obvious level, the value of LM is bigger than. Therefore F and LM should locate right to the critical response value, namely the rejection area of original hypothesis, and thus the model residual sequence had auto-regression conditional hetero skedasticity. 6.1.5. GARCH(1,1) model analysis Set up the GARCH (1,1) model to analysis the data, GARCH(1.1) model is present as follows: To use the eviews to examine the parameters of the model
AR(1) AR(2) ω α1 β1 α1 + β1 0.183463 -0.120294 -2.16E-05 0.027957 0.939264 0.967221
The mean equation is: RBDI=0.183463RBDIt-1-0.120294RBDIt-2+ εt
R2 =0.040641, DW=1.996477 The GARCH(1,1) model is:
σt2 = −2.16E − 05 + 0.027957εt−1
2 + 0.939264σt−12
R2 =0.040641, DW=1.996477 2. Model effect examination To examine the effect of GARCH (1, 1) model, conduct LM reexamination on the

- 48 -
residual sequence and get the result that LM statistical magnitude of RBDI was 0.714506, tail probability was 0.3980, verifying that LM statistical magnitude on the return rate located to the left of the critical value, and the original assumption was true at 5 percent of the obvious level and thus the model residual sequence had no autoregression conditional heteroskedasticity. So the GARCH specification is adequate in modelling the volatility clustering 3. Model coefficient analysis In the GARCH (1, 1) model, the α1 means the return coefficient of logarithm return sequence. The bigger theα1 value is, the more the effect of outside impacts on the market and the quicker the market responds to it. The β1is lag coefficient; the bigger theβ1 value is, the stronger the memorability to undulations and the longer the undulation lasts. The α1+β1 is the judgment standard of market return time sequence stability and sign of the undulation steadiness strength. The bigger theα1+β1 value is, the longer the undulation lasts. Through analysis of GARCH model on the dry bulk shipping market price index, the statistical analysis verified that relevant return sequences had conditional hetero skedasticity and didn’t suit the Gaussian distribution; its distribution had sharp peak and heavy tail, which verified the existence of obvious volatility clustering in the dry bulk shipping market. Through the matching of GARCH (1, 1) model, construct the GARCH (1, 1) equation related to RBDI; seen from the equation parameters, and considering the data analysis result of GARCH model in the stock market, the dry bulk shipping market return rate was vulnerable to outside impacts, and had strong memorability to undulations. The critical value was 0.967, which verify that the market statistic variation had strong volatility steadiness. Above all, considering that the dry bulk shipping price could directly reflect the market situation developing trend, it could be concluded that the dry bulk shipping market had volatility, which would be greatly influenced by and would rapidly respond to outside impacts, and had great volatility memorability steadiness. Such volatility could contribute to the forming of the Bullwhip Effect and set basis for the analysis of the Bullwhip Effect in the dry bulk shipping market in the next section.
6.2 Dry bulk shipping market data analysis
Based on the analysis of dry bulk shipping market volatility, this section conducted primary analysis on the data of every part of the dry bulk shipping market, and quantified the Bullwhip Effect through the exaggeration of data undulations. 6.2.1 Data description In terms of the components of the Bullwhip Effect data, several information transfer data exist in the dry bulk shipping market, including shipping capacity, shipping demand, international trade volume, global economy index, and there is no comparability among these data in unit and order of magnitudes. Because of the data restriction in the dry bulk shipping market analysis, it’s required to standardize all the data before demonstration analysis.

- 49 -
Data in this article ranged 20 years from 1993 to 2012, and the data was transferred to growth ratio between that of a year and the year before (positive ration meant increasing and negative ratio meant the opposite); on one hand, ratios had common unit which contributed to calculation and comparison analysis; on the other, ratio could better describe the variation of data and reflect the difference in rangeability on different points of the same period. Through analyzing the statistic from UNTDC, IMF and Clarkson, and based on the initial data, four groups of statistics were concluded, including global economies growth rate, international trade growth rate, global dry bulk shipping growth rate and global dry bulk shipping fleet capacity growth rate all on year-on-year basis. 6.2.2 Bullwhip Effect quantification analysis Conduct Bullwhip Effect quantification analysis on standardized data before demonstration analysis and gain general variation trend and rangeability to conduct primary volatility analysis on the dry bulk shipping market. Compare the growth rates of global economies, international trade and global dry bulk shipping volume to reflect the rangeability of different parts. Chart 6. and table 6. could reflect the variation trend of global economies, international trade and global dry bulk shipping market for 20 years from 1993 to 2012, from which the difference in variation trend and rangeability of different part of the dry bulk shipping market was shown.
Tab.6.8 The world economic,trade,dry bulk shiiping amount growth statistics
Year World economic growth rate(%)
World trade growth rate(%)
World dry bulk shipping amount (mil.tons)
World dry bulk shipping amount growth rate(%)
1993 1.1 3.7 2702 2.6
1994 2.8 8.9 2817 4.3
1995 2.4 9.0 2996 6.4
1996 3.5 7.1 3131 4.5
1997 3.4 10.5 3330 6.4
1998 1.8 4.6 3329 0.0
1999 2.9 5.8 3402 2.2
2000 4.0 12.4 3660 7.6
2001 1.3 0.2 3726 1.8
2002 1.8 3.3 3920 5.2
2003 2.5 4.9 4105 4.7
2004 4.1 9.9 4391 7.0
2005 3.5 7.7 4608 4.9
2006 4.1 9.2 4864 5.6
2007 4.0 8.0 5127 5.4
2008 1.5 3.1 5325 3.9

- 50 -
2009 -2.3 -10.6 5054 -5.1
2010 4.1 12.5 5661 12.0
2011 2.7 6.0 5983 5.7
2012 2.3 2.5 6265 4.7
Data from: UNTCAD“Trade and development report ”1993-2012; IMF“World economic outlook” 2013; CLARKSON “The Clarkson Shipping Review&Outlook”2012; CLARKSON “Dry Bulk Trade Outlook”1999-2013
Fig6. 9The trend chart of the World Econmic, Trade and Dry bulk Demand growth
rate As is seen in Chart6.8and Table 6.9 , first, there was strong correlation among global economies, international trade and global dry bulk shipping volume, verifying that the demand of dry bulk shipping market was indirect demand and was influenced by economies and trades; second, during the 20 years, global economies volatility was relatively small and economies developed smoothly, with on year-on-year basis maximal undulation 4.1 percent, minimal undulation 1.1 percent, the difference was 3 percent; global trade volatility was relatively great with on year-on-year basis minimal undulation 0.2 percent in 2001 and maximal undulation 12.5 percent in 2010, the difference was 12.3 percent; the dry bulk shipping volume varied most in 2010, increasing by 12 percent than the last year, and varied least in 1998, almost equal to 1997, and the volatility difference was 12 percent. In addition, volatility of global trade was greater than that of the dry bulk shipping volume, that’s because for the value and characteristic of the cargo, variation in global trade was measured by value of trade, so dry bulk with great quantity and low value took up little in global trade, which had little effect on the trade variation. However, in terms of global trades of dry bulk related cereal grains and industrial raw materials, the volatility was equal to or relatively small than that of the dry bulk shipping volume. Even so, volatility greater than 10 percent in the dry bulk shipping volume was enough to theoretically verify the demand exaggeration effect in the dry bulk shipping market.

- 51 -
We can use the percentage of the data change to measure the change of every step in the dry bulk market in order to describe the changes of amplification effect through the change of percentage.
Tab6. 10The Bullwhip Effect in Dry Bulk Market Year World
economic growth
rate(%)①
World trade growth
rate(%)② ②/①
A
World dry bulk shipping amount growth
rate(%)③
③/①
B
World dry bulk fleet growth
rate④ ④/③
C
1993 1.1 3.7 3.363636 2.6 2.363636 1.3 0.5
1994 2.8 8.9 3.178571 4.3 1.535714 2.2 0.511628
1995 2.4 9 3.75 6.4 2.666667 3.8 0.59375
1996 3.5 7.1 2.028571 4.5 1.285714 -1.5 -0.33333
1997 3.4 10.5 3.088235 6.4 1.882353 4.5 0.703125
1998 1.8 4.6 2.555556 0 0 -0.1 -2.07
1999 2.9 5.8 2 2.2 0.758621 1.3 0.590909
2000 4 12.4 3.1 7.6 1.9 3.1 0.407895
2001 1.3 0.2 0.153846 1.8 1.384615 4.3 2.388889
2002 1.8 3.3 1.833333 5.2 2.888889 3.3 0.634615
2003 2.5 4.9 1.96 4.7 1.88 1.9 0.404255
2004 4.1 9.9 2.414634 7 1.707317 6.6 0.942857
2005 3.5 7.7 2.2 4.9 1.4 7.1 1.44898
2006 4.1 9.2 2.243902 5.6 1.365854 6.8 1.214286
2007 4 8 2 5.4 1.35 6.5 1.203704
2008 1.5 3.1 2.066667 3.9 2.6 6.5 1.666667
2009 -2.3 -10.6 4.608696 -5.1 2.217391 9.7 -1.90196
2010 4.1 12.5 3.04878 12 2.926829 17 1.416667
2011 2.7 6 2.222222 5.7 2.111111 14.7 2.578947
2012 2.3 2.5 1.086957 4.7 2.043478 10.3 2.191489
Data from: UNTCAD“Trade and development report ”1993-2012; IMF“World economic outlook” 2013; CLARKSON “The Clarkson Shipping Review&Outlook”2012; CLARKSON “Dry Bulk Trade Outlook”1999-2013 As is seen in the chart above, in column A, except that data of 2001 was smaller than I, other data all reflected that global trade variation was greater than that of global economies, namely the exaggeration effect. In column B, the dry bulk shipping volume of only 1998 and 1999 was smaller than global economies volatility. Data in column A and B reflected that global economies, international trade and global dry bulk shipping volume had similar variation trend, and were some kind of different in volatility range and stability because of locating in different levels of international dry bulk shipping market. As is seen in column C, first, before 2004, volatility of shipping capacity was smaller than that of shipping volume, and that’s because this period was after a peak of ship production caused by demand and market environment variation, there was lots of shipping capacity excess and the ship production volume was in a low level in the following few years; second, volatility of shipping capacity became greater than that of shipping volume these years and the difference expanded even greater, resulting in more shipping capacity excess in the future; third, there were negative values in column C, which was an obvious difference with column A and B and verified the possible opposite developing trend between shipping volume and shipping capacity, and that verified the lag property in the dry bulk shipping market mentioned above. Combining

- 52 -
the former two points, it’s common that economies and trade developed slow and shipping capacity varied fiercely, which would arouse shipping capacity excess in a certain period. And considering the lag property of shipping capacity supply, it would further influence the Bullwhip Effect in the dry bulk shipping market, which we would discuss in the next section. In conclusion, this data was similar to the Bullwhip Effect and the existence and strength of the Bullwhip Effect could be reflected by numbers to achieve quantification. However, quantification mentioned above was in terms of simple data of every part of the dry bulk shipping market, later in the article, there would be further analysis in terms of the essence of the Bullwhip Effect.
6.3 The Bullwhip Effect in the dry bulk shipping market
Based on the analysis of volatility and data of the dry bulk shipping market, variation analysis and comparison are conducted on data of the dry bulk shipping market at each level to verify the exaggeration effect from bottom to top among different parts of the market. This section analyzed the Bullwhip Effect in the dry bulk shipping market from two steps: firstly, conduct correlation analysis among different data to verify that different parts of the dry bulk shipping market and economies and trade had correlations to some extent and reflecting the transfer and effect of demand information in the dry bulk shipping market. First, calculate the correlation coefficient in data calculation in the correlation analysis, which ranges from -1 to 1; if the correlation coefficient is bigger than 0.8, it means there is quite strong correlation between two variables; if the absolute value is ranged from 0.5 to 0.8, it means there is relatively strong correlation between two variables; if the absolute value is ranged from 0.3 to 0.5, it means there is relatively weak correlation between two variables; if the absolute value is smaller than 0.3, it means there is hardly correlation between two variables. To do the data’s correlation analysis, we have the result
World economic/the demand of dry bulk shipping
the demand of dry bulk shipping/shipping capacity supply
World economic/shipping capacity supply
0.6607 0.6427 0.2962
The P value of all the 3 group of data is smaller than 0.0001, and if they could pass the Chi-square examination, T examination and F examination, it means the result is credible. In terms of the calculation result, on one hand, correlation between World economies variation and dry bulk shipping market demand data and correlation between shipping market demand and shipping capacity supply were both greater than 0.6, verifying that there the correlation were relatively strong; correlation between World economies variation and shipping capacity supply was 0.29,verifying that there was nearly no correlation;on the other hand, the transfer of intermediate parts would bring

- 53 -
about deviations in correlation, reflecting that demand information was transferred from the bottom to top of the market, and the demand and supply interacted as both cause and effect. After the correlation analysis, we use the variance of data to calculate the volatility of market,also we can prove the bullwhip effect is exist through the ratio of the variance. The result of calculation the variance is as follow:
World economic
fluctuation①
shipping demandfluctu
ation②
shipping capacity supplyfluctua
tion③
②/① ③/②
0.9771 2.4668 4.5011 2.52 1.82
Through calculation of variances, in terms of data ①, ②, ③ and related data of the dry
bulk shipping market in the 20 years, it’s concluded that volatility rangeability of economic aggregate, shipping demand and shipping capacity supply were exaggerated level by level; for the data ratio, the volatility rangeability expanded for 2.5 times of that of the world economies, and the volatility rangeability of shipping capacity supply expanded for 1.8 times of that of the shipping demand, and all the ratios were bigger than 1. Through calculation, it’s concluded that in 3-level system, economy undulation information would influence the shipping demand through dry bulk trade and then influence the shipping capacity supply, and the volatility exaggerated level by level, which reflected the Bullwhip Effect obviously. If analyze even more complex construction of the whole of the dry bulk shipping market and even the whole supply chain of the dry bulk, the exaggeration effect might be greater.
6.4 Research on decreasing the Bullwhip Effect in the dry bulk shipping
market
A. Make prediction rationally Rational prediction is the fundamental of dry bulk shipping market operation and it is under control of market participants. Information transfer and cooperation among all parts of the market are based on rational operation. With the information assumed true, it’s required to rationally analyze and arrange future operation plans based on the market demand and past statistics to avoid negative effects from wrong judgments or decisions on the dry bulk market to the whole market. In terms of the forming of the Bullwhip Effect, rational prediction in every part of the market would effectively weaken the impact from the Bullwhip Effect and restrict the information exaggeration in its transfer process. B. Share information Information means more efficient and accurate transfer from the bottom to top. Participants of the dry bulk shipping market would make some predictions to adjust their shipping plans or shipping capacity arrangement. Generally, the information come from the neighboring backwards position and the transfer continues steadily. The Bullwhip Effect comes from the departure of information from its initial demand. To avoid the

- 54 -
multistep transfer and prediction and eliminate information asymmetry, the fundamental demand information can be shared to some degree in the dry bulk shipping market so that all the participants would make predictions on their production and operation plans based on common initial information. Some information exchange system can be used to share information to help market participants find out real shipping demand. In addition, non-directed information share is acceptable if it is hard to share information directly and it would achieve real information with the direct downwards participants not involved. Share information would shorten its transfer length, reduce the demand exaggeration effect during the transfer process and thus weaken the Bullwhip Effect. C. Enhance cooperation Enhancing cooperation in the dry bulk shipping market means that participant of all parts of the market cooperate in respects of shipping price, shipping capacity supply and shipping plan. For the dry bulk shipping market, it’s a common method to ally with owners of cargo, through which both supply and demand side could enhance cooperation in shipping demand and shipping capacity supply. Ship companies could directly gain the data of shipping demand from owners of cargo and adjust the shipping capacity supply ahead of time according to the demand information to avoid shipping capacity excess. On the contrary, with stable shipping capacity supply, owners of cargo could also reduce shipping risks. In addition, the both sides could make arranged shipping price among allies to reduce uncertainty caused by price undulations. In the dry bulk shipping market, enhancing cooperation could effectively avoid the effect of short-term games. Uncertainty of the dry bulk shipping market makes intense undulations, so most participants would independently make decisions about demand, supply and shipping price to maximize their own interest regardless of other participants, which would depart the market trend, lead to prediction deviations and impact on the interest and risk of not only themselves but the whole market with the demand variation transfer from the bottom to top. Enhancing cooperation would effectively reduce short-term games and control the impact of the Bullwhip Effect. D. Capacity control Dry bulk shipping industry has a broad prospect, the growth of transport capacity and traffic volume will cause the ship companies’ efficiency drops rapidly, and it must strengthen the control of capacity.At the same time, the ship company reduces the shipbuilding cycle through the technological progress, in order to improve the efficiency of the operation to reduce the repeated forecasts updated with changes in the high demand. E. Improve the overall operation efficient of the market In the dry bulk shipping market, on one hand, technology improvement would improve the production efficiency of ship companies and shorten the production period to improve the adjustment efficiency of shipping capacity, which makes it more sensible to response to and adjust the shipping demand, thus avoiding frequent adjustment of the shipping demand. On the other, reasonable regulations on the dry bulk shipping market operators would improve the overall operation efficiency. Different with container shipping market, there are all kinds of participants in the dry bulk shipping market with various capacity, whose operation decisions made to avoid the uncertainty in the cooperation with neighboring participants and maximize their own interests are likely to
- 55 -
depart from the market demand. This uncertainty in cooperation sharpens that in operation, and may expand the Bullwhip Effect. So reasonable regulations to some degree would promote the overall operation efficiency, decrease uncertainty and control the Bullwhip Effect to some extent. F. The government's regulation In order to avoid a disorderly competition and the resulting waste resources in port construction, at the same time, the government in the area between different ports should strengthen international communication and coordination and also strengthen the coordination and unified planning among domestic ports and internal ports groups.Effective control of the government can reduce the bullwhip effect in the shipping companies.
Summary of Chapter 6
In this chapter, through analysis of GARCH model on the dry bulk shipping market price index, we verified the existence of obvious volatility clustering in the dry bulk shipping market. Considering that the dry bulk shipping price could directly reflect the market situation developing trend, it could be concluded that the dry bulk shipping market had volatility, which would be greatly influenced by and would rapidly respond to outside impacts, and had great volatility memorability steadiness. Such volatility could contribute to the forming of the Bullwhip Effect. Based on the analysis of dry bulk shipping market volatility, we conducted primary analysis on the data of every part of the dry bulk shipping market, and quantified the Bullwhip Effect through the exaggeration of data undulations. Then we analyzed the Bullwhip Effect in the dry bulk shipping market from two steps: firstly, conduct correlation analysis among different data to verify that different parts of the dry bulk shipping market and economies and trade had correlations to some extent and reflecting the transfer and effect of demand information in the dry bulk shipping market. In the end we focused on decreasing the Bullwhip Effect in the dry bulk shipping market, which is to answer the last sub research question: How to weaken bullwhip effect?
And we concluded with six reasonable suggestions:A. Make prediction rationally;B.
Share information;C. Enhance cooperation;D. Capacity control;E. Improve the
overall operation efficient of the market;F. Government's regulation.
- 56 -
Chapter 7 Research conclusion and future research
7.1 Research conclusion
In the respect of the dry bulk shipping market, this article analyzed the current situations and properties of the dry bulk shipping market, explored the Bullwhip Effect problem caused by the demand information uncertainty; explored the harm to the market of the Bullwhip Effect based on specific characteristics of the traditional supply chain and the dry bulk shipping market; made simple supply and demand model based on the theory analysis, and described the Bullwhip Effect in the dry bulk shipping market via related statistics in the past 20 years; raises some suggestions on weakening the Bullwhip Effect in the dry bulk shipping market based on the supply and demand structure and fundamental characteristics. The conclusions are as follow: A. Seen from the current situation of the dry bulk shipping market, the trend of large ships and complex market structure become obvious. Because of the increasing shipping demand, the shipping volume increase rapidly, so is the number of participants; the shipping service, ship supply, trade and other parts of the world become more and more complex, and the supply chain develops completed gradually. In terms of the market, the supply and demand structure becomes more complex and completed. B. Based on the analysis of dry bulk shipping market fundamental characteristics, including uncertainty in shipping demand predictions, imbalance of shipping, undulations of shipping prices, volatility of shipping capacity supply and market short-term games, it can be summarized that the Bullwhip Effect theoretically exists in the operation of the dry bulk shipping market. Then the article conducted definition and quantification analysis of the Bullwhip Effect in the dry bulk shipping market, through which it gained overall understanding of the Bullwhip Effect in the dry bulk shipping market. C. Inferred to the supply and demand model, it’s concluded that the Bullwhip Effect formed in the information transfer process. The GARCH model verified the characteristics of the Bullwhip Effect that sharp peak and heavy tail, rapid response to outside impacts, long reaction period of undulations, and strong steadiness, confirming the real meaning of exploring the undulate and exaggerated Bullwhip Effect. The quantification analysis of the Bullwhip Effect showed that the ratio of different parts of the dry bulk shipping market was exaggerated from bottom to top, which reflected the characteristic of the Bullwhip Effect in terms of the data ratio. Finally the variance measured the intensity of undulations in different part of the market that the shipping demand undulations of dry bulks is 2.5 times the intensity of that of global economies, the shipping capacity undulations is 1.8 times the intensity of that of shipping demand. The exaggeration effect verified the existence of the Bullwhip Effect in the dry bulk shipping market. D. Through analysis on shipping capacity excess, it’s concluded that the Bullwhip Effect

- 57 -
in the dry bulk shipping market would arouse confusion in supply and demand information, leading to the deviations and errors in decision making, which would finally cause the imbalance of the market and great economic losses hard to redeem. The Bullwhip Effect required attention due to its harm. Meanwhile methods to weaken the Bullwhip Effect were raised based on the statistics which included making rational predictions, sharing information, enhancing cooperation and improving the overall operation efficiency, which would contribute to controlling the Bullwhip Effect.
7.2 Future research
Based on the analysis of the dry bulk shipping market, this article conducted theoretical research on the Bullwhip Effect in the dry bulk shipping market and gave primary explanation to the forming, definition and harm of the Bullwhip Effect; meanwhile used the GARCH model and variance analysis to make simple quantification of the Bullwhip Effect in the dry bulk shipping market; finally gave some suggestions to weaken the Bullwhip Effect in the dry bulk shipping market. However, the article has some boundedness. In terms of the research, the thesis analyzed the Bullwhip Effect from the whole, and in the future, it’s meaningful to conduct deeper analysis on specific part of the market (such as ship factories, ship companies), explore the effect of the Bullwhip Effect to participants and discuss related measures. In terms of research methods, the article merely used basic econometric methods to give description and quantification to the market statistics; in the future, system dynamics models and chaos theory can also be used in the research on the shipping market. In addition, researches on the Bullwhip Effect in other markets of the shipping markets, such as oil shipping market, container shipping market can also be conducted. In terms of the supply chain theory, the article explores only one part of the dry bulk shipping market, shipping, but involved the supply side and demand side. So in the future, research subjects can expand to the whole dry bulk supply chain and explore the Bullwhip Effect of it.

- 58 -
Bibliography
1. BAI S X, (2002),The recent development of Capesize bulk carrier, Journal of Ship Design, volZ1.
2. Koopmans T.C(1939), Tanker Freight Rate and Tankship Building, an Analysis of Cyclical Fluctuations. Netherland Economics Institute Report No. 27, Holland.
3. Kahre G. (1977) The last Tall Ships, Conway Press. London 1977. 4. W. Charemza and M.Gronicki, An Econometric Model of World Shipping and
Shipbuilding. Maritime Policy and Management. 1981, 22-26 5. M. Beenstock, a Theory of Ship Prices. Maritime Policy and Management. 1985, 2:
215-225. 6. M. Beenstock and A. Vergottis, an econometric Model of the world shipping Market
for Dry Cargo, Freight and Shipping. Applied Economic. 1989, 21(a):339-359. 7. J. John, World Tank Fleet Review, I. Jacobs. John. 1951. 8. Lloyd. Lloyd’s Shipping Economist. London: Lloyd’s of London Press. 1979 9. Veenstra, Franses. A Co-integration Approach to Forecasting Freight Rates in the
Dry Bulk Shipping Sector. International Journal of Transportation Economics. 1997, 6: 158-176.
10. M.Kavussanos, Comparison of Volatility in the Dry Cargo Ship Sector. Journal of
Transport Economics and Policy. 1996, 30: 67-82.
11. M.Kavussanos, Dockery, Everton. A Multivariate Test for Stock Market Efficiency:
The Case of ASE, An Plied Financial Economics. Taylor and Francis Journals. 2001, 11(5) :73-79.
12. UNTCAD“Trade and development report ”1993-2012; 13. IMF“World economic outlook” 2013; 14. CLARKSON “The Clarkon Shipping Review&Outlook”2012; 15. CLARKSON “Dry Bulk Trade Outlook”1999-2013 16. Guan H, (2009), Global Dry Bulk Shipping Market and its Fluctuation Analysis, MSc
Thesis, Shanghai, Fudan University. 17. Zhang L G. International shipping market freight rate quantitative prediction method
College Journal of Dalian Maritime University, 2001 (04) : 33-36 18. Wang Y P. International dry bulk shipping market research, Msc.
Thesis,2005 ,Dalian, Dalian Maritime University, 19. Hu S W. Century dry bulk and oil market forecast, World Sea, 1997 (01) : 18 -19 20. Sun Y X., Model and analysis of the supply chain bullwhip effect , College Journal of
Shanghai University, 2000, 7 (3) : 278-282 21. Fu Y., Zheng S L., Bullwhip effect in supply chain , Journal of Management
Engineering , 2001, 82-83 22. Yang Y H, Li H T, (2004), Review and prospect of international dry bulk cargo
shipping market, World Shipping, vol 27. 23. LIU Yu-hai, TANG Xiao-wo, NI De-bing(2005), A Study on the Economic Mechanism
of the Bullwhip Effect in Supply Chain, Journal of UEST of China, Vol.34 No.1. 24. Forrester J.D. Industrial Dynamic . New York: MIT Press and Wiley &Sons, Inc.,
1961. 25. Sterman J D. Modeling managerial behavior: Misperceptions of feedback in a
dynamic decision making experiment, Management Science, 1989, 35: 321 —339 26. Sterman J D. The beer distribution game . In Heieke J, Meile L, eds. Games and
- 59 -
Exercises for Operations Management, New Jersey: Prentice Hall, 1995. 101 —112 27. Metters R. Quantify the bullwhip effect in the supply chains. Journal of Operations
Management, 1997, 15: 89—100 28. Taylor D H., Demand amplication: has it got us beat. International Journal of
Physical Distribution and Logistics Management,2000,30(6): 515-533
29. Lee H, Padmanabhan V, Whang S(1997), Information distortion in a supply
chain: The bullwhip effect, Management Science, 46(3):546-558. 30. Towill DR., Supply chain dynamics. International Journal of Computer Integrated
Manufacturing, 1991, 4(3): 197-208 31. Mosekilde E. and Larsen ER., Deterministic chaos in the beer production
distribution model. System Dynamics Review, 1988, 4(1-2): 131-147
32. Chen F ,Drezner Z ,Ryan J K ,et al (2000).Quantifying the bullwhip effect in a
simple supply chain: the impact of forecasting, lead times, and information, Management Science, 46(3):436-443.
33. Alwan L C, Liu J J, Yao D Q.(2003) Stochastic characterization of upstream demand processes in a supply chain.IIE Transaction,35(3):207-219.
34. Zhang L F,(2005),Research on the Factors of Global Dry Bulk Shipping Market, MSc Thesis, Shanghai, Shanghai Maritime University.
35. Kahn J. Inventory and the volatility of production. American Economic Review, 1987, 77(4): 667 —779
36. Xu K, Dong Y. Vendor Managed Inventory: Towards a Better Coordination of Information in a Supply Chain. ICM98-Shanghai, 1998
37. Graves S C. A single-item inventory model for a non stationary demand process. Manufacturing & Service Operation Management, 1999, (1): 50 —61
38. Naish H F. Production smoothing in the linear quadratic inventory model. Quarterly Journal of Economics, 1994, 125(4):864 —875
39. Manolis G. Kavussanos, Seasonality patterns in dry bulk shipping spot and time charter freight rates, Transportation Research Part E: Logistics and Transportation Review,Volume 37, Issue 6, December 2001, Pages 443–467
40. Wojciech W C (1981),An econometric model of world shipping and shipbuilding, Maritime Policy and Management 8:21-30
41. Evans J J (1994), An analysis of bulk shipping market 21:311-329. 42. Veenstra A W,Franses P H(1997), A co-integration approach to forecast freight rate
in the dry bulk shipping sector, Transport Research 31:6. 43. Gao J F,Wu Q,(1996), Time series’ ARMA model and its application, Journal of
Shanghai University Of Engineering Science. 44. Cheng J Y, Tong D Q,(1995), International Shipping Market ,Dalian, Dalian maritime
university Press. 45. Wang Y (1997).International maritime economics and market, Beijing, People
Transportation Press. 46. Wang R(2008), Economic analysis on Internet Dry Bulk Shipping, Msc Thesis,
Beijing, Beijing Transportation University. 47. Gong BG, Cheng Y M, (2002). The cause and weaken of bullwhip effect in the
supply chain management, Operations Research and Management Science. 48. Riddalls C E, Benefit S,(2002) Production inventory system controller design and
supply chain dynamic, International Journal of System Science. 49. Bollerslev, T (1986), generalized autoregressive conditional heteroskedasticity,
- 60 -
Journal of Econometrics 51. 50. Engle R F (1982), Autoregressive conditional heteroscedasticity with estimates of
the variance of United Kingdom inflation, Econometrics 50. 51. MaximumLikelihoodEstimation: http://people.bath.ac.uk/bm232/EC50162/ARCH.doc 52. ChengJ.Y. International Shipping Market, Dalian, Dalian Maritime University Press.
1995.P111-118
53. Andrew Lucey.Shipping Economics.2000(7).VoL22.P24
54. Kurt Salmon.Efficient Consumer Response:Enhancing Consumer Value in the
Grocery Industry.Journal of Marketing Research•Washington:1993.13
55. Fuller J B , O'Conor J , Rawlinson R. Tailored Logistics : The Next
Advantage.Harvard Business Review.1993(7):87~98
56. Manolis G.Kavussanos and Amir L.hlizadeh-M.Seasonality Patterns in Dry
BulkShipping Spot and Time Charter Freight Rates.Transportation Research Part
E.2001.P443-467
57. Cheng Q.H., 2004, Research on the globall dry bulk shipping market segment freight index fluctuation characteristics, Msc thesis, Dalian Maritime University.
58. SU Yan, YANG Zhen-hai,2007,GARCH( 1, 1) Model and Its Application in Forecasting Conditional Volatility of Exchange Rate, Application of Statistics and Management, Jul1, 2007,Vol126 No14.
59. .Michael Sabbatini, 1998 A GARCH model of the imp lied volatility of the Sw iss
market index from option prices.International journal of forecasting, 1998, 14: 199- 123.