quadratic functions copyright 2014 scott storla
TRANSCRIPT

Quadratic Functions
Copyright 2014 Scott Storla
Copyright 2014 Scott Storla
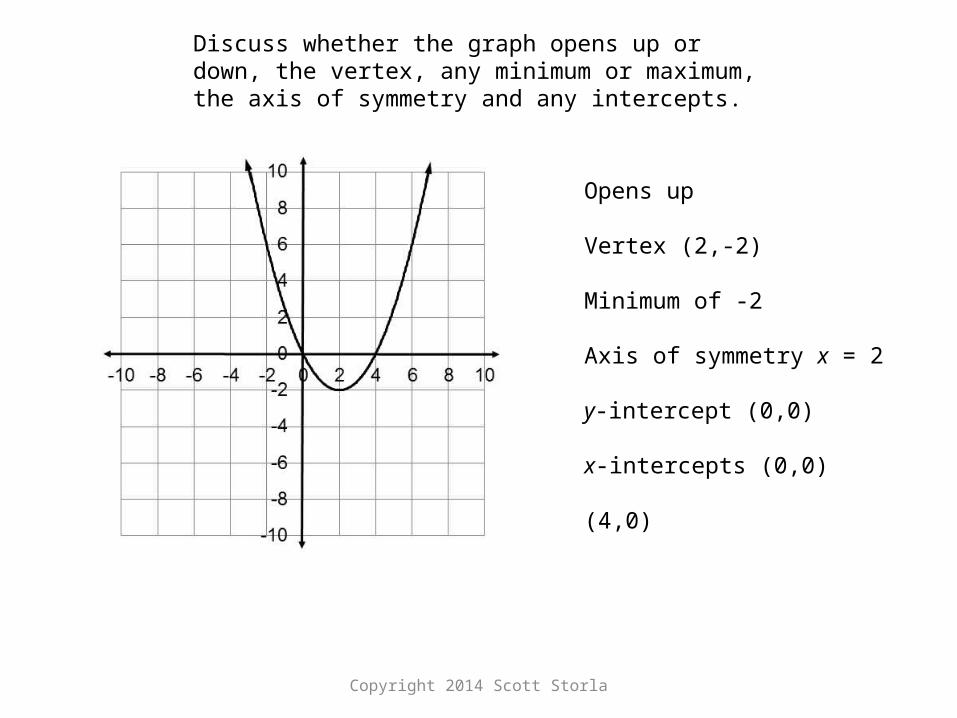
Discuss whether the graph opens up or down, the vertex, any minimum or maximum, the axis of symmetry and any intercepts.
Opens up
Vertex (2,-2)
Minimum of -2
Axis of symmetry x = 2
y-intercept (0,0)
x-intercepts (0,0) (4,0)

Copyright 2014 Scott Storla
Opens up
Vertex (-6,0)
Minimum of 0
Axis of symmetry x = -6
y-intercept (0,9)
x-intercept (-6,0)
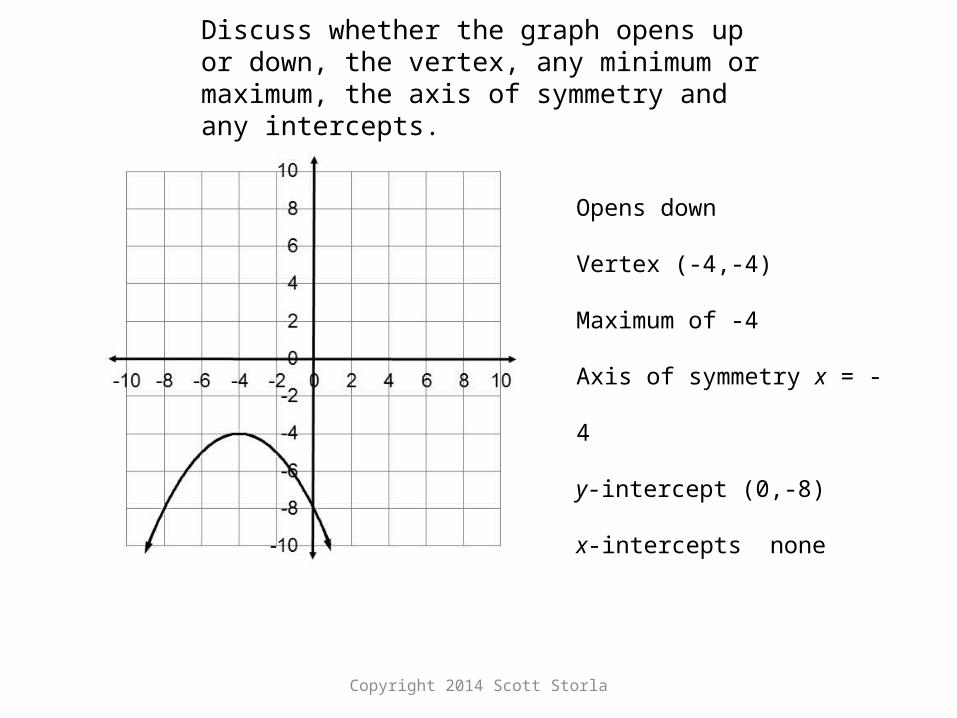
Discuss whether the graph opens up or down, the vertex, any minimum or maximum, the axis of symmetry and any intercepts.
Copyright 2014 Scott Storla
Opens down
Vertex (-4,-4)
Maximum of -4
Axis of symmetry x = -4
y-intercept (0,-8)
x-intercepts none
Discuss whether the graph opens up or down, the vertex, any minimum or maximum, the axis of symmetry and any intercepts.

Copyright 2014 Scott Storla
2 4 64 4 1 7 36b ac
8
42 1coorx
2 8 7Graph the function xy x
Opens up
y-intercept (0,7)
Vertex (4,-9)
Axis of symmetry x = 4
x-intercepts (1,0) (7,0)
Procedure Graphing a Quadratic Function – Standard Form
1) Write the function in the form 2y ax bx c
2) Decide if the graph opens up 0a or opens down 0a .
3) Substitute 0 for x and simplify to find the y-intercept.
4) Find the x-coordinate of the vertex using 2
b
a
. Then
substitute to find the y-coordinate.
5) Find the axis of symmetry using 2
bx
a
6) If the discriminant shows x-intercepts exist, find them.
24 8 4 7
16 32 7
9
coory
8 36
2 1
8 6
2 2
1 7 or
x
x
x x

Copyright 2014 Scott Storla
2 4 64 4 1 7 36b ac
21 2 1 8
1 2 8
9
coory
2
12 1coorx
2 2 8Graph the function y x x
Opens down
y-intercept (0,8)
Vertex (-1,9)
Axis of symmetry x = -1
x-intercepts (-4,0) (2,0)
Procedure Graphing a Quadratic Function – Standard Form
1) Write the function in the form 2y ax bx c
2) Decide if the graph opens up 0a or opens down 0a .
3) Substitute 0 for x and simplify to find the y-intercept.
4) Find the x-coordinate of the vertex using 2
b
a
. Then
substitute to find the y-coordinate.
5) Find the axis of symmetry using 2
bx
a
6) If the discriminant shows x-intercepts exist, find them.
2 36
2 1
2 6
2 2
4 2 or
x
x
x x

Copyright 2014 Scott Storla
2 4 144 4 2 14 32
12 32
2 2
12 4 2
4 4
3 2 3 2 or
b ac
x
x
x x
2
123
2 2
2 3 12 3 14
18 36 14
4
coor
coor
x
y
22 12 14Graph the function y x x
Opens up
y-intercept (0,14)
Vertex (-3,-4)
Axis of symmetry x = -3
x-intercepts (-4.4,0) (-1.6,0)
Procedure Graphing a Quadratic Function – Standard Form
1) Write the function in the form 2y ax bx c
2) Decide if the graph opens up 0a or opens down 0a .
3) Substitute 0 for x and simplify to find the y-intercept.
4) Find the x-coordinate of the vertex using 2
b
a
. Then
substitute to find the y-coordinate.
5) Find the axis of symmetry using 2
bx
a
6) If the discriminant shows x-intercepts exist, find them.
y
-20
-15
-10
-5
0
5
10
15
20
-10 -8 -6 -4 -2 0 2 4 6 8 10x
Copyright 2014 Scott Storla
2 4 324 4 3 25 24
18 24
2 3
18 2 6
6 6
6 63 33 3 or
b ac
x
x
x x
2
183
2 3
3 3 18 3 25
27 54 25
2
coor
coor
x
y
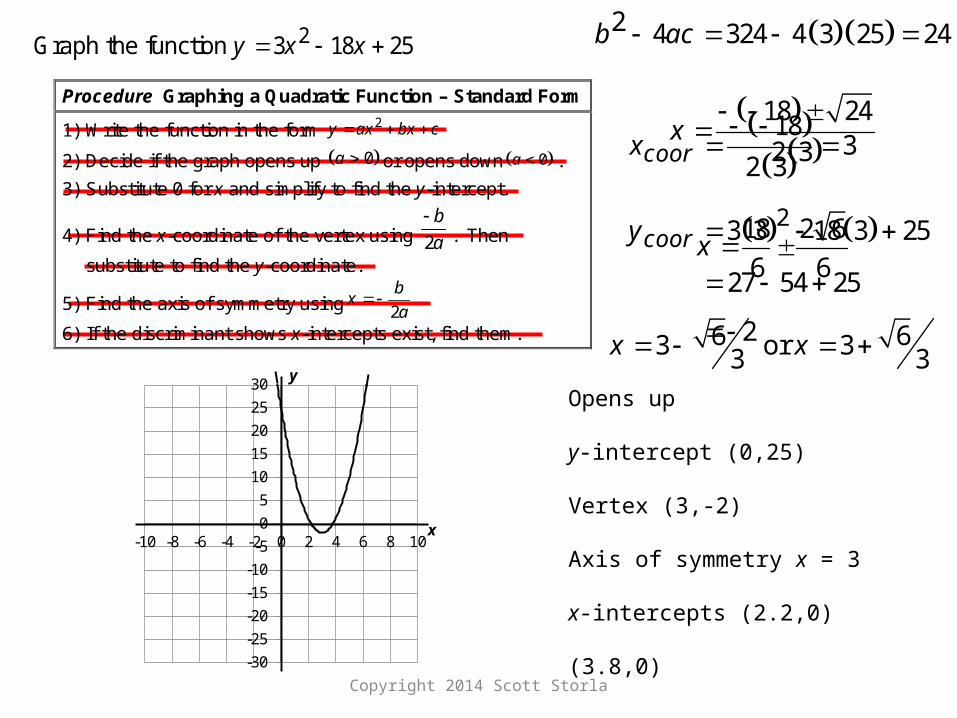
23 18 25Graph the function y x x
Opens up
y-intercept (0,25)
Vertex (3,-2)
Axis of symmetry x = 3
x-intercepts (2.2,0) (3.8,0)
Procedure Graphing a Quadratic Function – Standard Form
1) Write the function in the form 2y ax bx c
2) Decide if the graph opens up 0a or opens down 0a .
3) Substitute 0 for x and simplify to find the y-intercept.
4) Find the x-coordinate of the vertex using 2
b
a
. Then
substitute to find the y-coordinate.
5) Find the axis of symmetry using 2
bx
a
6) If the discriminant shows x-intercepts exist, find them.
-30
-25
-20
-15
-10
-5
0
5
10
15
20
25
30
-10 -8 -6 -4 -2 0 2 4 6 8 10x
y

Copyright 2014 Scott Storla
21/ 2 4 1/ 2 1/ 2 2 3 / 2g
20 4 0 0 2 2g
2Given 4 2 find g 0 and 1/ 2g p p p g

Copyright 2014 Scott Storla
2
2
2
3 4 2
0 4 5
0 4 4 5 5
0 4 5 1
51 or
4
p p
p p
p p p
p p
p p
2Given 4 2 find if 3 g p p p p g p
21 1 4 4 5
2 4
1 1 80
8
1 9
8
10 8 or
8 8
51 or
4
p
p
p
p p
p p

Copyright 2014 Scott Storla
The function 20.017 0.78 21.1R t t t predicts the millions of tons of paper and paperboard recovered for reuse using the year since 1980.
Discuss the meaning of R(0) both in English and Algebraically.
Discuss the meaning of R(t) = 43.5 both in English and Algebraically.
Translate, “Find the amount recovered in 1997” into functional notation and use the function to answer the question.
Translate, “In what year does the amount recovered first reach 50 million tons?” into functional notation and use the function to answer the question.
Copyright 2014 Scott Storla
The function 20.1 4.3 16.8C t t t predicts the number of cable subscribers in the United States (in millions) given the year since 1980.
What does the coefficient –0.1 imply about future growth?
Find the year the number of subscribers will peak.
Find how many subscribers there will be during the peak year.
Graph the function. (Make sure you label and scale your axes.)
Predict when the number of subscribers will again reach the 1995 level.

Copyright 2014 Scott Storla
The number of farms in the United States between 1975 and 2009 (in thousands) can be modeled using the function
2( ) 0.6 32 2544tF t t .
What does the coefficient imply.
Find the vertex and discuss the meaning of both coordinates.
Ask, "When will there be 2,000,000 farms?" using functional notation and use the function to answer the question.
Find F(37) and discuss its meaning.
Find the number of farms 20 years after there were 2,400,000 farms.