quadrennial energy review: scope, goals, vision, … · quadrennial energy review: scope, goals,...
TRANSCRIPT
Quadrennial Energy Review: Scope, Goals, Vision, Approach,
Outreach
March 12, 2014
Energy Policy and Systems Analysis

Energy Policy and Systems Analysis
Why A QER? Why TS&D?

Draft / Pre-Decisional / Not for Distribution 3
PM on the Quadrennial Energy Review
“Affordable, clean, and secure energy and energy services are essential for improving U.S. economic productivity, enhancing our quality of life, protecting our environment, and ensuring our Nation's security. Achieving these goals requires a comprehensive and integrated energy strategy resulting from interagency dialogue and active engagement of external stakeholders. To help the Federal Government better meet this responsibility, I am directing the undertaking of a Quadrennial Energy Review.”
President Barack Obama January 9, 2014

Integrated view of the short-, intermediate-, and long-term objectives for Federal energy policy (economic, environmental, and security priorities); Outline of legislative proposals to Congress; Executive actions (programmatic, regulatory, fiscal, etc.) coordinated across multiple agencies; Resource requirements for RD&D and incentive programs; and
Strong analytical base for decision-making.
Draft / Pre-Decisional / Not for Distribution 4
PCAST Recommendations for QER

Draft / Pre-Decisional / Not for Distribution 5
Why Focus on Infrastructure?
Periods of sustained American economic advancement have been supported by enabling
infrastructures –canals, railroads, dams/irrigation, highways Energy infrastructures play essential roles in American prosperity,
creating competitive advantage via low cost supplies and feedstocks
The longevity and high costs of energy infrastructure mean that decisions made today will strongly influence our energy mix for much of the 21st century
Vulnerabilities are increasing. A modernized, robust, resilient infrastructure is in the public interest
Transforming and modernizing energy infrastructure faces
significant challenges, warrants federal policy

Supply Chains?
Year 4?
Draft / Pre-Decisional / Not for Distribution
6
QER is a 4 year Roadmap: Year One Will Focus on TS&D Infrastructure
TS&D networks help deliver electricity, transportation fuels, and heat to industry and 300 million consumers every day and provide feedstocks for a large range of products
TRANSMISSION, STORAGE &DISTRIBUTION
The initial QER exercise will focus on TS&D -- infrastructure that links energy supplies, carriers, or by-products to intermediate
and end users, or waste disposal sites
These infrastructures tend to set supply and end use patterns, policies, investments and practices in place for decades
Year 1 TS&D
Year 2 Supply/ Demand Infrastructure?
Energy Policy and Systems Analysis
TS&D Systems have Limitations, Face Growing Vulnerabilities

Illustrative Early Highlights
TRANSMISSION, STORAGE & DISTRIBUTION INFRASTRUCTURE:
Links energy supplies, carriers, or by-products to intermediate and end users, or waste
disposal sites
Draft / Pre-Decisional / Not for Distribution 8
Elec
tric
ity
High-voltage transmission lines
and substations Distribution lines
All electric grid-related
infrastructure, ancillary services, “smart-grid” and
metering technologies
Distributed generation
technologies Transformer supply
chain Electricity storage
Vehicle fueling
Nat
ural
Gas
Natural gas gathering lines
(production-stage or processing-stage)
Interstate pipelines Natural gas storage
facilities Processing facilities
(including processing at production sites)
Local distribution systems
LNG production/storage facilities (including
export terminals) Vehicle fueling
LPG distribution
Oil/
Petr
oleu
m P
rodu
cts Crude oil pipelines
Crude oil and products import and export terminals
Truck and rail systems that transport crude oil from production sites to ports of
refineries Oil refineries
Oil and fuel storage facilities Strategic Petroleum Reserve
Rail, truck ,barge, pipelines systems to transport refined product to consumers
Fuel terminals and vehicle fueling stations
Coal
tran
spor
t Rail, truck, barge
transport
Export terminals
Nuc
lear
Uranium Processing
Facilities Road/Ship/Rail
Transport of Fuel
Biom
ass Transport of Raw Feedstock
Feedstock Processing Derived Product Transport
Derived Product Distribution
Biof
uel
Vehicle fueling
Proposed TS&D Systems to Cover
Sola
r Grid Interconnection
Distributed technologies
Carb
on
diox
ide Pipelines
Compressors
Storage facilities W
ind
Grid Interconnection
Illustrative Early Highlights
Draft / Pre-Decisional / Not for Distribution 9
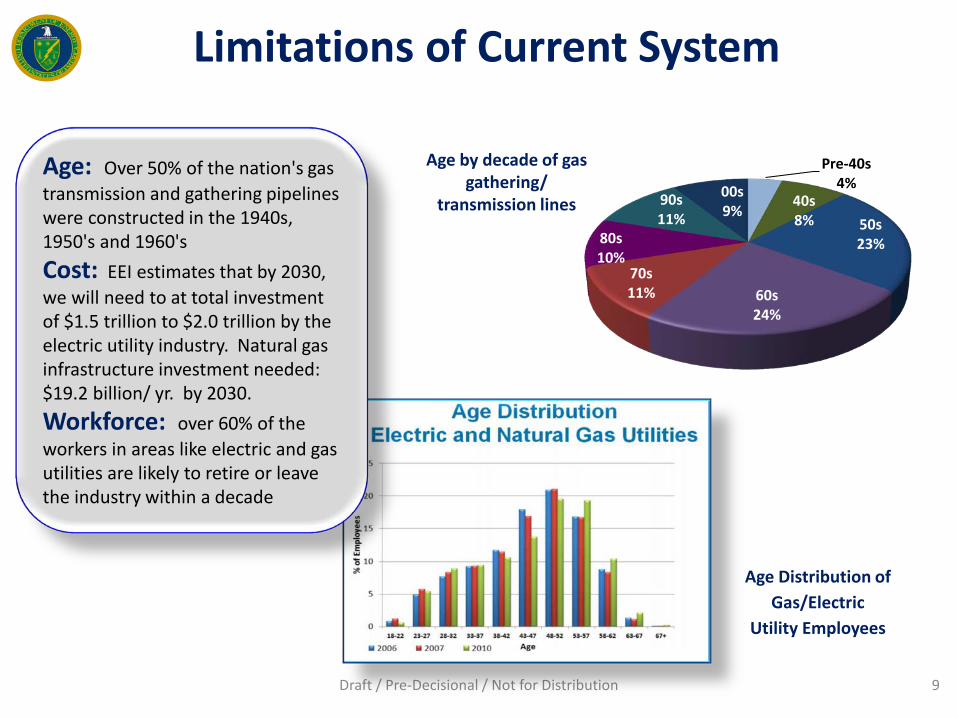
Age: Over 50% of the nation's gas transmission and gathering pipelines were constructed in the 1940s, 1950's and 1960's Cost: EEI estimates that by 2030, we will need to at total investment of $1.5 trillion to $2.0 trillion by the electric utility industry. Natural gas infrastructure investment needed: $19.2 billion/ yr. by 2030. Workforce: over 60% of the workers in areas like electric and gas utilities are likely to retire or leave the industry within a decade
Age Distribution of Gas/Electric
Utility Employees
Pre-40s 4%
40s 8% 50s
23%
60s 24%
70s 11%
80s 10%
90s 11%
00s 9%
Age by decade of gas gathering/
transmission lines
Limitations of Current System

Illustrative Early Highlights
Draft / Pre-Decisional / Not for Distribution 10
Short and Long-Term Vulnerabilities Are Growing
Climate Change: weather related power outages have increased from 5-20 each year in the mid-1990s to 50-100 per year in the last five years.
Cyber-security: 53% of all cyber-attacks from October 2012 to May 2013 were on energy installations.
Physical Threats: There were three highly visible attacks on grid infrastructure in 2013. Supply chains for key components of grid infrastructure are not robust. Supply/demand Shifts: The lack of pipeline infrastructures for associated gas in the Bakken has resulted in large-scale flaring of this gas, in amount sufficient to be seen from space.
Interdependencies: The interdependencies of the electric and fuel infrastructures seen in Superstorm Sandy greatly complicated the response and recovery.

Illustrative Early Highlights
Recent Events Illustrate U.S. Energy Sector Vulnerability to Climatic Conditions
Cooling water intake or discharge too hot: Shutdown and reduced generation from power plants
Water restrictions due to drought: Limiting shale gas and power production
Wildfires: Damaged transmission lines
Lower water levels: Reduced hydropower
Lower river levels: Restricted barge transportation of coal and petroleum products
Intense storms: Disrupted power generation and oil and gas operations
Flooding: Impacts on inland power plants
11 Draft / Pre-Decisional / Not for Distribution

Illustrative Early Highlights
Regional Differences in New Generation Capacity
Sources: EEI, Historical Statistics of the Electric Utility Industry, EIA Electric Power Annual, Consumer price index, Bureau of Labor Statistics.
12
In 2012, natural gas was the most common fuel source for expanding generation capacity under construction.
Southwestern states saw the majority of solar expansion, while wind development occurred in SPP/Midwest/NY/Northeast.
Recent nuclear developments have occurred exclusively in the Southeast.
The average new generation unit size was much larger in Southeast than in other regions of the country.
solar natural gas wind nuclear

Alternative Fuel Stations: Significant Regional Variation
E85 Stations
EV Charging Stations
Biodiesel Stations
Note low numbers: highest is 47 stations in California
13

Energy Policy and Systems Analysis
National Goals, Desirable Characteristics for Infrastructures
in 2030

Illustrative Early Highlights
Draft / Pre-Decisional / Not for Distribution 15
National Energy Goals
Economic Competitiveness: Energy infrastructure should enable the nation to, under a level playing field and fair and transparent market conditions, produce goods and services which meet the test of international markets while simultaneously maintaining and expanding jobs and the real incomes of the American people over the longer term. Energy infrastructures should enable new architectures to stimulate energy efficiency, new economic transaction, and new consumer services.
Environmental Responsibility: Energy infrastructure systems should take into consideration a full accounting (on a life-cycle basis) of environmental costs and benefits in order to minimize their environmental footprint.
Energy Security: Energy Infrastructure should be minimally vulnerable to the majority of disruptions in supply and mitigate impacts, including economic impacts, of disruptions by recovering quickly or with use of reserve stocks. Energy security should support overall national security.

16
Desirable Characteristics, 2030
Affordability. Ensures system costs and needs are balanced with the ability of users to pay. (Note three potential balancing points: overall system costs, system needs/benefits, and system cost allocation). Also, estimating avoided costs can be more complex than for simple levelized costs – calculations require tools to simulate the operation of the power system with and without any project under consideration.
A minimal-environmental footprint. Energy systems should be designed, constructed, operated and decommissioned in a manner that is low carbon, and with minimal impact to water quality and quantity; and minimize the land use footprint, impact on biological resources, and toxic emissions.
Robustness. A robust energy system will continue to perform its functions under diverse policies and market conditions, and has its operations only marginally affected by external or internal events. Sub
characteristics of robustness include: Reliability. Sturdy and dependable, not prone to breakdowns from internal causes (e.g. due to component failures);
Resiliency. The ability to withstand small to moderate disturbances without loss of service, to maintain minimum service during severe disturbances, and to quickly return to normal service after a disturbance.
Flexibility. Energy infrastructure that accommodates change in response to new and/or unexpected internal or external system drivers. Sub-characteristics of
flexibility included: Extensibility. The ability to extend into new capabilities, beyond those required when the system first becomes operational. Interoperability. The ability to interact and connect with a wide variety of systems and sub-systems both in and outside of the energy sector. Optionality. Provides infrastructures or features of infrastructures that would allow users to maximize value under future unforeseen circumstances.
Scalability. Energy infrastructure should be able to be sized to meet a range of demand levels. Systems can be scalable by being replicable, modular, and/or enlargeable.
QER: Will provide four year planning horizon to enable
these energy infrastructure
characteristics in 2030.
Energy Policy and Systems Analysis
Analytical Approach
Alt 1
Alt 2
Alt 3
Alt 4
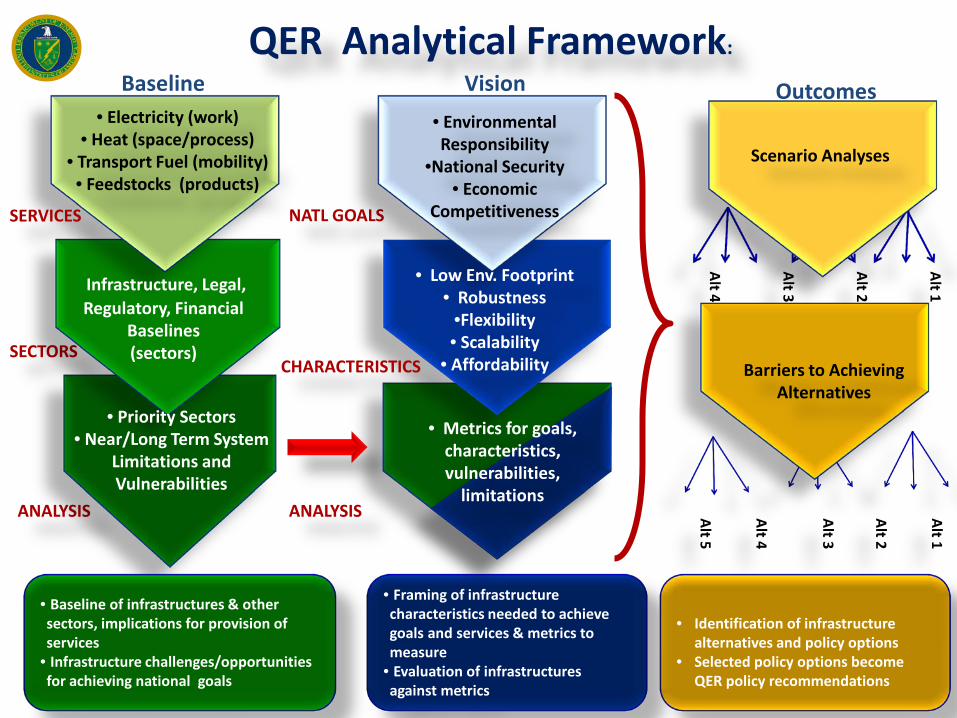
QER Analytical Framework:
NATL GOALS
Alt 1
Alt 2
Alt 3
Alt 4
Alt 5
ANALYSIS
CHARACTERISTICS
SECTORS
ANALYSIS
• Electricity (work) • Heat (space/process)
• Transport Fuel (mobility) • Feedstocks (products)
Infrastructure, Legal, Regulatory, Financial
Baselines (sectors)
• Priority Sectors • Near/Long Term System
Limitations and Vulnerabilities
SERVICES
• Environmental Responsibility
•National Security • Economic
Competitiveness
• Low Env. Footprint • Robustness
•Flexibility • Scalability
• Affordability
Scenario Analyses
Barriers to Achieving Alternatives
• Baseline of infrastructures & other sectors, implications for provision of services
• Infrastructure challenges/opportunities for achieving national goals
• Framing of infrastructure characteristics needed to achieve goals and services & metrics to measure
• Evaluation of infrastructures against metrics
• Identification of infrastructure
alternatives and policy options • Selected policy options become
QER policy recommendations
Baseline Vision Outcomes
• Metrics for goals, characteristics, vulnerabilities,
limitations

Analyses of infrastructure in each sector to achieve the high-level economic, environmental, reliability, and resilience goals
A range of economic scenarios Annual Energy Outlook (AEO) 2014 reference case Greater degrees of economic challenge (e.g., low GDP growth and high world energy prices) Higher productivity growth (e.g., high GDP growth coupled with stable or declining energy
demand).
A range of technology scenarios Greater direct consumer control of energy systems through rooftop PV, smart grid
technology, and other forms of consumer-directed demand management. Low-cost deployment of renewable energy technologies, Low cost of maintaining existing and building new nuclear power plants (e.g., small modular
reactors). Low-cost natural gas that allows higher utilization in electricity generation, transport,
chemicals, and export, including carbon capture and storage (CCS), as needed Widespread economic deployment of CCS for coal and natural gas .
Draft / Pre-Decisional / Not for Distribution 19
Analysis/Candidate Scenarios
Energy Policy and Systems Analysis
Outreach and Schedule
Draft / Pre-Decisional / Not for Distribution 21
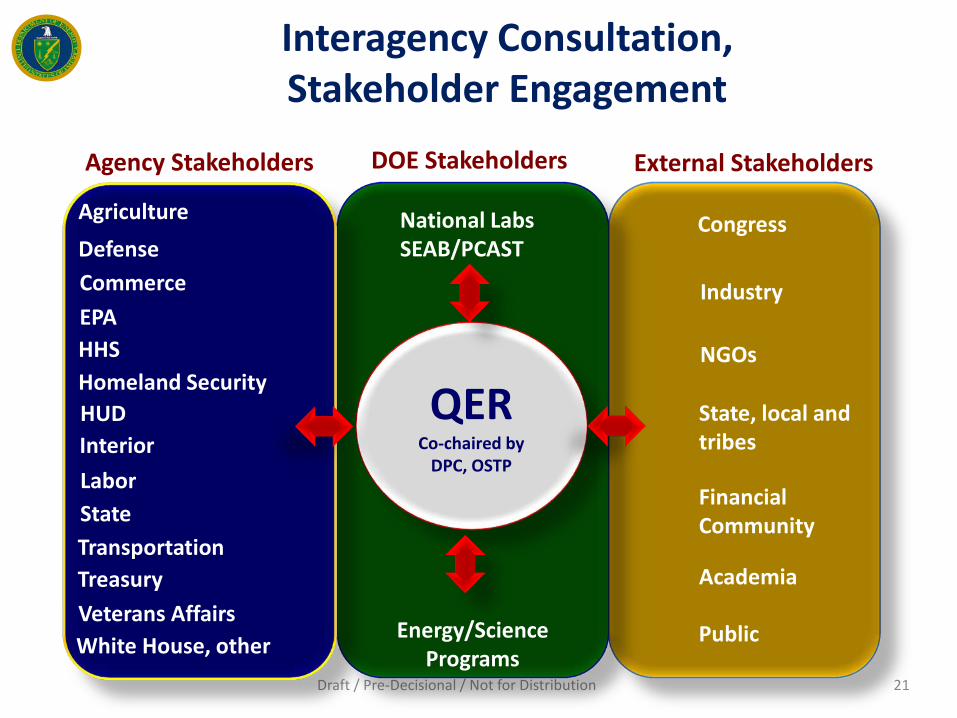
Interagency Consultation, Stakeholder Engagement
DOE Stakeholders Agency Stakeholders
Energy/Science Programs
National Labs SEAB/PCAST
External Stakeholders
Congress
Industry
NGOs
State, local and tribes
Financial Community
Public
Academia
Defense Agriculture
EPA
HUD Interior Labor
Homeland Security
Transportation
Commerce
HHS
State
Treasury Veterans Affairs White House, other
QER Co-chaired by
DPC, OSTP
Draft / Pre-Decisional / Not for Distribution
22
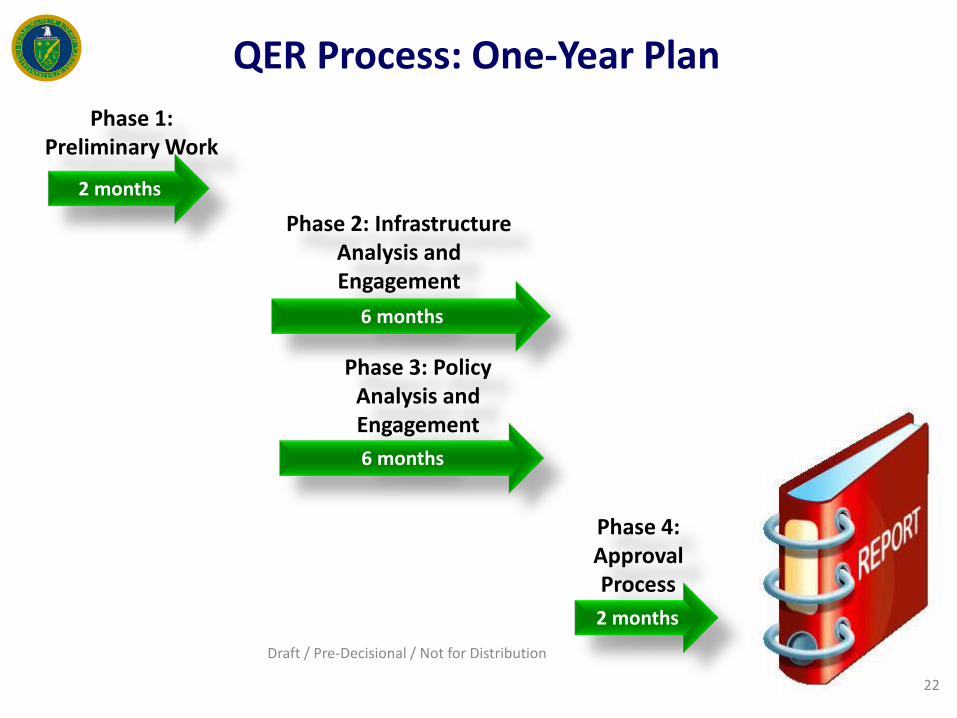
Phase 1: Preliminary Work
Phase 2: Infrastructure Analysis and Engagement
Phase 3: Policy Analysis and Engagement
Phase 4: Approval Process
2 months
6 months
6 months
2 months
QER Process: One-Year Plan