quaker chemical corporation investor presentation · investor presentation ... looking statements...
TRANSCRIPT

1
July 2018
Investor Presentation
Quaker Chemical Corporation
Risks And Uncertainties Statement
2
Regulation G
The attached charts include Company information that does not conform to generally accepted accounting principles (“GAAP”).
Management believes that an analysis of this data is meaningful to investors because it provides insight with respect to ongoing operating
results of the Company and allows investors to better evaluate the financial results of the Company. These measures should not be
viewed as an alternative to GAAP measures of performance. Furthermore, these measures may not be consistent with similar measures
provided by other companies. This data should be read in conjunction with the Company’s fourth quarter and full year earnings news
release dated February 28, 2018, which has been furnished to the Securities and Exchange Commission (“SEC”) on Form 8-K and the
Company’s Form 10-K for the year ended December 31, 2017, which has been filed with the SEC.
Forward-Looking Statements
This presentation contains "forward-looking statements" within the meaning of Section 27A of the Securities Act of 1933 and Section 21E
of the Securities Exchange Act of 1934. These forward-looking statements are subject to certain risks and uncertainties that could cause
actual results to differ materially from those projected in such statements. A major risk is that demand for the Company's products and
services is largely derived from the demand for its customers' products, which subjects the Company to uncertainties related to downturns
in a customer's business and unanticipated customer production shutdowns. Other major risks and uncertainties include, but are not
limited to, significant increases in raw material costs, customer financial stability, worldwide economic and political conditions, foreign
currency fluctuations, significant changes in applicable tax rates and regulations, future terrorist attacks and other acts of violence. Other
factors, including those related to the previously announced pending Houghton combination (“the Combination”), could also adversely
affect us including, but not limited to:
• the risk that a required regulatory approval will not be obtained or is subject to conditions that are not anticipated or acceptable
to us;
• the potential that regulatory authorities may require that we make divestitures in connection with the Combination of a greater
amount than we anticipated, which would result in a smaller than anticipated combined business;
• the risk that a closing condition to the Combination may not be satisfied in a timely manner;
• risks associated with the financing of the Combination;
• the occurrence of any event, change or other circumstance that could give rise to the termination of the share purchase
agreement;
• potential adverse effects on Quaker Chemical’s business, properties or operations caused by the implementation of the
Combination;
• Quaker Chemical’s ability to promptly, efficiently and effectively integrate the operations of Houghton and Quaker Chemical;
• risks related to each company’s distraction from ongoing business operations due to the Combination; and,
• the outcome of any legal proceedings that may be instituted against the companies related to the Combination.
Therefore, we caution you not to place undue reliance on our forward-looking statements. For more information regarding these risks and
uncertainties as well as certain additional risks that we face, you should refer to the Risk Factors detailed in Item 1A of our Form 10-K for
the year ended December 31, 2017 as well as the proxy statement the Company filed on July 31, 2017 and in our quarterly and other
reports filed from time to time with the SEC. We do not intend to, and we disclaim any duty or obligation to, update or revise any forward-
looking statements to reflect new information or future events or for any other reason. This discussion is provided as permitted by the
Private Securities Litigation Reform Act of 1995.

Quaker
Quaker Financial Review
Houghton + Quaker = A Compelling Combination
Houghton and Quaker Financial Review
Appendix
3
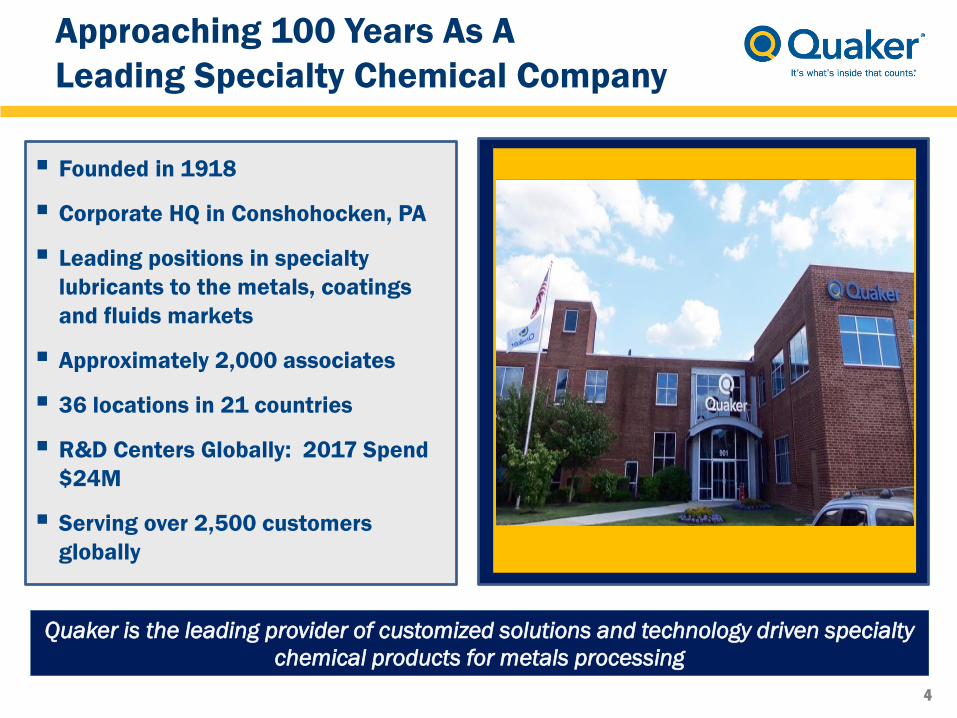
Approaching 100 Years As A
Leading Specialty Chemical Company
Quaker is the leading provider of customized solutions and technology driven specialty
chemical products for metals processing
▪ Founded in 1918
▪ Corporate HQ in Conshohocken, PA
▪ Leading positions in specialty
lubricants to the metals, coatings
and fluids markets
▪ Approximately 2,000 associates
▪ 36 locations in 21 countries
▪ R&D Centers Globally: 2017 Spend
$24M
▪ Serving over 2,500 customers
globally
4
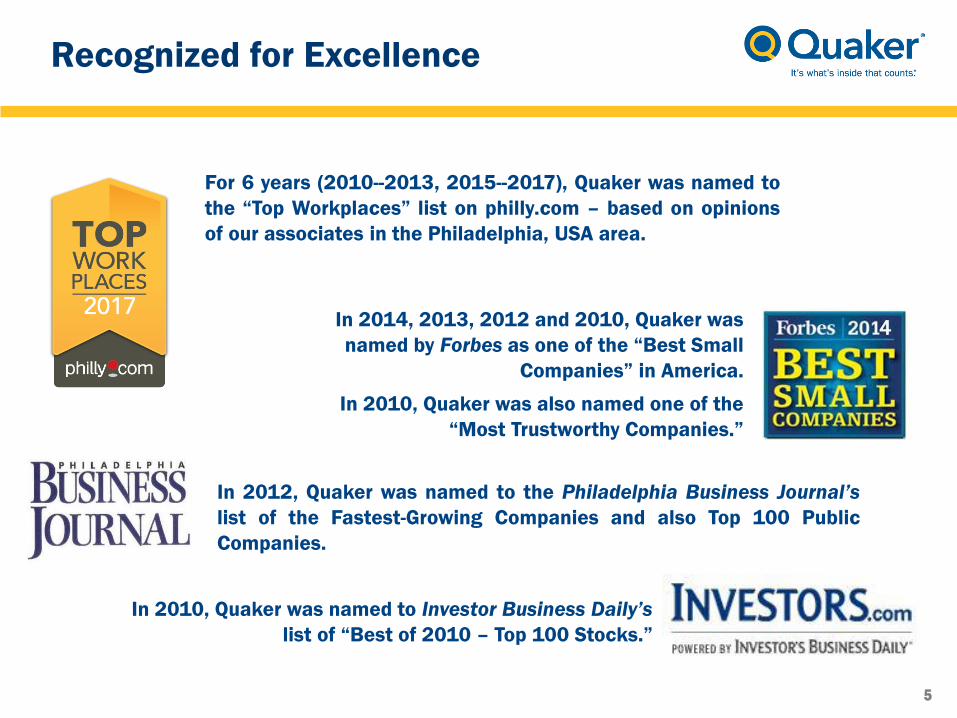
Recognized for Excellence
For 6 years (2010--2013, 2015--2017), Quaker was named to
the “Top Workplaces” list on philly.com – based on opinions
of our associates in the Philadelphia, USA area.
In 2014, 2013, 2012 and 2010, Quaker was
named by Forbes as one of the “Best Small
Companies” in America.
In 2010, Quaker was also named one of the
“Most Trustworthy Companies.”
In 2010, Quaker was named to Investor Business Daily’s
list of “Best of 2010 – Top 100 Stocks.”
In 2012, Quaker was named to the Philadelphia Business Journal’s
list of the Fastest-Growing Companies and also Top 100 Public
Companies.
5

Proud of Our Accomplishments
Net Sales
Adjusted EBITDA
$44
$67$73
$81$90
$100 $102$107
$115
$20
$45
$70
$95
$120
2009 2010 2011 2012 2013 2014 2015 2016 2017
Financials at a Glance
▪ 2017 Record Sales: $820M
▪ 2017 Record Non-GAAP Diluted EPS: $5.01
▪ 2017 Record Adjusted EBITDA: $115M
▪ 2009-2017 Adjusted EBITDA CAGR: 12.7%
▪ Current Market Cap: Approx. $2.1B
▪ Dividend Consistency: 46 Years (increased
42 years)
6
$451
$544
$683$708 $729
$766$738 $747
$820
$300
$450
$600
$750
$900
2009 2010 2011 2012 2013 2014 2015 2016 2017
$76

Leadership with Deep Industry Experience
Michael
Barry
Joseph
Berquist
Dieter
Laininger
Wilbert
Platzer
Chairman, President &
Chief Executive Officer
Vice President &
Managing Director –
North America
Vice President &
Managing Director –
Asia/Pacific and South America
& Global Leader – Primary Metals
60
46
54
1998
(19 years)
1997
(21 years)
1991
(27 years)
Senior Vice President and Managing
Director – North America
Vice President and Chief Financial Officer
Senior Director, North America
Commercial
Industry Business Director –
Metalworking/Fluid Power
Industry Business Manager for Steel
and Metalworking – EMEA
Vice President – Global
Operations, EHS and
Procurement
561995
(23 years)
Vice President and Managing Director
– EMEA
Vice President – Global Industrial
Metalworking
Vice President – Worldwide Operations
Adrian
Steeples
Vice President &
Managing Director -
EMEA
572010
(8 years)
Mary
Dean Hall61
2015
(2 years)
Vice President,
Chief Financial Officer &
Treasurer
20 Years in Senior Financial
Roles with Eastman Chemical and
Over 10 Years in Senior Banking Roles
TitleYear
Joined QuakerAge
Previous
Employers / Roles
Vice President and Managing Director
– Asia/Pacific
20 Years experience with various
managing roles at BP / Castrol
7
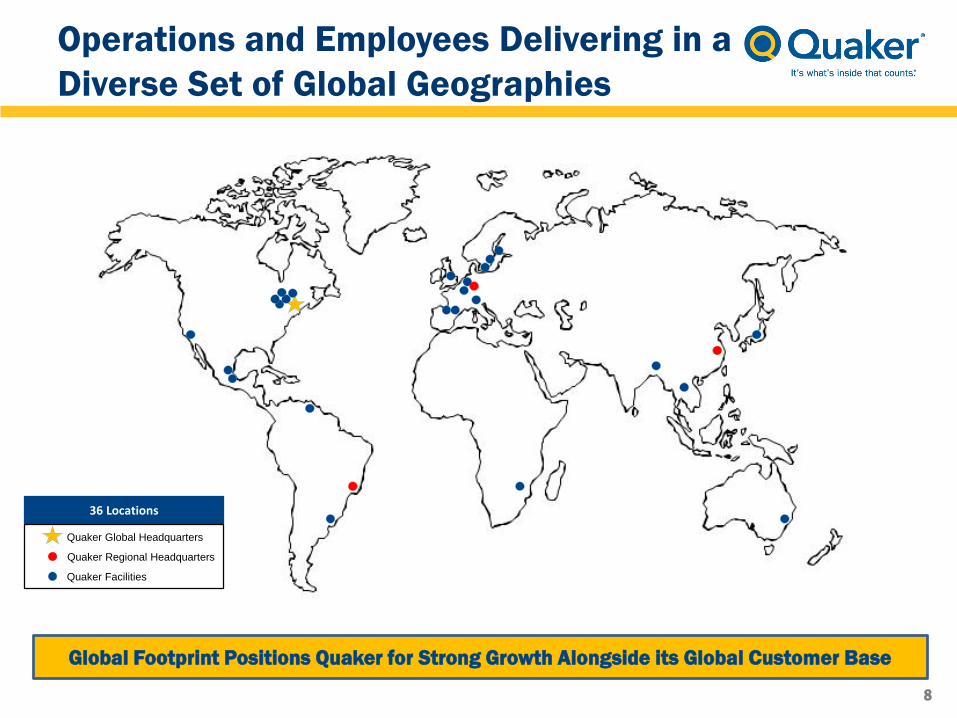
Operations and Employees Delivering in a
Diverse Set of Global Geographies
Global Footprint Positions Quaker for Strong Growth Alongside its Global Customer Base
36 Locations
Quaker Facilities
Quaker Global Headquarters
Quaker Regional Headquarters
8
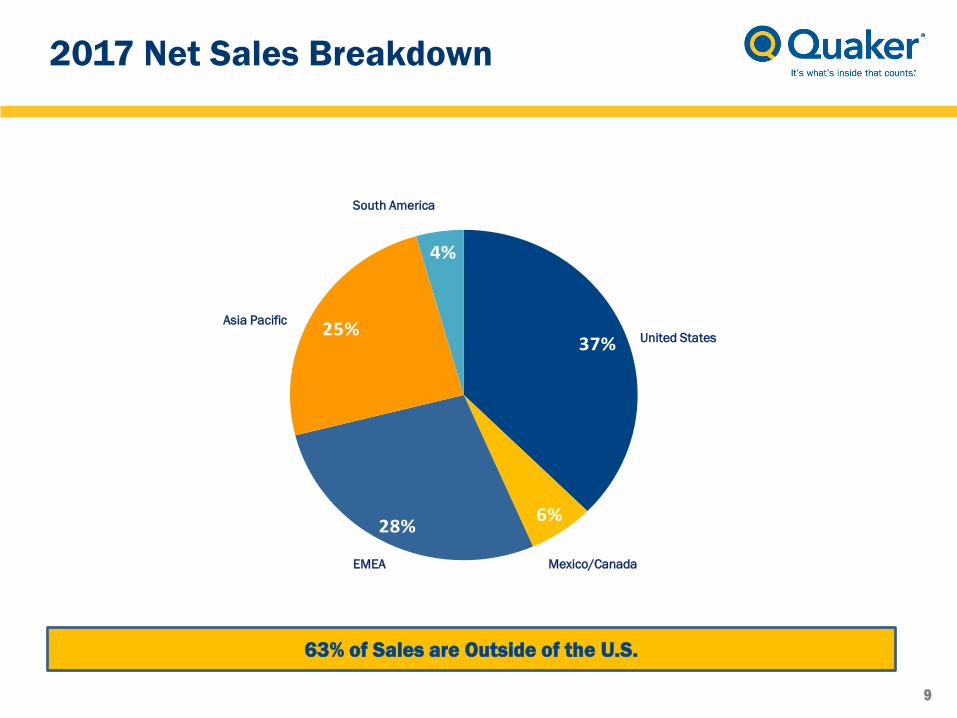
37%
6%28%
25%
4%
United States
EMEA
South America
Asia Pacific
Mexico/Canada
63% of Sales are Outside of the U.S.
2017 Net Sales Breakdown
9

Strong Market Positions and
Focused Business Portfolio
Primary Metals Metalworking Coatings
Leveraging Industry Leadership and Acquisitions Across Several Business Lines
51% 41%% 2017 Revenue
108%

Positioned as a Market Leader
Primary Metals
✓No. 1 supplier to sheet mills worldwide
✓Rolling oils, cleaners, corrosion preventives, fire resistant hydraulic fluids
✓Market leader in cold rolled steel technology
Key Competitors:
11

Large Market Opportunity
Metalworking
✓Metal forming, grinding, machining, can lubricants
✓One of several leaders in $5 billion+ market
✓Auto and Tube & Pipe focus
✓Opportunity for market consolidation
Key Competitors:
12

Diverse Sets of Market Opportunities
Coatings
✓Leader in chemical milling maskants to aerospace industry
✓Strong niche positions in marine, concrete and other metal coatings
13

Products and related technical services are highly effective at lowering customers’
“total cost of ownership” and improving their overall end product quality at a low incremental cost
Technically Advanced, Customized Solutions
Rolling LubricantsMachining and
Grinding Compounds
Corrosion Protection
and Metal Finishing
Tube and Pipe CoatingsSpecialty Hydraulic
Fluids and GreasesMining Products
14

Determine Customer Need
Identify Solution
Implement Solution
Ongoing Support
“Customer Intimacy”
Key Tenet of Quaker Business Model
Customized
Solutions
Technically
Advanced
Products
Quaker
Customers
▪Technical support and service
▪Ensuring solution effectiveness
▪Continuous improvement programs
Ongoing Support
▪Longstanding, strong relationships
▪Process and application knowledge
Determine
Customer Need
▪Formulation expertise
▪Existing set of solutions
▪Product development
Identify Solution▪Process and application knowledge
▪Technical support and service
▪ Implementation assistance
Implement Solution
15
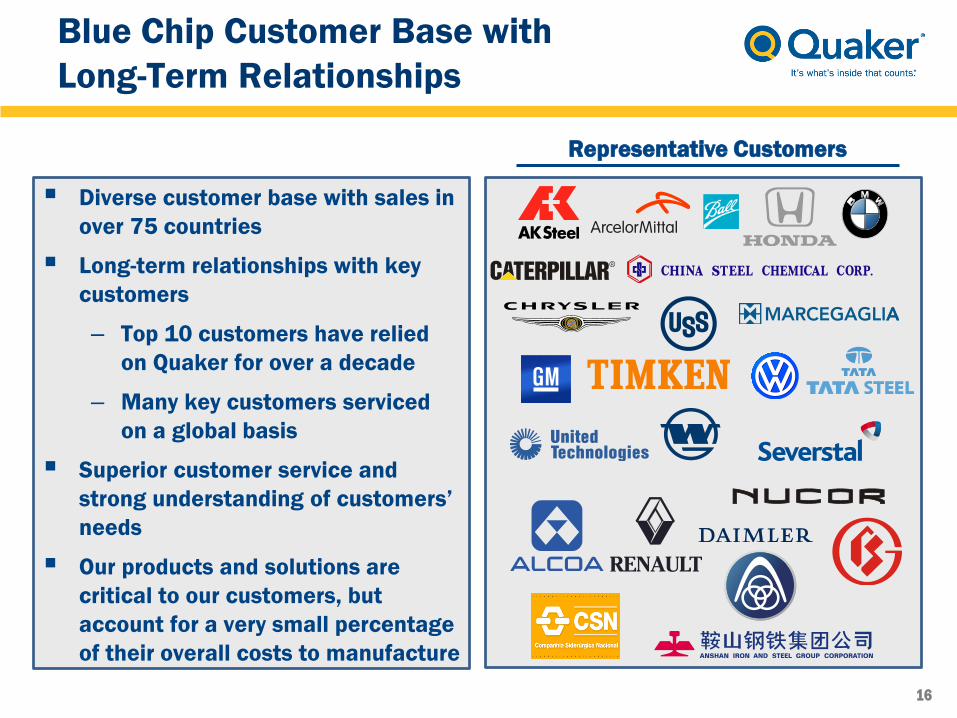
▪ Diverse customer base with sales in
over 75 countries
▪ Long-term relationships with key
customers
– Top 10 customers have relied
on Quaker for over a decade
– Many key customers serviced
on a global basis
▪ Superior customer service and
strong understanding of customers’
needs
▪ Our products and solutions are
critical to our customers, but
account for a very small percentage
of their overall costs to manufacture
Representative Customers
Blue Chip Customer Base with
Long-Term Relationships
16
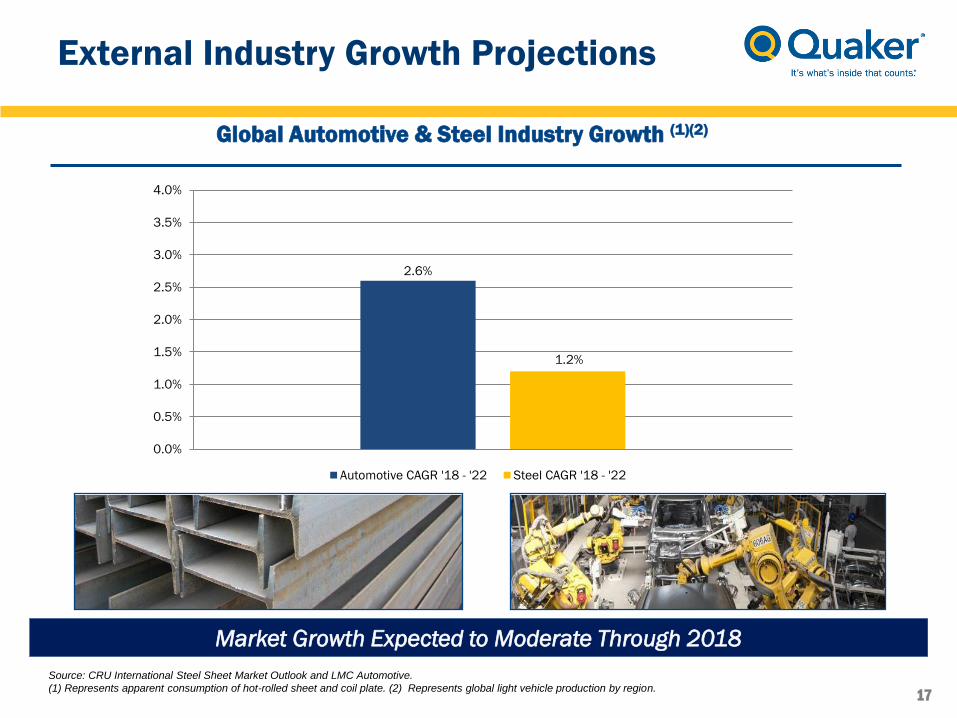
External Industry Growth Projections
Global Automotive & Steel Industry Growth (1)(2)
Source: CRU International Steel Sheet Market Outlook and LMC Automotive.
(1) Represents apparent consumption of hot-rolled sheet and coil plate. (2) Represents global light vehicle production by region.
Market Growth Expected to Moderate Through 2018
2.6%
1.2%
0.0%
0.5%
1.0%
1.5%
2.0%
2.5%
3.0%
3.5%
4.0%
Automotive CAGR '18 - '22 Steel CAGR '18 - '22
17

Growth Strategy
Selling into growing
markets – steel,
automotive and
others
Quaker has a strong
balance sheet and
continues to review
acquisition candidates
Quaker continues to
take additional share
in markets it
competes, e.g.,
building relationships
with key customers on
all continents
Increase share of
wallet leveraging
newly acquired
technologies across
existing customer
base
Growing Base
Markets
Gaining
Market Share
Leveraging Past
Acquisitions
Future
Acquisitions
Organic
M & A
18
Quaker
Quaker Financial Review
Houghton + Quaker = A Compelling Combination
Houghton and Quaker Financial Review
Appendix
19

Repurchase shares if value generating acquisitions cannot be executed on a timely basis
Quaker will repurchase shares to at least offset the dilutive impact of shares issued each year
Capital Allocation -- Guiding PrinciplesQuaker’s Capital Allocation Waterfall
Highly valued return of cash to shareholders paid for 46 years (increased 42 years)
Quaker targeting ~30% payout
Distribute cash to shareholders via on-going quarterly dividends✓
Consistent with Quaker’s strategic plan and above Quaker’s target return on capital
Believe acquisitions are the best way to generate shareholder value
Execute core strategic acquisitions✓
Distribute cash to shareholders via share repurchase✓
Target Leverage: 2.0x – 2.5x Adjusted EBITDA Over Time
20

Discipline and Clear Strategy Has Translated
Into Strong and Consistent Financial Results
Net Sales Adjusted EBITDA Adjusted Diluted EPS
▪ Winning new business
and leveraging
acquisitions
▪ Continuous focus on
managing costs and
margins
▪ Delivering growth to
shareholders
$44
$115
2009 2017
$1.75
$5.01
2009 2017
Note: Dollars in millions, except per share data.
$451
$820
2009 2017
EVA Approach Drives Strong Results21

Strong Balance Sheet From Which to Grow
Net (Cash) Debt / LTM Adjusted EBITDA
0.9x
0.7x
0.4x
(0.0x)
(0.6x)
0.1x
0.0x
(0.2x) (0.2x)(0.1x)
(1.0x)
(0.5x)
0.0x
0.5x
1.0x
2009 2010 2011 2012 2013 2014 2015 2016 2017 Q1
2018
Note: Dollars in millions.
$25 $26 $17$33
$68 $65$81 $89 $90 $93
$79
$120 $147
$163
$300
$242
$237
$252 $252 $243
$104
$146
$164
$195
$368
$306
$318$341 $341
$335
$0
$50
$100
$150
$200
$250
$300
$350
$400
2009 2010 2011 2012 2013 2014 2015 2016 2017 Q1
2018
Liquidity: Cash + Revolver Availability
Cash
Revolver
Availability
22

Quaker
Quaker Financial Review
Houghton + Quaker = A Compelling
Combination
Houghton and Quaker Financial Review
Appendix
23
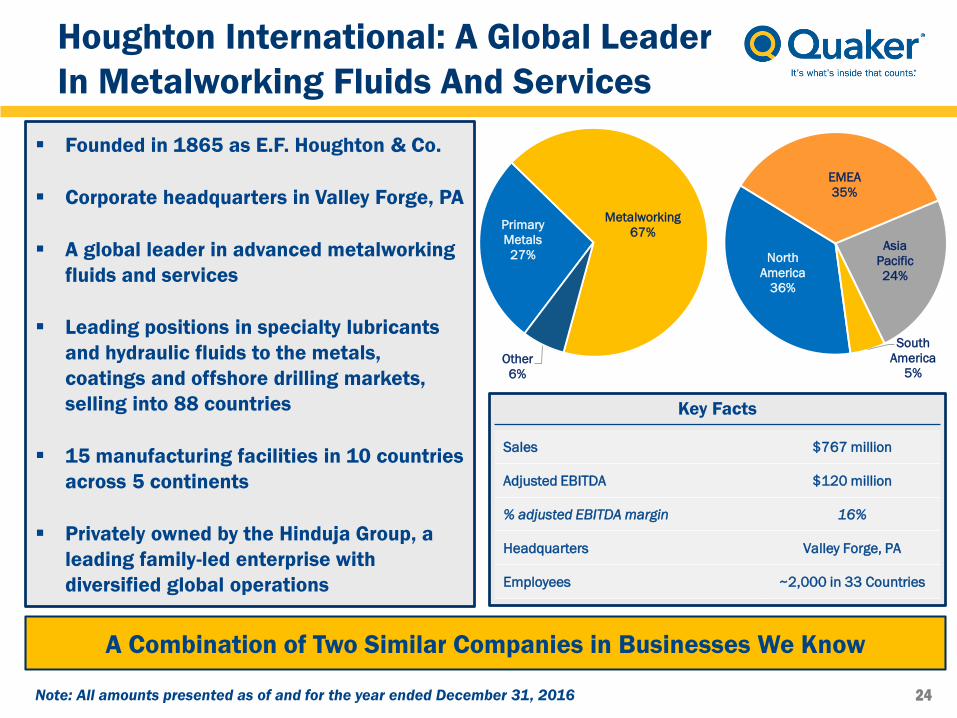
▪ Founded in 1865 as E.F. Houghton & Co.
▪ Corporate headquarters in Valley Forge, PA
▪ A global leader in advanced metalworking
fluids and services
▪ Leading positions in specialty lubricants
and hydraulic fluids to the metals,
coatings and offshore drilling markets,
selling into 88 countries
▪ 15 manufacturing facilities in 10 countries
across 5 continents
▪ Privately owned by the Hinduja Group, a
leading family-led enterprise with
diversified global operations
Key Facts
Sales $767 million
Adjusted EBITDA $120 million
% adjusted EBITDA margin 16%
Headquarters Valley Forge, PA
Employees ~2,000 in 33 Countries
A Combination of Two Similar Companies in Businesses We Know
North
America
36%
EMEA
35%
Asia
Pacific
24%
South
America
5%
Primary
Metals
27%
Metalworking
67%
Other
6%
Houghton International: A Global Leader
In Metalworking Fluids And Services
24Note: All amounts presented as of and for the year ended December 31, 2016
Quaker + Houghton:
A Value-Creating Combination
✓Strong Talent and Cultural Fit
✓Increases Size and Scale
✓Accelerates Growth Opportunities
✓Achieves Significant Cost Synergies
✓Balanced Capital Structure Approach
✓Strong Free Cash Flow
25

North America
45%
South America
4%
EMEA
27%
Asia Pacific
24%
North
America
40%
South
America
5%
EMEA
31%
Asia Pacific
24%
Sales By Geography
Combined
Primary
Metals
50%
Metalworking
42%
Coatings
8%
Combined
Sales By Product Type
Primary
Metals
27%
Metalworking
67%
Other
6%
North
America
36%
EMEA
35%
Asia
Pacific
24 %
South
America
5%
Primary
Metals
38%
Metalworking
55%
Coatings
/Other
7%
Diversified Product & Geographic ProfileAll amounts for the year ended December 31, 2016
26
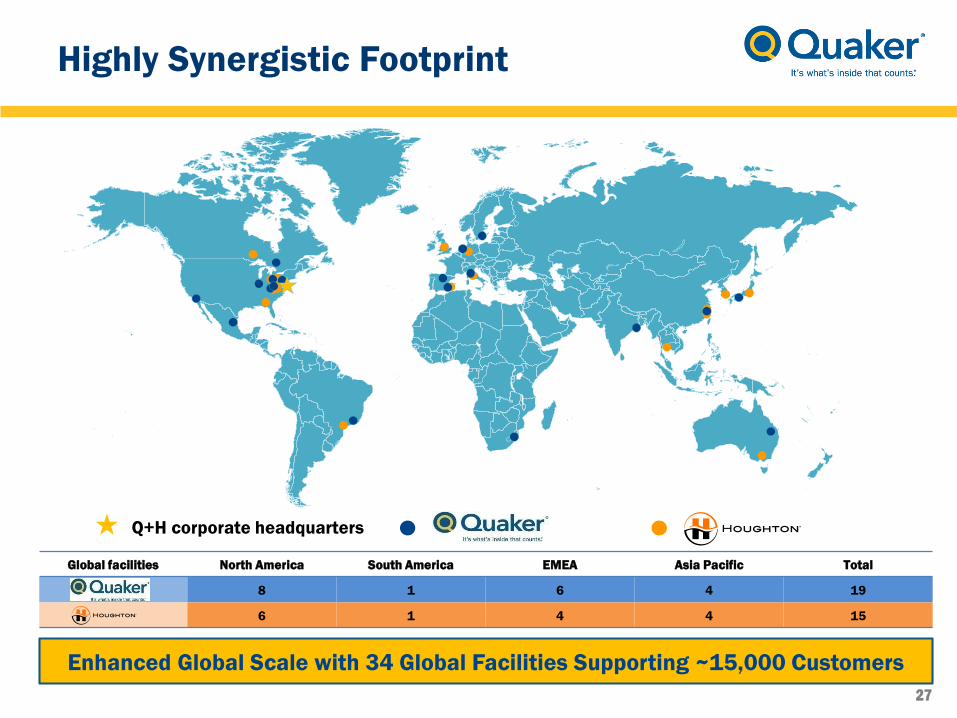
Q+H corporate headquarters
Global facilities North America South America EMEA Asia Pacific Total
8 1 6 4 19
6 1 4 4 15
Enhanced Global Scale with 34 Global Facilities Supporting ~15,000 Customers
Highly Synergistic Footprint
27

Readily achievable cost synergies expected to meet or exceed $45 million
Year 1 Year 2 Year 3
($ in millions)
Synergy Realization Timing
~$20
~$35
~$45
▪ Manufacturing footprint optimization
▪ Raw material purchasing
▪ Freight / warehousing
▪ Ester production
▪ Headcount reductions
▪ Non-labor SG&A
▪ Optimize IT platforms
Significant Cost Synergies
Sources of Synergy
28

Common
Products
Forming Fluids ✓
Metal Cutting and
Deformation ✓
Corrosion Protection
Fluids ✓
Fluid Power ✓
Industrial Process
Cleaners ✓
Food and Beverage
Can Processing ✓
Complementary
Products
Specialty Greases ✓ +
Offshore Control
Hydraulics + ✓
High Pressure Die
Casting ✓ +
Heat Treat
Quenchants + ✓
Mining ✓ +
Metal Finishing + ✓
Surface Treatment ✓ +
Bio-Based Lubricants ✓ +
+ = cross-selling opportunity
~14,000 Customers Unique to Quaker or Houghton Creates Significant Cross-
Selling Opportunities
/
Cross-Selling Opportunities to
Accelerate Revenue Growth
✓ = common product
29

Quaker
Quaker Financial Review
Houghton + Quaker = A Compelling Combination
Houghton and Quaker Financial Review
Appendix
30

Enhanced Financial ProfileAll amounts for the year ended December 31, 2016
$120
$45
$107
$272
Run-Rate Synergies New Quaker
2016 Adjusted EBITDA($ millions)
Run-Rate Synergies
($ in millions)
Combined including
synergies(a)
∆ vs. Quaker
standalone
2016 Sales $747 $767 $1,514 +2x
2016 Adjusted EBITDA $107 $120 $272 +2.5x
2016 Adjusted EBITDA margin 14% 16% 18% +4% pts
2016 FCF margin(b) 13% 14% 17% +4% pts
2016 FCF conversion(c) 91% 92% 93% +2% pts
(a) Assumes $45 million of synergies in adjusted EBITDA
(b) Calculated as adjusted EBITDA – CAPEX as a percent of sales
(c) Calculated as adjusted EBITDA – CAPEX as a percent of adjusted EBITDA
Combination
31

▪ Strong Free Cash Flow
generation supports rapid
debt reduction and balanced
capital allocation approach:
▪ Focus on deleveraging to
2x - 2.5x adjusted EBITDA
ratio
▪ Combined company has
asset-lite profile with
expected capex of ~1.5% of
sales
▪ Pay dividends consistent
with Quaker’s practice over
the past 46 years
▪ Continue acquisitions when
leverage and liquidity
improve
Note: Chart assumes all excess cash applied to reduce debt
3.7x
3.2x
2.5x
1.8x
1.2x
0.6x
Closing Year 1 Year 2 Year 3 Year 4 Year 5
Net Debt / Adjusted EBITDA*
Cash Flow*~$45 ~($50)
~($30)
~($25)~($15)
~($25)
~$227
~$127
Adj. EBITDA Synergies Cash taxes Cash
Interest
CAPEX Working
capital
Dividends Cash
Available
for Debt
RepaymentNote: Amounts represent estimated adjusted EBITDA at close
and estimated pro forma cash flows
* All amounts presented as of and for the year ended December 31, 2016
Capital Allocation:
Reducing Debt Becomes A Priority
32
Quaker
Quaker Financial Review
Houghton + Quaker = A Compelling Combination
Houghton and Quaker Financial Review
Appendix
33
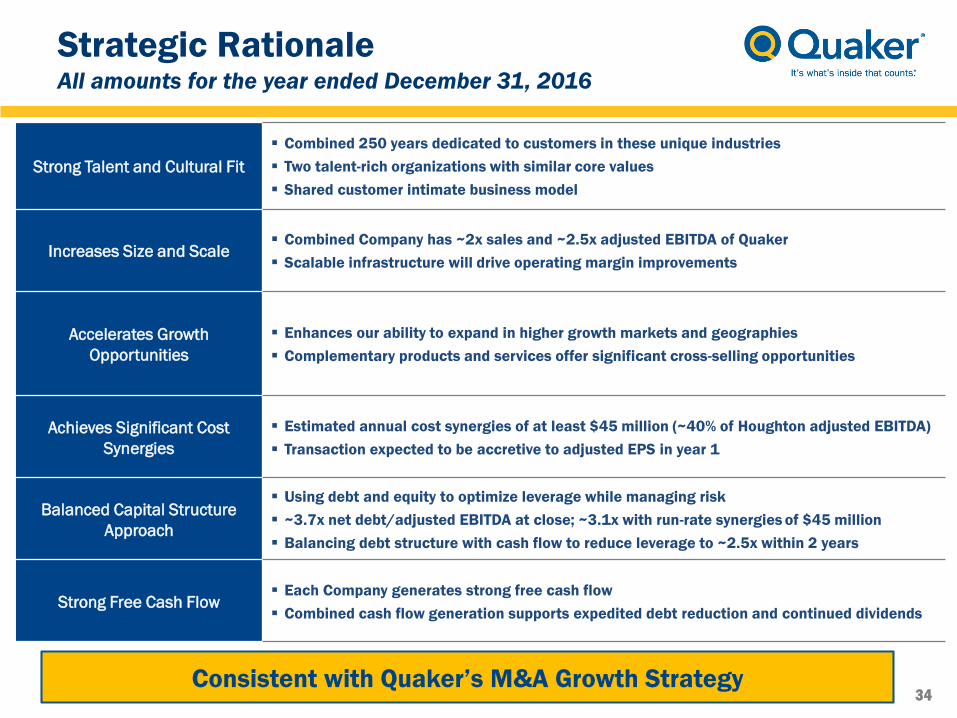
Strong Talent and Cultural Fit
▪ Combined 250 years dedicated to customers in these unique industries
▪ Two talent-rich organizations with similar core values
▪ Shared customer intimate business model
Increases Size and Scale ▪ Combined Company has ~2x sales and ~2.5x adjusted EBITDA of Quaker
▪ Scalable infrastructure will drive operating margin improvements
Accelerates Growth
Opportunities
▪ Enhances our ability to expand in higher growth markets and geographies
▪ Complementary products and services offer significant cross-selling opportunities
Achieves Significant Cost
Synergies
▪ Estimated annual cost synergies of at least $45 million (~40% of Houghton adjusted EBITDA)
▪ Transaction expected to be accretive to adjusted EPS in year 1
Balanced Capital Structure
Approach
▪ Using debt and equity to optimize leverage while managing risk
▪ ~3.7x net debt/adjusted EBITDA at close; ~3.1x with run-rate synergies of $45 million
▪ Balancing debt structure with cash flow to reduce leverage to ~2.5x within 2 years
Strong Free Cash Flow▪ Each Company generates strong free cash flow
▪ Combined cash flow generation supports expedited debt reduction and continued dividends
Consistent with Quaker’s M&A Growth Strategy
Strategic RationaleAll amounts for the year ended December 31, 2016
34

Transaction OverviewAll amounts for the year ended December 31, 2016
Purchase Price and
Structure
▪ Houghton shareholders to receive $172.5 million in cash and 24.5% (~4.3 million shares) of
Quaker; Quaker will assume Houghton’s net debt of approximately $690 million
▪ Represents an enterprise value of approximately $1.42 billion(a)
▪ Represents a transaction multiple (purchase price vs 2016 adjusted EBITDA) of 11.8x pre-
synergies and 8.6x with run-rate synergies(a)(b)
Leadership,
Governance and
Ownership
▪ Michael Barry will be the Chairman and CEO of the combined company
▪ Quaker Board will increase from 9 directors to 12; the Hinduja Group will nominate 3
▪ Pro forma equity ownership of 75.5% existing Quaker shareholders and 24.5% Houghton
shareholders
Financing and Leverage
▪ Quaker has secured $1.15 billion in committed financing from Bank of America and Deutsche
Bank to support the transaction
▪ Leverage of ~3.7x net debt to 2016 adjusted EBITDA at close; ~3.1x with run-rate synergies(b)(c)
▪ Attractive pricing and terms; cost of debt ~3% at today’s rates
Conditions to Close
▪ Approval of Quaker shareholders
▪ Regulatory approvals in U.S., Europe and Asia Pacific
▪ Customary closing conditions
▪ Expected closing over the next few months
(a) Based on Quaker’s 10 day Volume Weighted Average Price (“VWAP”) as of March 31, 2017 of $129.70
(b) Assumes $45 million of run-rate synergies
(c) Assumes $950 million of new debt issued to fund transaction; estimated $965 million total debt at close 35
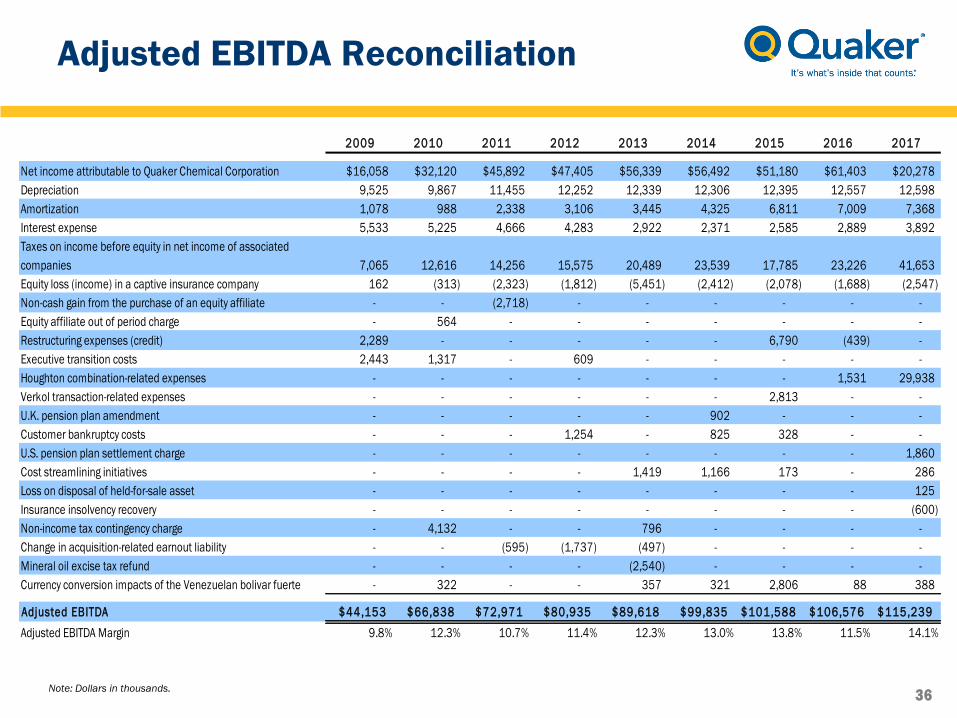
Adjusted EBITDA Reconciliation
Note: Dollars in thousands.36
2009 2010 2011 2012 2013 2014 2015 2016 2017
Net income attributable to Quaker Chemical Corporation $16,058 $32,120 $45,892 $47,405 $56,339 $56,492 $51,180 $61,403 $20,278
Depreciation 9,525 9,867 11,455 12,252 12,339 12,306 12,395 12,557 12,598
Amortization 1,078 988 2,338 3,106 3,445 4,325 6,811 7,009 7,368
Interest expense 5,533 5,225 4,666 4,283 2,922 2,371 2,585 2,889 3,892
Taxes on income before equity in net income of associated
companies 7,065 12,616 14,256 15,575 20,489 23,539 17,785 23,226 41,653
Equity loss (income) in a captive insurance company 162 (313) (2,323) (1,812) (5,451) (2,412) (2,078) (1,688) (2,547)
Non-cash gain from the purchase of an equity affiliate - - (2,718) - - - - - -
Equity affiliate out of period charge - 564 - - - - - - -
Restructuring expenses (credit) 2,289 - - - - - 6,790 (439) -
Executive transition costs 2,443 1,317 - 609 - - - - -
Houghton combination-related expenses - - - - - - - 1,531 29,938
Verkol transaction-related expenses - - - - - - 2,813 - -
U.K. pension plan amendment - - - - - 902 - - -
Customer bankruptcy costs - - - 1,254 - 825 328 - -
U.S. pension plan settlement charge - - - - - - - - 1,860
Cost streamlining initiatives - - - - 1,419 1,166 173 - 286
Loss on disposal of held-for-sale asset - - - - - - - - 125
Insurance insolvency recovery - - - - - - - - (600)
Non-income tax contingency charge - 4,132 - - 796 - - - -
Change in acquisition-related earnout liability - - (595) (1,737) (497) - - - -
Mineral oil excise tax refund - - - - (2,540) - - - -
Currency conversion impacts of the Venezuelan bolivar fuerte - 322 - - 357 321 2,806 88 388
Adjusted EBITDA $44,153 $66,838 $72,971 $80,935 $89,618 $99,835 $101,588 $106,576 $115,239
Adjusted EBITDA Margin 9.8% 12.3% 10.7% 11.4% 12.3% 13.0% 13.8% 11.5% 14.1%

Non-GAAP Earnings Per Diluted Share
Reconciliation
37
2009 2010 2011 2012 2013 2014 2015 2016 2017
GAAP Earnings per diluted share $1.45 $2.80 $3.66 $3.63 $4.27 $4.26 $3.84 $4.63 $1.52
Equity loss (income) in a captive insurance company per diluted
share 0.02 (0.03) (0.19) (0.14) (0.41) (0.18) (0.16) (0.13) (0.19)
Non-cash gain from the purchase of an equity affiliate per diluted
share - - (0.22) - - - - - -
Equity affiliate out of period charge per diluted share - 0.05 - - - - - - -
Restructuring expenses (credit) per diluted share 0.14 - - - - - 0.36 (0.02)
Executive transition costs per diluted share 0.14 0.08 - 0.03 - - - - -
Houghton combination-related expenses per diluted share - - - - - - - 0.11 1.90
U.S. tax reform charges per diluted share - - - - - - - - 1.67
Verkol transaction-related expenses per diluted share - - - - - - 0.15 - -
U.K. pension plan amendment per diluted share - - - - - 0.05 - - -
Customer bankruptcy costs per diluted share - - - 0.06 - 0.05 0.02 - -
U.S. pension plan settlement charge per diluted share - - - - - - - - 0.09
Cost streamlining initiatives per diluted share - - - - 0.08 0.06 0.01 - 0.01
Loss on disposal of held-for-sale asset per diluted share - - - - - - - - 0.01
Insurance insolvency recovery per diluted share - - - - - - - - (0.03)
Non-income tax contingency charge per diluted share - 0.26 - - 0.04 - - - -
Change in acquisition-related earnout liability per diluted share - - (0.03) (0.09) (0.03) - - - -
Mineral oil excise tax refund per diluted share - - - - (0.14) - - - -
Currency conversion impacts of the Venezuelan bolivar fuerte per
diluted share - 0.03 - - 0.03 0.02 0.21 0.01 0.03
Non-GAAP Earnings Per Diluted Share $1.75 $3.19 $3.22 $3.49 $3.84 $4.26 $4.43 $4.60 $5.01

2016 Adjusted EBITDA Reconciliation
For Potential Combination
($ in millions)
Net income attributable to Quaker Chemical
Corporation $61
Net interest expense(c) 1
Tax expense on income before equity in net
income of associated companies23
Depreciation 13
Amortization 7
EBITDA $105
Equity income in a captive insurance company (2)
Transaction-related expenses 2
Full-year impact of Lubricor acquisition(c) 2
Other (a) (0)
Adjusted EBITDA $107
($ in millions)
Net loss attributable to Houghton International ($37)
Net interest expense 50
Tax benefit on loss before equity in net income of
associated companies(5)
Depreciation 11
Amortization 44
EBITDA $63
Cost reduction activities 4
Transaction-related expenses 3
Impairment of goodwill and intangible assets 41
Management fees and expenses to owners 3
Non-income tax settlement expense 2
Full-year impact of Wallover acquisition 3
Other (b) 1
Adjusted EBITDA $120
(a) Other includes a charge related to the inventory fair value adjustment in the Lubricor
acquisition offset by a net credit due to restructuring and cost streamlining activities
(b) Other includes a charge related to a legal settlement and a charge related to the inventory
fair value adjustment in the Wallover acquisition offset by a gain on the sale of an asset
(c) The difference between the 2016 Adjusted EBITDA calculation per slide 36 and slide 38 is
the inclusion of interest income (i.e. net interest expense) and including a forward estimated
full year run rate of the prior year Lubricor acquisition
38