qualitative aspects of chromo-stereoscopy for …preprint/prÉtirage qualitative aspects of...
TRANSCRIPT
PREPRINT/PRÉTIRAGE
Qualitative Aspects of Chromo-Stereoscopy for Depth Perception
Thierry ToutinCanada Centre for Remote Sensing
588 Booth Street, Ottawa, Ontario K1A 0Y7 CANADAEMAIL: [email protected]
ABSTRACT
The display of three dimensional quantitative data sets is a basic topic of research incartography, image processing and applications related to spatial information. A newapplication for data visualisation and analysis which combines colour vision and depthperception, has been developed using the effect known as chromo-stereoscopy based onthe Einthoven's theory.
It enables the generation of flat colour composite images from multisource data in whichdepth information is coded into colours. When viewed with double prism refractionChromaDepth� glasses, a "dramatic" 3D effect is produced. Following a description ofthe method, the geometric and radiometric processing parameters are qualitativelyanalysed to assess their impact on the quality of the chromo-stereoscopic images and thedepth perception.
INTRODUCTION
Through the normal process of vision, we unconsciously evaluate the forms, shapes,distances, colours of a vast number of objects around us. However, to successfullyrepresent three-dimensional (3-D) information on a flat surface such as an image orpainting, both the perceptual and conceptual levels of understanding spatial relationshipsmust be combined. Illusions of perceptual space can be generated by use of the linearperspective system, taking advantage of the viewer's conceptual knowledge of theperspective phenomena.
Psychological research has indicated that performance at searching a display is muchimproved if one knows something beforehand about what is to be looked at (Smith,1962). Since psychological factors play a major role in perception, the remote sensingexpert can "go beyond the information given" in the display of an image. Thus the viewerwith some a-priori knowledge of the data, of the terrain and a good understanding of theprocessing has a more qualitative experience. It has been suggested (Hoffman, 1990) thatresearchers might devote more time to studying and integrating these qualitative aspectsof the remote sensing process.
2
Chromo-stereoscopy offers a tool to qualitatively perceive depth. Differently colouredobjects at the same viewing distance can often appear to lie at different depth (Einthoven,1885). This apparent depth difference can be then enhanced by a refraction process.Therefore these two known phenomenons can be used to perform fusion of multi-sourceremote sensing data, and to qualitatively perceive depth from the single stereoscopicfused image. The method is straight-forward: the depth is coded into colours, and thendecoded by means of basic optics to produce the depth perception. When viewing acolour encoded composite image using chromo-stereoscopy, the stereo effect is based onphysiological and psychological factors of colour and depth.
The first attempt to produce a chromo-stereoscopic image from remote sensing data(Toutin and Rivard, 1995) resulted in an interesting 3-D product with some artifacts.Published as a highlight article in the October '95 issue of PE&RS, it briefly described theprocess of depth perception, the chromo-stereoscopic method and the generation of thecover page image. There was no detailed development of these different aspects, nor anyanalysis of the relationships between the processing steps and the parameters.
In order to better understand the different components (eyes, glasses, images) of thechromo-stereoscopic method, this paper will expand on the earlier article and address thedifferent factors (physical, physiological, psychological) which influence the generationand the perception of chromo-stereoscopic images. This method examines depthperception qualitatively, it does not extract quantitative information which can be directlyobtained from the input data. Therefore only the qualitative aspects of the process arediscussed. Because the eye and the brain are part of the "sensor" which acquires andperceives information, some key aspects of their important role in this method will beexamined. After reviewing stereo-viewing processes applied in remote sensing anddescribing in detail the eye as a sensor, the chromo-stereoscopy method and theChromaDepth� glasses are examined and the technique to control the input parametersof the geometric and radiometric processing is analyzed and tested on different images.
REVIEW OF STEREO-VIEWING METHODS
Different methods have been developed to recreate depth perception. This paper is notintended to fully address all three dimensional imagery techniques. Only those mostcommonly used, especially in remote sensing, are described. Okoshi (1976) is a goodreference for more details. Depth perception can be "natural" with two images taken fromdifferent view points, or "synthetic" to generate a stereo-pair or a perspective view. Forthe latter, depth perception can be related to any theme such as terrain elevation, magneticor gravimetric fields, etc.
3
In natural depth perception, stereoscopic pictures are viewed separately by each eye: theright-viewpoint image to the right-eye and the left-viewpoint image to the left eye. Anexperienced observer of the stereo-pair may be able to achieve the proper focus andconvergence without special equipment; however, some devices used ordinarily alloweach eye to see the appropriate picture of the pair. The device used depends on how thestereo pair was generated. Most commonly they are conventional stereoscope, anaglyphor polarized glasses. Recently, the 3-D shutter glasses are a more sophisticated deviceused on a computer screen, where shutter glasses are synchronized with a screenalternatively displaying left and right images.
As reported by Okoshi (1976), the first attempt at a stereoscopic drawing was a techniquedevised by Giovanni Battista della Porta around the year 1600. Today, stereo-paintingshave been created by depicting left and right perspectives, as Magritte with his "Man witha Newspaper" (The Tate Gallery, London, England, 1928), or Dali with his "Christ ofGala" (Museum Ludwig, Cologne, Germany, 1978).
In the same way, many proposals for 3-D movies have appeared since the firststereoscopic polarized movie in 1939: some relied upon parallax effects withsimultaneous projections on the screen; others, like "Cinerama" in the '50s, relied uponpsychological illusion to give a strong, realistic 3-D sensation by surrounding thespectators through a wide angle projection.
More recently in 1995, Sharp Laboratories researchers in Europe claimed a majoradvance in 3-D moving image technology (Toutin and Rivard, 1995). To produce the 3-Dimage, the "twin-LCD (Liquid Crystal Displays)" are placed at right angles to each other.The images are then combined by a proprietary optical filter that transmits the image fromthe one display, and reflects the image from the other, producing a 3-D image. A sensoron top of the device detects the position of the viewer's head on which a tiny silver spothas been stuck. The images are then updated on the screen in such a way that it appearsto be at a constant angle of ±20°. Between these limits, the system provides the ability to"look" around the objects without image flipping (Walko, 1995).
But most of these stereoscopic devices have a common feature: the presentation of aseparate view to each eye with the horizontal binocular parallax. Jones et al (1984)developed a new 3-D imaging technique, which employs a modified alternating-framesystem. With a two-source system, VISIDEP� utilizes the vertical disparity parallax togenerate the depth effect. The two cameras used to generate the images are opticallyaligned on a vertical plane. They discovered the apparent superiority of vertical parallaxto horizontal parallax with alternating frame technology. Its applicability is apparentlysupported (Imsand, 1986). This VISIDEP� system seems limited to a specific imagingsystem, but according to McLaurin et al. (1986), almost any situation with two sources ofinformation can be adapted to the system. Some applications with remote sensing andgeographic data have already been realized with this system (Ursery, 1993).
4
All the 3-D imaging techniques described previously relied upon only two cues:binocular parallax and convergence. The invention of holography (Gabor, 1948) wasparticularly significant because it offered for the first time a method of spatial imagingwith the accommodation cue. Furthermore, it is also the only true three-dimensionalphotography (Friedhoff and Benzon, 1991).
Holography is a two-step lens-less imaging process: recording an interference pattern on atransparency (the hologram), and reconstruction of the developed hologram. Statedsimply, if light A interacts with light B to form an interference pattern that is captured onphotographic film, it is possible to project light A onto the developed film, the hologram,to recreate light B. If light B was reflected from an object, then its reconstruction is aholographic image of that object. In an ordinary photograph, what is recorded at a pointis the brightness of the image, or the amplitude of the wave reflected by the object at thatpoint. However, in holography, the key point is that the interference pattern contains, byway of the fringe configuration, information corresponding to both the amplitude and thephase of the wave scattered by the object.
Since holography is the only true 3-D photography, a hologram can be viewed fromdifferent perspectives just as is possible with the objects. For example, if a magnifyingglass is recorded on a hologram, the magnifying glass in the hologram magnifies differentobjects as we change our point of view (Friedhoff and Benzon, 1991).
But, there are practical disadvantages mostly due to the use of coherent light in therecording and reconstruction steps: objects must be still and recorded only in a darkroomon high resolution expensive plate, and the result is monochromatic (B/W). Howeversince 1964, the use of white-light illumination for multicolour reconstruction overcomesthese drawbacks (Leith and Upatnieks, 1964; Pennington and Lin, 1965). Holographyapplied to remote sensing data has been also realized (Benton et al., 1985). Theygenerated white-light viewable holographic stereograms obtained by digital and opticalprocessing of Landsat-MSS stereo pair which produced a black and white 3-D image ofthe Earth's surface.
THE EYE AS A SENSOR
The eye is the organ through which humans acquire knowledge of their environment byvirtue of the light reflected from, or emitted by the objects within the environment. Forhumans, the information provided by the eyes undoubtedly plays the dominant role in ourinterpretation of the environment. But the power to integrate the viewed image torecognize its contour, its colour, and its relation with other objects, indicates that theprocess of vision does not merely consist of "seeing", but also of "perceiving andunderstanding" through the central nervous system. The eye, considered as part of the
5
brain is fundamentally an organizer. The eye/brain starting even with the activity of theretina, is actively building a world of objects. This suggests that a-priori knowledge isuseful for a better interpretation and understanding of the image: to have a clear idea ofwhat to look for, where to look, and how to look (Hoffman, 1991).
The eye and the vision are very complex and sophisticated systems, involvingphysiological, biochemical, neurological, psychological, etc. processes. Its fullunderstanding is outside the scope of this paper; only some elementary aspects of the eyesand vision are addressed to better understand the process of chromo-stereoscopy.
The eye has two kinds of receptors: the cones and the rods. The cones are highlyconcentrated in the fovea and are in direct and one-to-one connection with bipolarnervous cells. The rods are spread in the periphery of the retina in connection with cones.But there is no one-to-one connection with nervous cells: several rods and cones canhave the same connection with a bipolar nervous cell. Thus, the visual acuity is lessprecise, when using the rods. Cones which are bigger, are mainly used for detailed acuityin bright light, and also give colour acuity. Rods which are smaller but 18 times morenumerous, are used in reduced light, but give only black and white acuity.
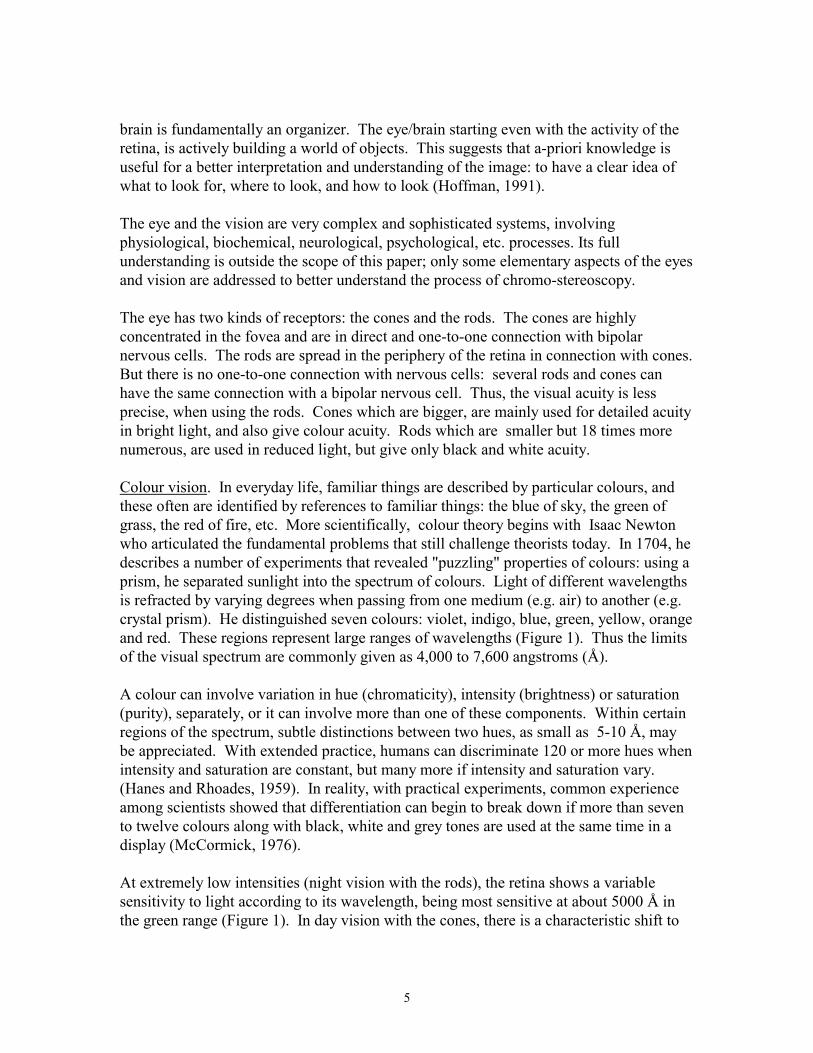
Colour vision. In everyday life, familiar things are described by particular colours, andthese often are identified by references to familiar things: the blue of sky, the green ofgrass, the red of fire, etc. More scientifically, colour theory begins with Isaac Newtonwho articulated the fundamental problems that still challenge theorists today. In 1704, hedescribes a number of experiments that revealed "puzzling" properties of colours: using aprism, he separated sunlight into the spectrum of colours. Light of different wavelengthsis refracted by varying degrees when passing from one medium (e.g. air) to another (e.g.crystal prism). He distinguished seven colours: violet, indigo, blue, green, yellow, orangeand red. These regions represent large ranges of wavelengths (Figure 1). Thus the limitsof the visual spectrum are commonly given as 4,000 to 7,600 angstroms (Å).
A colour can involve variation in hue (chromaticity), intensity (brightness) or saturation(purity), separately, or it can involve more than one of these components. Within certainregions of the spectrum, subtle distinctions between two hues, as small as 5-10 Å, maybe appreciated. With extended practice, humans can discriminate 120 or more hues whenintensity and saturation are constant, but many more if intensity and saturation vary.(Hanes and Rhoades, 1959). In reality, with practical experiments, common experienceamong scientists showed that differentiation can begin to break down if more than sevento twelve colours along with black, white and grey tones are used at the same time in adisplay (McCormick, 1976).
At extremely low intensities (night vision with the rods), the retina shows a variablesensitivity to light according to its wavelength, being most sensitive at about 5000 Å inthe green range (Figure 1). In day vision with the cones, there is a characteristic shift to
6
5,600 Å at the beginning of the yellow range. It has an interesting psychologicalcorrelate: with low intensities, red becomes much darker and blue much brighter. Asdarkness increases, the rod luminosity scale prevails over that of cones.
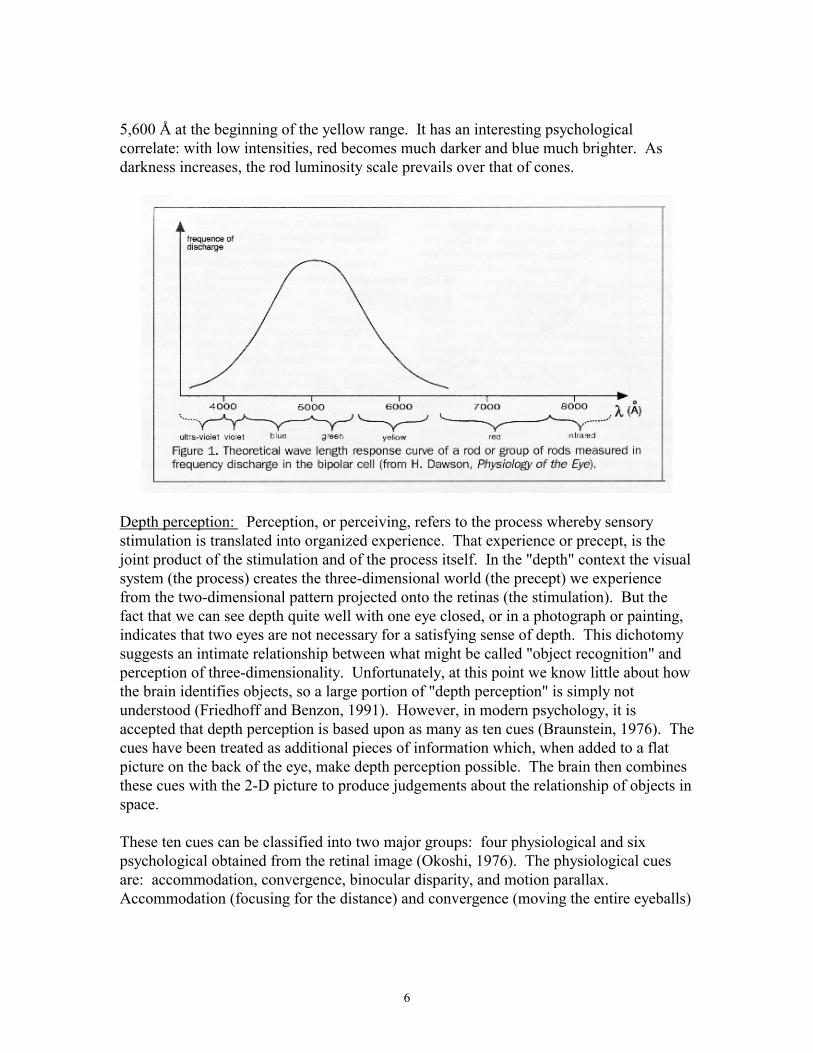
Depth perception: Perception, or perceiving, refers to the process whereby sensorystimulation is translated into organized experience. That experience or precept, is thejoint product of the stimulation and of the process itself. In the "depth" context the visualsystem (the process) creates the three-dimensional world (the precept) we experiencefrom the two-dimensional pattern projected onto the retinas (the stimulation). But thefact that we can see depth quite well with one eye closed, or in a photograph or painting,indicates that two eyes are not necessary for a satisfying sense of depth. This dichotomysuggests an intimate relationship between what might be called "object recognition" andperception of three-dimensionality. Unfortunately, at this point we know little about howthe brain identifies objects, so a large portion of "depth perception" is simply notunderstood (Friedhoff and Benzon, 1991). However, in modern psychology, it isaccepted that depth perception is based upon as many as ten cues (Braunstein, 1976). Thecues have been treated as additional pieces of information which, when added to a flatpicture on the back of the eye, make depth perception possible. The brain then combinesthese cues with the 2-D picture to produce judgements about the relationship of objects inspace.
These ten cues can be classified into two major groups: four physiological and sixpsychological obtained from the retinal image (Okoshi, 1976). The physiological cuesare: accommodation, convergence, binocular disparity, and motion parallax.Accommodation (focusing for the distance) and convergence (moving the entire eyeballs)
7
are associated with the muscular activity of the eyes, and they are regarded as minor cuesto depth, effective only at a distance of less than nine metres.
The binocular disparity cue is related to the slightly different images of any given objectwhich are received by the eyes embedded at different points in the skull. The degree ofdisparity between the two retinal images, so-called binocular parallax, depends on thedifference between the angles at which an object is fixed by the right eye and by the lefteye. For medium viewing distances, this cue is the most important for depth perception.But, at considerable distances from the viewer the angular difference between the tworetinal images diminishes, which results in depth perception reduction.
With visual motion parallax, distance cues are obtained from retinal changes that dependon the interposition of objects in space: the rate at which the projection of an objectmoves across the retina varies with the distance of the object. It is especially significantwhen the observer or the object is moving rapidly.
The six psychological cues which can give depth sensation from planar imagesreproduced on the retina being assisted by experience are: retinal image size, linearperspective, aerial perspective, overlapping, shade and shadows, texture gradient. Theycan also be combined together to enhance the depth sensation. In remote sensing,perspective is generally the most useful cue and, in radar images, the shade and shadowcue is the most important for the depth sensation. More details on these cues can befound in Braunstein, 1976 and Okoshi, 1976.
CONCEPT OF CHROMO-STEREOSCOPY
The concept of chromo-stereoscopy is first based on the Einthoven's theory (1885).Chromostereopsis is a phenomenon in which coplanar coloured stimuli are perceived asdifferent in apparent depth. Chromostereopsis is positive if the red object is perceived infront of the the blue one, the opposite perception gives negative chromostereopsis.Einthoven (1885) credited this phenomenon to transversal chromatic dispersion and theasymetrical relation of the visual and optical axes.
Using the physical properties of refraction, it is then possible to enhancechromostereopsis. A ray of light in passing from air to glass is refracted by an amountthat depends on its speed in air and glass, the two speeds depending on the wavelength.For example upon entering a glass prism, the different refractions of the variouswavelengths of the white light spread them apart and each is seen as a band of colouredlight.
8
The 3-D display technique described in this paper is based on the ChromaDepth� 3-Dprocess and apparatus, using the two previously described phenomenons. Therefore, thebasic concept is straight forward: encode depth into an image by means of colour, thendecode the colours by means of optics producing the depth perception.
The first glasses, created with prisms (plastic, glass, Fresnel) and liquid optics, workedextremely well but were not suited for mass production. They later used special optics asa way of making very thin diffractive optics that had the efficiency of refractive optics,and which act like thick glass prisms. Each of the lenses actually incorporates a highprecision system of micro-optics resulting in completely clear glasses.
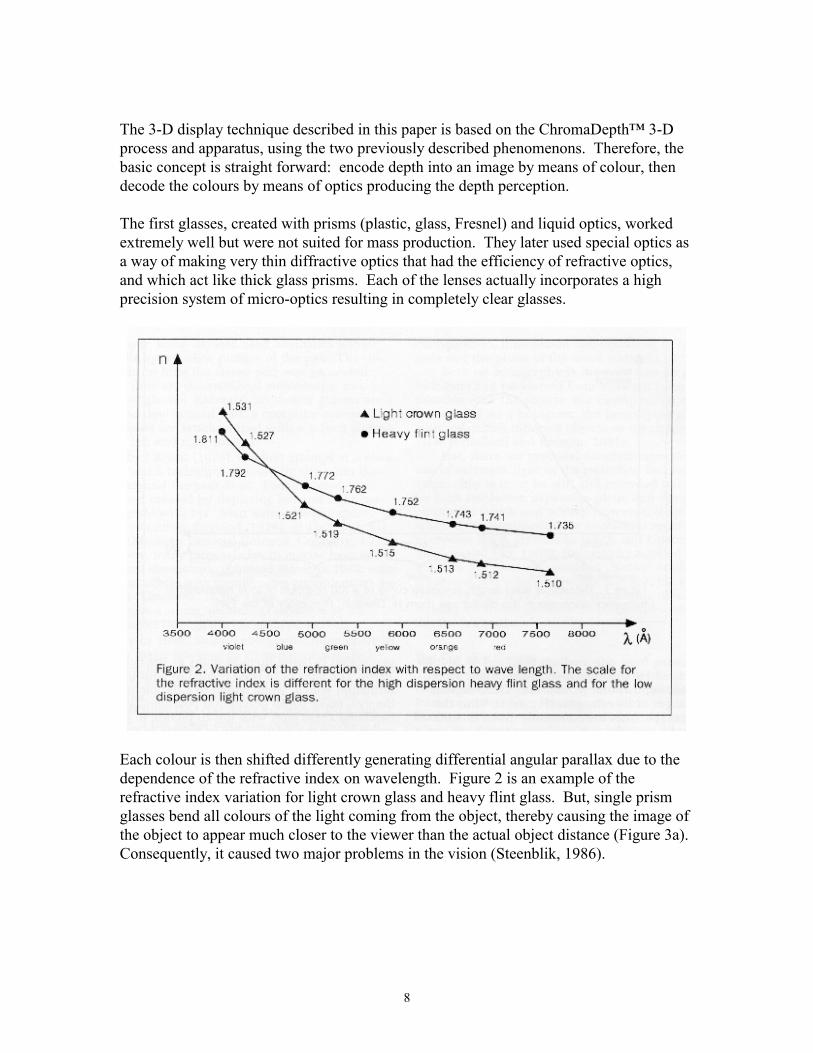
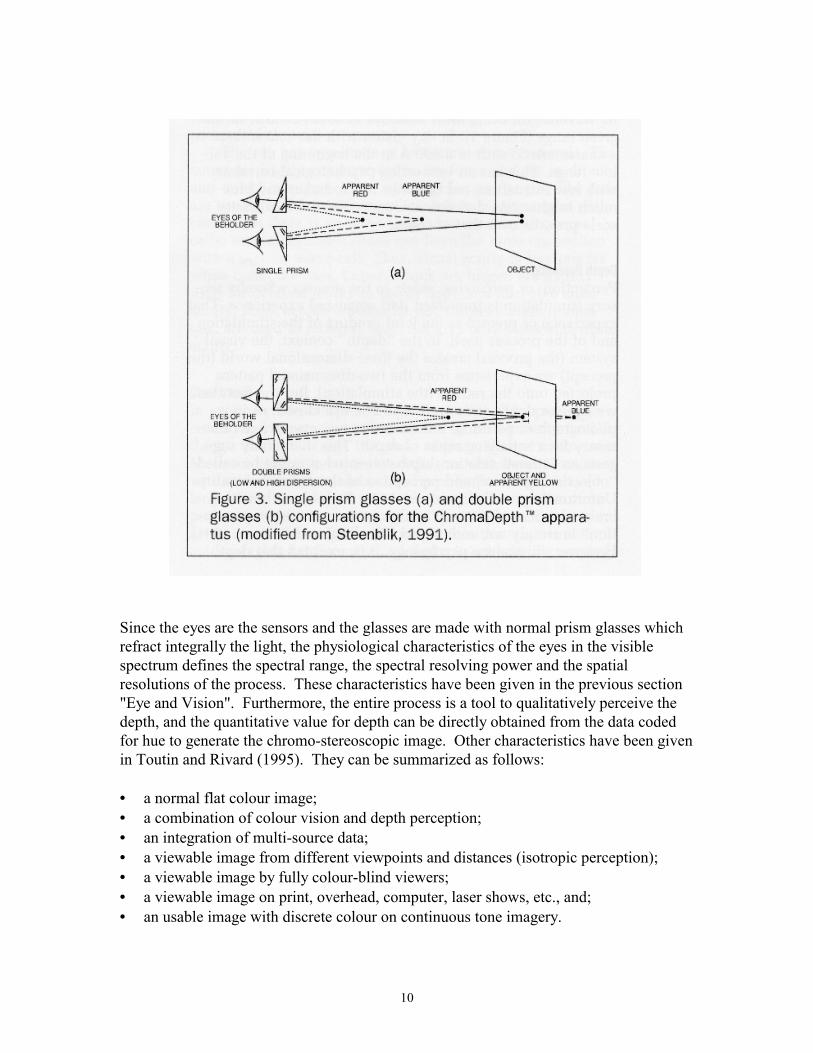
Each colour is then shifted differently generating differential angular parallax due to thedependence of the refractive index on wavelength. Figure 2 is an example of therefractive index variation for light crown glass and heavy flint glass. But, single prismglasses bend all colours of the light coming from the object, thereby causing the image ofthe object to appear much closer to the viewer than the actual object distance (Figure 3a).Consequently, it caused two major problems in the vision (Steenblik, 1986).
9
1) Focusing at the actual object distance causes eye strain because the eyes are beingfocused at a distance which is different from the focal point the brain expects them tohave based on the parallax of the eyes.
2) If the viewer moves his head while looking at the object, the image of the objectmoves differently from the expectation of the viewer's brain, causing a visualdisorientation or vertigo. This is because the brain believes the object to be nearerthan it actually is.
The solution is double prism glasses, which push the image distance back to coincidewith the actual object distance (Figure 3b). It thereby makes the point in space on whichthe eyes focus coincide with the point they expect to focus on. The prisms (a low-dispersion and a high-dispersion) are designed so that yellow light entering the first prismpasses through both prisms and emerges parallel to the entering beam. The other coloursare shifted with a significant angle deviation due to the high-dispersion prism: redobjects appear in the foreground while blue objects are in the background. The yellowimage distance and the object distance will nearly perfectly coincide up to a 4-5 mviewing distance, without eye strain and vertigo.
10
Since the eyes are the sensors and the glasses are made with normal prism glasses whichrefract integrally the light, the physiological characteristics of the eyes in the visiblespectrum defines the spectral range, the spectral resolving power and the spatialresolutions of the process. These characteristics have been given in the previous section"Eye and Vision". Furthermore, the entire process is a tool to qualitatively perceive thedepth, and the quantitative value for depth can be directly obtained from the data codedfor hue to generate the chromo-stereoscopic image. Other characteristics have been givenin Toutin and Rivard (1995). They can be summarized as follows:
• a normal flat colour image;• a combination of colour vision and depth perception;• an integration of multi-source data;• a viewable image from different viewpoints and distances (isotropic perception);• a viewable image by fully colour-blind viewers;• a viewable image on print, overhead, computer, laser shows, etc., and;• an usable image with discrete colour on continuous tone imagery.
11
Since depth information is "synthetically" encoded in colour, quantitative or qualitativethemes can be used. For quantitative information, colour corresponds to value on somequantitative scalar variables (e.g. elevation, gravimetry, etc.). The colour-coding schemetakes the form of a colour-variable to data-variable correspondence. For qualitativeinformation (e.g. polygon data, vector lines, etc.), a palette of colours (differing in hue) isset into a correspondence with the particular characteristics of the symbol (e.g. type ofpolygon, type of vector, etc.).
CHROMO-STEREOSCOPY APPLIED TO REMOTE SENSING DATA
Why use chromo-stereoscopic images in remote sensing? In the remote sensing process,after the acquisition and communication stages, there is the interpretation stage whichinvolves not only data processing and visualisation, but also human interpretation andperception (Hoffman, 1990). Regardless of the level of automatic processing of the datato obtain information, this last stage needs its own specialized tools and systems for thehuman interpreter to make judgements and decision about the object of study.
Furthermore, colour and stereo are the two main characteristics of the eyes:
1) for colour vision, it has been shown that colour can convey information about multi-dimensional data (Ware and Beatty, 1988), and that the use of colour can significantlyaid users in perceiving information and making judgements (Judd and Eastman,1971);
2) for depth perception, it has been shown that the interpretation of cartographicinformation can be facilitated by using 3-D or perspective representations, whencompared to flat 2-D displays (Bemis et al., 1988).
This research suggests that there is increasing interest in stereo and colour pictures howour eyes and brain visualize with machine-handled displays and symbols. Chromo-stereoscopy appears to be an interesting tool to help human interpreters understandremote sensing images and in perceiving and extracting bio- and geophysical information.But, in order to generate a quality chromo-stereoscopic image from multi-source datawhich can be "perceived" with the glasses, two separate processing steps (geometric andradiometric) are required to ensure that the chromo-stereoscopic image preserves thegeometric integrity and radiometric detail of the input grey tone images.
As an example, lets use the image published on the cover page of the October 1995 issueof PE&RS. As the study site, the data set and the processing tools for the geometric andradiometric steps have already been described (Toutin and Rivard, 1995), only a summaryand then an analysis of the effects of processing parameters on the quality of the chromo-stereoscopic image and of the depth perception are presented in this paper.
12
Summary: The study site is located near Lake Okanagan in the Rocky Mountains, BritishColumbia (Canada). The area is characterized by a high relief (1600 m in altitudevariation). The data sets are a Landsat-TM image, a ground range ERS-1 SAR image anda 30-m grid DEM generated from the 10-m contour lines of the 1:50 000 scale map. TheXYZ cartographic co-ordinates of twelve ground control points (GCPs) have beenacquired by stereo compilation of aerial photographs. The geometric step is an ortho-rectification process with or without DEM depending on the geometric correction model.The radiometric integration is the intensity-hue-saturation (IHS) process with the ortho-rectified Landsat-TM3, the DEM and the ortho-rectified ERS-1 SAR assigned to I, H, andS respectively.
Geometric step: Two completely different geometric correction models are used to lookat their effects on the resulting chromo-stereoscopic images: a 2nd order polynomialtransformation and a photogrammetric geometric model developed at the Canada Centrefor Remote Sensing (CCRS).
This photogrammetric model is based on the collinearity condition and represents thephysical realities of the full geometry of viewing. It is integrated because the finalequation takes into account the different distortions relative to the platform, the sensor,the Earth and the cartographic projection. It is unified because it had been adapted toindiscriminately process spaceborne or airborne data, and VIR and SAR data (Toutin,1995a). Its superiority is mainly due to the fact that it respects the viewing geometry,including the relief, and then globally corrects the image. Conversely, the polynomialmethod minimizes only the residuals at the GCPs (local corrections) without identifyingthe source of errors. Comparisons between these two geometric correction methods havebeen addressed quantitatively and qualitatively in Toutin (1995b). This research hasshown that the polynomial transformations generate artifacts and erroneous informationdue to mixed pixels in the co-registration of the input data.
In this study we qualitatively assessed the effect of the geometric correction method onthe quality of the stereo-viewing with the ChromaDepth� glasses. The same parametersare used in the IHS radiometric integration. To better see the details, only sub-images(700 pixels by 1090 lines; 30-m pixel spacing) are presented in Plate 1 (left image fromthe polynomial method and right image from the photogrammetric method).
As the chromaticity (hue) is controlled by the DEM, the full range from blue to red ispresented in both images. The variation of colours is related to different intensities andsaturations due to different co-registration of the three data sets.
Without the glasses, the left image (polynomial method) appears more fuzzy, and has aco-registration problem with mixed pixels. Along the west border of Lake Okanagan(marked "a" on Plate 1), the grey tone results from a zero value of the saturation channel
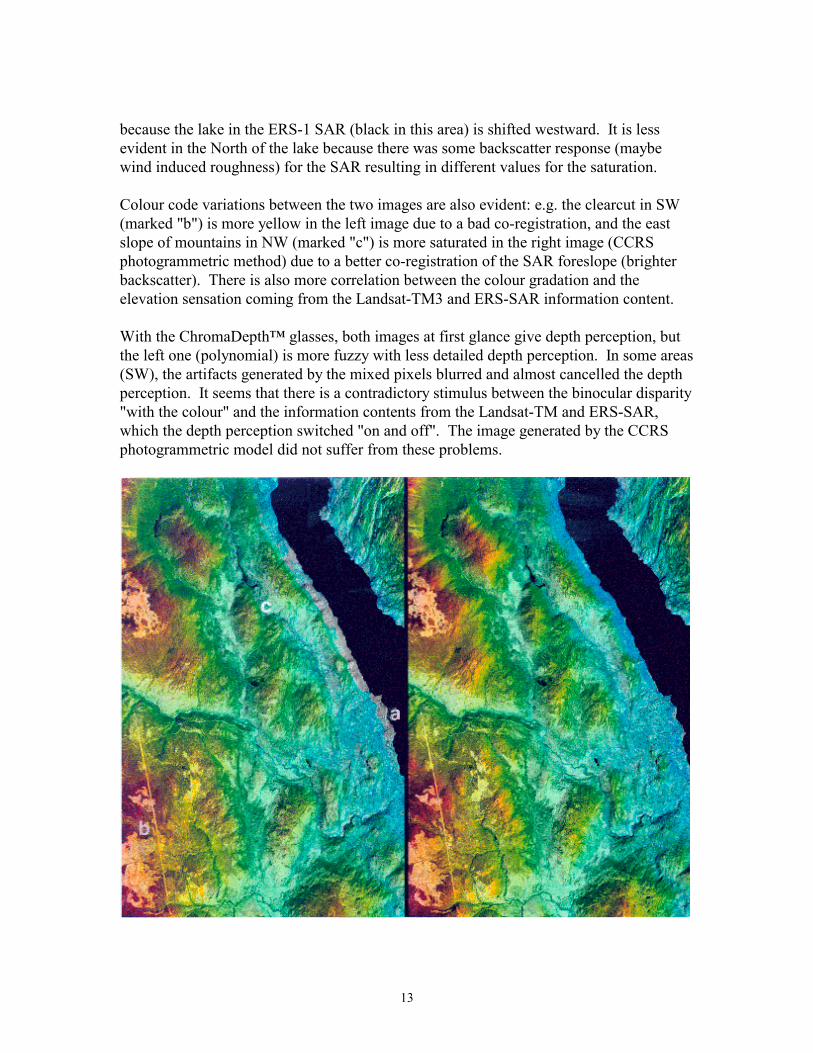
13
because the lake in the ERS-1 SAR (black in this area) is shifted westward. It is lessevident in the North of the lake because there was some backscatter response (maybewind induced roughness) for the SAR resulting in different values for the saturation.
Colour code variations between the two images are also evident: e.g. the clearcut in SW(marked "b") is more yellow in the left image due to a bad co-registration, and the eastslope of mountains in NW (marked "c") is more saturated in the right image (CCRSphotogrammetric method) due to a better co-registration of the SAR foreslope (brighterbackscatter). There is also more correlation between the colour gradation and theelevation sensation coming from the Landsat-TM3 and ERS-SAR information content.
With the ChromaDepth� glasses, both images at first glance give depth perception, butthe left one (polynomial) is more fuzzy with less detailed depth perception. In some areas(SW), the artifacts generated by the mixed pixels blurred and almost cancelled the depthperception. It seems that there is a contradictory stimulus between the binocular disparity"with the colour" and the information contents from the Landsat-TM and ERS-SAR,which the depth perception switched "on and off". The image generated by the CCRSphotogrammetric model did not suffer from these problems.
14
Plate 1: Chromo-stereoscopic images (21 x 33 km; 30-m pixel spacing) generated with2nd order polynomial method (left) and CCRS photogrammetric method (right).
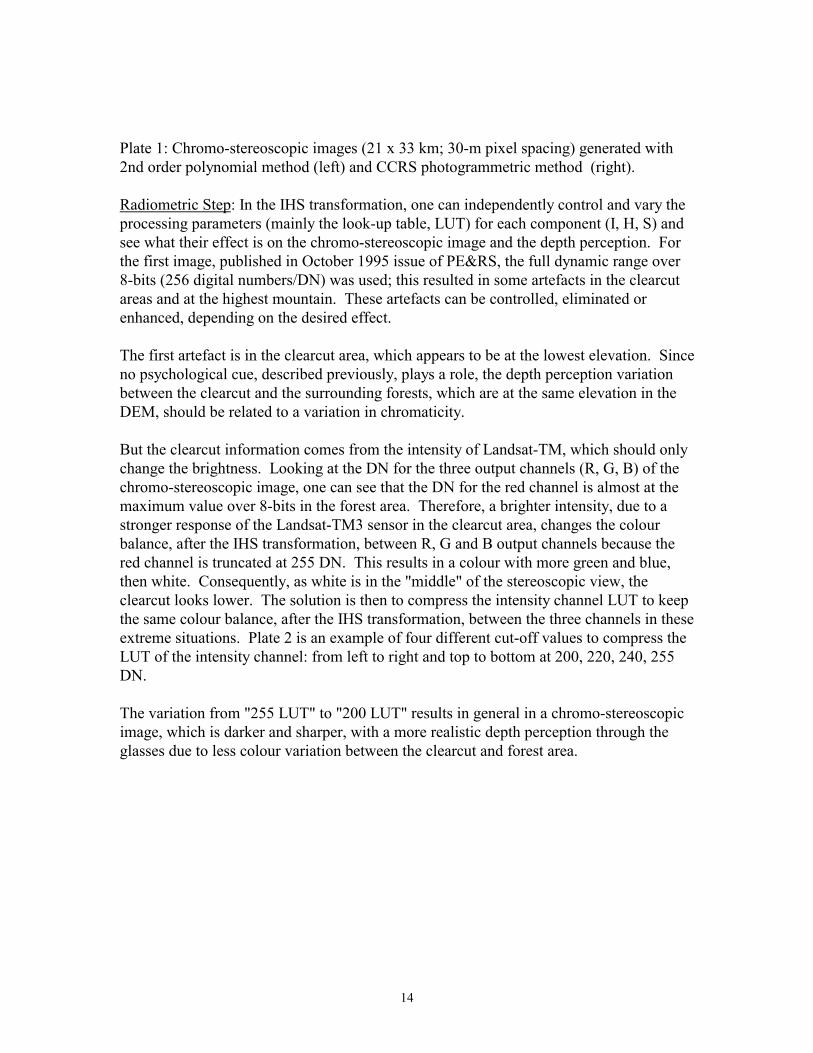
Radiometric Step: In the IHS transformation, one can independently control and vary theprocessing parameters (mainly the look-up table, LUT) for each component (I, H, S) andsee what their effect is on the chromo-stereoscopic image and the depth perception. Forthe first image, published in October 1995 issue of PE&RS, the full dynamic range over8-bits (256 digital numbers/DN) was used; this resulted in some artefacts in the clearcutareas and at the highest mountain. These artefacts can be controlled, eliminated orenhanced, depending on the desired effect.
The first artefact is in the clearcut area, which appears to be at the lowest elevation. Sinceno psychological cue, described previously, plays a role, the depth perception variationbetween the clearcut and the surrounding forests, which are at the same elevation in theDEM, should be related to a variation in chromaticity.
But the clearcut information comes from the intensity of Landsat-TM, which should onlychange the brightness. Looking at the DN for the three output channels (R, G, B) of thechromo-stereoscopic image, one can see that the DN for the red channel is almost at themaximum value over 8-bits in the forest area. Therefore, a brighter intensity, due to astronger response of the Landsat-TM3 sensor in the clearcut area, changes the colourbalance, after the IHS transformation, between R, G and B output channels because thered channel is truncated at 255 DN. This results in a colour with more green and blue,then white. Consequently, as white is in the "middle" of the stereoscopic view, theclearcut looks lower. The solution is then to compress the intensity channel LUT to keepthe same colour balance, after the IHS transformation, between the three channels in theseextreme situations. Plate 2 is an example of four different cut-off values to compress theLUT of the intensity channel: from left to right and top to bottom at 200, 220, 240, 255DN.
The variation from "255 LUT" to "200 LUT" results in general in a chromo-stereoscopicimage, which is darker and sharper, with a more realistic depth perception through theglasses due to less colour variation between the clearcut and forest area.
15
Plate 2: Chromo-stereoscopic images (24 x 18 km; 30-m pixel spacing) comparison byvarying the Landsat-TM3 LUT parameters of the intensity channel: from left to right andtop to bottom at 200, 220, 240 and 255 DN.
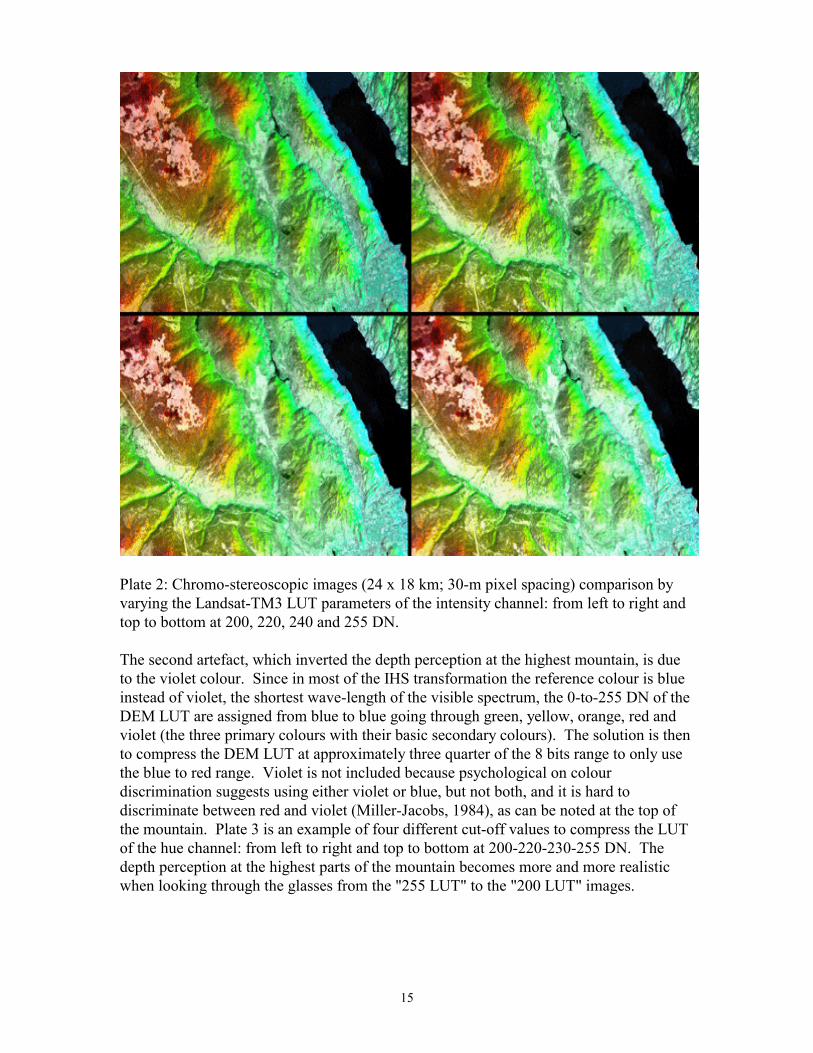
The second artefact, which inverted the depth perception at the highest mountain, is dueto the violet colour. Since in most of the IHS transformation the reference colour is blueinstead of violet, the shortest wave-length of the visible spectrum, the 0-to-255 DN of theDEM LUT are assigned from blue to blue going through green, yellow, orange, red andviolet (the three primary colours with their basic secondary colours). The solution is thento compress the DEM LUT at approximately three quarter of the 8 bits range to only usethe blue to red range. Violet is not included because psychological on colourdiscrimination suggests using either violet or blue, but not both, and it is hard todiscriminate between red and violet (Miller-Jacobs, 1984), as can be noted at the top ofthe mountain. Plate 3 is an example of four different cut-off values to compress the LUTof the hue channel: from left to right and top to bottom at 200-220-230-255 DN. Thedepth perception at the highest parts of the mountain becomes more and more realisticwhen looking through the glasses from the "255 LUT" to the "200 LUT" images.
16
Plate 3: Chromo-stereoscopic images comparison (24 x 18 km; 30-m pixel spacing) byvarying the DEM LUT parameters of the hue channel: from left to right and top tobottom, at 200, 220, 230, 255 DN.
In the colour coding with the IHS transformation, there is a linear relationship betweenthe elevation value (DN from 0 to 200) and the chromaticity (from blue to red) during thecoding of the depth in the colour. But in the colour decoding through the glasses, there isnot a linear relationship between the colour (from blue to red) and the refraction index(Figure 2) proportional to the refraction angle. Consequently, the depth perception fromthe colour through the glasses is not linearly correlated with the terrain elevation, even ifit is not perceptible qualitatively. The solution is to calibrate the DEM to the specificrefraction index variation of the glasses. But unfortunately, one does not have thecomplete optical properties of the glasses, which use double prisms with low and highdispersion materials. Calibration of the ChromaDepth� glasses' optical properties willbe addressed at CCRS in the near future. However this problem does not seem to be adrawback and thus it does not prevent the use of chromo-stereoscopy as a visualizationand depth perception tool in remote sensing.
17
Finally, the last processing parameter is related to the saturation channel in the IHStransformation. To date, bright, highly saturated hues have mainly been used. But, thereis no theoretical basis to exclude the use of less saturated hues in a display (Hoffman, et.al., 1993).
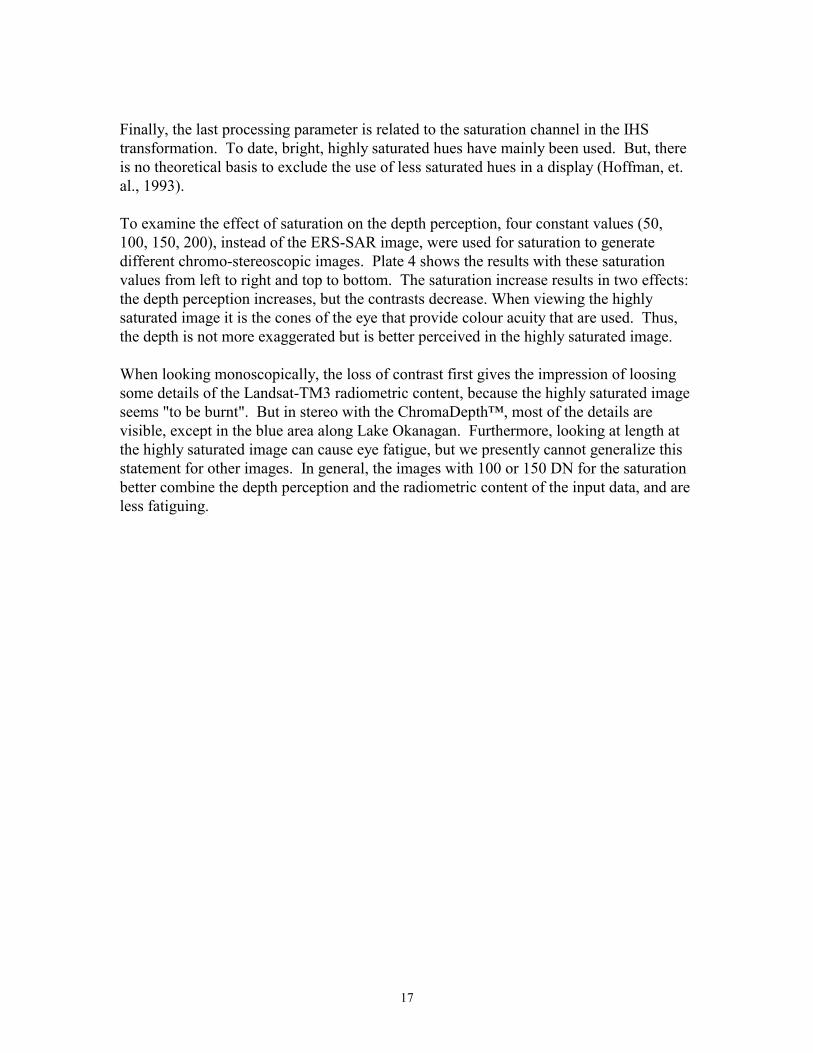
To examine the effect of saturation on the depth perception, four constant values (50,100, 150, 200), instead of the ERS-SAR image, were used for saturation to generatedifferent chromo-stereoscopic images. Plate 4 shows the results with these saturationvalues from left to right and top to bottom. The saturation increase results in two effects:the depth perception increases, but the contrasts decrease. When viewing the highlysaturated image it is the cones of the eye that provide colour acuity that are used. Thus,the depth is not more exaggerated but is better perceived in the highly saturated image.
When looking monoscopically, the loss of contrast first gives the impression of loosingsome details of the Landsat-TM3 radiometric content, because the highly saturated imageseems "to be burnt". But in stereo with the ChromaDepth�, most of the details arevisible, except in the blue area along Lake Okanagan. Furthermore, looking at length atthe highly saturated image can cause eye fatigue, but we presently cannot generalize thisstatement for other images. In general, the images with 100 or 150 DN for the saturationbetter combine the depth perception and the radiometric content of the input data, and areless fatiguing.
18
Plate 4: Chromo-stereoscopic images comparison (24 x 18 km; 30-m pixel spacing) byvarying the value of the saturation channel: from left to right and top to bottom, at 50,100, 150, 200 DN.
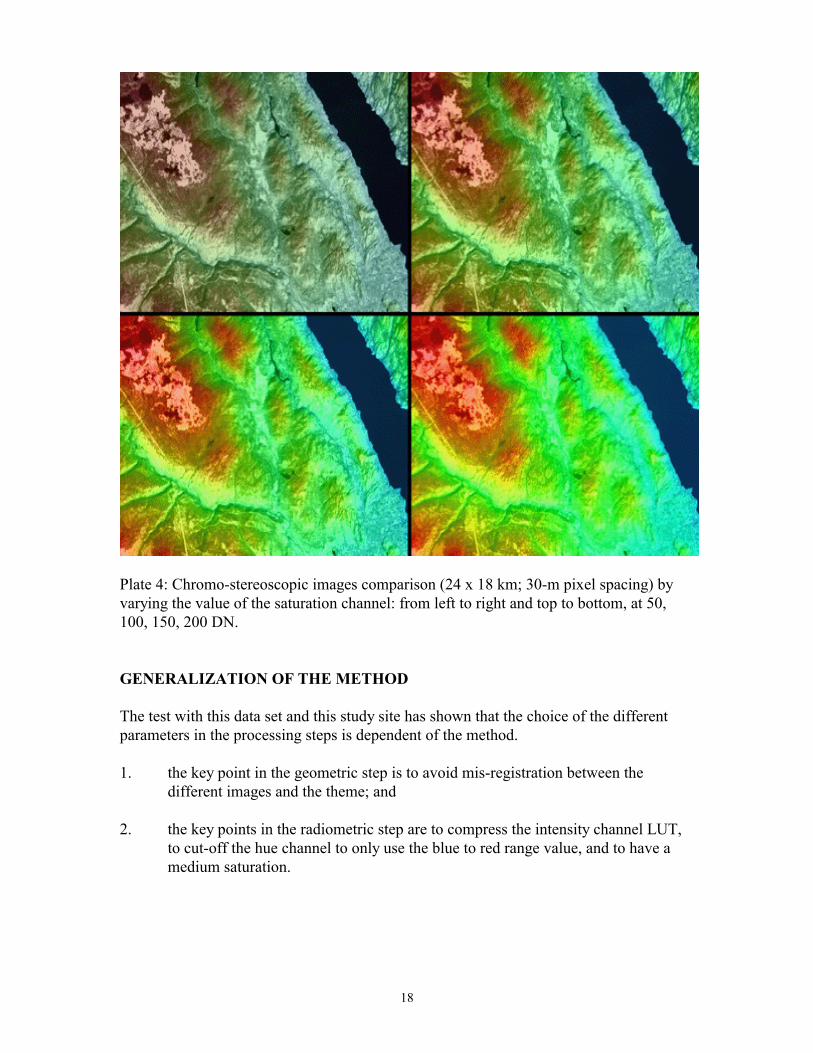
GENERALIZATION OF THE METHOD
The test with this data set and this study site has shown that the choice of the differentparameters in the processing steps is dependent of the method.
1. the key point in the geometric step is to avoid mis-registration between thedifferent images and the theme; and
2. the key points in the radiometric step are to compress the intensity channel LUT,to cut-off the hue channel to only use the blue to red range value, and to have amedium saturation.
19
Since these parameters are method dependent, they can be applied with a good level ofconfidence to other data in different configurations. Since it is impossible to show in thispaper all the chromo-stereoscopic images tested with these parameters, only the firstexample is shown (Plate 5) and the others are listed to demonstrate the applicability of themethod and its generalization to other data:
• an aerial photo and DEM over Gaspesie, Canada (5 x 5 km; 2 m pixel spacing) at1:15 000 scale;
• an ERS-1 SAR mosaicking and DEM over Vancouver Island, Canada (500 x 400 km;100 m pixel spacing) at 1: 650 000 scale;
• an ascending and descending ERS-1 SAR and DEM over the Sudbury Basin, Canada(40 x 40 km; 30 m pixel spacing) at 1: 150 000 scale;
• an aerial photos mosaicking and DEM over Ottawa, Canada (40 x 30 km; 5 m pixelsize) at 1:50 000 scale;
• an airborne SAR and a digitized bedrock geology map over Sudbury Basin, Canada(250 x 200 km; 20 m pixel size) at 1: 250 000 scale;
• a Landsat-TM, or a CCRS airborne SAR and the total magnetic field over Amazonia,Brazil (50 x 50 km, 30 m pixel spacing) at the 1:250 000 scale;
• a CCRS airborne SAR and the gravimetric field over Sudbury Basin, Canada (10 x 10km; 10 m pixel spacing) at 1:40 000 scale;
• a RADARSAT and DEM over Ottawa, Canada (20 x 20 km; 10 m pixel spacing) at1:80 000 scale;
• a shaded relief of the bathymetry over Atlantic Ocean (100 x 125 km; 40 m pixelspacing) at 1: 400 000 scale;
• an aerial photo over Parliament Hill, Ottawa, Canada (1x1 km; 0.5 m pixel spacing)at 1: 4000 scale; and
• a NOAA AVHRR mosaicking over Canada (6800 x 4700 km; 1 km pixel spacing) at1:8 000 000 and 1:25 000 000 scale.
Because only two input data types are used in these examples, the 150 value was input forthe saturation as found in the former test.
The last two examples are extreme and opposite examples in terms of area (6800 x 4700km versus 1 x 1 km), of pixel spacing (1 km versus 0.5 m) and of scale (1:25 000 000versus 1:4 000) to show the versatility of this 3-D perception tool. For each example thesame saturation value (150) was used since only two input data are used.
20
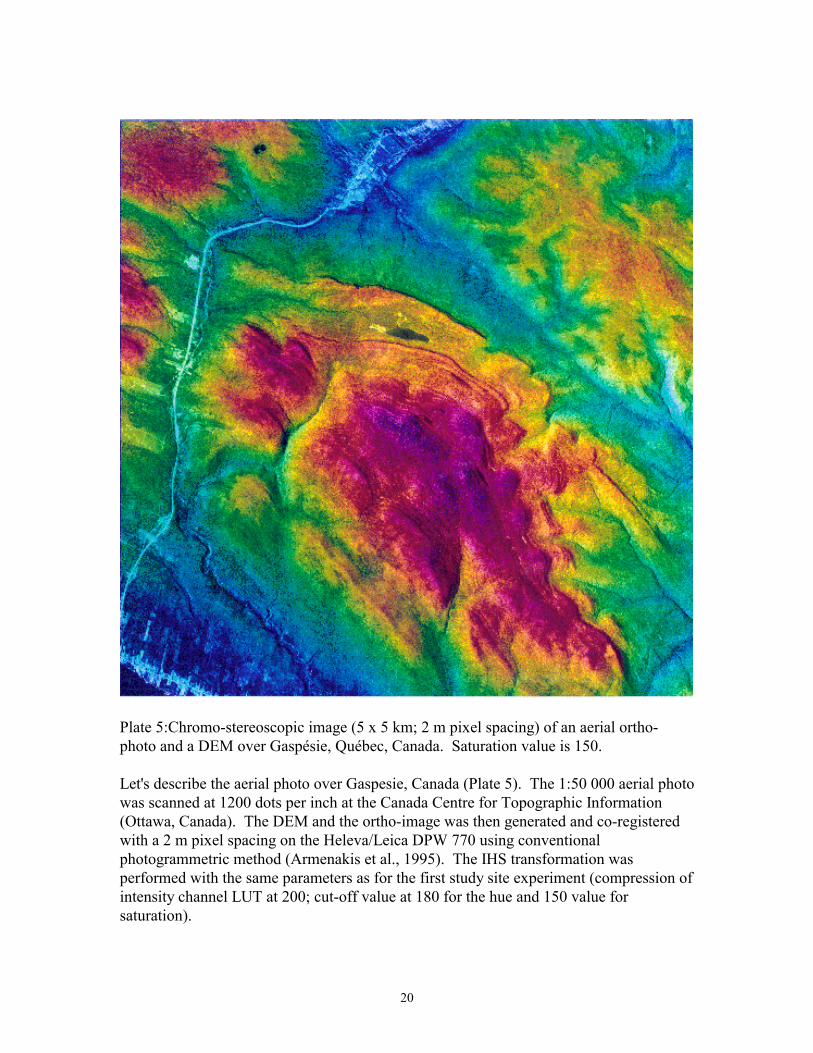
Plate 5:Chromo-stereoscopic image (5 x 5 km; 2 m pixel spacing) of an aerial ortho-photo and a DEM over Gaspésie, Québec, Canada. Saturation value is 150.
Let's describe the aerial photo over Gaspesie, Canada (Plate 5). The 1:50 000 aerial photowas scanned at 1200 dots per inch at the Canada Centre for Topographic Information(Ottawa, Canada). The DEM and the ortho-image was then generated and co-registeredwith a 2 m pixel spacing on the Heleva/Leica DPW 770 using conventionalphotogrammetric method (Armenakis et al., 1995). The IHS transformation wasperformed with the same parameters as for the first study site experiment (compression ofintensity channel LUT at 200; cut-off value at 180 for the hue and 150 value forsaturation).
21
It can be noted that "white" roads and cities appear above the ground in the blue andgreen area of the images. Since the roads and cities (mainly the buildings) are white inthe aerial photographs which are coded to the intensity channel, it results in "strongwhite" blue or green in the chromo-stereoscopic image. As mentioned before, white is inthe "middle" of the stereoscopic view, then over blue and green in the colour depth range,it explains this artefact. A contrast reduction in the aerial photographs for these featuresshould darken the original colour from the elevation coding, and should reduce thisartefact.
This two-step process can then be used with most of the 2-D data to fuse with a specifictheme and to visualize the depth with the ChromaDepth� glasses. If there is a mis-registration problem, which generates mixed pixels, larger pixel spacing can be used toreduce the relative pixel mis-registration. Applicability to data, which is already in 3-Dformat, is less evident, when combining this 3-D perception with chromo-stereoscopy.The different 3-D cues (physiological and psychological) should be consistent andgenerate the same kind of stimuli in the brain to avoid "mis-perception" andinterpretation. But if applied carefully with a good understanding of the different depthcues and the impact of the processing parameters as described previously, the samegeometric and radiometric processes should give interesting results. More research andtests have to be performed with these 3-D data.
CONCLUSIONS
This paper has presented a new and complementary tool to display, perceive and interpretmulti-source data. It combines physiological and psychological aspects of the depthperception and colour vision process, which are the main characteristics of human vision.The process which uses the effect known as chromo-stereoscopy, is straight-forward:encode depth into an image by means of colour, then decode the colours by means ofrefractive double prism optics, the ChromaDepth� glasses, producing the depthperception. As the depth perception is "synthetically" generated, any theme such aselevation, gravimetry, GIS polygon data, etc. can be used. The result is a "normal" flatcolour image, which can be viewed without glasses, but when viewed through theChromaDepth� glasses, "jumps" into 3D.
Applied to remote sensing data, a chromo-stereoscopic image has to be generated in twosteps:
1) Precise geometric correction: "precise" is essential because other geometriccorrection, like polynomial transformation, can blur the chromo-stereoscopicimage and its depth perception due to mixed pixels; and
22
2) Radiometric integration using IHS transformation, in which the theme used togenerate the depth is assigned for the hue channel. The other ortho-rectifiedimages are assigned for the intensity and saturation channels to give the textureand to enhance feature interpretability.
A compression of the LUT of the intensity channel results in a chromo-stereoscopicimage, which is darker and sharper, and with a more realistic depth perception in areaswhere large variations in the intensity occur. On the 8-bits scale 200 appears to be a goodvalue as it has been checked with different data sets. In the same way, a cut-off value(around 200-210) of the LUT of the hue channel enables us to use only colours from blue-to-red. Violet is not used due to a psychological confusion with blue. Finally, if noimage is used for the saturation channel, a constant value of 100-150 is a goodcompromise between depth and radiometric content perceptions. It also seems to be lessfatiguing than highly saturated images. These parameters are method and not datadependent, which facilitates the generalization of the method to 2-D data, and withcaution to 3-D data.
It has been shown that a good understanding of colour vision and of the depth perceptionare essential requirements to enable a better fine tuning of the processing parameters ofchromo-stereoscopy to control potential artifacts and to obtain a better depth perception.Depending on the application, the user can voluntarily play on the artifacts with theprocessing parameters to enhance some specific features as long as there is a-prioriknowledge of the terrain, of the data set, of the method and its applicability. Furtherexamples and mainly applications on the use of ChromaDepth� will be the subject of anupcoming article. It will include applications in geology, geomorphology, mapping andenvironment, as well as use of different data sources (spaceborne, airborne, VIR, SAR,aerial photographs, digital maps, etc.). National atlases and geographic books are alsovery good candidates for use of this method allowing to breathe new life into old books.Remote sensing data can be used as a back-drop to these data to add texture and forenhancement of specific themes.
REFERENCES
Armenakis, C., A.M. Regan, and A. Dow, 1995. "Softcopy PhotogrammetricApplications for National Topographic Mapping", Geomatica, Vol. 49, No. 4, pp. 433-443.
Bemis, S.V., J.L. Leeds and E.A. Winer, 1988. "Operator Performance as a Function ofType of Display: Conventional Versus Perspective", Human Factors, Vol. 30, pp. 162-169.
23
Benton, S.A., D.A. Duston-Roberge and R. Simard, 1985. "A Chromatic HolographicStereogram of Landsat MSS Data", Optical Engineering, Vol. 24, No. 2, pp. 338-340.
Braunstein, M.L., 1976. "Depth Perception Through Motion", Academic Press, NewYork, 206 pages.
Einthoven, W., 1885. "Stereoskopie durch Farbendifferenz", Albrecht von Gaefes Archivfur Ophtomologie, No. 31, pp. 211-238.
Friedhoff, R.M. and W. Benzon, 1991. "The Second Computer RevolutionVisualization", W.H. Freeman and Company, New York, 214 pages.
Gabor, D., 1948. "A New Microscopic Principle", Nature, No. 161, pp. 777-779.
Hanes, R.M. and M.V. Rhoades, 1959. "Colour Identification as a Result of ExtendedPractice", Journal of Optical Society of America, Vol. 49, pp. 1060-1064.
Hoffman, R.R., 1990. "Remote Perceiving: A Step Toward a Unified Science of RemoteSensing", Geocarto International, Vol. 5, No. 2, pp. 3-13.
Hoffman, R.R., 1991, "Human Factors Psychology in the Support of Forecasting: theDesign of Advanced Meteorolgical Workstations", Weather and Forecasting, Vol. 6, pp.98-110.
Hoffman, R.R., M. Detweiler, J.A. Conway and K. Lipton, 1993. ��Some Considerationsin Using Color in Meteorological Displays�, Weather and Forecasting, Vol. 8, pp. 505-518.
Imsand, D.J., 1986. "Three Dimensional Television Systems", US Patents No. 4-567-515.
Jones, E.R. Jr., A.P. McLaurin and L. Cathey, 1984. "VISIDEP�: Visual Image DepthEnhancement by Parallax Induction", Proceedings in Advances in Display TechnologiesIV, E. Schlam ed., SPIE 457, pp. 16-19.
Judd, D.B. and A. Eastman, 1971. "Prediction of Target Visibility from the Colours ofTarget and Surround", Illumination Engineering, Vol. 66, pp. 256-266.
Leith, E.N. and J. Upatnieks, 1964. "Wavefront Reconstruction with DiffusedIllumination and Three-Dimensional Objects", Journal of Optical Society of Americas,Vol. 54, No. 11, pp. 1295-1301.
24
Livingstone, M.S., 1988, "Art, Illusion and the Visual System", Scientific American, Vol.258, No. 1, pp. 78-85.
McCormik, E.J., 1976. "Human Factors Engineering and Design", John Wiley and Sons,pp. 62-112.
McLaurin, A.P., E.R. Jones and L. Cathey, 1988. "Advanced Alternating-FrameTechnology (VISIDEP�) and 3-D Remote Sensing", IEEE Transactions on Geoscienceand Remote Sensing, Vol. 26, No. 4, pp. 437-440.
Miller-Jacobs, H.H., 1984. "Colour Displays and the Colour Deficient Operator",Advances in Display Technology, International Society of Optical Engineering, SPIE,Vol. 457, pp. 14-15.
Okoshi, T., 1976. "Three-Dimensional Imaging Techniques", Academic Press, NewYork, 403 pages.
Pennington, U.S. and L.H. Lin, 1965. "Multicolour Wavefront Reconstruction", AppliedPhysics Lett., Vol. 7, No. 3, 56 pages.
Smith, S.L., 1962. "Color Coding and Visual Search", Journal of ExperimentalPsychology, Vol. 64, pp. 434-440.
Steenblik, R.A., 1986, 1991. "Stereoscopic Process and Apparatus Using DifferentDeviations of Different Colours", US Patents No. 4-597-634 & 5-002-364.
Toutin, Th. 1995a. "Multisource Data Fusion with an Integrated and Unified GeometricModelling", EARSeL Journal "Advances in Remote Sensing", Vol. 4, No. 2, 12 pages.
Toutin, Th. 1995b. "Intégration de données multi-sources : comparaison de méthodesgéométriques et radiométriques", International Journal of Remote Sensing, Vol. 16, No.15, pp. 2795-2811.
Toutin, Th. and B. Rivard, 1995. "A New Application for Depth Perception of Multi-Source Data", Photogrammetric Engineering and Remote Sensing, Vol. 61, No. 10, pp.1209-1211.
Ursery, L., 1993. "Virtual Stereo Display Technique for Three-Dimensional GeographicData", Photogrammetric Engineering and Remote Sensing, Vol. 50, No. 12, pp. 1737-1744.
Walko, J., 1995. "Sharp Claims Advance in 3-D Moving Images", Photonics Spectra,Vol. 29, No. 3, pp. 28-29.
25
Ware, C. and J.C. Beatty, 1988. "Using Colour Dimensions to Display DataDimensions", Human Factors, Vol. 30, pp. 127-142.
ACKNOWLEDGEMENTS
The author will like to thank Dr. Benoit Rivard of MIR Télédétection Inc. for theinteresting discussions and development on chromo-stereoscopy, and Dr. Frank Ahernand Denny Kalensky of CCRS for the review, which improves the paper. The aerialphotos over Gaspesie, Canada have been ortho-rectified by Art Dow and CostasArmenakis of CCTI. He also thanks Mr. Martin Coté of Laval University for bringing toour attention the ChromaDepth� lens. And finally, he acknowledges Chromatek Inc.,U.S.A., for providing access to their ChromaDepth� glasses in support of this research.