qualitative knowledge construction for engineering...
TRANSCRIPT

1-191
Qualitative Knowledge Construction for Engineering Systems: Extending the Design Structure Matrix Methodology in Scope and Procedure
by
Jason E. Bartolomei
B.S. Mechanical Engineering, Marquette University, 1997
M.S. Systems Engineering, Air Force Institute of Technology, 2001
Submitted to the Engineering Systems Division in Partial Fulfillment of the Requirements for the
Degree of
Doctor of Philosophy in Engineering Systems
at the Massachusetts Institute of Technology
June 2007
©2007 Jason E. Bartolomei. All rights reserved
The author hereby grants to MIT permission to reproduce and to distribute publicly paper and electronic copies of this thesis document in whole or in part.
Signature of Author_____________________________________________________________________________ Engineering Systems Division
June 15, 2007
Certified by____________________________________________________________________________________ Daniel E. Hastings
Dean of Undergraduate Education Professor of Engineering Systems and Aeronautics and Astronautics
Thesis Supervisor
Certified by____________________________________________________________________________________ Richard de Neufville
Professor of Engineering Systems
Certified by____________________________________________________________________________________ Donna H. Rhodes
Senior Lecturer, Engineering Systems
Certified by____________________________________________________________________________________ Susan S. Silbey
Professor of Anthropology Accepted by___________________________________________________________________________________
Richard de Neufville Professor of Engineering Systems Chair, ESD Education Committee

2-191
Disclaimer
The views expressed in this article are those of the author and do not reflect the official policy or position of the U.S. Air Force, Department of Defense, or the U.S. Government

3-191
Qualitative Knowledge Construction for Engineering Systems: Extending the Design Structure Matrix Methodology in Scope and Procedure
By
Jason E. Bartolomei
Submitted to the Engineering Systems Division on 15 June 2007 in Partial Fulfillment of the Requirements for the Degree of Doctor of Philosophy in Engineering Systems at the Massachusetts
Institute of Technology
Abstract
This thesis presents a new modeling framework and research methodology for the study of
engineering systems. The thesis begins with a formal conceptualization of Engineering Systems
based upon a synthesis of various literatures. Using this conceptualization, a new modeling
framework is presented called the Engineering Systems Matrix (ESM). The ESM is an improvement
to existing system-level modeling frameworks, such as the Design Structure Matrix (DSM), by
providing a dynamic, end-to-end representation of an engineering system. In support of this
contribution, a new research methodology is presented called Qualitative Knowledge Construction
(QKC). QKC can be thought of as a Bayesian-type approach to grounded theory. The methodology
integrates qualitative social science with quantitative methods by developing a procedure for
translating textual reports of observations, interview transcripts, system documentation, and figures
into coded data represented in the ESM. The thesis develops the ESM framework and the QKC
methodology in the context of a real world engineering system, a US Air Force miniature
uninhabited air vehicle (MAV) product development system.
Thesis Supervisor: Daniel E. Hastings Dean of Undergraduate Education Professor of Aeronautics and Astronautics and Engineering Systems

4-191

5-191
Acknowledgements This thesis is dedicated to my family. First and foremost I would like to thank my wife, best friend and life-partner. She is the most amazing person I have ever known. Next, I would like to thank my children, each of whom brings me the greatest joy and pride. Lastly, I would like to thank God for blessing our time at MIT and showing our family that we can do everything through Him who gives us strength.

6-191

7-191
Introduction
“Engineering Systems are increasing in size, scope, and complexity as a result of globalization, new technological capabilities, rising consumer expectations, and increasing social requirements. Engineering Systems present difficult design problem solving frameworks than those of the traditional engineering sciences paradigm: in particular, a more integrative approach in which Engineering Systems professionals view technological systems as part of a larger whole. Though Engineering Systems are varied, they often display similar behavior. New approaches, frameworks, theories, need to be developed to understand better Engineering Systems behavior and design.” (Roos 1998)
In the quote above, Roos highlights the importance of understanding the challenges posed by complex
technological systems and the need for new approaches, frameworks, and theories. This thesis
presents three contributions to the field of engineering systems. First, the thesis describes a new, high-
level conceptualization of Engineering Systems based on a synthesis of the system literature. Second,
the thesis presents a new modeling framework for representing Engineering Systems to improve on
existing systems modeling frameworks. Third, the thesis presents a new methodology for building
models of complex systems that bridges qualitative and quantitative methods of analysis. The thesis
demonstrates these ideas in the analysis of a real-world engineering system, a US Air Force miniature
uninhabited air vehicle (MAV) product development system.
Chapter 1 begins with a brief review of the systems literature to sensitize the reader to various sub-
fields devoted to the study of systems. The chapter reviews several typologies for systems and
discusses their limitations for classifying complex social and technical systems. The chapter concludes
with a review of three bodies of literature devoted to the study of complex social and technical
systems: socio-technical systems theory, large technological systems theory, and the burgeoning
literature on engineering systems. Based on a synthesis of these bodies of literature, a new description
of an engineering system is presented.
Chapter 2 presents a high-level conceptualization of an engineering system that builds upon the
ideas presented in Chapter 1. A conceptualization is an abstract, simplified view of the world that we
wish to represent for some purpose. This chapter argues that an engineering system can be
conceived as a socially constructed, purposeful open system that consist of interacting components
spanning the social, functional, technical, and process domains and changing over time. The
conceptualization presented is this chapter contributes to the literature as it moves beyond existing
descriptions of Engineering Systems by formalizing several concepts, including definitions of

8-191
Engineering Systems domains, examination of domain interaction, definition of levels of complexity,
and the dynamic nature of these systems.
The first half of Chapter 3 examines the limitations of scope of existing modeling frameworks to
represent an engineering system as defined by the conceptualization presented in Chapter 2. The
analysis concludes that each framework fails to sufficiently represent systems-level interactions
within and across the Engineering Systems domains or to effectively capture the lifecycle dynamics
of a system. The second half of the chapter explores the implications of socially constructed
knowledge for the study of Engineering Systems and the limitations of existing systems engineering
modeling methods for bridging qualitative and quantitative divides.
Chapter 4 presents a new modeling framework, the Engineering Systems Matrix (ESM), to address
the limitations of scope presented in Chapter 3. The ESM is a formal knowledge representation
framework that presents a time series, end-to-end representation of an engineering system.
Chapter 5 presents a new methodology for modeling complex systems called qualitative knowledge
construction (QKC). The methodology addresses the procedural limitations used to construct
traditional systems models by applying a Bayesian-like approach to grounded theory. This chapter
contrasts grounded theory and qualitative knowledge construction and presents an example to
demonstrate the methodology.
Chapter 6 demonstrates the methodology by constructing an ESM for a real-world engineering
system, a US Air Force miniature uninhabited air vehicle product development system (MAV-PD).
This chapter provides a step-by-step examination of the QKC procedures presented in Chapter 5
culminating in the construction of an ESM of the system that represents ~3 years of the system’s
development history.
Chapter 7 explores how the new methodology and modeling framework can be used for learning
about Engineering Systems like the MAV-PD both qualitatively and quantitatively. Qualitatively, the
methodology leads to a number of observations about the MAV-PD that serve as a basis for
developing researchable questions for future research. Quantitatively, the ESM provides a means to
apply various well-established analysis methods such as classic Design Structure Matrix (DSM),

9-191
network models, and a variety of other analytical methods. Lastly, limitations of the methodology and
future extensions are discussed as well.

10-191

11-191
Chapter 1 – Precursors for the Study of Engineering Systems
In recent years, several bodies of knowledge have emerged using a systems approach for organizing
and interpreting the world. The systems view gives a distinct view of humans and nature. (Laszlo
1972)1 The systems approach contrasts with more traditional, reductionist view. Rather than
disaggregate systems into simpler and simpler parts, the systems approach embraces a holistic view of
the world. (Popper 1961; Popper 1972; M'Pherson 1974) A classic definition of a “system” is the
integration of a set of elements into an orderly whole that functions as an organic unity. (Simon 1962;
Marchal 1975; Rescher 1979) The organic unity displays holistic properties greater than the sum of the
parts, which are defined as “emergent” properties. (Simon 1962; Bertalanffy 1968; M'Pherson 1974;
Moses 2004)
A holistic view has been useful to understand various phenomena; including efforts to understand the
social (Parsons 1964; Miller 1978), biological (Bertalanffy 1968; Miller 1978; Kitano 2002), economic
(Boulding 1956; Forrester 1961), ecological (Pielou 1969; Graedel and Allenby 2003), historical (Callon
1990; Hughes 1990; Hughes 1998), political (Quade and Boucher 1968; Vickers 1983; Allison and
Zelikow 1999), organizational (Beer 1967; Ackoff 1973; Senge 2006) and technical (Weiner 1948;
Buede 2000; Sage and Armstrong 2000). Consequently, several systems sub-fields have emerged
spanning disciplinary boundaries as scholars have found different types of problems require diverse
knowledge to understand that problem.
Figure 1 is a sampling of the various systems-related sub-fields devoted to the study of social and/or
technical phenomena using systems-based approaches. The solid horizontal line represents the
disciplinary bounds, represented by the boxes on the top of the pages, spanned by the sub-field with
representative citations for each. The dotted lines connecting the solid lines show that the sub-fields
are related.
1 An introductory survey of the systems literature can be found in Gerald Midgley’s (2003) four volume compilation of 76 seminal papers from many of authors mentioned. For those interested in the history of the systems tradition in various disciplines should read Hammond (2003), Umpleby and Dent (1999), Francois (1999), Checkland (1999), Richardson (1991), and Warfield (1990). For those interested in a survey of the philosophical debates surrounding systems should read M’Pherson (1974), Laszlo (1972), and Warfield (1990) who trace systems thought in philosophy from antiquity to present.

12-191
Efforts to Classify Types of Systems:
Despite falling short of the goal of a grand unified theory of systems, a skeleton for a science of
systems is beginning to emerge.2 Within this skeleton are various efforts to develop typologies for
classifying different types of systems intended to transcend disciplinary boundaries represented by
Figure 1. James Greer Miller (1978) classified systems as concrete, abstract, and conceptual. For Miller,
concrete systems are those that “consist of a non-random accumulation of matter and energy, in a
region in physical space-time…organized into co-acting, interrelated subsystems and components.”
Abstracted systems are representations of concrete systems based on an observer’s interests,
theoretical view point or philosophical bias. Conceptual systems are theoretical systems that “may be
purely logical or mathematical, or its terms and relationships may be intended to have some sort of
formal identity or isomorphism with units and relationships empirically determinable by some
operation carried out by an observer, which are selected observable variables in a concrete or
abstracted system.” (Miller 1978) From this classification, he develops an elaborate conceptual system
framework for what he calls “Living Systems” that has served a basis for studies in the behavioral
sciences.
2 Advancement in systems studies is not without challenges. Troncale, L. R. (1985). "The Future of General Systems Research: Obstacles, Potentials, and Case Studies." Systems Research 2(1): 43-84. highlights several of these challenges along with 33 obstacles in his paper “The Future of General Systems Research: Obstacles, Potentials, Case Studies.” He observes that scholars have difficulties spanning disciplinary boundaries in sharing different concepts, definitions, and knowledge; and he argues there are too few forums of exchange. The result is scholars often find themselves isolated to their knowledge domain, asking questions that have already been answered and rediscovering systems concepts previously defined in other subfields and disciplines.

13-191
Figure 1: A Sampling of Systems Sub-Fields Across the Sciences (Rasmussen, Pejtersen et al. 1994) (Shannon 1948) (bHall 1962) (Sage 1992) (Maier and Rechtin 2000) (Ulrich and Eppinger 2000) (Suh 1998) (Otto and Wood 2001) (Deming 1986) (Juran and Godfrey 1999)
(Ono 1988) (Hillier and Lieberman 2005) (Ackoff 1973) (Churchman 1971) (Quade and Boucher 1968) (Hughes 1990; Hughes 1998) (Mayntz, Hughes et al. 1988) (Bijker, Hughes et al. 1987; Bijker 1995)
(Simon 1982) (Katz and Kahn 1966) (Allison and Zelikow 1999) (Argyris and Schon 1978) (Senge 2006) (Von Neumann and Morgenstern 1953; Schelling 1963; Wasserman and Faust 1994) (Epstein, Axtell
et al 1996) (Axelrod 1984) (Bertalanffy 1968; Miller 1978; Vickers 1983) (Boulding 1956) (Forrester 1961) (Sterman 2000) (Ashby 1963; Beer 1967) (Weiner 1948) (Graedel and Allenby 2003) (Kitano 2002)

14-191
Kenneth Boulding (1956) classified systems using nine levels of complexity ranging from simple crystal
structures to the metaphysical. Level 1 described static structures and includes systems like crystals
and bridges. Level 2 was the Clock-works level that included systems with predetermined motion and
equilibrium (clocks, machines, solar system). Level 3, Control mechanisms, included closed-loop,
feedback systems like thermostats and homeostatic mechanisms in biological organisms. Level 4
described open systems, or systems that exchanged information, energy, or material with an
environment. Open system included biological cells and flames. Level 5 described lower organisms
including plants. Level 6 described animals with cognition. Level 7 described “Human”, which differs
from animals by the possession of human cognition. Level 8 are socio-cultural systems with a special
emphasis on social interactions. Level 9 represent transcendental systems, or the level of inescapable
knowables.
Jordan (1968) proposed a specific taxonomy for concrete systems based on three system properties,
namely rate of change (structural/functional), purpose (purposeful/non-purposeful), and connectivity
(mechanical/organismic). The morphology of these properties produces eight different types of
systems ranging from a rock formation, to social organizations, to human conceived technical systems.
(Jordan 1968) See Figure 2.
Rate of ChangeStructural (static)
Functional (dynamic)
PurposePurposeful
Non-purposeful
ConnectivityMechanistic
Organismic
1. Structural, Purposive, Mechanistic (A road network)
2. Structural, Purposive, Organismic (A suspension bridge)
3. Structural, Non-Purposive, Mechanical (A mountain range)
4. Structural, Non-Purposive, Organismic (A bubble)
5. Functional, Purposive, Mechanical (A production line)
6. Functional, Purposive, Organismic (Living organisms)
7. Functional, Non-Purposive, Mechanical (Changing flow of water resulting from change in river bed)
8. Functional, Non-purposive, Organismic (The space-time continuum)
Figure 2: Jordan's Taxonomy
Peter Checkland proposed a typology that includes five classes of systems natural, designed physical,
designed abstract, human activity, and transcendental. (Checkland 1999) Natural systems are those
systems whose origins are in the origin of the universe; these include the solar system, plants, and
other living organisms. Designed physical systems are human made, concrete systems that are designed

15-191
for some human purpose. Design abstract systems include mathematics, poems, and philosophy.
Human activity systems encompass a broad category of systems that consist of humans interacting
with each other and can include natural systems and designed systems. Like Boulding, he defined
transcendental systems as systems beyond human knowledge.
Another Type of System: The Complex Social AND Technical System
Some systems do not seem to fit nicely in any of the existing typologies. Take for instance a
community hospital. Most would agree that a hospital is a complex system in that it consists of many
interacting parts that exhibit well-defined albeit often poorly understood behaviors. However, if one
considers the hospital’s organizational components, infrastructure, technological devices, and the
processes as constituent parts of the system, it becomes difficult to classify within the existing
typologies. For example, when considering Jordan’s taxonomy, a hospital exhibits both mechanistic
(e.g. technical components) and organismic (e.g. social components) properties, as well as both
structural (e.g. hospital infrastructure) and functional (e.g. operating procedures) properties. A hospital
seems to span several of Checkland’s system types in that a hospital consists of components that span
the human activity (e.g. surgery) and designed concrete (e.g. medical device) classes of systems. This
suggests that there is another class of systems; systems that simultaneously span the social and
technical domain. In the literature, these systems have been called several names ranging from socio-
technical systems (Trist and Bamforth 1951), large technological systems (Hughes 1983), to more
recently Engineering Systems (Moses 2004).
Large Technological Systems
Thomas Hughes develops a comprehensive description for complex social and technical systems he
calls Large Technological Systems (LTS) that builds on many concepts from systems theory. (Hughes
1983; Hughes 1987; Hughes 1990; Hughes 1998) Hughes presents a description of the qualities of
LTS, rather than a precise definition. Hughes describes LTS as a seamless web of diverse components
that span several domains. LTS components include physical artifacts (technical), legislative artifacts
(constraints), organizations (social), and natural resources. Hughes defines LTS as open systems that
interact within an environment. For Hughes, the environment consists of two types of factors, those
that are dependent and those that depend on the system. An LTS is distinguished with its
environment by the limits of control exercised by the system’s components. These limits of control
define the system boundary.

16-191
Hughes defines LTS as purposeful systems that exist to solve problems or fulfill goals, having mostly
to do with “reordering the physical world in ways considered useful or desirable.”(Hughes 1987) He
adds that unlike the “other disciplines of art, architecture, medicine, and play”…LTS are “usually
concerned with the reordering of the physical world to make it more productive of goods and
services.” Hughes also describes a concept, referred to in this research as traceability. Traceability
implies that all functioning components of the system “contribute directly or through other
components to the common system goal” (Hughes 1987:51) or purpose. Hughes pays particular
attention to large-scale systems. Hughes refers to large scale systems as those technological systems
that are society-shaping and he offers several examples of this type of system, such as the U.S. Electric
Power Grid.
The concept of system structure is discussed as both the social and technical components of the
system display hierarchical structure. He explains that “the inventors, organizers, and managers of
technological systems mostly prefer organizational hierarchy.” (Hughes 1987:55) As a result, over time
the technical artifact will tend to a hierarchic structure as well. Hughes discussion of hierarchy aligns
well with Herbert Simon’s (1962) discussion of “The Architecture of Complexity.”
In addition to defining and understanding the structure of LTS, Hughes places a particular emphasis
on the dynamic behavior of the system. Through his work, he successfully demonstrates that certain
system behaviors can only be understood as socio-technical phenomena. He cautions researchers to be
careful to select the level of analysis, particularly for hierarchic systems, as in the case of “large
technological systems there are countless opportunities for isolating subsystems and calling them
systems for purposes of comprehensibility and analysis.” Although he does not use the word, Hughes
describes the concept of nested complexity, or the behavioral complexity exhibited between
subsystems, at the various levels of a hierarchical systems. Hughes warns that the risk of not carefully
understanding the appropriate levels of analysis can lead to “only a partial, or even distorted, analysis
of system behavior.”
Hughes introduces several system behaviors in his discussion of the patterns of the evolution of LTS.
In particular, he develops several concepts and explains various system behaviors that involve social
and technological interactions, including invention, innovation, development, momentum, and reverse
salients and several others. Hughes uses the LTS conceptualization as a “less elegant but useful”
systems approach for understanding the history of technology. (Hughes 1987:Note 1) The focus on

17-191
describing and understanding systems phenomena through a careful examination of the past
distinguishes LTS from the next social and technological conceptualization provided by the
burgeoning field of Engineering Systems, which emphasizes the design, development, and
management of this type of system.
Hughes builds on the concept of Large Technological Systems in his writing that includes Rescuing
Prometheus (Hughes 1998), American Genesis (Hughes 1990) and Networks of Power (Hughes 1983;
Hughes 1990) In Rescuing Prometheus, Hughes documents the human endeavor to construct Large
Technological Systems through the examination of four “monumental projects that changed the
modern world.” The list of projects included the development of ARPANET the precursor to the
internet, the US intercontinental ballistic missile project, the US air defense system, and Boston’s “Big
Dig” central artery construction project. Characteristics of these endeavors were “transdisciplinary
teams of engineers, scientist, and managers,” the integration of diverse and heterogeneous components
arranged together in innovative ways, the rise of systems builders who are able to span disciplinary and
functional boundaries (including the political and economic) and the centrality of the systems
approaches that helped systems builders to cope with the social and technological complexity.
In American Genesis, Hughes tells the story of America’s technological revolution since 1870. In it,
he explores the advent of mass production, new industrial technologies, and consumer products that
both shaped and was shaped by society. In Networks of Power, he describes the social and
technological implications of the introduction and availability of electricity to western society during
the years of the late 19th and early 20th centuries. In these historical accounts, Hughes reveals the links
between technology and society through unraveling the complexities of these relationships through the
significant challenges facing engineers, managers, and policymakers responsible for constructing and
managing these systems.
Hughes contends that the story of these unprecedented large-scale technological systems is as much
about the innovations offered by systems approaches in technical integration and management, as it
was the advancement of engineering and science. Based on his research, Hughes observes that the
engineers and scientists leading the projects found that the non-technical (management, politics, social)
presented the more difficult challenges than the technical.
18-191
Others in the fields of history of technology, history of science, and science, technology, and society
have contributed to the technological systems concept. For example, Pinch and Bijker explore the
implications of the social construction of technology both in terms of synthesizing artifacts, but also
the knowledge surrounding the technological. (Pinch and Bijker 1987) Callon, Bijker, and others
examine the sociological consequences of the development of technology on technical artifacts,
culture, and society. (Hughes 1983; Bijker, Hughes et al. 1987; Callon 1990; Bijker 1995)
Social-Technical Systems Theory
In management, Trist and Bamforth (1951) presented a similar conceptual framework for
understanding complex social and technical systems. Trist and Bamforth located at the Tavistock
Institute studied the British coal mining industry. (Trist and Bamforth 1951; Trist 1953) They
developed a socio-technical systems conceptual framework for understanding social organizational
behavior moved beyond simply observing social interactions, but included explicit consideration of
work-tasks and technical systems as well. (Badham, Clegg et al. 2000) Their work began a sub-
discipline within industrial psychology and has since exported several concepts and theories to other
disciplines including organization studies, human factors engineering, and management.
Emery provides an overview of the basic concepts underlying socio-technical systems theory in his
paper entitled, “Characteristics of Socio-Technical Systems”. (Emery 1993) Emery describes socio-
technical systems as open systems or systems that interact with an environment. Like LTS, the
concept of purpose is a particularly important as the socio-technical systems consist of
social/organizational components and technical components that interact as a means to
achieve the ends or purpose of the system, usually the production of a good or delivery of a service.
Central to socio-technical systems theory is the development of better theories to inform work
relationships structures, human task and task interdependencies, and organizational structures that
contribute to the production process. In particular, the sub-discipline is devoted to understanding
the social psychological factors associated with human-machine interactions (level of automation),
team structures, and industrial organizational strategies.

19-191
Engineering Systems
In recent years, a community of interdisciplinary scholars has embarked on a new interdisciplinary
endeavor that is currently described as Engineering Systems (ES). The genesis of this endeavor was in
response to the growing complexity of human technological endeavors and the insufficiency of
theoretical knowledge and understanding to guide engineers, managers, and policy makers responsible
for the design and management of these systems. It is a simultaneous emphasis on developing
normative (how they should be), descriptive (how they are), and prescriptive (how to make them
better) knowledge that distinguishes ES from the other disciplines in that the ES community is
interested in developing systematic and rigorous theories and methods about the structure and
behavior of complex social and technological systems so as to positively affect the design,
development, and management of these systems.
Conceptually, it seems that there is a strong similarity between Hughes’ LTS and the characteristics
of Engineering Systems. Like LTS, Engineering Systems:
- Are composed of interacting technical and social/organizational components that exists within an economic, legal and political context (Murman and Allen 2002; Allen, Nightengale et al. 2004; Moses 2004)
- Are systems of purpose (Moses 2004) that is defined and valued by human entities (Magee and de Weck 2002; Murman and Allen 2002)
- Are large scale or consist of many interacting parts that exhibit non-trivial behavior (Sussman 2002; Moses 2004)
- Are complex or exhibit structural, behavioral, and/or interface complexity (Sussman 2002; Moses 2004; Whitney, de Weck et al. 2004)
- Evolve with varying rates of change (de Neufville, de Weck et al. 2004; Moses 2004)
- Exhibit emergent properties (Allen, Nightengale et al. 2004; Moses 2004)
- Are open system (Sussman 2000)
Because ES scholarship goes beyond the study of complex social and technological systems as objects
of history, the community has developed several additional concepts and characteristics related to
design, development, and management. Moses (2004) highlights several of these concepts in his
paper, “Foundational Issues in Engineering Systems: A Framing Paper.” In it, he includes several ES-
centric themes (discussed more thoroughly in the corresponding citations) that includes system

20-191
architecture (Whitney, de Weck et al. 2004), uncertainty (de Neufville, de Weck et al. 2004)¸ change
management, a forward looking life-cycle perspective, and non-traditional systems properties he
calls –ilities.
(Moses and Allen 2002) argue the success of ES as a discipline will require deeper knowledge and new
theories that describe both social and technical interactions, better methods for observation, and new
analytical techniques. As such, the ES community places special emphasis on quantitative analysis,
modeling and simulation, and qualitative analysis to learn about these types of systems. Within
these themes, the ES community seeks to develop and apply more rigorous systems concepts and
formalizations than those presented by Hughes.
Contrasting Large Technological Systems Theory, Socio-Technical Systems Theory, and Engineering Systems Theory:
When reading the descriptions of LTS, Socio-technical systems and engineering system and the
particular areas of interests for each sub-discipline, there are many similarities and a few differences.
Figure 3 is a synthesis that compares each discipline on a variety of criteria that surfaced from the
review of each literature.
Figure 3: Contrasting Large Technological Systems Theory, Socio-Technical Systems Theory, and
Engineering Systems
MultipleSmallLargeScale
YesUncertainYesDynamics
YesYesYesInteractions
YesNoNoUncertainty
YesYesYesEnvironment Domain
YesLimitedLimitedTechnical Domain
YesYesYesSocial Domain
YesLimitedLimitedFunctional Domain
YesYesYesProcess Domain
EngineeringSystems
Socio-Technical Systems Theory
(Trist and Bamforth)
LargeTechnological Systems
(Hughes)

21-191
Each field seeks to understand the human element of the system represented as the social domain.
From a technical perspective, the engineering system community is devoted to both the description
and prescription of the technical components of the system, whereas the LTS and Socio-technical
Systems communities are predominately social scientists interested in primarily in descriptions of the
technical domain. Each field emphasizes the process domain which includes work tasks, design
processes, and various other activities performed within or by a system. Each field recognizes that
these are systems of purpose. The objectives (goals, purposes) form the system’s functional domain.
Because of its design-oriented nature, many in Engineering Systems emphasize decomposing the
functional domain in order to explore design alternatives and to document the system architecture of
the system. Each field treats these systems as open systems and seeks to better understand how these
systems interact with exogenous factors resident in an environmental domain. The system
interactions are of particular importance as each field seeks to better understand the structure and
behavior of these systems. The scale of the systems of interest varies across the fields. LTS focuses
primarily on large, society-shaping systems, socio-technical system emphasize much smaller systems
and organizations (e.g. a coal mine operation), and the Engineering Systems literature has interests in
understanding systems of varying levels of complexity. LTS and ES place particular interest on the
dynamic behavior of these systems each with a different twist. For LTS, the dynamics of the system
describes how the system changed over time, where as in engineering system, dynamics not only seeks
to understand “how” and “why” a system changed, but also how a system might change in the future.
This leads to the last concept, uncertainty. ES, unlike the other two fields, places special emphasis on
uncertainty in these systems as a means for looking forward in predicting system behavior so as to
affect with system with better policies, designs, and management strategies.
Unifying Large Technological Systems, Socio-Technical Systems, and Engineering Systems
From an ontological perspective, scholars from these three disciplines seem interested in observing
and understanding the same type of system. Each field may have varying goals and interests, but the
essential characteristics of the systems of interest are shared. For the remainder of this thesis, large
technological systems, socio-technical systems, sociotechnological systems, and Engineering Systems
will be referred to as engineering systems. The next chapter seeks to move beyond mere description
towards a formal conceptualization of an engineering system that moves builds upon the themes and
characteristics presented in this chapter.

22-191
Chapter 2 –Towards a Formal Conceptualization of an Engineering System
A body of formally represented knowledge is based on a conceptualization: that is, the objects,
concepts, and other entities that are assumed to exist in some area of interest and the relationships
that hold among them (Genesereth & Nilsson, 1987). A conceptualization is an abstract, simplified
view of the world that we wish to represent for some purpose. Every engineering model is derived
to some conceptualization, explicitly or implicitly. This chapter presents a conceptualization of an
engineering system and describes the concepts, classes of objects, and relationships for an
engineering system.
This conceptualization builds upon the systems literature presented in Chapter 1 and is intended as an
attempt at a formal conceptualization. The goal for this model is to provide an ontological framing to
guide endeavors to observe and model engineering systems. The conceptualization presented is this
Chapter is an intellectual contribution as it moves beyond existing descriptions of Engineering Systems
by formalizing concepts including identification and definition of the Engineering Systems domains,
examining domain interaction, and defining levels of complexity. In addition, it is an improvement
upon existing models of Engineering Systems that fail to represent the system as an integrated whole
(i.e., architecture frameworks present fragmented views) or fail to adequately represent time.3
Engineering System Domains
An engineering system has the basic characteristics and properties as those defined by socio-technical
system theory, large technological systems, and engineering systems, with some distinctions that will be
highlighted in the discussion below. Two examples of engineering systems, a community hospital and
a product development system, are presented to explain the relevant concepts.
3 Limitations of existing conceptual models of Engineering Systems are discussed in Chapter 3.

23-191
Figure 4: Basic Conceptualization of an Engineering System
As represented in Figure 4, Engineering Systems are composed of concrete and abstract
components that span both social and technical domains. Each domain (social, functional, technical
process, and environment) and the interaction between them are discussed in the following sections
using the two example presented in figures 5 and 6.
Figure 5: Hospital
Figure 6: Product Development System
A hospital can be represented as an engineering system if one considers the organization, processes,
and technology as a unified whole contributing to the purpose of the system. Chapter 6 presents an
analysis of a real-life engineering system, a miniature uninhabited air vehicle development project
(MAV-PD) managed by the US Air Force Research Laboratory. The MAV-PD can also be
conceived as an engineering system if one considers the organizational, process, and technical
components as a unified whole contributing to the objectives of the system.
Technical DomainSocial Domain
Environmental Domain
Functional Domain
Process Domain
tfuture
tpresent
tpast
People
Purpose
Processes
Technology/Infrastructure
EnvironmentRegulations/Laws/
Competitors/Technology
People
Purpose
Processes
Technology/Infrastructure
EnvironmentRegulations/Laws/
Competitors/Technology
24-191
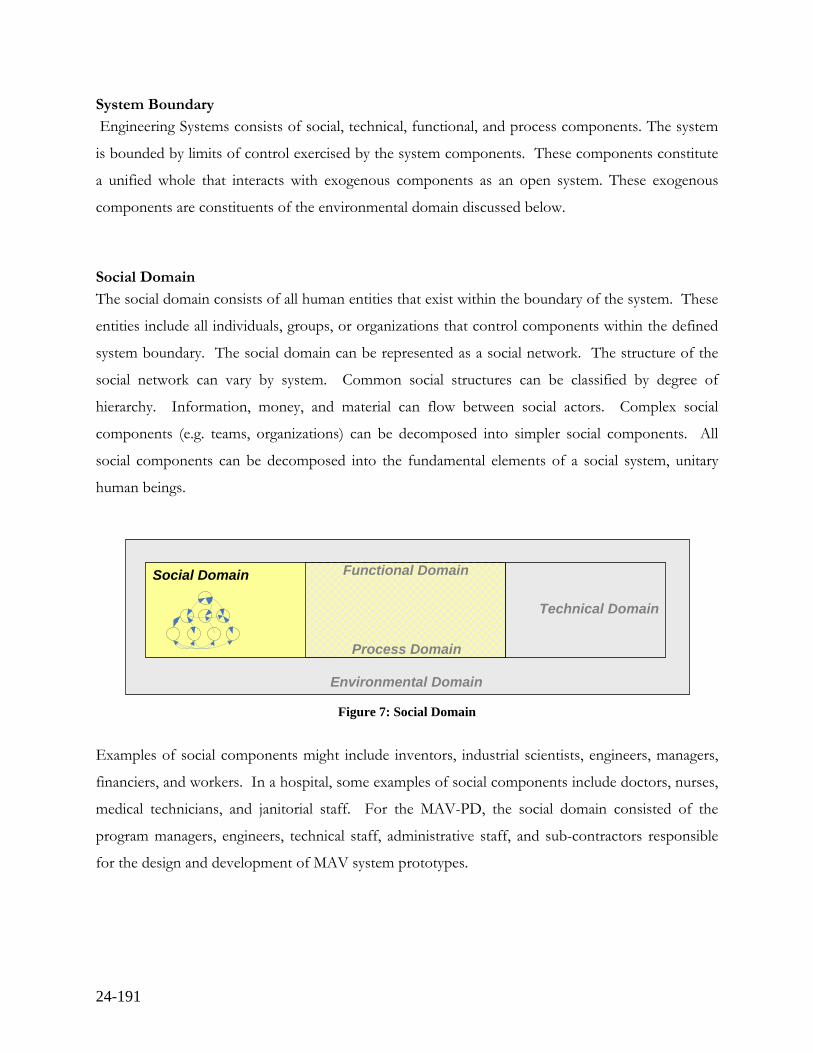
System Boundary
Engineering Systems consists of social, technical, functional, and process components. The system
is bounded by limits of control exercised by the system components. These components constitute
a unified whole that interacts with exogenous components as an open system. These exogenous
components are constituents of the environmental domain discussed below.
Social Domain
The social domain consists of all human entities that exist within the boundary of the system. These
entities include all individuals, groups, or organizations that control components within the defined
system boundary. The social domain can be represented as a social network. The structure of the
social network can vary by system. Common social structures can be classified by degree of
hierarchy. Information, money, and material can flow between social actors. Complex social
components (e.g. teams, organizations) can be decomposed into simpler social components. All
social components can be decomposed into the fundamental elements of a social system, unitary
human beings.
Figure 7: Social Domain
Examples of social components might include inventors, industrial scientists, engineers, managers,
financiers, and workers. In a hospital, some examples of social components include doctors, nurses,
medical technicians, and janitorial staff. For the MAV-PD, the social domain consisted of the
program managers, engineers, technical staff, administrative staff, and sub-contractors responsible
for the design and development of MAV system prototypes.
Technical Domain
Social Domain
Environmental Domain
Functional Domain
Process Domain

25-191
Technical Domain
The technical domain consists of the technical components that exist within the system boundary.
Technical components are concrete artifacts created by humans as means to achieve some purpose.
These components can include a product that the system manufactures, as well as the infrastructure
and tools used by social components to fabricate the product. In a service oriented system, the
technical domain includes all hardware and software required to execute the services. Like the social
domain, the structure of the technical domain can vary by system. Information, material, signals,
energy, and parametric relations can exist between technical components. Complex technical
components can be decomposed into simpler technical components. All technical components can
be decomposed into concrete objects.
Figure 8: Technical Domain
Examples of technical objects include software, hardware, and physical infrastructure. In a hospital
setting, infrastructure, medical devices, and information technology are some examples of technical
components. For the MAV-PD, the technical domain consisted of facilities, tooling, materials,
information technology, and the many other components.
Functional Domain
Engineering Systems are systems of purpose. The purpose of the system is represented by the
functional domain. The goals and objectives of the system are defined by the human agents of the
systems and can be decomposed into functions that provide a verbal, non-form specific description
of what the system needs to do. All functioning components of the system contribute directly or
through other components to these functions. A function is what a system must do or accomplish
to achieve its purpose. (Fowler 1990; Suh 2001) A function is a definite, purposeful action that a
system must accomplish to achieve one of its system objectives. A functional view is important
because it provides a description of the system that is independent of form. In the design of a
system, this is particularly significant, especially early in the life-cycle as engineers do not want to
Social Domain
Environmental Domain
Technical DomainFunctional Domain
Process Domain

26-191
select a particular solution without exploring the range of alternatives. A functional view allows
people to explore innovative and non-traditional solutions to problems. (Fowler 1990; Suh 1998;
Sage and Armstrong 2000) Little and Wood (1997) define classes of functions. Pahl and Betz (1991)
define the types of flows that exist between functions. Otto and Wood (2001) explain how
functional modeling provides a basis for organizing the design team, tasks, and process.
Figure 9: Functional Domain
As such, the decomposition of goals and functions represent a class of components that connects
the social and technical domains. Therefore, an end-to-end representation of a complex engineering
system is possible as all components within the system boundary are traceable to the system goals
either directly or through the functional domain. Examples of a system goal and functional
components for a hospital might include:
Objective: To provide inpatient/outpatient health care for a small town.
Functional Components: Provide Primary Care, Provide Emergency Care, Process Medical
Information, Distribute Medicine, etc.
Technical DomainSocial Domain
Environmental Domain
Functional Domain
Process Domain

27-191
Process Domain
Figure 10: Process Domain
Another class of component exists at the intersection of the social and technical domains is the
process domain. The process domain represents the class of components that describe the work
tasks that must be performed to satisfy the system goals. All system processes, sub-processes, and
activities require social and/or technical components. Automated tasks could require only technical
components. All activities support system goals directly or through functions. Complex activities
can be decomposed into various sub-tasks. Activities may relate to other activities by passing
information and material. Examples of process components in a hospital might include: perform
cardiovascular surgery on patient A, diagnose medical condition for patient B, dispense medication
to patient B, or clean operating room after surgery. In the MAV-PD, examples of components in
the process domain include work tasks associated with the assembly of the MAV fuselage.
Interactions between System Components
The structure of an engineering system can be described by identifying the system components
across domains and the interaction between these components. From the literature and observation,
scholars and professionals have sought to understand and explain the interactions within and across
these domains. For example, in a hospital, components in the social domain define elements in the
functional domain (e.g. the board of directors define the goals for the hospital), are responsible for
operating elements in the technical domain (e.g. a radiology tech maintains management
responsibility for her x-ray device), and are participants of components in the process domain (e.g. a
surgeon performs a surgery). It is by understanding the system structure that observers are able to
understand and explain the behaviors exhibited by the system. Chapter 3 is devoted to examining
the tools and frameworks scholars have created to model these interactions.
Technical DomainSocial Domain
Environmental Domain
Functional Domain
Process Domain

28-191
Figure 11: Interactions Between Domains
Environmental Domain
An engineering system exists within an environment. The environment consists of two types of
entities, those that are dependent and those that depend on the system as described by Hughes
(Hughes 1987). Examples of environmental entities might include regulatory agencies, laws, the
natural environment, competition and others. For a town hospital, environmental entities might
include state medical regulations, town utilities, and competing medical facilities in nearby towns.
Technical Systems
Objectives/Goals
Functions
Technical Subsystems
Technical ComponentsSub-Functions
Processes
Sub-Processes
Tasks
Individual StakeholdersTeams
Organizations
Process Domain
Functional Domain
Technical DomainSocial Domain
Environmental Domain
Social/Political:External Stakeholders
CompetitorsLaws/Policies/Regulations
Physical:ResourcesWeather
Economic:Resources
Market Forces
Technological:Innovation
ObsolescenceOther Systems
Standards
Figure 12: Environment Domain

29-191
Time in Engineering Systems
Engineering system components and the corresponding environment change over time. New
components can be introduced, old components can be removed, and properties of existing
components can change over time. An engineering system exhibits emergent properties that occur as
a result of interactions between the social and technical components. These properties include many
of the –ilities defined by Moses (2004). For example, the system property “flexibility”, defined as the
measure of ease for which a system can change over time, is an emergent property of the system and
can only be understood by examining the social and technical domains. To measure flexibility, a
system analyst must understand sources of change, how change will affect the system components,
and who is responsible for authorizing and managing the change.
Figure 13: Temporal Domain
For a town hospital, system designers might want to enhance system flexibility. This may take many
forms that depend on the systems and environment. For a small town that seems to be growing,
system designers might want to design a hospital that can be easily expanded to accommodate a larger
capacity. In stable communities, with low citizen turnover, the hospital might want to maintain
flexibility with medical specialties so that as the demographics of the community change, the hospital
can more easily change staff and equipment to accommodate changing needs.
tfuture
tpresent
tpast

30-191
Hughes presents several other properties and behaviors that require an understanding of the social and
technical domains. He describes the process of invention and development as emergent behaviors of
complex social and technical systems. Hughes introduces the concept of “reverse salients” as
components in the system that fall behind or are temporally out of phase with other components.
Emergent properties, such as various system inefficiencies, are produced by effects of reverse salients.
Path dependence is another property of engineering systems. The current state of the system depends
on the previous state. One might think of an engineering system as the product of thousands of
human decisions over time. Thus, in theory the evolution of an engineering system can be observed
and recorded. In addition, future states of the system depend on current states. Thus, efforts to
understand the consequences of human decisions, unexpected events, and other system behaviors
requires a deep understanding of each of the domains.
Hierarchic Levels of Complexity
A major distinction between this conceptualization of Engineering Systems and that of Large
Technological Systems and previous conceptualization of Engineering Systems is the observation
that these systems can exist at various scales of complexity. Where LTS and former descriptions of
ES focus their attention on “large-scale” systems, this conceptualization is intended to describe
Engineering Systems at varying degrees of complexity, from the simplest engineering system of a
single human interacting with an artifact for some purpose (fighter pilot and jet), to transnational
supra-system that includes possibly millions of system components (NATO). Although scaling may
pose newfound challenges for analysis and observation, the Engineering Systems conceptualization
can be useful for describing Engineering Systems of various degrees of complexity.
Using Miller’s hierarchy of complexity for living systems as a template, multiple levels of complexity
are proposed. (Miller 1978) Because Engineering Systems are socially constructed and the structure
of the technical system often reflects the structure of the organization (Hughes 1987), this research
proposes that the social domain should be the basis for defining the levels of complexity.
Descriptions for the various levels are as follows:
- Individual Level: An engineering system that consists of a singular human agent
interacting with technical components for some purpose. Example: A person drawing
water from a well (Shah 2007) or a pilot operating an aircraft.

31-191
- Group Level: An engineering system that consists of a collection of individuals
interacting with technical components and each other for some purpose, where the
localized contributions of the individuals support the global goal of the group. An
example of a group is a fighter squadron and the Whirlwind Project (Hughes 1998).
- Organization Level: An engineering system that consists of a collection of interacting
groups, where the localized contributions of the groups support the global goal of the
organization. An example of an organization is a fighter wing or Lincoln Laboratory
(Hughes 1998).
- Enterprise Level: An engineering system that consists of a collection of organizations
interacting, where the localized contributions of the organizations support the global
goal of the enterprise. Examples of Engineering Systems at the enterprise level are the
United Stated Air Force and Boston’s Central Artery/Tunnel System (Hughes 1998).
- Higher-Order Systems: An engineering system that consists of a collection of interacting
enterprises, organizations, groups, where the localized goals of the each support higher-
level goals of the system. Higher Order Levels of complexity may exist as some
Engineering Systems have multiple layers of hierarchy and it may be difficult to delineate
between the different levels of complexity. For example, the US Department of Defense
(DoD) can be conceptualized as an engineering system as the localized goals of the
constituent components (the services and others) exist to support the global goal of the
DoD. Each service can be understood as an engineering system with well defined system
boundaries and each would probably fall under the enterprise level of complexity.
Therefore, the DoD is an example of an engineering system of a higher-order
complexity. Other examples of a higher-order engineering system may include NATO,
OPEC, and the United Nations.

32-191
Figure 14: Engineering System Levels of Complexity
Dysfunction in Engineering System
Engineering Systems may have components that no longer contribute to the goal of the system and
remain as passive components. In other instances, some components may detract from the goals of
the system. An example of this may be a human component whose localized goal(s) may detract
from the global goals of the system. (Merton 1957) Because Engineering Systems are cybernetic
systems, the system should adjust, but this does not always happen (Easton 1965)to address
dysfunction to bring order to the system. For example, in a hospital some employees may fight a
policy, and the system will self-regulate and adjust to bring components into alignment with the
goals of the system. Thus, the components are replaced with other components, policies change, or
other adjustments can be made. In some cases, if dysfunction is not addressed, the engineering
system can cease. Mutations and adaptation are possible as well. Engineering system are complex
adaptive systems. Lawson (2007) examines stakeholder alignment as a coalitional bargaining game
so as to look at the alignment of individual and group preferences in an engineering system.
Summary of a High-Level Conceptualization of Engineering Systems
Figure 15 illustrates the basic conceptualization of an engineering system used in this thesis. As
discussed, engineering systems are socially constructed, purposeful open systems the change over
Individual
Group
Organization
Enterprise
Higher Order
Level of Complexity Examples
F-16 Squadron
Fighter Wing
Numbered Air Force
US Department of Defense
F-16 Pilot and Aircraft

33-191
time and that consist of interacting components spanning the social, functional, technical, and
process domains.
Figure 15: High-level Conceptualization of an engineering System
The next chapter examines the limitations in both scope and procedure of several systems-level
modeling frameworks used by the systems engineering community to model engineering systems.
tfuture
tpresent
tpast

34-191

35-191
Chapter 3 – Limitations of Existing Systems Engineering Modeling Frameworks for Representing Complex Social and Technical Systems in Scope and Procedure
In light of the conceptualization of Engineering Systems presented in Chapter 2, existing system
modeling frameworks used by engineers to represent these systems are limited in scope and
procedures.4 Modeling frameworks are used to represent the knowledge about a system, whereas a
models use specific information from a framework to address specific questions about a system. The
first half of the chapter examines the limitation of traditional systems engineering modeling
frameworks to sufficiently address systems level interactions within and across the social and
technological domains, and they do not effectively capture the lifecycle dynamics of a complex social
and technological system. The second half of the chapter explores the implications of socially
constructed knowledge for the study of Engineering Systems and the limitations of existing system
engineering modeling methods for bridging qualitative and quantitative divides.
Section 1: Limitations in Scope
Modeling in Engineering
The process of designing, developing and managing a complex technological system comes with
many challenges. One of the most significant challenges is managing knowledge surrounding the
system. Several scholars in psychology and cognitive science disciplines have begun to explore the
issues of knowledge management surrounding technological systems, including knowledge transfer
4 There are several systems-level modeling frameworks that exist outside the engineering domain. In the behavioral sciences, James Greer Miller presents a conceptual system concerned a called a “Living System”. Miller classifies living systems are open systems that are classified in seven hierarchic levels of complexity that include the cell, organ, organism, group, organization, society, and supranational system. At the levels of group, organization, society, and supranational systems, Miller includes both social and technical components within the systems boundary. The social and technical components contribute to the functioning of the system as a part or parts of 19 critical subsystems. Millers emphasis is on the biological and sociological components of the system. Miller, J. G. (1978). Living Systems. New York, McGraw-Hill.
Another contribution from the social sciences and management is Stanford Beer’s Viable Systems Model (VSM) developed based on cybernetic theories developed by Weiner and Ashby. Weiner, N. (1948). "Cybernetics." Scientific American: 14-19, Ashby, W. R. (1963). An introduction to cybernetics. New York, Science Editions, Beer, S. (1967). Cybernetics and management. London,, English Universities P, Beer, S. (1984). "The Viable System Model: Its Provenance, Development, Methodology and Pathology." Journal of the Operational Research Society 35: 7-35. Like Miller, although he does not cite Miller, Beer looks to natural, biological systems to identifying the five necessary and sufficient subsystems that must be in place for any organism or organization to function viably. Beer substantiates his claims using rigorous mathematical analysis to demonstrate isomorphism that can be established between biological organisms and human organizations. The VSM model has been used widely and has generated a substantial list of scholarly works. A famous application includes the VSM’s use on the whole economy of Chile. Beer, S. (1981). The Brain of the Firm. Chichester, Wiley. Like the others, Beer’s emphasis is on the social aspects, particularly decision and control. He does not investigate the nature or address deeply the technical artifacts within the system.
36-191
between actors (Getner 1983), defining the necessary knowledge required to design a system
(Ullman, Stauffer et al. 1983; Kuffner and Ullman 1991; Ullman 1995), strategies for improving
organizational learning, institutional memory and capturing tacit knowledge (Nonaka and Takeuchi
1995; Ritchie 1999; Nonaka, Toyama et al. 2000), knowledge classification surrounding technological
systems (Patil 2000), and methods for managing systems level knowledge (Dong 2002).
In practice, scholars have observed engineers liberal use of design artifacts to facilitate effective
communication and knowledge preservation and to support design decisions and planning.
(Richards, Shah et al. 2007) discuss the role of design artifacts in engineering. They define design
artifacts as physical or virtual objects produced during the design process to facilitate knowledge
sharing, transfer, and decision-support. Examples of design artifacts include engineering drawings,
computational objects, system architectures, work-breakdown structures, bill of materials, and
various project management tools.
One of the most common types of design artifacts is the model. (Voland 2004) defines models as
purposeful representations of a process, object, or system. He explains that models are used by
engineers when a “system or process is too complex, too large, or insufficiently understood to
implement without further evaluation.” He explains that models are abstractions and are used to
elucidate “relationships and interdependencies among system component and variables that may not
be recognized with the use of the model.” The goal of modeling is for engineers to share
knowledge, examine alternatives, and better understand problems in order to achieve viable systems.
Modeling Languages and Types
(Koo 2005) provides a succinct review of various types of models that engineers use to describe the
structure and behavior of complex systems. He presents several tools and methods for the
representation and analysis of complex social and technical systems. He argues that general purpose of
modeling is to improve the human reasoning activities in the design, development, and management
of complex systems. He differentiates between qualitative and quantitative methods. He suggests that
qualitative methods are primarily used as boundary objects (Carlile 2004) useful for translating
knowledge between social actors surrounding a complex social and technical system. These descriptive
models allow actors to expand the bounds of rationality surrounding a complex system by allowing the
agents to share diverse mental models of the various agents surrounding the system for the purposes

37-191
of team communication (Carlile 2004), knowledge management (Nonaka, Toyama et al. 2000), and
managing complexity (Eppinger 2003).
Koo reviews several domain-neutral languages that engineers use to represent qualitative knowledge.
He focuses on three prevalent system description languages as exemplar methods for knowledge
construction. The languages are Unified Modeling Language (UML), Object-Process Methodology
(OPM), and Entity-Relationship Modeling (E-R). Each language provides a defined set of “syntactic
rules and semantic definitions” to help system engineers “specify a composition of building blocks
that represent real systems.” UML is a “comprehensive language family that presents the same
system through multiple diagrammatic views, which include static, dynamic, physical assets, and
human-machine interactions.” OPM is a modeling methodology that “subsumes multiple graphical
formalisms into one diagrammatic view…to represent the structure and behavior aspects of real-
world systems.” The E-R model applies graphical formalism to relations between abstract entities.
(Koo 2005)
In addition to engineering languages, Koo presents a thorough discussion of various methodologies
that engineers’ use for quantitative modeling and simulation. In general quantitative models move
beyond mere system description and translation of knowledge about the structure of a system.
Rather quantitative models are useful to describe the behavior of the system modeled. Koo builds
on Zeigler’s categorization of formal simulation model methods (Zeigler 1976) and compares the
different methods in systems modeling namely system dynamics, colored petri-nets, and
probabilistic network theory. Koo builds on the literature of qualitative modeling languages and
quantitative simulation approaches and presents an innovative modeling technique to merge the two.
His methodology, Object-Process Network, is a domain neutral modeling language that allows
systems analysis to use a declarative language, similar to OPM, to construct models useful for
knowledge sharing and formal quantitative analysis. He demonstrates his methodology to define a
meta-model of a large-scale complex space transportation system.
Systems Level Modeling Frameworks
In addition to modeling languages and types, the engineering community has developed a number of
modeling frameworks intended to better understand system level interactions. The process of
identifying, understanding, communicating, and predicting systems level interactions provide for some

38-191
of the most difficult challenges for engineers. (Henderson 1994; Dong 2002) System-Level modeling
frameworks were created to help engineers effectively cope with these challenges. There are many
engineering frameworks that vary in scope and purpose. In general, each framework defines a
vocabulary for particular types of information of interest to the system designer as a means of
establishing standards for the description of a complex system. Some frameworks leverage the
modeling languages and tools discussed above as a basis for system description, while others define
domain specific semantic conventions. This section reviews several of the most common modeling
frameworks, including axiomatic design, the design structure matrix (DSM), system architectural
frameworks, Quality Functional Deployment (QFD, aka House of Quality), and Unified Program
Planning (UPP) and their limitations in scope for representing Engineering Systems as compared to
the conceptualization presented in Chapter 2.
Figure 16: Contrasting Large Technological Systems Theory, Socio-Technical Systems Theory, and Engineering Systems
As means of evaluating each framework, a set of criteria is proposed. Each criterion is based on the
characteristics of Engineering Systems described in Chapter 1 (as shown in Figure 16) and the
MultipleSmallLargeScale
YesUncertainYesDynamics
YesYesYesInteractions
YesNoNoUncertainty
YesYesYesEnvironment Domain
YesLimitedLimitedTechnical Domain
YesYesYesSocial Domain
YesLimitedLimitedFunctional Domain
YesYesYesProcess Domain
EngineeringSystems
Socio-Technical Systems Theory
(Trist and Bamforth)
LargeTechnological Systems
(Hughes)

39-191
conceptualization of Engineering Systems presented in Chapter 2. The criteria and their rationales are
as follows:
Does the framework represent the social domain?
Engineering Systems are socially constructed and generally require the control, coordination
and/or interaction of human entities to achieve the system goals. A framework for modeling
Engineering Systems should represent these interactions.
Does the framework represent the functional domain?
Engineering Systems are purposeful systems. As such a modeling framework should
represent the system goals. Also, because Engineering Systems are socially constructed the
goals of the system can be decomposed functionally and mapped to the form of the system.
Does the framework represent the technical domain?
A modeling framework for Engineering Systems should include a representation of the
structure of the physical objects within the system.
Does the framework represent the process domain?
The design, development, management, and operation of the engineering system involve
specific processes within and at the intersection of the social and technical domains. A
framework should represent these processes.
Does the framework represent the environmental domain?
The definition of a system boundary is important for the determination of which factors
should be considered when modeling a system. A framework should provide an intuitive
means for defining a systems boundary and the interactions between components across this
boundary. All Engineering Systems are open systems. Engineers are often artifact centric
and fail to consider factors like economics, laws, and politics that affect a technological
system. An engineering framework should explicitly identify exogenous factors and how the
system interacts with its environment.

40-191
Does the framework represent interactions within and across domains?
The literature documents interactions with the social, technical, functional, and task
domains, as well as the interaction that exist between these domains. The components
within the boundary of an engineering system should contribute either directly or through
other components to the goals of the system. As such, traceability exists between the
systems components that allows for an end-to-end representation of the system. Failure to
consider system interactions can lead to misleading conclusions about the structure and
behavior of a complex engineering system. A framework should represent interactions
within and across these domains.
Is the framework useful for quantitative analysis?
Many systems frameworks are useful for qualitative analysis and communication; few are
useful for deep quantitative analysis and mathematic formulation. A system framework
should be useful for both qualitative and quantitative analysis.
Does the framework attempt to capture uncertainty?
Because the world is uncertain, an Engineering Systems modeling framework should have a
means for representing this uncertainty.
Does the framework capture system changes over time?
Engineering Systems exist in time and space. The components of the system and the nature
of the relationships between these components often change over time. A framework
should allow for the mapping of the historical evolution of a system.
Evaluating Existing Modeling Frameworks
The following section evaluates several well-known modeling frameworks using these criteria to
demonstrate the limitation of existing tools to represent engineering systems.
Quality Functional Deployment
Quality Functional Deployment (QFD), one of the first systems-level modeling frameworks, was
developed in Japan in the 1960s and is still widely used today. Users of QFD range from
engineering design teams and manufacturing floor operations, to marketing departments. The

41-191
process maps the following system relationships: customer needs to engineering characteristics,
interactions between engineering characteristics, and target values for the engineering characteristics.
(Cohen and Levinthal 1990) Analysts use the framework to prioritize customer needs and to
understand engineering parameter interactions and parameter performance for an engineering
system. The methodology ensures that design decisions are aligned and are traceable to stated
customer needs.
Figure 17: The four houses of quality (source)
Figure 18 represents where the information in quality functional deployment exists within the
conceptualization of Engineering Systems in Chapter 2. The information captured within a
completed quality functional deployment provides a robust view of a system. QFD contains
information that spans the social and technological domains and captures interrelations within
classes of information and across domains. Some of the strengths of QFD include repeatability, ease
of use, and an ability to provide valuable insights into a product development effort.

42-191
Figure 18: Quality Functional Deployment
There are also several limitations in the methodology for modeling engineering systems. For
example, the methodology generally assumes a homogenous set of stakeholders and stakeholder
preferences, which is almost never the case for a complex engineering system. Next, the
methodology aggregates the technical details of the system into performance parameters, which is a
limited representation of the system. In addition, social interactions between actors are not captured
in the framework. QFD does not attempt to capture life-cycle dynamics of the system. Lastly, QFD
presents a very limited representation of interactions between the system and the environment.
Social, political, and economic factors affecting the system are not explicitly represented in the
framework beyond what is termed a “competitive assessment” that compares various aspects of the
products and services represented by the QFD with corresponding competitor products and
services. Figure 19 illustrates the extent to which QFD meets the evaluation criteria presented
above.
Technical DomainSocial Domain
Environmental Domain
Functional Domain
Process Domain
Cus
tom
ers
tfuture
tpresent
tpast

43-191
Evaluation Criteria for Scope QFD
Represents Social Domain +Represents Functional Domain +Represents Technical Domain +Represents Process Domain +Represents Environmental Domain +Represents Interactions within Domains ++Represents Interactions across Domains ++Conducive for Quantitative AnalysisCaptures System Changes Over Time
Figure 19: QFD Scorecard
Unified Program Planning
Another early systems-level modeling framework was Unified Program Planning. (Warfield and Hill
1972) In an effort to present a more holistic view of a product development system, John Warfield
and Douglas Hill developed a Unified Systems Engineering methodology in the mid-1970s. They
proposed the use of matrices to represent the planning efforts for a product development system.
Their methodology was a first attempt to develop a multidisciplinary framework for developing a
complex engineered system. Hill and Warfield expanded the methodology beyond the product
development domain and proposed the methodology for use as a policy analysis methodology for
non-engineering systems. They created elaborate tools and proposed methods to aid in the
development of a complex engineered system. Warfield and Hill’s methodologies went far beyond
QFD method by including multiple stakeholders, mapping interactions between customer
requirements, showing organizational responsibilities, and including social, political, and economic
constraints and alterables. Still lacking in the methodology was the absence of a physical architecture,
organizational interactions, and interactions between the system and the environment. The tools and
methods far exceeded the computational capabilities for the day, thus the qualitative value outweighed
tangible quantitative benefits.

44-191
Figure 20 represents how the UPP frameworks fits within the conceptualization of Engineering
Systems presented in Chapter 2.
Figure 20: Unified Program Planning
Based on the criteria for modeling a complex engineering system, UPP had several positive aspects.
The methodology provided a structured way for representing the traceability between domains,
system-level interaction, and exogenous factors that interact with a complex system. The
methodology does not capture the dynamics of the system and little information was presented to
describe the technical domain. Figure 21 illustrates the extent to which UPP met the criteria
presented above.
Technical DomainSocial Domain
Environmental Domain
Functional Domain
Process Domain
AG
EN
TS
AGEN
CIE
S
tfuture
tpresent
tpast

45-191
Evaluation Criteria for Scope UPP
Represents Social Domain +Represents Functional Domain ++Represents Technical DomainRepresents Process Domain ++Represents Environmental Domain ++Represents Interactions within Domains ++Represents Interactions across Domains ++Conducive for Quantitative Analysis +Captures System Changes Over Time
Figure 21: UPP Scorecard
Axiomatic Design Framework
Nam Suh presents a framework for representing system design that consists of four domains. (Suh
1998; Suh 2001) The domains include the customer domain, functional domain, physical domain, and
process domain. The customer domain (CA) specifies the needs (or attributes) of the social actors
surrounding a technological system from the output (product or service) of a technological system.
Suh makes no attempts to identify the social actors or interactions between social actors but rather
simply define the various customer-articulated goals for the system. The functional domain (FR)
represents a translation of the customer needs into functional requirements and constraints.
Functional requirements are non-form specific descriptions of what the system must do to achieve the
goals of the system. The physical domain (DP) represents the design parameters that describe the
concrete elements of the technical solution. The process domain (PV) describes the activities required
develop the product specified in the technical domain.

46-191
Figure 22: Axiomatic Design Domains (source Suh 1998)
Each domain represents a hierarchy that can be decomposed into sublevels. At each sublevel there
must exist a mapping across domains as shown in Figure 22. Suh proposes two design theoretic
axioms the independence axiom and the information axiom. The independence axiom requires that
functional independence must be satisfied through the development of an uncoupled or decoupled
design. Suh argues that in an ideal design, the number of functional requirements and the number of
design parameters is equal. The information axiom states that best design has the least information
content. The information in axiomatic design is defined in terms of the logarithmic probability of
satisfying the functional requirements.
Figure 23 illustrates the axiomatic design framework domains within the engineering system
conceptualization.
Figure 23: Axiomatic Design
Technical DomainSocial Domain
Environmental Domain
Functional Domain
Process Domain
tfuture
tpresent
tpast

47-191
It is important to note that the axiomatic design framework only maps interactions across domains
and not interrelations with domains. The axiomatic framework also fails to capture life-cycle
dynamics for system components and interactions. Suh treats the design space as a closed system
and does not represent interactions between the sysm and the environment. Lastly, the axiomatic
design framework does not attempt to represent social interactions between the human entities
involved in the system. The table below illustrates how well the axiomatic design framework meets
the criteria for Engineering Systems modeling.
Evaluation Criteria for Scope Axio
mat
ic D
esig
n
Represents Social DomainRepresents Functional Domain +Represents Technical Domain +Represents Process Domain +Represents Environmental DomainRepresents Interactions within Domains ++Represents Interactions across Domains ++Conducive for Quantitative Analysis +Captures System Changes Over Time
Figure 24: Axiomatic Design Scorecard The DSM (aka Design Structure Matrix, Dependency Structure Matrix)
The DSM methodology emerged in the early 1980s as scholars demonstrated how graph theory can be
used to analyze complex engineering projects. (Steward 1981) Steward showed how the sequence of
design tasks could be represented as a network of interactions. In his model, nodes represent
individual design tasks, and links represent information flows. Steward explained that design tasks
could be related as parallel, series, or coupled tasks as shown in Figure 25. Parallel design tasks, shown
in the first column, depicts a process of independent design tasks. Design tasks in parallel
independently contribute to the next step in the process. Information from Task A has no effect on
Task B. Series design tasks, depicts dependent design tasks, where the information from Task A is
required to execute Task B. The last column represents interdependent tasks or coupled design tasks,
where information transfer between Task A and Task B is essential and iterative.

48-191
Design Tasks in an Engineering Project
Relationship Parallel Series Coupled
Network/Graph
Representation
Matrix/DSM
Representation
A B
A
B
A B
A
B X
A B
A X
B X
Figure 25: DSM Basics (source www.dsmweb.org)
Steward demonstrated how the network of interactions could be mathematically analyzed as a system
of equations. The representation of design tasks as a system of equations allowed Steward to identify
redundancies, inefficiencies, and other common problems analytically. (Steward 1981) Since then
DSM has been used to solve common problems in automotive, electronics, and semiconductor
industries with applications in a variety of domains. In addition to analyzing design activities and tasks
using the task-based DSM (Eppinger, Whitney et al. 1994; Park and Cutowsky 1999), the DSM has
been extended to the analysis of technical artifacts using the component-based DSM (Pimmler and
Eppinger 1994; Malmstrom and Malmquist 1998), the design and analysis of organizations using the
team-based DSM (Eppinger 1997; Eppinger 2001), as well as a method for modeling the parametric
relationships between technical parts using the parameter-based DSM (Smith and Eppinger 1997). In
addition, many elaborate methods have been developed to analyze the matrices including partitioning,
sequencing, and clustering algorithms. (Browning 2001)
Figure 26: Types of DSMs

49-191
Figure 27 presents the various DSM products within the engineering system conceptualization
presented in Chapter 2. As shown, the DSM products span the social and technical domains. The
emphasis of DSM research has traditionally focused on the interactions between components within a
particular DSM, rather than on the interactions across DSM types. More recently there are several
research endeavors that examine cross domain interactions (represented by the dotted line). These
efforts include: Eppinger’s discussion of cross DSM interactions, (Eppinger 2003), the merging of
DSM views with the axiomatic design framework as means to highlight traceability between system
domains, predict systems level interactions, and serve as knowledge management repository, (Dong
2002) and the examination of interactions between the organizational structures and the technical
architecture using the team-based DSM and component-based DSM for a large commercial aircraft
engine development project.(Sosa, Eppinger et al. 2002)
Figure 27: Design Structure Matrix
There are several limitations for representing Engineering Systems using the DSM framework. First,
the DSM does not explicitly model the life-cycle dynamics across the system domains. Secondly, the
existing DSM methods fail to capture system interactions with an environment. Lastly, an explicit
examination of interactions across domains is still limited. Figure 28 illustrates the extent that DSM
satisfies the criteria for modeling engineering systems.
Technical DomainSocial Domain
Environmental Domain
Functional Domain
Process Domain
Team DSM Task DSMComponent DSMParameter DSM
tfuture
tpresent
tpast

50-191
Evaluation Criteria for Scope DSM
Represents Social Domain ++Represents Functional DomainRepresents Technical Domain ++Represents Process Domain ++Represents Environmental DomainRepresents Interactions within Domains +Represents Interactions across DomainsConducive for Quantitative Analysis ++Captures System Changes Over Time
Figure 28: DSM Scorecard DSM/DMM
Building upon the DSM literature, Danilovic and Browning (2007) present a framework that
examines inter- and intra- domain interactions using DSM and Domain Mapping Matrices (DMM).
Their research is largely focused on product development systems. They identify five domains that
are important when examining a product development project. These domains include “the goals
domain the product (or service, or result) system; the process system (and the work done to get the
product system); the system organizing the people into departments, teams, groups, etc.; the system
of tools, information technology solutions, and equipment they use to do the work; and the system
of goals, objectives, requirements, and constraints pertaining to all the systems.” (Danilovic and
Browning 2007)

51-191
Figure 29: DSM/DMM Framework (Source Danilovic and Browning 2007)
Figure 29 illustrates the elements of their framework. Each element along the diagonal represents a
DSM representing the interactions within each of the five domains. The off-diagonal matrices
represent the interactions between domains.
Figure 30 illustrates where the DSM/DMM products fit within the engineering system
conceptualization presented in Chapter 2. The descriptions for each of the DSM/DMM domains
are similar to the description of the engineering system domains albeit with a few differences. The
DSM/DMM frameworks separates the product system and the tools system a separate entities
whereas in the engineering system conceptualization these components are considered to be part of
the technical domain.
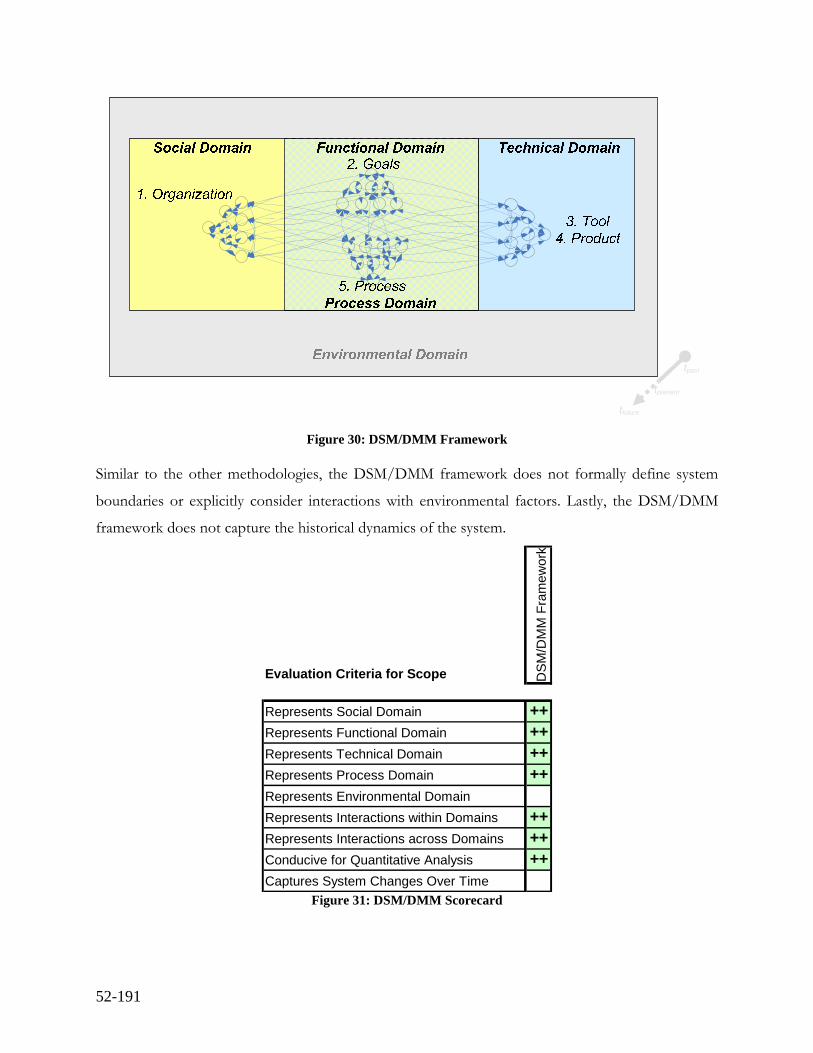
52-191
Figure 30: DSM/DMM Framework Similar to the other methodologies, the DSM/DMM framework does not formally define system
boundaries or explicitly consider interactions with environmental factors. Lastly, the DSM/DMM
framework does not capture the historical dynamics of the system.
Evaluation Criteria for Scope DSM
/DM
M F
ram
ewor
k
Represents Social Domain ++Represents Functional Domain ++Represents Technical Domain ++Represents Process Domain ++Represents Environmental DomainRepresents Interactions within Domains ++Represents Interactions across Domains ++Conducive for Quantitative Analysis ++Captures System Changes Over Time
Figure 31: DSM/DMM Scorecard
tfuture
tpresent
tpast
53-191
System Architecture Frameworks
In their book, The Art of System Architecting (Maier and Rechtin 2000)provide a detailed discussion
of the role of modeling and integrated modeling methodologies used in complex system design. In
their discussion, they present system architecture frameworks as a means for managing system
complexity and structuring system information in a common language and format. They present a nice
overview of the various architecture frameworks that are currently used in the engineering community.
Additional reviews of the various architecture frameworks can be found in Richards, Shah et al (2006)
and Schekkeman (Schekkerman 2004).
Maier and Rechtin offer several goals for architecture frameworks. These goals include:
1. Codify best practices for architectural description and, by so doing, improve the state of practice.
2. Ensure that the sponsor’s of the framework receive important information in a format they desire.
3. Facilitate comparative evaluation of architectures through standardization of their means of description.
4. Improve the productivity of development teams by presenting basic designs in a standard way.
5. Improve interoperability of information systems by requiring that interoperation critical elements be described, and be described in a common way.
Richards, Shah et al (2007) add four additional goals for architecture frameworks that include:
1. To leverage expert knowledge regarding the complete and comprehensive description of the system from multiple stakeholder perspectives.
2. To provide technical information ownership and configuration control to give teams access to the best and most current information.
3. To encapsulate information in a manner that can enable effective use model-based systems engineering approaches and toolsets.
4. To reconcile the system engineer’s drive to provide a complete system description with the pragmatic reality that any one engineer can effectively specify only partial information.
Schekkeman (2004) summarizes the goal of architecture frameworks as the complete expression of a
complex system. In doing so, he suggests that the essence of system architecture frameworks is
provide a standardized information representation of the “Why”, “What”, “Who”, “How”, “Where”
and “When” for a complex social and technical system. The presentation of information is generally
isolated into particular views. Views are generally defined as a collection of logically related models.
Each view presents information that is of particular interest to certain user of that information.

54-191
Figure 32: Architectural Frameworks Map
For example, in the mid-nineties the Department of Defense created the C4ISR architectural
framework to integrate various military communication and surveillance weapons systems. Within
the C4ISR architecture framework there were three main views, the Operational Architecture Views
(OV), Systems Architecture Views (SV), and Technical Architecture Views (TV). Each view is a
standardized collection of models using different modeling languages to represent a predefined
aspect of the system. Each view provides details about the system valuable to the various
stakeholders involved in developing or actively managing the system. The views were designed for
different user groups surrounding a complex technological system. The Operational Architecture
View was used by military planners to define the concept of operations for a particular weapon
system. Various sub views within the Operational Architecture View ranged from simple graphical
descriptions of battlespace to high-level network diagrams easy for non-engineers to understand;
whereas, the System Architecture Views and Technical Architecture Views included far more
sophisticated engineering models to be used for technical communication.
The DoD adopted the C4ISR Architectural Framework as the basis for the Department of Defense
Architecture Framework (DoDAF) as a mandatory work-product for every weapon system in the
US inventory. Like the C4ISR Architectural Framework, the DoDAF consists of 26 products
Technical DomainSocial Domain
Environmental Domain
Functional Domain
Process Domain
WHO?WHY? & WHAT?
HOW?
WHERE?
WHEN?tfuture
tpresent
tpast

55-191
representing the operational, systems, and technical views of an engineered system. (Cooper, Ewoldt
et al. 2005; Richards, Shah et al. 2006) Each view is described through a set of “products” that may
include diagrams, tables, graphics, and narratives. For a detailed discussion of each view see (DoD
2003).
Figure 33 represents where the various architectural view products fit within the engineering system
conceptualization presented in Chapter 2. Like the other architecture frameworks, the DoDAF fails
to present an end-to-end description of a system, rather system information is presented through
discrete views. Within the DoDAF, there are architecture views that span the social and
technological domains. In addition, the DoDAF considers exogenous variables, such as emerging
technologies (SV-9: Systems Technology Forecast), within the framework.
Figure 33: DoDAF
Within the DoD community there are many criticisms of the DoDAF. While the views of the
DoDAF are well-defined, little documentation is provided on how the views are to be constructed.
This lack of documentation, coupled with a focus on final view outputs in early user training, led to
a work product-centric approach to DoDAF development. As a result, many early DoDAF work
products were pictures (many done in PowerPoint) that were neither internally consistent nor
complete in capturing relevant data. Furthermore, the DoDAF provided a discrete picture of each
individual view, thus it is impossible to capture the dependencies and parallelisms among activities,
processes, and supporting technologies. (Richards, Shah et al. 2006) The issue of internal consistency
Technical DomainSocial Domain
Environmental Domain
Functional Domain
Process Domain
TV1, TV2, SV9
OV4SV4
FUNCTIONS
ORGANIZATION
TECHNICALCOMPONENTS
ACTIVITIES
SV5
OV3, SV1 SV2, SV3SV6, SV7 SV8, SV10
OV2SV11, SV12OV5, OV6
OV7, OV8
tfuture
tpresent
tpast

56-191
is not only problem procedurally, but structurally as well, in that the information presented in
discrete views is not traceable to the other views. For example, OV-4 presents a diagram of the
organization surrounding a system; however, there are no views that relate the organizational entities
to elements in the technical views and systems view or the nature of the relations.
Evaluation Criteria for Scope DoD
AF
Represents Social Domain +Represents Functional Domain ++Represents Technical Domain ++Represents Process Domain ++Represents Environmental Domain +Represents Interactions within Domains +Represents Interactions across Domains ++Conducive for Quantitative AnalysisCaptures System Changes Over Time
Figure 34: DoDAF Scorecard
Other limitations of the framework includes a failure to capture life-cycle dynamics of the various
architecture products, minimal consideration of political and economic factors affecting the system,
and a general limitation to use architectural products for quantitative analysis. Figure 34 represents
the extent for which the DoDAF meets the criteria established for representing engineering systems.
CLIOS
Within the ES community, Sussman’s Complex Large Integrated Open System (CLIOS) is an example
of a systems-level modeling framework. (Sussman 2000; Dodder, McConnell et al. 2005) Sussman
provides a methodology for developing an abstraction of a complex social and technological system.

57-191
Figure 35: CLIOS Diagram (Source Mostashari
2005)
Figure 36: CLIOS Model (Source Mostashari 2005)
Within the CLIOS conceptualization, there are general types of entities and relations. Ovals represent
regular components (both concrete and abstract), diamonds are shared components that exist across
multiple layers of the system, and rectangles are policy levers or the components that can be influenced
by human entities. Relations or “links” can be of several types and classes. The types of links include
causal, information, material, and policy. The classes of links are defined as follows: Class 1 links refer
to those that exist within the physical (technical) system, Class 2 refer to those that exist within the
physical system (technical) and the policy system (social system), Class 3 links refer to those that exist
between human entities in the policy system. In addition to building complex diagrams of interactions,
written descriptions for the system entities and relations are produced. (Mostashari 2005)
Systems analysts are encouraged to follow a 12-step process for constructing a CLIOS model. The
process is shown in Figure 37:

58-191
Figure 37: CLIOS process (Source Dodder, McConnell et al. 2005)
Along with the 12-step process are a series of questions designed for the system modeler to collect
information spanning disciplinary boundaries to include political, economic, regulatory factors,
technical systems and subsystems, as well as human and organization entities. The CLIOS process
has been a useful conceptualization for explaining complex social and technical systems and has
been used for several studies that includes modeling combat air operations (Kometer 2005),
reducing emission in Mexico City (Dodder, McConnell et al. 2005), and developing policies for an
off-shore wind energy project (Mostashari 2005).

59-191
Figure 38: CLIOS
The CLIOS conceptualization is quite flexible and allows a system analyst to represent components
and interactions across each of the systems domains. However, the CLIOS methodology does not
classify elements by domain type per se.
Evaluation Criteria for Scope CLI
OS
Represents Social Domain +Represents Functional Domain +Represents Technical Domain +Represents Process Domain +Represents Environmental Domain +Represents Interactions within Domains +Represents Interactions across Domains +Conducive for Quantitative AnalysisCaptures System Changes Over Time
Figure 39: CLIOS Scorecard
tfuture
tpresent
tpast

60-191
Figure 39 above summarizes the CLIOS modeling framework using the evaluation criteria. CLIOS
gets credit for providing the flexibility to represent the components and interactions of the domains
outlined in Chapter 2. Recent work has been done combining CLIOS with other analytical tools,
such as graph theoretic algorithms used in DSM models (Sgouridis 2005) but this sort of analysis is
accomplished outside of existing CLIOS tools. Measures of uncertainty and other system attributes
are not currently represented in current CLIOS models. Lastly, the CLIOS modeling framework
does not represent changes in the system over time.
Summary of Limitations of Scope
With respect to scope, each of the existing systems modeling frameworks seem to be insufficient to
model Engineering Systems based on the criteria established at the beginning of the chapter. As
shown through the examination of the literature, the extents to which existing frameworks consider
interactions between domains are limited. In addition, existing engineering representation
frameworks do not handle time or uncertainty well. None of the existing frameworks capture the
full extent of the conceptualization described in Chapter 2.
Evaluation Criteria for Scope QFD
UPP
Axio
mat
ic D
esig
n
DSM
DSM
/DM
M F
ram
ewor
k
DoD
AF
CLI
OS
Represents Social Domain + + ++ ++ + +Represents Functional Domain + ++ + ++ ++ +Represents Technical Domain + + ++ ++ ++ +Represents Process Domain + ++ + ++ ++ ++ +Represents Environmental Domain + ++ + +Represents Interactions within Domains ++ ++ ++ + ++ + +Represents Interactions across Domains ++ ++ ++ ++ ++ +Conducive for Quantitative Analysis + + ++ ++Captures System Changes Over Time
Figure 40: Scorecard Summary

61-191
Section 2: Limitations in Procedure
There seems to be wide recognition of the idea that technological artifacts are socially constructed.
(Bijker, Hughes et al. 1987; Hughes 1987; Bijker 1995) However, within the engineering community
few recognize that the knowledge surrounding technological systems is socially constructed as well.
The fact that much of the knowledge surrounding a complex system resides in the minds of the
social actors provides interesting challenges for constructing systems-level models. A means for
ensuring content validity and reliability for the knowledge of the system requires deliberate action
when constructing systems models. Social science has developed several methods for gathering and
processing qualitative data based on a constructionist epistemology that is quite different from the
empirical tradition practiced by most engineers using systems-level modeling frameworks.
The constructionist position states that the knowledge that surrounds a complex system cannot be
derived purely from empirical observation of the material world but rather that human knowledge
exists as social artifacts and the product of interchanges among people. (Gergen 1999) explains that
extent to which a given form of understanding prevails is not fundamentally dependent on the
empirical validity of the perspective in question but rather on the vicissitudes of social process (e.g.,
communication, negotiation, communal conflict, rhetoric). In engineering related fields, scientifically
derived knowledge may be the culturally accepted form of knowledge pertaining to the description
of technical components; however the engineering domain is methodologically ill-equipped to
describe and represent components beyond the technical domain, such as describing the factors that
influenced design decisions, mapping social interactions, and understanding systems processes. This
is problematic for systems-level modeling frameworks as they are designed to represent knowledge
that spans the social and technical domains.
To illustrate this point, the next section presents examples from the canonical Design Structure
Matrix (DSM) literature to discuss the common procedures used by engineers for constructing
knowledge of a complex system. Although there are some differences between DSM and other
frameworks in content, the methods for collecting and organizing the knowledge are similar. The
DSM methodology was chosen because of its widespread use in academia and practice as evidenced
by the more than one hundred academic journal articles written in both engineering and
management journals (Browning 2001).

62-191
Constructing Design Structure Matrices
Steve Eppinger, one of the leading thinkers in product development, describes the process of
building a DSM as follows:
“Constructing a DSM of your company’s existing product-development process is a relatively straightforward, if sometimes time-consuming, process. The first step, identifying the tasks involved, is easy and is often available as part of the project-management documentation. Companies with an established development process already know the tasks needed to develop a new product. Ford, for example executes largely the same process each time it develops a car engine.”
Eppinger’s instructions for DSM models typify what is found in the DSM literature in general. Like
most systems engineering tools, the DSM literature provides few step by step instructions for enacting
the technique, few instructions for defining the problem, bounding the system of interest, or
identifying the sources of data. For some, this raises epistemological flags about unarticulated
assumptions, one of the issues discussed below. Eppinger continues.
What takes time is correctly identifying the information needs of the various tasks. You cannot rely on what your company’s managers tell you: they are usually not the people doing the work, and they may have an interest in justifying existing or outdated processes. When we draw a DSM for a product development process, we go to the grass roots and ask individual development teams what they need from other teams to do their jobs. It’s important to focus on input rather than output because we have found that managers, engineers and other product-development professionals are more accurate in identifying what the need to know than in describing what others need to know.” (Eppinger 2001)
Eppinger describes the construction of the DSM as a social process. He cautions analysts to be
aware of who is providing information and sensitizes the reader to prevalence of strategic responses
and bias. He encourages analysts to interview at the “grassroots” to ensure accuracy. He also warns
analysts to be careful to ask questions relevant to the responder, not to answer for others. The
information gathered through system documentation and interviews is then translated into an
adjacency matrix as shown in Figure 40. An “X” represents a relation that exists between two
elements. For example, the “X” in the A-column and D-row symbolizes that “A” affects “D”.

63-191
A B C D E F G H IAB X XCD X XE XF X XG X X XH X XI X X X
Figure 41: Generic DSM
Once the DSM is constructed, mathematical algorithms can be applied to prescribe changes to the
systems. For example, an analyst might use social network analysis methods for examining centrality
measures for individuals or a sequencing algorithm might be used to streamline tasks for a project.
More advanced techniques have included mathematically weighting relations for strength of
dependence for examining team interactions and/or interactions between components, time to
complete tasks for calculating process time, and examining the effects of change through a design
using likelihood measures. (Smith and Eppinger 1997; Clarkson, Simons et al. 2001; Sosa, Eppinger et
al. 2002; Eckert, Clarkson et al. 2004)
In addition to analyzing documentation and conducting interviews, some researchers have elected to
use surveys to construct DSM. For example, Sosa, Rowles, and Eppinger used a combination of
system documentation and surveys to construct a team-based and component-based DSM for the
construction of a large-scale, commercial aircraft engine. The DSM was used to better understand
how the coupling between the organizational and technical structures affects coordination and
integration efforts across design teams. The team began by using system documentation and
organization charts to create a list of system elements to represent the organization and product
architecture. They made a strong assumption that the organization mirrors the product architecture. In
order to make this assumption, they abstracted both the organization and product architecture so that
elements were represented at the subsystem and team levels, not at the individual or component level.

64-191
As a result they represented the technical architecture and the organizational structure using the same
60x60 DSM. This simplification carries many advantages and distinct disadvantages. By abstracting
the organization and product architecture the problem space was significantly simplified as there are
thousands of agents and components supporting the development effort. A high fidelity model of the
system would require enormous effort and would become computationally complex. In addition, the
assumption that the organization mirrors the product allows the researchers to perform relatively
simple statistical analysis to compare the DSMs. Below is an examination of how they populate the
matrices with relations.
For the product architecture, project members were surveyed and asked to rank technical interactions
between subsystems as defined by Eppinger. (Eppinger 1997) On each survey, each member was
given a DSM and asked to put an off diagonal ranking from -2 to +2 symbolizing the interactions
between components. The interactions where defined along five dimensions: spatial, structural, energy,
material, information interactions. In addition, to identifying the interactions, the members were asked
to rank the “criticality” of the interactions. The members were asked to choose from a weighted scale
for each relation. The scale is defined as follows.
Required +2: Interface is necessary for functionality
Desired +1: Interface is beneficial, but not absolutely necessary for functionality
Indifferent 0: Interface does not affect functionality
Undesired -1: Interface causes negative effects, but does not affect functionality
Detrimental -2: Interface must be prevented to achieve functionality
The methodology for creating the team-based or organizational structure DSM was similar. Again,
each member was presented a copy of a blank DSM. Each team member was asked to create
relations based on the frequency and importance of the interaction. The interactions were ranked
using a scale from zero (no interactions) to five (frequent, critical interactions). He then aggregated
the data into weak and strong links. The nodes and interactions are shown in figures 41 and 42.
The survey questions and corresponding scale are listed below.
Team-Based DSM Survey Questions:
1. Please estimate the level of redesign for you parts or system as a percentage of prior existing design.

65-191
2. Rate the level of interaction your team had with each of the other teams during the design of the engine. The
intensity of interactions was defined as follows:
Regularly Frequently InfrequentlyNeverCritical 5 4 3 0Important 3.5 2 1 0Routine 2 0.5 0 0
Once the survey data was collected, they created a team-based and component-based DSM describing
the organizational structure and product architecture as shown in figures 42 and 43.
Figure 42: Team-Based DSM
(Source Sosa 2001)
Figure 43: Component-Based DSM
(Source Sosa 2001) Sosa partitioned the DSM into blocks of modular systems and integrative system. Modular systems
consisted of the major subsystems of the engine and the corresponding organization. Integrative
systems consisted of the systems that had distributed interfaces across subsystems and the
corresponding organizations responsible for the technical systems. In both figures, the dark blocks
represent strong interactions, lighter blocks represent weak interactions, and white blocks represent no
interactions. Sosa was interested in examining the differences between the product and the
organization. In particular, he wanted to understand instances where the team identified a “strong”
relationship between two components and no corresponding interaction between team members
responsible for the two components (and vice versa). Sosa performs multiple statistical tests on the
data to quantify the similarities and differences between the product and the organization and the
implications to managing complex design projects. (Sosa, Eppinger et al. 2000)

66-191
Sosa tested several hypotheses; some of the highlights include a finding that interactions between
engineers within organizational boundaries are statistically more likely to match technical interactions
when compared to cross boundary interactions across systems. He also found that engineers working
within modular systems were more likely to neglect technical interfaces with other subsystems when
compared to engineers working on integrative systems. Based on these results, he concludes:
1. Design interfaces across modular systems are more difficult for design experts to recognize that interfaces with integrative systems.
2. The distributed nature of the integrative systems forces design teams to overcome organizational barriers in order to handle design interfaces with all the systems. That is, effects of organizational barriers are more severe among teams that design modular systems.
As with all analyses, the strength of the result and interpretation depends greatly on the reliability and
validity of the data and the assumptions. As such, a careful review of how the data were gathered, the
knowledge constructed, and the underlying assumptions formed with inform the quality of the result.
For the engine data set there are many potential problems. First, by choosing a quantitative research
approach via survey and statistical analysis, Sosa makes the assumption the he knows a priori the
structure of the technical architecture and organization. As such, he assumes that both the product
design and organization structure are identical and can be represented by the same 60x60 matrix. This
assumption is made for computational simplicity in comparing technical and organizational structures.
Without identical matrices, mathematical analysis becomes much more difficult, but one must wonder
what information about the system is lost or misrepresented under this assumption. After further
reading, the reader finds that this assumption was indeed false.
Sosa referenced Rowles (1999), who created the data set for his master’s thesis. Rowles reveals that
two teams were not discovered until after the surveying had begun and members were included into
related teams. (Rowles 1999: 45-46) Furthermore, Rowles noted that, during the survey process, there
was confusion among respondents, as there were diverse interpretations for the strength of relations
measures. Rowles also commented that this may have resulted from differing perspectives. (Rowles
1999: 58, 62) To address this, he created a thorough review process that coworkers independently
review each input. Once the DSM was constructed; however, is was not possible to examine each
member’s assumptions or rationale without reengaging the experts because the rationale was not
documented.

67-191
Another procedural hurdle related to the fact that the collected data represented information what had
happened in the past. For this project, respondents were asked to remember social and design
interactions that took place years prior. (Rowles 1999:48) In the years that had passed, there was a
procedural risk that the participants had forgotten or misremembered what had happened as Rowles
acknowledged in his thesis.
In order for normative and descriptive theories to emerge from Engineering Systems research, these
types of procedural limitations must be overcome. Opportunities to overcome these limitations may
be found by incorporating qualitative social scientific research methods alongside the traditional
approaches. Qi Dong (1999, 2002) moves in this direction in her research, which is presented in the
next section.
New Directions in DSM
Qi Dong examined how the DSM might be useful as a tool for communication and reposting
systems-level knowledge, as well as a prescriptive tool for analysis and decision-making (Dong 1999;
Dong 2002). Procedurally, Dong sought to address some complaints surrounding the DSM s. For
example, the “methodology was as too much art than science,” “the guidance for constructing
DSMs was ‘too loose’”, and most damaging “the DSM fails to accurately represent the system.” One
of her first actions was to determine if technical documents, systems representations, and models
were sufficient to capture the essential knowledge about a technical system. Through her research
Dong, quells some of these concerns and validates others. In the end, she proposes an improved
method for constructing DSMs.
Dong’s first major finding was that engineering documentation missed most of the information
about a system, particularly systems-level interactions, and that the missing information could be
found only by interviewing the individuals surrounding the system. For engineers, this may seem
somewhat counterintuitive, as one might expect that since the engineering discipline is well
understood, the technical details would be documented and available for all. This finding was
contrary to the classic assumption that systems documentation processes and systems.
To understand how she made this finding one must first review her data collection methods which are
listed below:

68-191
Step #1: Construct baseline DSM from design document. Dong collected all relevant (why use the word
relevant, implies a hidden judgement is being made, like those assumptions for the matrix) documentation for a
system and constructed a baseline DSM populated with the relations described in the document.
Step #2: Elicit information by interviewing engineers and using the baseline DSM as a tool for eliciting. For
the interview, Dong simply presented the interviewee a copy of the baseline DSM and asked “what was
missing?”
Step #3: Direct observation of the system by participating in Engineering Meetings. Dong found that by
attending the regular engineering meetings, she was able to identify issues from the meeting discussions, as well as
collect information from open ended talks and asking questions now and then. This form of data collection was a
continuous effort over the entire period of research.
Dong found interviewing to be an effective strategy for data collection. She notes that engineers often
had differing views on how the technical elements within the system related to each other and on the
importance of these relations. She found often times that engineers intuited that one element affected
another, but did not know the pathway of effects. Secondly, Dong found that engineers had different
perspectives on the interactions due to differences in their expertise. She found that she often
mediated among the engineers to establish a common understanding with and among them. She
observed that engineers had different mental models of the design and no single actor had the
complete picture of the technical system. Dong took copious notes and annotated each element in the
DSM so that the information and assumptions were transparent and open for discussion. She stored
this information for the DSMs in a Microsoft Excel spreadsheet.
In addition, Dong favored interviews over surveys and group elicitation for several reasons. She did
not like surveys because she felt that much of the information is lost because survey sheets do not
allow agents to provide rationale for their choices. Also, bias due to work experience and expertise is
lost in the survey sheet. Dong felt that a survey approach requires that the researcher know “a priori”
the content of the system. Thus, if the purpose of the research is to learn about the system it seems
that an exclusive use of the survey method is suboptimal. Dong was also critical about group
elicitation. She felt that in group settings, voices can be lost due to social pressure. Additionally, some
stakeholders may be inclined to respond strategically to influence the group in particular ways.

69-191
Dong performed several case studies. She found that little knowledge about assembly and systems
interactions for technical systems are found within the systems documentation. Figure 44 comes from
one of the case studies.
Figure 44: Sources for Documented System Interactions (Source Dong 1999)
The chart shows that engineering knowledge surrounding the technical architecture was incomplete at
the part, assembly, and system level. At the part level, engineering documentation was fairly good at
describing the connections and properties. However, at the assembly and system level, the
documentation was incomplete. The far right bar shows that only 30% of the system interactions
were documented and so required interviews to be captured. For companies interested in capturing
and maintaining technical knowledge this is problematic as institutional memory can be elusive. For
companies interested in saving costs through design reuse, a failure to capture knowledge can be
devastating as engineers hoping to leverage past knowledge on new products are unable to recreate or
worse, even comprehend past designs.
In total, Dong conducted three case studies at Ford, CVC, and Johnson & Johnson. In each case, she
found similar results.(Dong 2002) She found that most of the information regarding the technical
system did not reside in the systems engineering tools, models, or documentation. Instead, the
information resided in the minds of the engineers and managers of the project. Thus, the process of
reviewing documents, interviewing agents, direct observation, and annotating this knowledge
improved the quality of the DSM and showed that the DSM with annotations could be used as an
effective knowledge management tool.
Lastly, Dong proposes that the DSM is useful for mapping interactions across domains, but her
research primarily focused on technical interactions. For most technological systems, documentation
of the social domain is even worse still. As such, questions remain about the usefulness of Dong’s

70-191
approach in cases in which documentation does not exist. In Chapter 5, a methodology is proposed
for addressing the challenges of constructing system-level models.
Chapter Summary
This Chapter outlines limitations in scope and procedure of existing systems-level modeling
frameworks for representing engineering systems. Chapter 4 presents the Engineering Systems Matrix
(ESM) as new modeling framework designed to address the limitations of scope outlined in the first
half of this chapter. Chapter 5 presents Qualitative Knowledge Construction (QKC), a new
methodology to construct knowledge of engineering systems to address the limitations of procedure
discussed in the second half of this chapter.

71-191

72-191
Chapter 4 – The Engineering Systems Matrix: A Framework for Organizing Information about Engineering Systems
Using the descriptions of Engineering Systems and the conceptual model presented in the chapters 1
and 2 respectively; this chapter presents a new modeling framework, the Engineering Systems Matrix
(ESM), to address the limitations of scope presented in Chapter 3. Within the conceptualization
there are five domains (social, technical, functional, process, and environmental) that are important
when describing an engineering system. The ESM organizes this information using a matrix
structure that can be used to facilitate network and graph theoretic analysis. The derived analysis
consists of varying classes of nodes, relations, and attributes. Nodes represent different classes of
objects, relations describe interactions between two nodes, and attributes generically describe the
parameters and descriptions for both nodes and relations. The conceptualization is both a hyper
graph and a multi graph. A hyper graph implies the graph contains different classes of nodes and
there are interactions between nodes of different types. A multi graph implies multiple edges can
exist between nodes. For example, two human actors might have a financial relationship and
communication relationship between them. In addition, the ESM is a designed to represent how the
graph (nodes, relations, and attributes) changes over time.
The ESM is represented as an adjacency matrix with identical row and column headings. Thus, the
diagonal represents the system components and the off-diagonal cells represent the relationships
between components. The grey cell blocks along the diagonal represent a graph of a particular class
of node. A discussion for each class of node is presented in the next section. The off-diagonal
blocks of cells represent a multi-partite graph that relates two classes of nodes. See Figure 45.

73-191
Figure 45: Matrix Representation of an Engineering System Each node and relation in the system can be described with attributes. Attributes define the
characteristics for each particular node or relation. Attributes can be binary, string, numeric or a
mathematical function.
Defining Classes of Nodes
Based on the Engineering Systems domains presented earlier, this research distills each domain into
six-classes of information. These classes are System Drivers, Stakeholders, Objectives, Functions,
Objects, and Activities. The system drivers represent the non-human components that affect or are
affected by the engineering system that are beyond the control of the system’s human components.
The stakeholder represents the social network of the system and consists of the human components
that affect or are affected by the system. The objectives represent the objectives, goals, and
purposes of the engineering system. The functions represent the functional architecture of that
system. The objects represent the physical, non-human components of the system. The activities
A X AO X AF X AV X AS X AEnv X AActivities
A X OO X OF X OV X OS X OEnv X OObjects
A X FO X FF X FV X FS X FEnv X FFunctions
A X VO X VF X VV X VS X VEnv X VObjectives
A X SO X SF X SV X SS X SEnv X SStakeholders
A X EnvO X EnvF X EnvV X EnvS X EnvEnv X EnvSystemDrivers
ActivitiesObjectsFunctionsObjectivesStakeholdersSystemDrivers
A X AO X AF X AV X AS X AEnv X AActivities
A X OO X OF X OV X OS X OEnv X OObjects
A X FO X FF X FV X FS X FEnv X FFunctions
A X VO X VF X VV X VS X VEnv X VObjectives
A X SO X SF X SV X SS X SEnv X SStakeholders
A X EnvO X EnvF X EnvV X EnvS X EnvEnv X EnvSystemDrivers
ActivitiesObjectsFunctionsObjectivesStakeholdersSystemDriversSystem
Boundary
Col
umn
Influ
ence
s R
ow
Row is Influenced by Column

74-191
represent the processes, sub-processes, and tasks performed by the system. Each class type and
interactions between classes is discussed below and examples are provided using the hospital and
MAV-PD examples presented in Chapter 2.
System Drivers
Systems drivers represent the non-human portion of the environmental domain and are composed
of the set of all non-human components that act or are acted on by the system. (Bunge 1979) The
system drivers can include the economic, political, and technical influences that constrain, enable, or
alter the characteristic of components in the system. Each system driver can have attributes that
describes parametric characteristics of specific to each component. For a hospital, the system drivers
might include government regulations, city utilities, or cost of electricity. For the MAV-PD on the
other hand, system drivers include the Federal Acquisitions Regulation (FAR), technological
advancements, and enemy weapon systems.
Figure 46: System Drivers Class
System Drivers X System Drivers Interactions:
An analyst might want to consider the relationship of system drivers to system driver interactions.
In the hospital example, an example of this type of interaction is the effect of pharmaceutical
pricing (system driver) on federal pharmaceutical subsidies (systems driver). In the MAV-PD, an
example of this type of interaction was the interaction between customer funding (system driver)
and congressional add-ins (system driver). For the project, if congress is willing to support the
Activities
Objects
Functions
Objectives
Stakeholders
SystemDrivers
ActivitiesObjectsFunctionsObjectivesStakeholdersSystemDrivers
Activities
Objects
Functions
Objectives
Stakeholders
SystemDrivers
ActivitiesObjectsFunctionsObjectivesStakeholdersSystemDrivers
System B
oundary
Rows and Columns • Represents Environmental Domain • Captures the exogenous variables
that influence or are influenced by the system
• In particular, these are the regulatory, legal, political, economic, and technical constraints/enablers that affect the system
– Includes other environmental variables as well
SYSTEM DRIVERS
STAKEHOLDERS
OBJECTIVES
FUNCTIONS
OBJECTS
ACTIVITIES

75-191
project with direct funding (add-ins), this might introduce disruptions to planned funding for the
project as the USAF may divert project funding to other needs.
System Drivers X Stakeholders Interactions:
System drivers can affect stakeholder components in a variety of ways. For example, the
demographics of a community (system driver) might require that a hospital reorganize the mixture
of specialties of doctors (stakeholders) employed by a hospital. In the MAV-PD, USAF assignment
policies (system drivers) affected the organizational changes to the MAV-PD staff (stakeholders).
System Drivers X Objectives Interactions:
System drivers can affect the system objectives. For example, a new housing development may
increase the community population. The increase in population might play a role in affecting the
earning goals for the hospital. In the MAV-PD, advancements in the miniaturization of
technologies (system driver) have affected the system requirements (objectives) for greater range.
System Drivers X Functions Interactions:
An example of a system driver affecting a function might include the hospital adding a new specialty
of care (function), such as obstetrics, in response to changing demographics (system driver). In the
MAV-PD the user’s concept of operations (system driver) requires new functionality (functions) for
the system.
System Drivers X Objects Interactions:
An example of a system driver affecting object might involve a government regulation (system
drivers) that bans a particular medical device used by the hospital. In response, the technical
components of the hospital would likely change. In the MAV-PD, the FAA regulations for
communications (system driver) affects the design of the MAV’s communication design (objects).
System Drivers X Activities Interactions:
An example of the system drivers affecting activities might a government regulation (system driver)
that requires special documentation or other actions (activities) after a medical procedure is
accomplished. In the MAV-PD, the Federal Acquisitions Regulation (system driver) affects several
of the team’s contacting activities (activities).

76-191
Stakeholders
The Stakeholder class of components comprises of the social network of stakeholders in an
engineering system. Within the Stakeholder DSM, there are internal and external stakeholders. The
external stakeholders constitute the remaining portion of the environmental domain and consist of
the human entities that affect or are affected by the system but that do not control components
within the system boundary. Likewise, internal stakeholders are the human entities that contribute
to the goals of the system and control components within the system. The extent of the internal
stakeholders’ control of the system defines the system boundary. To identify the stakeholders for a
system, it is useful to ask the four questions: Who benefits? Who pays? Who provides? And who
loses? (Maier and Rechtin 2000)
Figure 47: Stakeholders Class
Stakeholders X System Drivers Interactions:
Although Stakeholders cannot control environmental factors, they can influence the environment to
a limited degree. For example, hospital doctors (stakeholders) may volunteer in the community as
hospital representatives to raise awareness for blood bank donations. The blood bank, an
independent system that controls the blood supply (system driver) for the community is an entity
that is not controlled by the hospital, but can be affected by it. In the MAV-PD, the MAV program
manager (stakeholder) participated in military exercises to test the capabilities and limitations of the
system. The result helped inform the user’s concept of operations (system driver) for the system.
Activities
Objects
Functions
Objectives
Stakeholders
SystemDrivers
ActivitiesObjectsFunctionsObjectivesStakeholdersSystemDrivers
Activities
Objects
Functions
Objectives
Stakeholders
SystemDrivers
ActivitiesObjectsFunctionsObjectivesStakeholdersSystemDrivers
System B
oundary
Rows and Columns • Stakeholders (agents) are individuals, groups,
and/or organizations that affect or are affected by the system.
• External stakeholders (outside the dashed line) have no (direct) control over the entities within the system boundary
• Internal stakeholders (inside the dashed line) interpret the objectives for the system, control resources, manpower, and have decision making authority. Internal stakeholders also include the human agents responsible for executing the activities within the engineering system
– Represents the organization in place to fulfill system objectives
• The extent of internal stakeholders control defines the system boundary of the system
SYSTEM DRIVERS
STAKEHOLDERS
OBJECTIVES
FUNCTIONS
OBJECTS
ACTIVITIES

77-191
Stakeholders X Stakeholders Interactions:
Stakeholder-to-Stakeholder interactions are the connections that form [or the edges of] the social
network for the systems. There are a variety of types of analysis that can be performed using a
matrix representation of such a network. (Wasserman and Faust 1994) For example, analysis to
understand interactions between medical staff (stakeholder to stakeholder) in an operating room
might be of interest. Similarly, stakeholder to stakeholder interactions between members of the
MAV-PD team were mapped and analyzed. [Use parallel structure in wording the two preceding
sentences.] This analysis is presented in Chapter 7.
Stakeholders X Objectives Interactions:
Stakeholder components define the objective for an organization. For each system objective, the
system stakeholders are likely to either support, or oppose, or have an indifferent position for the
objective. For example, if the hospital declares a new initiative to reduce operating costs, there may
be several stakeholders that support, oppose, or are indifferent to the objective. An analyst might
want to interview or survey the stakeholder components to assess the various positions and to
develop a course of action to align interests. For the MAV-PD, an external stakeholder representing
the US Army Rapid Equipping Force (REF) was introduced into the system. Some of the REF’s
positions on the system objectives conflicted with the US Air Force’s interests.
Stakeholders X Functions Interactions:
Each stakeholder in the system is likely to have some functional responsibility described in the
matrix. The Stakeholder to Function matrix maps the influence of each stakeholder component to
the corresponding function. For example, one of the hospital’s functions may be “Provide Emergency
Care”, in which case the emergency room staff members are the stakeholder components that
influence the function. In the MAV-PD, the program manager (stakeholder) was responsible for
managing MAV-PD budget (function).
Stakeholders X Objects Interactions:
The stakeholder components in the system generally control or supervise the operation of the
technical components within the system. As such, there is an interaction between stakeholders and
objects. In the hospital, a radiology technician (stakeholder) operates the X-ray machines (objects).

78-191
In the MAV-PD, one of the technicians (stakeholder) was responsible for the instrumentation
equipment (objects).
Stakeholders X Activities Interactions:
For tasks that are not automated, human components contribute or [and?] support all tasks within
the system. In a hospital, a pharmacist (stakeholder) dispensed medicine (activity) for a particular
medical procedure. In the MAV-PD, the chief engineer (stakeholder) managed and coordinated the
development test activities (activities).
Objectives
The word objective in the ESM is synonymous with system purpose and system goal. As such, the
objectives matrix defines the combined purposes/goals of the system and represents the part of the
functional domain that is defined by humans. The stakeholders define the objectives for an
engineering system. Objectives include all articulated and unarticulated (implied) customers’ needs
for the system. The objectives are defined, interpreted, and written from the perspective of the
internal stakeholders of the system. A cooperative framework is assumed for internal stakeholder
interests. An objective for a hospital might be “To provide responsive emergency medical care”.
Attributes of objectives might include quantifiable requirements or key performance parameters.
For example, average response time to medical emergencies is an example of an attribute of an
objective.
Figure 48: Objectives Class
Objectives X System Drivers Interactions:
Activities
Objects
Functions
Objectives
Stakeholders
SystemDrivers
ActivitiesObjectsFunctionsObjectivesStakeholdersSystemDrivers
Activities
Objects
Functions
Objectives
Stakeholders
SystemDrivers
ActivitiesObjectsFunctionsObjectivesStakeholdersSystemDrivers
System B
oundary
Rows and Columns• Represents Functional Domain 1 • The combined objectives (goals) of
system. Other names for objective might include value proposition, goals, etc.
– The purpose(s) of the system as defined by the stakeholders
– The objectives includes all articulated and unarticulated customer needs, system requirements, and goals/objectives
– Objectives are written in the purview of the internal stakeholder(s)
SYSTEM DRIVERS
STAKEHOLDERS
OBJECTIVES
FUNCTIONS
OBJECTS
ACTIVITIES

79-191
The objectives for a system can affect exogenous variables. For example in a hospital, the failure to
respond quickly to medical emergencies (objective) in the community affects public perception
(system driver) of the quality of medical care that the hospital provides. In the MAV-PD, the
operational performance (objective) of the MAV affected the user’s concept of operations (system
driver) for the system.
Objectives X Stakeholders Interactions:
System objectives can affect stakeholders. For example, in a hospital the unresponsive emergency
care (objective) can affect the director of emergency medicine’s (stakeholder) position in the
organization. In the MAV-PD, the success of the project as measured by the objectives affected
several of the stakeholder’s performance ratings in AFRL.
Objectives X Objectives Interactions:
Objective-to-objective interactions occur when two objectives are either positively or negatively
correlated. For example, in a hospital, two objectives might be to minimize operating costs and
maximize employee satisfaction. A system analyst might find that there is a negative correlation
between these objectives by measuring monthly employee surveys with budgetary cuts. In the
MAV-PD, one of the system objectives was to minimize the weight of the MAV air vehicle, this
objective constrained several operational objectives that requires heavy payloads.
Objectives X Functions Interactions:
The functional decomposition of a system begins with the objectives of the system. This is
discussed in more detail in the next section. For example, in the case of emergency response for a
hospital, sub functions that support the goal of providing responsive medical care might include:
Receive Message, Transport Patient, Treat Patient, etc. In the MAV-PD, the system objective Provide
Intelligence, Surveillance, and Reconnaissance (ISR) Capability was functionally decomposed into several
dozen supporting functions.
Objectives X Objects Interactions:
Some objectives are directly related to the technical components of the system. For a hospital, a
system objective to provide MEDEVAC for the surrounding community requires the medical helicopter
80-191
(system object) to support the objective. Similarly, the objective to Provide ISR Capability was
traceable to the MAV Product System.
Objectives X Activities Interactions:
Some objectives are directly related to the system activities. For a hospital, the objective To Raise
Funds for a New Project might require various fundraising activities such as a gala. In the MAV-PD,
the objective to deliver MAV prototype to user (objective) was traceable to a number of aircraft
certification activities.
Functions
Functions describe what the system must do to achieve stakeholder objectives. They represent the
second part of the functional domain. All functions must be related to at least one objective either
directly or through another function. Functions can have attributes that are measurable. Some call
these measures key system attributes (KSAs). In addition, functions relate to the form of the
systems. Some define the architecture of a system as the mapping of function to form. The
functional architecture of a system cannot be completely defined without knowledge of the form.
Thus, each object and activity within the system map to functions of the system which as discussed
below.
For example, in a hospital a function that supports a system objective might be as follows.
Goal: To provide inpatient/outpatient health care for a small town. Functional Components: Provide Emergency Care Functional Attribute: Budget allocated for emergency care

81-191
Figure 49: Functions Class
Functions X System Drivers Interactions
Functions can interact with system drivers in a variety of ways. For example, the system attributes of
a function can trigger a system driver. In a hospital, the costs attributed to the function Provide
Emergency Care might exceed a budgetary threshold that affects insurance provider rates (system
driver). In the MAV-PD, the concept of operations for the MAV (system driver) depended on the
performance of a key system attribute for one of the functions.
Functions X Stakeholders Interactions
Interactions between functions affecting stakeholders will be system dependent. In a hospital, the
costs attributed to the Provide Emergency Care function might exceed a budgetary threshold that causes
a stakeholder to initiate social ties with another stakeholder. For example, if cost overruns in
emergency care (function attribute) are excessive; the hospital administrator (stakeholder) will likely
initiate a social interaction with the director of emergency medicine. In the MAV-PD, different
subcontractors were responsible for particular functions. In at least one instance, a subcontractor
was not performing well as measured by the key system attribute and was replaced by another
subcontractor.
Functions X Objectives Interactions:
Since all functions are related directly or through other functions to the system objectives, there will
be several function-to-objective interactions. For example, in a resource allocation model, a system
Activities
Objects
Functions
Objectives
Stakeholders
SystemDrivers
ActivitiesObjectsFunctionsObjectivesStakeholdersSystemDrivers
Activities
Objects
Functions
Objectives
Stakeholders
SystemDrivers
ActivitiesObjectsFunctionsObjectivesStakeholdersSystemDrivers
System B
oundary
Rows and Columns • Represents the Functional Domain 2 • Supporting Functions represent the
“What and Why” for the remaining elements in an engineering system
• Traditional functional decomposition methods can be used to create the functions matrix, such as: Functional Analysis Systems Technique.
SYSTEM DRIVERS
STAKEHOLDERS
OBJECTIVES
FUNCTIONS
OBJECTS
ACTIVITIES

82-191
analyst can observe money spent per objective by summing the funding expenditures for the
corresponding support functions.
Functions X Functions Interactions:
Pahl and Betx (1991) define the types of flows that exist between functions in products. These
include signals (information), energy, material, and spatial relations. In addition, there can be
abstract relations between functions, such as hierarchic relations. For example, the Provide
Emergency Care function components might contain sub-functions such as: In-process Patients,
Retrieve Information, etc.
Functions X Objects Interactions:
In an engineering system, form can be mapped to function. Therefore, each function in the system
has a corresponding physical component. For example, Store Information might be the
corresponding function for the hospital’s medical records (form). In the MAV-PD, the function
control flight is related to the MAV autopilot subsystem (object).
Functions X Activities Interactions
Interactions can exist between the activities performed by the system and the functions. For
example, the function Distribute Medication corresponds to the activities and procedures in the
chain of tasks associated with delivering medicine to patients. In the MAV-PD, all development
tasks are traceable to functions. For example, the function to manage autopilot development
contract maps to several development tasks ranging from writing the contract to conducting design
reviews.
Objects
The object matrix represents the physical components of the system that contribute to the
objectives of the system. The components include infrastructure, objects needed to carry out the
system functions and objectives, and those physical entities used by the internal stakeholders to carry
out their interactions. Other descriptions of the system objects include: the architectural/physical
entities required to carry out the functions or the physical “form” of the system. Objects can
include software, hardware, infrastructure, etc.

83-191
Figure 50: Objects Class
Objects X System Drivers Interactions:
There are a variety of possible interactions between the objects in an engineering system and the
system drivers. An example in a hospital is the water consumption of the hospital infrastructure
(object) interacting with the city water supply (system driver). In the MAV-PD, the use of a
particular technology (object) creates a network externality for other USAF projects (system drivers)
wanting to interact with the MAV system.
Objects X Stakeholders Interactions
As stated above, the system stakeholders generally control or manage the objects in an engineering
system. An example of an object interacting with a stakeholder within a hospital could occur if an
emergency room medical device (object) signals (when a patient stops breathing) to the medical staff
(stakeholder) to take initiate some type of action. In the MAV-PD, when testing the MAV for
technical performance, test engineers (stakeholders) monitor the status of system, subsystem, and
components (objects).
Objects X Objectives Interactions
In a hospital, one of the objectives of the system is to control operating costs. The operating costs
for the hospital infrastructure (object) influence this system objective. In the MAV-PD, the
miniaturization of some of the system components (objects) was so costly that it affected the system
objectives.
Activities
Objects
Functions
Objectives
Stakeholders
SystemDrivers
ActivitiesObjectsFunctionsObjectivesStakeholdersSystemDrivers
Activities
Objects
Functions
Objectives
Stakeholders
SystemDrivers
ActivitiesObjectsFunctionsObjectivesStakeholdersSystemDrivers
System B
oundary
Rows and Columns • Represents the Technical Domain • The architectural/physical entities
required to carry out the functions • The “form” of the system • The object can include software as
well as hardware, infrastructure, etc
SYSTEM DRIVERS
STAKEHOLDERS
OBJECTIVES
FUNCTIONS
OBJECTS
ACTIVITIES
84-191
Objects X Functions Interactions
All objects in the system can be described with a functional description. In the case of the hospital,
the cost attributes for the objects relate to the cost attributes for the function. This relationship
between objects costs and function costs has been well described in the value engineering literature.
(Fowler 1990) For example, the costs associated with a hospital’s information system are related to
the costs of the hospital’s sub-function, Manage Information. The examination of cost allocation by
function was not done in the MAV-PD analysis in this thesis.
Objects X Objects Interactions
Object-to-object interactions represent how the technical components interact with one another. It
is in the objects to objects matrix that classic engineering models of technical systems are
represented in the systems model. An example from a hospital is a computer network in which the
computer terminals represent discrete objects and signals flow between objects. In the MAV-PD,
defining the interactions between system components was essential for integrating the MAV air
vehicle. For example, the team needed to define how the wing (object) attached to the fuselage
(object).
Objects X Activities Interactions
Most of the activities performed within an engineering system require objects to be accomplished.
Most medical procedures (activity) require medical devices (object). For example, a knee surgery
(activity) requires a scalpel (object). In the MAV-PD, the fabrication of the wing (activity) required
specialized tooling (objects).
Activities
The activities domain represents the process, sub-processes, procedures, tasks, and work units
associated with an engineering system. Activity components support function components. In
nearly all cases, system activities require stakeholder and object components. Information about
tasks can often be found in the documentation describing a system. Sources of documentation
might include the work breakdown structure, task lists, operating procedures, etc.

85-191
Figure 51: Activities Class
Activities X System Drivers Interactions
Activities might interact with system drivers for a particular system. For example, an analysis of the
various procedures being performed by a hospital (heart surgeries) might be used to inform the
community’s public health organization regarding particular health trends (system driver) for a
community. In the MAV-PD, the success of the operational tests (activities) of the MAV might
affect the budget stability (system drivers) for the project.
Activities X Stakeholders Interactions
Feedback from activities might be of interest to particular stakeholders in an engineering system.
For example, the success rate of a particular procedure (activity attribute) might be reported to a
hospital administrator (stakeholder). In the MAV-PD, the failure of certain activities led to
personnel changes (stakeholder).
Activities X Objectives Interactions
For some Engineering Systems activities influence system objectives. A hospital, for example, might
have an objective of reducing post-operative infection rates. The calculation of post-operative
infections is derived from surgical procedure information found in the activities matrix. In the
MAV-PD, the results of certain development activities affected specific objectives measures. For
example, the costs for various activities affects the minimize cost objective.
Activities
Objects
Functions
Objectives
Stakeholders
SystemDrivers
ActivitiesObjectsFunctionsObjectivesStakeholdersSystemDrivers
Activities
Objects
Functions
Objectives
Stakeholders
SystemDrivers
ActivitiesObjectsFunctionsObjectivesStakeholdersSystemDrivers
System B
oundary
Rows and Columns • Represents the Process Domain • The activities required to be
performed by the system • Represents information generally
found in a Work Breakdown Structure
SYSTEM DRIVERS
STAKEHOLDERS
OBJECTIVES
FUNCTIONS
OBJECTS
ACTIVITIES

86-191
Activities X Functions Interactions
Similarly, activities can relate to functions. For example, cost elements for particular activities can
inform function cost elements. In a hospital, the costs to perform the function provide emergency
care can be derived from the cost elements of the procedures and tasks (activities) performed by the
emergency staff, as well as the operating costs of the equipment (objects).
Activities X Objects Interactions:
In an engineering system, there exist various activity-to-object interactions. For example, in the level
of a hospital, internal blood supply (object) might be affected by the various surgical procedures
(activities) being performed.
Activities X Activities Interactions
Activity to activity interactions are well defined and studied in the literature. (Steward 1981; Warfield
1990; Eppinger, Whitney et al. 1994) In engineering systems, the understanding of task to task
dependency is essential when trying to understand certain system behaviors. For example, in a
product development environment, the examination of task dependency can identify unnecessary
iterations and feedback cycles that cause inefficiency. Often times these dependencies can be
modeled with various techniques ranging from process modeling to discrete event simulation. In a
hospital, the activities associated with a particular medical procedure can be represented as parallel,
sequential, and series tasks that represent all tasks from pre-operation to post-operation. A similar
analysis can be performed on the tasks for the MAV-PD.
Time
For all nodes and relations described above there is an additional attribute that must be captured in
the system-level model; time. The representation of time in the system can take various forms. For
example, time can be represented as a binary attribute for each node that defines whether a node or
relation existed (1) or did not exist (0) for a particular time interval. For example, over a hospital’s
lifecycle there are likely many changes of the staff. In some cases, doctors that may have existed in
the beginning may have departed and later returned. Therefore, each cell in the matrix has an
attribute called existence.

87-191
In addition, particular attributes may change over time. In the case of pharmaceuticals, costs for
particular products could be treated as independent variables that change quarterly. Thus, discrete
price changes for different time intervals can be captured in the system model. Yet other attributes
might be continuous, time dependent functions. For example, medical tenure may be a time
dependent function used to describe how long a doctor has served in a hospital. The ESM
framework is designed to include a representation of time. This is an area of ongoing research in the
social network literature. (Newman, 2003)
Figure 52: System Evolution
tfuture
tpresent
tpast A X AO X AF X AV X AS X AEnv X AActivities
A X OO X OF X OV X OS X OEnv X OObjects
A X FO X FF X FV X FS X FEnv X FFunctions
A X VO X VF X VV X VS X VEnv X VObjectives
A X SO X SF X SV X SS X SEnv X SStakeholders
A X EnvO X EnvF X EnvV X EnvS X EnvEnv X EnvSystemDrivers
ActivitiesObjectsFunctionsObjectivesStakeholdersSystemDrivers
A X AO X AF X AV X AS X AEnv X AActivities
A X OO X OF X OV X OS X OEnv X OObjects
A X FO X FF X FV X FS X FEnv X FFunctions
A X VO X VF X VV X VS X VEnv X VObjectives
A X SO X SF X SV X SS X SEnv X SStakeholders
A X EnvO X EnvF X EnvV X EnvS X EnvEnv X EnvSystemDrivers
ActivitiesObjectsFunctionsObjectivesStakeholdersSystemDrivers
System B
oundary
Col
umn
Influ
ence
s R
ow
Row is Influenced by Column

88-191
A Computerized Tool for Creating an ESM
In many ways, the ESM is an extraordinarily complex representation of an engineering system. As a
means simplify the creation of the ESM, a team of MIT researchers have developed a software tool,
System Modeling and Representation Tool (SMaRT), to simplify to process of representing a
complex system. The tool allows systems analysts to create systems models, like the ESM, from
systems documentation of text documents using a new procedure for model building presented in
Chapter 5 or through direct data entry. The software stores the information for the different classes
of nodes, relations, and attributes over time and allows for the easy retrieval of the information and
export of the information for analysis. A brief discussion of SMaRT is presented in Appendix A.
Summary
This chapter presents the Engineering Systems Matrix (ESM) as a framework for representing an
engineering system. The ESM provides a more complete modeling framework as compared to other
modeling frameworks presented in the Chapter 3. The Figure compares the ESM with the other
systems-level modeling frameworks based on the criteria presenting in Chapter 3. The ESM allows
the modeler the ability to represent each of the Engineering Systems domains discussed in the
conceptualization in Chapter 2. The ESM maps interactions within and across domains and allows
the modeler the ability to parameterize these relations. Chapter 7 demonstrates how information
represented in the ESM can be used for analysis. The ESM allows the modeler a means for
representing the systems as it changes over time. This not only includes changes in the structure of
the system (changing nodes and relations) but changes in the attributes of the components. Lastly,
the ESM allows for the enumeration of values of uncertainty for the quality of information and/or
the uncertainty of the components of the system.

89-191
Figure 53: Comparison of Modeling Frameworks with ESM The next chapter presents a new methodology for building models like the ESM that addresses the
limitations of procedure highlighted at the end of Chapter 3.
Evaluation Criteria for Scope QFD
UPP
Axio
mat
ic D
esig
n
DSM
DS
M/D
MM
Fra
mew
ork
DoD
AF
CLI
OS
ESM
Represents Social Domain + + ++ ++ + + ++Represents Functional Domain + ++ + ++ ++ + ++Represents Technical Domain + + ++ ++ ++ + ++Represents Process Domain + ++ + ++ ++ ++ + ++Represents Environmental Domain + ++ + + ++Represents Interactions within Domains ++ ++ ++ + ++ + + ++Represents Interactions across Domains ++ ++ ++ ++ ++ + ++Conducive for Quantitative Analysis + + ++ ++ ++Captures System Changes Over Time ++

90-191
Chapter 5 – New procedures and tools: using qualitative data and systematizing its use Engineering Systems combine material physical technologies with human action in a complex
organization. Thus, the understanding of Engineering Systems demands diverse knowledge. Managers
must consider the social and technical, the observable and unobservable, the concrete and abstract,
and the animate and inanimate to successfully affect the system. Therefore, the complexity of
Engineering Systems requires hybrid approaches for constructing our knowledge of such systems.
This research attempts to bridge what has frequently been described and experienced as an
unspannable chasm between the methods of social science and engineering science.
Specifically, this chapter describes a mode of incorporating qualitative information about an
engineering system into the framework described in Chapter 4. Information can be collected through
diverse modes: interview, observation, documentation. The information is converted into textual form
which is subsequently coded by the categories (nodes, relationships, attributes) represented on the
engineering system matrix. Once coded, the data is automatically inserted into the appropriate cells of
the matrix. In this manner, the system is visually represented by the distribution of the values of the
cells; the evidentiary data supporting that representation is contained within the cells.
Bridging the unspannable chasm
Too often overlooked in the chaos of disciplines (Abbott 2001, Abbott 1988), there are important
similarities between social science and engineering science. Both share an interest in the structure of a
system, the relationships between a system and its environment, and system behavior. Nonetheless,
the perceived vagueness of social science prevents engineers to bridge across epistemological,
disciplinary, and departmental boundaries. Engineers use principles of physical science as a basis for
description, analysis, and decision-making. Physical science has produced reliable laws and rules,
usually mathematically supported models and equations that purportedly model nature and
consequently enable synthesis of new processes and objects. The theoretical grounding of this
knowledge results from hundreds of years of modern empirical physical science and has become so
reliable and formulaic that engineers can routinely use this knowledge to build and analyze complex
physical systems. However, when it comes to the social and organizational aspects of system social
science is still in its infancy. It is only 150 years old and still lacks equally robust, general statements,
rules or laws. Although theoretical synthesis of social scientific knowledge is still relatively incomplete,
an insufficient foundation for strong predictive models (Rein 1999), social scientists have developed
several broadly applied and reliable techniques for describing and analyzing social action and culture.

91-191
Neither engineering nor social science has satisfactorily addressed the behavior of the social aspects of
systems intersecting with the technical aspects. Engineers pay inadequate attention to the human
components of systems. Social scientists too often fail to account for the role of technological and
physical constraints and opportunities
By adopting methods of ethnographic fieldwork and grounded theory construction, two well-
respected modes of social science research, for the exploration of both the social and technical
components systems, this research hopes to make transparent what has too often been the black
box of systems analysis. By developing a program for translating textual reports of observations and
interviews into coded data capable of being systematically and quantitatively analyzed, the researcher
can translate qualitative information into quantifiable matrices. Not only can social scientific
methods improve the descriptive validity of a complex system, but they can be used to improve an
engineer’s prescriptive ends as well.
Qualitative vs. Quantitative Methods for Constructing Knowledge
There are many differences between qualitative and quantitative research methods. For simplicity, in
quantitative social science, statistical methods are used to draw conclusions about a particular social
phenomenon from analyses of variation, correlation, and other forms of association within large data
sets composed of quantitatively represented information. Qualitative social science refers to methods
of “conducting inquiry that are aimed at discerning how human beings understand, experience,
interpret, and produce the social world.” (Sandelowski 2004) One difference in quantitative social
science and qualitative social science is that the survey researcher knows, or thinks he or she knows,
ahead of time the information that can be acquired. (Becker 2001) Becker explains that, for qualitative
researchers, there are often surprises in the connections of data acquired, but there are no surprises in
the data itself. The qualitative approach contrasts with quantitative researcher’s a priori “knowledge”
of the data of interest; the researcher engaged in qualitative data collection is not limited to the
questions on a survey as additional data and unexpected insights emerge through work in the field.
The qualitative researcher seeks to learn and understand the meanings people give to their world and
their experiences instead of testing hypotheses and constructing social facts. For example, when an
engineer changes a part of the system, we are interested in understanding “why?”, “what prompted the
action?”, “what signs were taken as cues?”. To understand “why?” requires that we understand
reasons for making the change. Many of the reasons may not be explicit. In fact, they rarely are.

92-191
However, they can be found in or excavated from the stories told about change. (Shearing and
Erickson 1999)
The process of collecting data involves the mutual construction of data between the researcher in
concert with social actors within the system. In doing so, the research sets out opportunities for
sharing rich detailed descriptions or observing actors at work. Rich detailed data or “thick” data are
written descriptions of events observed by researchers, extensive accounts of personal experience from
respondents, and records that provide narratives of experience (usually transcriptions of interviews).
In addition to participant observers’ fieldnotes, other accounts may produce rich detailed data. Rich
data includes thoughts, feelings, actions, and context (both material and relational). Thick, layered
descriptive information enables the analyst to trace events, to delineate steps and stages in a process,
and to make comparisons. From the rich data, we can begin to construct our model of the
engineering system.
Many engineers and managers are familiar with case studies and case histories, as these are often the
subject of engineering and business literature. They may, however, be less familiar with ethnographic
methods of data collection and grounded theory modes of data analysis.
Grounded Theory
When grounded theory originated as a social science method, researchers wanted to develop a more
systematic approach to analyze the wealth of qualitative data that was being collected through
observation and interviews. (Glaser and Strauss 1967) Glaser and Strauss offered grounded theory as a
credible methodological basis for theory building using qualitative data. This innovation contrasted
with the prevailing emphasis of positivist social science, which limited the use of qualitative analysis to
a precursor to quantitative approaches. (Charmaz 2004) The aim of ground theory methods is, as the
name suggests, to generate theory from the ground up. This is done by creating abstract concepts and
postulating relationships through inductive examination of empirical data. Grounded theory is
described as a “flexible, yet systematic mode of inquiry”, “directed, but open-ended”, and an enabler
of “imaginative theorizing”. Below is a brief summary of the Grounded Theory Method.
In the simplest terms, grounded theory is primarily, though not exclusively, inductive. Rather than
beginning with a model and observing empirical phenomena to determine whether they align with a
hypothesized relationship, grounded theory steers clear of this deductive approach by starting with

93-191
observations from which categories of similarity and difference are developed and then aggregated into
a model or hypothesis of a phenomenon.
The grounded theory method (Glaser and Strauss 1967; Charmaz 2001; Charmaz 2004) consists of the
following steps:
Develop research questions and sensitize concepts: The first task in grounded theory is for the research to
define provisionally an area of interest and a set of concepts, or sensitizing concepts (Blumer 1969),
that serve as what Charmaz calls a point of departure for a research endeavor. (Charmaz 2001) For
example, a study of geographically dispersed engineering design projects might begin with an interest
in how engineers coordinate design efforts across distance and time. These interests and concepts
serve as the basis for data collection, though they may change as data collection proceeds and perhaps
challenges the original provisional questions and project definition.
Collect data: Using the interests and concepts defined above, a researcher will begin the inductive
process of actively generating data together with participants. Subjects will be identified for interviews
and archives searched for relevant documents. Data collected from persons in interviews is obtained
through a conversation in which the interviewer asks open questions, inviting the respondent to report
on his or her experience with the material, organization, and technology in question. The questions
are derived from background research, previous interviews with others, documents describing roles,
technology, or organizational structure. In effect, the interviews are used to capture the actors'
experiences in as much detail as possible. The data are the actors' accounts and are retained in the
form of transcriptions from one-on-one interviews with subjects and notes from direct observation.
The goal is to generate rich data with “thick description” (Geertz 1973) that includes full descriptions
of observations and the detailed narratives of participants. In the data collection process, a researcher
leaves room for the unexpected surprises as the process of data collection is intended to provide the
information for inductive analysis. Using the same example, a researcher might conduct several
interviews with the engineers, managers, administrators and other stakeholders involved in the design
project and also observe the various work places, meetings, and transactions among the parties. The
interviews and observation notes are then transcribed into electronic text files.
Initial Coding: Coding is simply the process of a line-by-line labeling of the data according to the subject
information on each line. Charmaz (2001:341) explains that “coding is the pivotal link between

94-191
collecting data and developing an emergent theory to explain these data.” The goal of line-by-line
coding is to stay as close as possible to the language of the text. Subsequent coding attempts to
aggregate and conceptualize abstract from the concrete language into larger categories. An example of
line-by-line coding is found in Box 1:
Box 1. Sample Interview Transcript
Initial Memo-writing: Memo-writing is the free flowing synthesis of the patterns identified in the data,
usually involves raising codes into tentative categories. Memo-writing allows the researcher to
elaborate and describe the assumptions and details underlying emergent codes. This activity serves as
the basis for later theorizing concepts. See (Charmaz 2001:348) for example of memos.
Box 2. Sample Memo
Sample Memo Concept: Distributed Work The California management team seems very concerned about the distribution of work across different time zones. In particular, coordination with the Central Asian business unit is becoming more challenging as work days for the employees seem to lengthen due to coordination challenges with the Central Asian team. There are some grumblings that senior management cares more about saving a few dollars than they do about their employees. I over heard a conversation at the coffee machine where some of the younger workers were lamenting the current situation and considering other options. Questions: Do the management teams where work is not distributed experience the same complaints? Look at the literature on distributed work (Yates, Orlikowsky)
Interview with: Jane Doe ACME Corporation Chief Engineer Date: 11/2/01 Q: What are some of your challenges in coordinating design activities? Codes A: Because this is an international project that includes teams international, culture representing 5 different countries and 10 different time zones multiple nations,time it is very difficult to have real-time meetings to discuss issues Difficulty, Meetings as a team. We rely heavily on email and an innovative web- Email, Web sharing tool that allows all team members to interact with data… share tools, data, cooperation

95-191
Revise questions and collect data: Grounded theory is an iterative process. The researcher refines questions
and codes throughout the data collection process. Reengaging participants, clarifying meanings and
descriptions, and asking new or more focused questions is encouraged.
Focus coding: The data is examined to identify the most frequently used codes. Once the researcher has
identified themes from the line-by-line coding, more refined, conceptualized codes are developed.
These codes are also categorized and the data recoded.
Advanced Memo-Writing: The advanced memo-writing includes the task of outlining the emerging
theoretical concepts. What are the relationships among the codes? What connections can be made to
the literature? What is unexpected in the data? What questions and hypotheses emerge from the
coded data? These theoretical concepts will serve as the focus for the theoretical sampling phase.
Theoretical Sampling: Using the coded data and memos, what additional data should be collected to test
emergent hypotheses, make relevant analytic comparisons, and answer questions? What needs to be
known to support the emergent claims? The theoretical sampling phase is the final data collection
phase, in which the researcher collects data based on the theoretical concepts defined in the advanced
memo-writing phase. This is the most focused data collection. The emphasis is on grounding the
theory firmly in the data.
Theoretical Memo writing and conceptual refinement, Sorting Memos, and Integrating Memos: After the theoretical
sampling phase, the researcher begins the process of the theoretical memo writing and refining the
theoretical concepts using the data that has been collected. The memos are then sorted and integrated
into theoretical constructs.
Write the first draft of the analysis: It is at this point that the researcher is able to write the first draft of the
analysis that unpacks the theoretical construct grounded in the observation and supported by the
literature.
There is some epistemological debate in the social science community as to what qualitative research
passes as ground theory. Some see ground theory as a purely inductive methodology, by which
researchers are encouraged to examine data as a blank slate in order to allow for theoretical concept to
emerge purely by induction and observation. Others are much more pragmatic and recognize that it is
impossible to eliminate all disciplinary preconceptions. Despite these preconceptions, they argue that

96-191
grounded theory starts but does not end with these perspectives as researchers. The method allows
for, in fact expects for surprises, alternative explanations to emerge from the data.
There are also criticisms of qualitative methods and known pitfalls. These range from possible
misinterpretations of people experience and meanings caused by researcher bias, as well as the inherent
challenges created by studying human subjects. It is generally accepted that human subjects often fail
to give stable or consistent meanings to things, people, and events and change their mind frequently.
Worse yet, they are often not sure what things mean – they give vague and woolly interpretations of
events and people. In addition, people answer strategically and provide misleading information. There
is always a risk that researchers misinterpret the meanings as well. These concerns about the variability
among respondents and the reliability of first-hand reports (lots of literature on unreliability of
witnesses), is all the more reason to use tools to organize and make transparent the data provided. By
employing these methods we seek to replace speculation with observation. Grounded theory allows
the researcher to make both the data and the researcher's framing more explicit and transparent. It
provides readers and other researchers with the ability to scrutinize, to dispute, and perhaps even to
resolve competing interpretations.
Bridging the social and technical, qualitative and quantitative
The advantage of qualitative social science methods like grounded theory is an emphasis on data
collection, documentation, transparency of assumptions, and systematizing of data analysis. Based on
Dong’s research and my own experience, it was evident that most of the knowledge about the system
resides in the minds of the people involved in the system. A methodology for systematically capturing
this knowledge through transcribing interviews and a theoretically grounded way of systematically
analyzing these data has several advantages over current systems engineering methods for model
building. The remainder of this chapter presents a methodology that mixes qualitative social science
methods with traditional systems engineering tools for modeling engineering systems.
For classically trained engineers and managers, the fuzziness of theory building by observing social
interactions must seems a bit too intangible and intractable. Nonetheless, systems engineers recognize
that engineering is a social process and that much of the knowledge concerning the design process and
the technical artifact is in the minds of the people creating and enacting the system. Thus, some
specific methods may be a useful way for constructing systems-level models. The methodology
proposed here is called qualitative knowledge construction (QKC).

97-191
Procedures for Qualitative Knowledge Construction
Like grounded theory, QKC offers an iterative, systematic process for researching a complex system
that consists of a series of steps that include the following:
Identify a system of interest
Define objectives for analysis
Collect data
Code raw data
Organize coded data into a systems model
Examine model for missing and/or conflicted data
Resolve missing and/or conflicted data
Iterate
The details for each step are described in the sections below. The chapter concludes with an
application of QKC on an example.
Identify systems of interest:
The determination of system type is the first step in the methodology. For representing an
engineering system, the conceptualization presented in Chapter 4 serves as a basis for defining the
classes of nodes and types of relations required to describe an engineering system. Although useful
as a means for modeling engineering systems, the QKC methodology can be applied to represent
other types of systems. For example, a systems biologist might want to construct a systems-level
model of a physiological system. In this case, the research must define a conceptualization that
describes the system in order to classify and relate the system components. In addition to
identifying the system type, researchers should develop a tentative formulation of various
characteristics of the system, namely defining the system boundaries, from what perspectives the
system is modeled, developing strategies for observing the system of interest, and where can data
about the system be found. As data are collected and analyzed, the details of these assumptions will
be iteratively refined and improved.
Define objectives for analysis: For any model, it is important to determine the objectives. In analyzing large-
scale systems (e.g. the F/A-22 product development system), the modeling objectives might not
require a systems model representing several levels of decomposition of the thousands of employees
and the millions of technical components. Rather, the system modeler may be interested in questions

98-191
that can be understood by abstracting the complexity of the system to simplify the modeling process.
For the F/A-22 example, this might mean that system components would be modeled at the
organizational and major subsystem level of abstraction. Because QKC is an iterative method, details
can be added as the interests of the researcher change over time.
Collect data: The process of data collection for engineering system involves a variety of data types and
methods of data gathering. Because much of the knowledge about a complex system resides in the
minds of the human agency involved or surrounding the system, qualitative social science methods for
eliciting data through interviews are central to the methodology. As such, researchers must identify
subjects knowledgeable about the system, interview subjects using open-ended questions, and
transcribe interviews into text. QKC is not limited to interview transcription as researchers are
encouraged to collect all pertinent documentation describing the system. These might include
technical data used for computational models, engineering drawings, and systems documentation as
well as program documentation, presentations, or other information pertaining to the system. Because
QKC is a form of exploratory research, new sources of data will emerge through interviewing
participants and observation of the system. As data is collected about a system, the research can begin
the process of qualitative coding.
Code the Data: Qualitative coding in QKC is slightly different from what is described in grounded
theory. In QKC, the process of coding begins by developing a coding classification a priori that is
based on the system type. For systems classified as engineering systems, six coding classes are defined
by the ESM modeling framework (Stakeholders, Objectives, Functions, Objects, Activities, and System
Drivers). These classes serve as the basis for organizing the codes that emerge from the data. In QKC,
codes take the form of system components (node) and the relationship between components
(relations). The attributes of nodes and relations can be coded as well. In the spirit of grounded
theory, researchers are encouraged to identify and record codes that are not easily classified in the
ontology. These “orphan” codes can be later integrated into the system model or used as the basis for
further examination using grounded theory.
Figure 55 illustrates these ideas. Take for example the construction of a systems-level model of a
hospital. An analyst would collect data describing the system. This data might include transcripts of
interviews with system relevant actors, systems models used by the hospital to manage processes,
documentation of hospital protocols and standards, architecture drawings of the hospital

99-191
infrastructure, organizational charts, email messages, photographs, and any other type of data
describing the system. The data can then be coded (through conceptual or 'line by line' and then
conceptual coding) and organized into the systems-level framework as illustrated in Figure 55. The
figures on the left represent various types of data sources that describe the system of interest. The
ones on the right represent codes derived from the data that will be organized into a systems-level
model of the system. The different colors represent the class of code (green are stakeholders, blue are
objects, etc) the small ovals on the far right represent codes with attributes. For example, a
stakeholder “John” may be defined in an interview transcript. From the transcript, it is learned that
John is 6 feet tall. The attribute for storing John’s height can be defined and represented.
Figure 54: Coding in QKC

100-191
Figure 56 demonstrates the coding process. Take, for example, an excerpt from an interview with an
actor called “Mary”. Mary is a manager of an engineering project. As a manager, Mary is classified as
an external stakeholder within the system. On the left is a portion of a transcript of an interview with
Mary. She is asked about the primary customer for her project. In the interview, Mary identifies
“John” as one of the stakeholders in the system. On the right of the highlighted text is a code,
“Stakeholder.John”, which identifies John as a new element in the systems model. In the same
manner, other codes that emerge from the document are organized in the matrix as well. In this
example, other codes include relations between John and Mary (John interacts with Mary) and
Mary and John (Mary interacts with John). The code Stakeholder.John will be used each time
John is mentioned in the data that the researcher collects. The figure shows other codes that emerge
from the interview transcript as well.
Figure 55: Example of Qualitative Knowledge Construction
Organize coded data in a systems-level modeling framework: After coding the various forms of data, the codes
are to be organized into the systems-level framework that describes the system. From the example
shown in the Figure 56, the code prefix “Stakeholder” signifies that John is a stakeholder and is
represented in the corresponding upper left cell shown in the matrix on the far right. Similarly, the
codes for relations can be organized in the matrix. This can be done by hand, through the use of
computer spreadsheet software, or a customized database. As mentioned in the previous chapter, a
customized software application was created by a team of MIT researchers to streamline the QKC

101-191
process for coding and creating a systems-level model. A summary of the tool is presented in
Appendix A. Figure 57 illustrates the three steps discussed: collect data, code data, and organize coded
data in a system-level modeling framework. The colors represent the “address” in the ESM on the
right. The darker color for the attributes is used as a means to distinguish them from the codes.
Objects
Functions
Objectives
Stakeholders
SystemDrivers
ObjectsFunctionsObjectivesStakeholdersSystemDrivers
Objects
Functions
Objectives
Stakeholders
SystemDrivers
ObjectsFunctionsObjectivesStakeholdersSystemDrivers
Activities
Activities
System Models
Interview Transcripts
Program Management Documentation
Pictures/Photographs
CAD Drawings
Example Documentation Codes ESM
Code Attributes
Figure 56: Illustration of Coding Various Engineering Documents
Examine the model for missing/conflicting data. Once a systems-level model is constructed, the data can be
examined to identify missing or incorrect information. Because each element of the model can be
referenced to raw data (interviews, documentation, etc) researchers can invite others to review the data
to verify the assumptions.
In the case of engineering systems, there is a foundational assumption that all elements within the
system either contribute directly (or through other components) to the system goals. Therefore, any
discontinuities in the data should be resolved. An example of a discontinuity is the identification of

102-191
objects in the system that are not traced to functional components need to be reconciled. In this
example, researchers might ask questions like, “have we missed any functions?” or “are these objects
constituent components of the system, or not?” There are various graph theoretic search
methodologies for identifying these types of gaps in the matrix.
Resolve missing data: Once missing or conflicting data in the model is identified, analysts must take action
to resolve the conflicts. This is done through additional interviews, reviewing the raw data, and other
similar actions.
Perform Analysis: Once a systems model has been developed to contain the qualitative data into
quantifiable matrices, the researcher can apply various quantitative analytical methods for examining
the system structure and behavior. Opportunities for analyzing the systems model are presented in
chapter 7.
Iterate: Like grounded theory, QKC is an iterative process and researchers may are likely to perform
several iterations of the methodology in the analysis of a complex system.
The next section presents a toy example that demonstrates the QKC methodology in modeling a
generic, multistage supply chain.
Modeling a Supply Chain Using Qualitative Knowledge Construction: A toy example
In management science, the Beer Game has become a well-known tool for demonstrating the
counter intuitive behavior of supply chains and the importance of information. The beer game is a
simplified model of a basic supply chain that models the production, distribution, and delivery of
beer. The model is an example designed to illustrate a variety of management principles ranging
from the importance of information, human behavior, etc. This example demonstrates how a system
analyst can take a textual description of the beer game and build an ESM using qualitative
knowledge construction methodology presented in Chapter 5.
Beer Game Basics:
The Beer Game is a highly abstracted, simplified model of a multi-stage distribution system or
supply chain. The system can be conceptualized as an engineering system and thus represented
using the ESM modeling framework. The system consists of five stakeholders (Customer, Retailer,
Wholesaler, Distributor, and Factory) each with a well-defined objective (to minimize cost) that is

103-191
calculated based on beer deliveries and inventory. The goal of the game is to simulate the dynamic
behavior of supply-chain and highlight common challenges for supply chain management. Figure 58
illustrates the Beer Game layout mapping the supply chain from beginning to end.
Figure 57: Beer Game Layout (Source Sterman 1994)
Applying the QKC Methodology:
Step 1. Identify a system of interest: The system of interest is a hypothetical supply chain for beer
distribution defined by John Sterman (1994). The system is an example of an engineering system as
defined previously. The boundary of the system includes all components that can be controlled by the
Retailer, Wholesaler, Distributor, and Factory. All other components are considered exogenous.
Step 2. Define analysis objectives: The modeling objective is to simulate the dynamics of the supply
chain. This includes inventory dynamics, beer deliveries, and profits and losses.
Step 3. Collect Data: Numerous papers have been written to describe the beer game and many variants
now exist. For the purpose of this example, the description of the system described in Sterman (1992)
is used.
Step 4. Code Data: Using Sterman’s description of the Beer Game, the document is coded line-by-line
using the QKC coding approach. An example of line-by-line analysis of the Beer Game text is shown
in the figure below. The codes were generated using the comment feature of Microsoft Word.

104-191
Figure 58: Beer Game Coding Example
Examples of the codes are shown in the margin on the right. They include system components (e.g.
Stakeholder. Retailer), relations (Stakeholder. Retailer> delivers product to> Stakeholder. Customer)
and component attributes (Objects. Retailer Inventory: Holding Cost at time 0, $.50 per unit).
Step 5. Organize coded data in systems-level modeling framework: Each of the codes and attributes can be
represented in a model of the system using the ESM framework. A snapshot of the ESM that shows
nodes and relations in the system is shown in Figure 60.
The northwest corner of the matrix shows the social interactions between the stakeholders in the
game. These include the customer, retailer, wholesaler, distributor, and factory. Moving southeast:
the defined objectives for each stakeholder, the supporting functions, the objects, activities, and the
relations between each element are represented in the matrix. The numbers in the off-diagonal cells
represent the number of relations that exist between corresponding nodes. The blank cells represent
no documented relation exists.

105-191
Figure 59: A Snapshot of a portion of the Beer Game ESM
Steps 6-7. Examine model for missing/conflicted data and Resolve Data:
The textual descriptions for the beer game were complete.
Step 8. Perform Analysis: The information represented in the ESM can be used as the basis for
quantitative analysis of the system. Several system dynamics models exist that quantitatively modeling
the dynamic behavior of the Beer Game as described by the text and allows analysts to examine how
varying parameters can change the results of the model. The illustration below is a commercially
available model of the Beer Game developed by AT Kearney. The graphical structure is a visualization
of the quantitative model represented with stocks and flows described in the system dynamics
literature. (Sterman 2000)

106-191
Figure 60: Beer Game System Dynamics Model (Source Forrester, 2000)
The results of the model are shown in Figure 61, which illustrates the dynamic behavior of various
dependent variables defined by the model. This includes inventory and shipments dynamics.
Figure 61: Beer Game Model Output (Source Forrester, 2000)
The result of this example shows how an analyst can go from a textual description of a complex
system to an executable model using the QKC methodology.
A real-world example for using qualitative knowledge construction is presented in the next chapter,
which describes a case study of a product development system of a miniature uninhabited air vehicle
(MAV). The goal of the case is to demonstrate the QKC process of building an engineering systems-
level model of the evolution of a system from conception to production.

107-191
Comparing QKC and Grounded Theory
QKC contrasts with canonical grounded theory, as described in the previous section, in several
important ways. First, QKC begins with a well-defined preconception of the system qua system,
based on disciplinary knowledge. The conceptualization presented in the previous chapter serves as
basis for researching a complex system by providing a classification framework for organizing
knowledge of a system by class of objects (in the case of engineering systems: System Drivers,
Stakeholders, Objective, Functions, Objects, and Activities) and type of relations (Signal, Material,
Information, etc.). This is the first iteration of the classes of information used to describe the system.
Thus, an analyst can collect data (in the form of interviews, photographs, Computer-Aided Design
(CAD) drawing, system models, etc) that describe the system and by coding the data construct a
systems-level modebl.
Second, QKC differs from inductive grounded theory in that it specifies variation in codes a priori.
Some codes refer to the components of the system, e.g. stakeholders, objects, functions. Others refer
to attributes or information about these elements of the system. In grounded theory, traditionally,
these distinctions are relevant only if they emerge inductively.
Third, QKC differs from canonical grounded theory by locating unanticipated information, i.e.
information that is beyond the originally stipulated objects, persons, and relationships, as orphan
codes. By marking this unanticipated information as orphans, researchers are able to analyze how the
emergent description varies from the hypothesized system. This allows for iterative improvement in
modeling techniques over time. In addition, by systematically incorporating orphan codes within
original models future conceptualizations for complex systems will improve.5
Summary:
In summary, this chapter presents a new procedure for constructing a systems-level model of an
engineering system. The methodology is an improvement on existing systems approaches by explicitly
using established qualitative methods to construct a systems-level model of the system. The process
takes both qualitative and quantitative information surrounding the system and transforms this
information into quantifiable matrices.
5 Orphan codes can refer to information that cannot be representing in the existing modeling framework. For engineering systems and the ESM, orphans might include information about abstract concepts concerning power, flexibility, affect/emotion, or frustrations.

108-191
Chapter 6 – Using QKC as a Method for Modeling Engineering Systems and Illustrative Case
This goal of this chapter is to demonstrate the QKC methodological framework as a tool for both
studying and synthesizing a real-life engineering system. This chapter provides a step-by-step
through the QKC procedures presented in Chapter 5 for representing a miniature uninhabited air
vehicle product development system (MAV-PD) developed by the US Air Force Research
Laboratory (AFRL).
Applying the Methodological Framework in a Real World System
Step 1: Identify a system of interest
The AFRL MAV product development system (MAV-PD) is the system of interest. The MAV-PD
develops MAV prototypes for the US Air Force.
Determine system type: The MAV-PD is an engineering system with constituent components for each of
the following domains:
Social Domain: The Social domain includes the human components that affect and are
affected by the MAV-PD. In the MAV-PD, this included AFRL as the lead organization
that consisted of a team of managers, engineering, and technical support staff responsible for
the development of MAV prototypes. The social domain also includes several
subcontractors responsible for the development and testing of several technical subsystems.
In addition, there were a variety of external stakeholders including members from various
agencies within the US Air Force and other government agencies.

109-191
;
Figure 62: MAV-PD Internal Stakeholders Components
Functional Domain: The purpose of the MAV-PD is the design and development of MAV
prototypes that meets customer needs on schedule and within costs. Figure 63 is a snap-
shot of several functional components decomposed into sub functions. The highest order
function, Provide ISR Capabilities, was traceable to the user defined objectives for the MAV
prototype. The sub functions supporting Provide ISR map to various objects and the
processes in the MAV-PD.
Figure 63: MAV Air Vehicle Functional Components represented by
DoDAF SV-4 (Source Cooper, 2005)

110-191
Technical Domain: The MAV-PD’s technical domain includes lab infrastructure, hardware,
software, IT, testing equipment and facilities, as well as the MAV product system itself.
Figure 64 is a photograph of the MAV air vehicle. The picture in the lower left-hand corner
illustrates the “roll-up” capability for storage.
Figure 64: MAV Air Vehicle Components
Figure 65 shows several additional support subsystems. These subsystems include a laptop
computer, antennae, and a back pack.
Figure 65: Technical System Components Other examples of technical components included fabrication equipment used to manufacture the
MAV air vehicle.

111-191
Figure 66: Manufacturing Components
Process Domain: The MAV-PD process domain consists of the processes, activities, and tasks
involved in the design, development, and management of the MAV system. Figure 68 shows a
simplified mapping of the stakeholder components, process components, and technical
components. For example, Applied Research Associates, Inc. (ARA) was a subcontractor
responsible for the development of the ground station and technical components. The work tasks
related to the development of these technical components are examples of components in the
process domain.
Figure 67: Traceability between Stakeholder, Process, and Technical Components
Environmental Domain: The MAV-PD environmental domain consists of a variety of factors
ranging from regulatory agencies, other military organizations, various technologies, military

112-191
acquisition system, congressional budgets, and others. A broad sample of the environmental
components affecting the MAV-PD include changing threats (“red force”), rapidly advancing
technologies, external stakeholders and regulatory agencies, as well as changing needs with respect to
friendly (blue) technologies and tactics that the MAV might need to interact in order to perform
user defined missions.
Figure 68: Sample Environmental Factors
Define System Boundary: All assumptions are derived from the perspective of the MAV-PD Project
Manager (PM). Therefore, the system boundary includes all system components under the PM’s
control for the MAV-PD context.
Step 2: Define objective(s) for analysis
The objectives for analysis in this research were as follows:
1. Create an engineering model of the MAV-PD from the MAV Program Manager’s
perspective to demonstrate the feasibility of the QKC methodology.
TechnologyAdvancements
ExternalStakeholders
“Blue Force”Technology
Tactics
“Red Force”Technology
Tactics

113-191
2. Determine what can be learned through this analysis
Step 4: Collect Data
Data was collected describing the MAV product system from a variety of sources ranging from
program documentation, interview and interview transcripts, system models, and direct observation.
Data was collected over 24 months (Dec 2004 thru Dec 2006) and represents 46 months of the MAV-
PD life-cycle (Feb 2003-Dec 2006). Several thousand pages of interview transcripts, program
documentation, and other data were collected. For readers interested in a brief case history of the
MAV-PD see appendix B.
Sample Interviews/Transcripts:
MAV Program Manager 1 (PMAJ) MAV Program Manager 2 (PMID) MAV Program Manager 3 (PMBI) MAV Program Manager 4 (PMWJ) MAV Program Manager 5 (PMMD) MAV Chief Engineer 1 (ENSD) MAV Chief Engineer 2 (ENWJ) MAV Chief Engineer 3 (ENBK) USER (STCC) Aeronautical Systems Center Program Manager 1 (SPO 1)
Sample program documentation:
MAV Program Review 5 Aug 2003 MAV Program Review 9 Feb 2004 MAV Project Presentation 4 Mar 2004 MAV Program Review 5 Oct 2004 MAV Program Review 12 Oct 2005 MAV Bill of Materials MAV Capability Development Document (CDD) and MAV System Architecture 14 April 2006 DoDAF-Based MAV System Architecture (Cooper, Ewoldt et al. 2005) Various other documents, presentations, and other sources
System Models: (USAFA)
Small Electric Aircraft Aero performance Model (Wells 2001)

114-191
Step 5: Code Data: Figure 69 is an example of coding from one of the interview transcripts with MAV
Program Manager 5 (PMMD). Several stakeholders were identified in the transcript, as well as
stakeholder relations.
Figure 69: Sample Coding from Interview Transcript
Step 6: Organize coded data in systems-level modeling framework: The codes were organized into ESM
modeling framework. The Figure on the next page represents an ESM for the system for Time 3. The
matrix is 262x262 node symmetric matrix. The MAV-PD ESM shown in the Figure above includes all
components except system drivers. The gray box indicates that a relationship exists between two
nodes and is represented as a binary 1 or 0. This visualization provides a very limited view of the rich

115-191
content stored within the ESM as information about node and relation attributes are hidden. Ongoing
research efforts are exploring new visualization methods for presenting the data found within the
model.

116-191
Stakeholder Stakeholder Stakeholder Stakeholder Stakeholder Stakeholder Stakeholder Stakeholder Stakeholder Stakeholder Stakeholder Stakeholder Stakeholder Stakeholder Stakeholder Stakeholder Stakeholder Stakeholder Stakeholder Stakeholder Stakeholder Stakeholder Stakeholder Stakeholder Stakeholder Stakeholder Stakeholder Stakeholder Stakeholder Stakeholder Stakeholder Stakeholder Stakeholder Stakeholder Stakeholder Stakeholder Stakeholder Satisfy USER Development Requirements Maximize Airman Survivability Improve ISR Capabilities Enhance Situational Awareness Real Time Feedback??? Instantly accessible??? Increase Airman ISR Standoff Capabilities Allow operator to see beyond line of sight Provide standoff targeting capability Maximize Range KSA_Directional Range KSA_Omnidirectional Range Support Assured Target Destruction Provide Instantaneous Battle Damage Assessment Perform Time Critical Targeting Improve Targeting Efficiency KPP_Maximize Sensing Acuity KSA_Night Acuity Sensing Maximize Image Quality Minimize ISR System Logistical Footprint Man Packable KPP_Minimize Size KPP_Minimize Number of Operators KPP_Minimize Weight KPP_Minimize Volume Individual operable Easy to Use Provide Hand Launch Capability Semiautonomous Land Capability Semiautonomous Launch Capability Semiautonomous Flying Ability KSA_Loss of Link to Rally Point Maximize ISR System Responsiveness Minimize Set-up Time Minimize Relaunch Time Minimize ISR Logistical Support Simplify Field Repair Minimize time to replace damaged payloads KPP_Allow interchanging of payloads Maximize Maintainability KSA_Minimize Battery Swap Time Maximize Ability to Support Net-Centric Operations KPP_Net ready Maximize ISR System Persistence KSA_System Endurance Maximize Power Management Minimize Development Costs Minimize Lifecycle Costs Meet Contract Requirements (ARA) Build ARA Presitge Find New ARA MAV Customers Meet Contract Requirements (Amtec) Meet Contract Requirements (BYU) Meet Contract Requirements (IR Solutions) Meet Contract Requirements (Coherent) Meet Contract Requirements (COTS Suppliers) Provide ISR Capabilities Sense Target Recognize Target _ Perform MAV Functions Produce Power (Air) Provide Power (Air) Direct Power (Air) Deliver Power (Air) Carry Payload Contain Payload _ _ Provide Aircraft Radio Transciever _ _ _ Recive Data from Ground Station _ _ _2 Transmit Data from Ground Station _ _ _3 Modulate Radio Signal from Ground Station _ _ _4 Demodulate Radio Signal for Ground Station _ _2 Process Commands _ _2_ Accept and Validate Input Packets _ _2_2 Translate Commands _ _3 Maneuver and Maintain Flight _ _3_ Monitor Sensor Data _ _3_2 Calculate Correction _ _3_3 Influence System _ _3_4 Check for Loss of Link Propel UAV Maintain Air Velocity Generate/Maintain Lift Control MAV Change Air Flow Change Surfaces Steer MAV _ _4 Provide Video Transmitter _ _4_ Accept Image from Camera _ _4_2 Modulate Video Signal _ _4_3 Transmit Video Signal _2 Provide Ground to Air Functions _2_ Provide Ground Stations Radio Transciever _2_ _ Recieve Data from Aircraft _2_ _2 Transmit Data from Aircraft _2_ _3 Modulate Radio Signal to Aircraft _2_ _4 Demodulate Signal from Aircraft _2_2 Provide Video Receiver _2_2_ Receive Video Signal from Aircraft _2_2_2 Demodulate Video Signal _2_2_3 Digitize Video Signal _2_3 Process Joystick Commands _2_3_ Receive User Inputs _2_3_2 Output Voltage Change _3 Provide Human Computer Interface _3_ Recognize Hardware and Applications _3_ _ Recognize Comm Hub Devices _3_2 Provide Mission Planning Support _3_2_ Accept Manual Waypoint Coordinates _3_2_2 Accept Automated Waypoints _3_3 Provide Display to Operator _3_3_ Monitor Standard Telemetry and GPS Info _3_3_3 Manipulate and Convert Metadata _3_3_4 Update GUI Display Guide Controls _3_4 Process User Commands _3_4_ Acccept User Commands _3_4_2 Compare with Standard Telemetry Packet and GPS Info _3_4_3 Translate Command and Calculate Response Produce Power (Ground) Provide Power (Ground) Direct Power (Ground) Deliver Power (Ground) Recharge Batteries Manage Development Contracts Reduce Signature Reduce Audible Signature KSA_Minimize Audability Reduce Infared Signature Reduce RCS KSA_Minimize Signature (Vehicle Finish) MAV Weapon System Air Vehicle Payload Subsystem Image Acquisition Subsystem Camera # Camera #2 Camera Mounting Engine Subsystem Engine Propeller Engine Connectors Battery Subsystem Batteries Battery Connectors Battery Switches Fuselage Subsystem Fuselage Structure Wing Subsystem Wing Composite Structure Wing Mounting Points Wing Skin Ribs Control Subsystem Actuator # Actuator #2 Empennage Subsystem Control Surface # Control Surface Hinge # Control Surface #2 Control Surface Hinge #2 Autopilot Subsystem Autopilot Software Autopilot Hardware Communication Subsystem (Datalink) Air Vehicle Radio Air Vehicle Antenna Ground Station Subsystem Ground Station Antenna # Ground Station Antenna #2 Ground Station Software Ground Station Radio Ground Station Reciever Ground Station Transmitter Ground Station Battery Subsystem Battery Recharger SubSystem Human Interface Subsystem_Operational Control Unit Laptop User Interface Software Data Processing Software Joystick Transport Subsystem Container Development_Build Prototypes Development_Award Development Contract Development_Obligate Funding Development Development_Intergrate Development MAV Weapon System Development_Test Development MAV Weapon System Development_Conduct Development Design Reviews Development_Design Development Fuselage Development_Design Development Ground Station Development_Design Development MAV Weapon System Development_Design Development Auto Pilot Development_Capability Limits Training Development Support Flight Demonstrations Execute Proprogrammed loss of link/GPS
Figure 70: MAV-PD ESM at Time 3

117-191
Figure 71 shows the state of the ESM at five different time instantiations. At each time instantiation,
the structure of the graph is slightly different as various nodes and relations have been added or
removed.
Figure 71: MAV-PD ESM at Five Different Time Instantiations
Steps 7-8: Examine model for missing/conflicted data and Resolve Data:
The ESM model was presented to several members of the MAV-PD for review. The members of the
MAV-PD were able to interact with the data and examine the nodes and relations for the system.
Several changes were made in the process of the reviewing the data. For example, there was an
instance where an individual stakeholder had been reassigned to another project, yet that stakeholder
had remained in the system model at a particular time instantiation. This and other data conflicts were
corrected as they were identified.
Step 9: Perform Analysis

118-191
Once the ESM is populated with data, a variety of analyses can be done. A discussion of various types
of analyses is presented with examples in Chapter 7. For the MAV-PD, one of the analysis objectives
was to examine how the structure of the system changed over time by calculating various network
metrics using a commercially available software application, UCINET. (Borgatti 2002) This analysis
as well as others is presented in the next chapter.
Step 10 Iterate:
There were several iterations between the steps outlined above. Since the MAV-PD is an active
system that continues to change over time, as new information becomes available and the model is
changed to better represent the system.
Chapter Summary
This chapter provides an example of using QKC a means for representing an engineering system.
The chapter explains the procedures for representing the MAV-PD system, the construction of an
ESM for the MAV-PD, and an example of a type of analysis that can be performed using the
methodology. The example demonstrates the usefulness of the methodological approach for
representation an engineering system. The next chapter explores how several well established
analytical methods can be used to gain further insights, discusses the possibilities for new
approaches, and concludes with some researchable hypotheses.

119-191
Chapter 7 – Analyzing the MAV-PD
Once an ESM is created for an engineering system, a variety of methods and tools are available to
analyze the system. From a qualitative perspective, the process of constructing the ESM leads to a
number of observations about the MAV-PD that serves as a basis for quantitative analysis. Appendix
B provides a qualitative account of the MAV-PD with examples to demonstrate the types of analysis
enabled by the proposed methodology and ESM. This chapter summarizes only a sampling of
analytical methods that can be applied to the ESM. In addition, the chapter explores limitations of the
methodology and the ongoing extensions.
This chapter is divided into four sections. Section 1 discusses the various analytical viewpoints and
modeling perspectives for an engineering system. Section 2 begins with a brief summary and examples
of well-documented network-based methods from the classic DSM literature for analyzing the
information represented in the ESM. Next, this chapter discusses possible extensions to network-
based analysis that the ESM framework offers. Section 3 discusses how the information represented
in the ESM can be used for various non-network analysis methods. Section 4 examines known
limitations and possible extensions of this research. In particular, this thesis discussed how the ESM
can be used for hybrid modeling approaches aimed at using various analysis tools synergistically to gain
deeper insights into a system.
Section 1: Analytical Viewpoints
Within an engineering system often there are often a variety of stakeholders with varying analysis
needs. The emphasis of this thesis is devoted to scholars interested in applying analytical methods for
understanding the structure and behavior of Engineering Systems so as to develop better theories and
heuristics for designing, developing, and managing these systems. The intent is that the proposed
methodology will be used as a means for decision support and analysis for ongoing efforts to design,
develop, and manage an engineering system. As discussed in Chapter 5, analysis begins with specific
questions and well-defined modeling objectives. Once a problem is properly framed, an analyst is able
to determine the most appropriate tools to answer the question. In an engineering system, there are
likely to be multiple stakeholders with various perspectives on the system and that often have unique
questions of interest. For a product development system like the MAV-PD, there are various
stakeholder viewpoints within the system. Engineering staff might be interested in the developing
analytical models to describe the MAV technical performance. The operations staff might develop

120-191
discrete-event simulation models of development processes and manufacturing. The management
staff may request a variety analyses from economic modeling to activity-based costing models or
scheduling optimization models. Figure 72 shows a simple illustration that highlights various analytical
views within a particular engineering system. Each view, represented by a flashlight and beam,
contains particular analytical needs and information concerning the system.
Figure 72: A Sampling of Analytical Views of an engineering System6
Each type of analysis requires certain information about the system. For most systems models, the
information requires the identification of system variables and parameters, the attributes of these
variables, the relations between them, and the system constraints. The ESM is designed as a means of
organizing and storing this information about an engineering system in framework conducive for
analysis. The ESM can serve as framework for organizing systems models by cataloguing the relevant
information about the system and ensuring that assumptions hold across models. This capability
becomes critical when analysts attempt to mix models and develop hybrid-models for a complex
system. (Mingers, 1997) For example, if systems analysts had developed a game theoretic model
representing stakeholder payoffs for a system’s objectives and wanted to use this information as the
basis for a design optimization, the information for both models can be represented in the ESM. By 6 The inspiration for this Figure came from Chris Glazner’s slide “ ‘Views’: The Enterprise Architect's Flashlight” for a 27 April 2007 presentation New Frontier’s for Modeling Complex Social and Technical Systems given a meeting of the MIT Engineering Systems Society.

121-191
representing the models in the ESM, the analysts are able to identify possible information gaps in the
models, and ensure that the assumptions for the game theoretic model and the design optimization
model hold. Traditionally, game theoretic models are used by economists and design optimization
models used by engineers. The ESM provides new opportunities for bridging analytical viewpoints.
Glazner (2007) explores the topic of model-mixing and hybrid modeling to understand the dynamic
behavior of engineering systems at the enterprise level of complexity. In his work, he explores how the
ESM can serve as the basis for modeling the dynamics of various aspects of a small company.
Section 2: Network-Based Analysis
Using the ESM as means for model mixing and hybrid-modeling is an open area of research; however,
there are a variety of existing methods and tools that can be applied to the ESM. This section provides
a sampling of the literature on network-based approaches for analyzing portions of the ESM. The
section begins with samples from the literature explaining common DSM methods of network
clustering and sequencing. Next, the possibility of extending network-based approaches across
domains is briefly explored with an example from the MAV-PD data set.
DSM Clustering
In their paper, Danilovic and Browning (2007) discuss matrix clustering as a useful technique for
examining the structure of a system. The methodology simply applies graph theoretic clustering
algorithms to reorder the elements of the matrix by grouping highly related elements. The intuition is
that by grouping the elements with high interaction engineers can more easily identify interfaces
between clusters. In the ESM, the same type of clustering can be applied to the Stakeholders Matrix
and the Objects Matrix. For example, engineers can use matrix clustering to examine strategies for
modularizing systems, integrating subsystems, and measuring coupling between components
represented in the Objects Matrix. (Browning 2001) Project managers can use DSM clustering to
examine organizational structures in much the same way the engineers examine the technical
architectures. Matrix clustering provides a means for managers to examine organizational interfaces
and agent interactions represented by the Stakeholders Matrix. (Browning, 2001)

122-191
Figure 73: Objects Matrix before Clustering (Danilovic and Browning 2007)
Danilovic and Browing (2007) present a step-by-step example of the DSM clustering technique in
their analysis of an airport design. The 1s, 2s, and 3s represent the strength of interdependencies.
Figure 73 shows the original ordering of the system components before clustering. Figure 75 shows
the ordering after clustering. The key insights for this application are the identification of the system
components that connect clusters. The authors term these components “linking pins” that require
special attention by the engineers and/or managers.

123-191
Figure 74: Objects Matrix After Clustering (Danilovic and Browning 2007)
DSM Sequencing:
Another common methodology in use by the DSM community is matrix sequencing. This analytical
method is designed to reorder system components with time-based dependencies. In an engineering
system, the system components with time-based dependencies are generally found in the process
domain and are represented by the Activities Matrix in the ESM. As such, managers and operations
staffs desiring to improve process or streamline work tasks have applied the sequencing algorithm to
examine strategies for process design. (Eppinger, 1990, Steward, 1981)
Danilovic and Browning (2007) provide a sample analysis of DSM sequencing for a product
development system. The system components represent product development activities and tasks.
The off-diagonal elements represent a precedence relationship between tasks, meaning information
or material is required from the column task to the row task. Thus, the DSM is read that element 1
“offer” precedes element 2 “contract review”. This relationship is represented by the “1” in lower
triangle of the matrix. The sequencing algorithm reorders the design tasks by lower triangularizing

124-191
the matrix. The intuition is that lower triangularizing the matrix and reordering the system
components such that the sub-diagonal ticks are close to the diagonal maximizes the feed-forward
flow of information and materials and simultaneously minimizes possible inefficiencies caused by
feedback and rework.
Figures 75 and 76 from Danilovic and Browning (2007) illustrate the before and after of a sequenced
product development task structure. Figure 75 is the unsequenced task structure where Figure 76 is
the sequenced task structure. The alternating light and dark bands show independent activities that
can be accomplished concurrently. The elements below the diagonal represent precedence relations.
The elements above the diagonal represent where assumptions about downstream activities must be
made.
Figure 75: Activities Matrix before Sequencing (Danilovic and Browning 2007)

125-191
Figure 76 : Activities DSM after Sequencing (Danilovic and Browning 2007)
Danilovic and Browning explain that “the assumptions are often the drivers of rework in projects,
so it is important to expose them clearly and early and account for their potential impacts (risks)
during project planning. Once the assumptions and couplings that drive iteration and rework in the
PD project are identified and ‘‘unwound’’, then traditional linear project management tools and
techniques like Gantt charts, project evaluation and review technique (PERT), critical path method
(CPM), and critical chain can be applied.” (Danilovic and Browning 2007:304)
Multi-domain Network Analysis: The DSM methods discussed above isolate the analysis to only one domain. This section explores
what can be learned by using network metrics to analyze the system across domains. For the MAV-
PD, one of the research goals is to examine how the structure of the system as it changed over time.
As mentioned in the previous chapter, data was collected that represented over 3 years of
development. Figure 81 is a network visualization of the entire ESM at time 3. The red nodes
represent the stakeholder components, the grey nodes the technical components, the purple the
activities, the black the functions, and the blue the system objectives. The links between nodes

126-191
represent that a relationship exists between nodes. For simplicity, the entire graph is represented as an
undirected graph.
Figure 77: Multi-Domain Network Visualization at Time 3
Once the MAV-PD is represented as a large network a variety of network metrics can be calculated.
Many of the network metrics that exist were generated by the social network analysis community to
analyze social networks. Calculations such as betweeness, path length, and centrality each have a
particular meaning in a social network context. An interesting research question is “to what extent is
existing social network measures applicable when analyzing a heterogeneous network with
components from multiple domains?” This research does not attempt to answer this question; rather
it explores some observations gleaned by applying these metrics to the MAV-PD data. The metrics
calculated for MAV-PD included average degree (the average number of in- and out- relations per
node), average path length, and clustering coefficient for five different times in the MAV-PD life-cycle.
(Newman 2003) Figure 78 compares the MAV-PD network metrics with systems in other
domains.(Albert and Barabási 2001; Newman 2003)

127-191
# of nodes# or
relations avg. degreeavg. path
lengthRand Grph
theo l Clus. Coef Clus. CoefRand Grph
theo C
Network Type n m <k> l C(1) C2) <k >/n
Technological
Internet undirected 10 697 31 992 5.98 3.31 5.19 0.035 0.39 0.0005power grid undirected 4 941 6 594 2.67 18.99 8.67 0.1 0.08 0.0004Train routes undirected 587 19 603 66.79 2.16 1.52 0.69 0.12software packages directed 1 439 1 723 1.2 2.42 39.81 0.07 0.082 0.0008software classes directed 1 377 2 213 1.61 1.51 15.18 0.033 0.012 0.0012electronic circuits undirected 24 097 53 248 4.34 11.05 6.87 0.01 0.03 0.0002peer-to-peer network undirected 880 1 296 1.47 4.28 17.6 0.012 0.011 0.002BOSTON T undirected 81 3684 45.48 1.887 1.15 0.94 0.857 0.565BiologicalSilwood Park Food Web 154 4.75 3.4 3.23266053 0.15 0.03 0.03084416C. Elegans 282 14 2.65 2.13784938 0.28 0.05 0.04964539Social Networks
Movie Actors undirected 225226 61 3.65 2.99811184 0.79 0.00027084LANL Coauthorship undirected 52909 9.7 5.9 4.78685129 0.43 0.00018333
MAV-PD Time 1 undirected 184 884 4.87 3.61 3.2941417 0.293 0.209 0.02646739MAV-PD Time 2 undirected 196 956 4.93 3.665 3.30845964 0.314 0.2 0.02515306MAV-PD Time 3 undirected 262 1232 4.702 3.621 3.59714977 0.316 0.196 0.01794656MAV-PD Time 4 undirected 223 1106 4.96 3.667 3.37651579 0.299 0.19 0.02224215MAV-PD Time 5 undirected 206 778 3.77 4.437 4.01475136 0.221 0.126 0.01830097
>< kn
loglog
Figure 78: Network Metrics
As shown at the bottom five rows in Figure 78, the size of the MAV-PD network and the density of
the relationships change over the five different time instantiations. The changes to the network are
not surprising as frequent organizational changes and various technology changes were well
documented and observed during the MAV development. It is interesting to note the difference in
network metrics at Time 5 compared to the other time instantiations. The metrics shows the
degradation in the number of relations exceeds the degradation in the number of nodes, the average
degree <k>, and clustering coefficient are smaller, and average path length metric is longer. After
observing these changes in the network metrics, the data were reexamined for insights as to why these
metrics might have changed.
The first step was to examine what elements in the system changed between Time 4 and Time 5. A
review of the data show that significant organizational changes occurred between Times 4 and 5. In
the stakeholder matrix, there were significant changes in personnel as new personnel replaced several
experienced members of the MAV development team. For example, the AFRL MAV Program
Manager (PMWJ) returned to graduate school and the USER liaison (STCC) retired from the military.
Both PMWJ and STCC were replaced by individuals with little or no experience on the MAV project.
In order to examine the significance of PMWJ and STCC’s role on the project, individual network
metrics, degree centrality and betweeness were calculated and compared to the other stakeholders in
the MAV-PD. Degree centrality is the sum of the number of relations received and initiated by a node.

128-191
Betweenness is a measure of the number of times a vertex occurs on a geodesic, or the short path
connecting 2 vertices. In other words, betweeness measures how often a node sits in the shortest path
connect two other nodes.
Figure 83 compares PMWJ and STCC’s degree centrality and betweeness with the MAV-PD averages
for each time instantiation and the measures for their replacements at time 5. The metrics show that
both stakeholder’s centrality measures grow over time and are significantly larger when compared to
the MAV-PD averages at each time instantiation. At time 5, both PMWJ and STCC were removed
from the network and replaced with two new agents with significantly smaller measures.
PM and ST ReplacementsPMWJ Time 1 Time 2 Time 3 Time 4 Time 5Degree Centrality 38 46 61 53 8Betweeness 3643 5427 11836 10331 1769.191
STCCDegree Centrality 16 21 28 23 4Betweeness 820 866 1667 3501 240.846
MAV-PD AvgsDegree Centrality 4.87 4.93 4.7 4.96 3.777Betweeness 238 258 280 296 338.777
Figure 79: Individual Metrics for PMWJ and STCC The network measures provide quantitative insights into the MAV-PD; however, in order to further
unpack the meaning of these metrics requires a closer look at the raw data. The data provides
qualitative insights into the significance PMWJ and STCC and provides possible answers to the
questions raised by the metrics. For example, if one follows PMWJ rise to influence during the MAV-
PD life-cycle the metrics are not surprising. PMWJ started on the project as an engineer intern that
was given the responsibility for designing and hand fabricating the first AFRL prototypes developed
by the AFRL team. Over time PMWJ was promoted to deputy engineer, then chief engineer, and then
after 2 years was made the program manager for MAV-PD. In the raw data, there are several accounts
that describe PMWJ’s commitment to the project, long hours, and the point of most technical
decisions. In addition, PMWJ was embraced by the user community and formed many non-traditional
social ties with stakeholders across organizations and up-and-down the chain of command.
At time 5, the changes in the network metrics reflect the changes observed within the system. The
departure of PMWJ and STCC from the program was significant for the MAV-PD system. The

129-191
replacement stakeholders were brought in from outside organizations and had no experience with the
MAV-PD. As a consequence, the cohesion of the MAV-PD was disrupted as the structure of the
system changed into a classic military stovepipe compared to the flat structure created by PMWJ and
STCC’s connections in the system as evidenced by longer path lengths and a stricter hierarchic
organizational structure.
The results on the MAV-PD network can be seen when contrasting metrics at Time 4 and Time 5. At
Time 5, the metrics shows a longer average path length and a smaller average clustering coefficient,
which supports the qualitative data that support the observation that there were significant structural
changes when PMWJ and STCC left the MAV-PD. As discussed in Appendix B, the effectiveness of
the MAV team to develop new MAV prototypes rapidly diminished shortly after PMWJ and STCC
left the program. Within 6 months after the PMWJ and STCC left the system, the MAV-PD’s capacity
to develop MAV prototypes diminished so severely that the system stopped advancing MAV
prototypes altogether.
Comparing Domain Metrics and Multi-Domain Metrics: The next set of analyses compared betweeness metrics within the Stakeholders Matrix (the social
network only) with the larger system (MAV-PD ESM). As mentioned in the previous section,
betweeness is the measure of the number of times a vertex occurs on the shortest path between tow
vertices. In social network analysis, this measure is associated with the control of information. Thus,
stakeholders with higher betweeness have greater influence on a social network when compared with
stakeholders with lower betweeness. The hypothesis was that the rankings of the top ten social actors
for betweeness would be the same for both the Stakeholder Matrix and MAV-PD ESM.
In Figure 80, the table on the right shows the top ten stakeholders ranked by betweeness measure
within the social network of the MAV-PD at time 3. The table on the left shows the top ten
stakeholders ranked by betweeness over the entire, multi-domain MAV-PD network at time 3.

130-191
Rank MAV-PD Social Network Betweeness Rank MAV-PD Entire Network Betweeness1 PMWJ 500.199 1 PMWJ 10972.9932 STCC 199.471 2 KTRDM 3680.0173 PMBI (MAV-PD PM 3) 84.154 3 KTRNM 1972.0814 SPOMD 54.547 4 STCC 1556.7075 SPOKE 45.143 5 PMBI (MAV-PD PM 3) 1372.5886 SPOGR 43.867 6 KTRRC 1004.0627 KTRDM 40.153 7 KTRTT 618.3128 STYA 21.676 8 KTRBR 390.4639 STSP 20.47 9 SPOMD 293.35410 PMFC 15.23 10 STYA 275.212
Figure 80: Stakeholder Betweeness Ranking Comparison The tables show that the stakeholder betweeness rankings changed. On the left, the ranking for
betweeness revealed no surprises. The highest ranked stakeholders were PMWJ and STCC, as
highlighted in the previous section. PMWJ was the MAV-PD chief engineer, and STCC was the user
representative for the system. PMBI was the MAV-PD program manager. SPOMD, SPOKE, and
SPOGR were USAF staff responsible for managing the MAV production contract. KTRDM was
the lead contractor responsible for the MAV ground station and the MAV production contract. The
results were as one might have expected through observation of the system and reviewing the raw
data. However, when the analysis was expanded to include the functional, technical, and process
domains, the rankings changed. For example, subcontractor KTRDM’s betweeness rankings
surpassed the MAV program manager PMBI, suggesting that KTRDM’s influence within the system
may be more significant than what is suggested by only looking at the stakeholder (social) network.
Summary of Network-Based Analysis: Network-based analytical tools like DSM clustering, sequencing and others are useful for learning
understanding the structure of Engineering Systems. The ESM provides a means to perform apples-
to-apples comparisons of seemingly different Engineering Systems by representing the system as a
network. Future work must be done on multiple fronts. From a theoretical perspective, scholars
must develop theories for multi-domain network analysis, analytical methods for analyzing dynamic
networks, new metrics for engineering systems, and methods for comparing networks. Empirically,
ESMs must be constructed for many types of systems and analyses compared across systems. Once
several ESM datasets are available, scholars can look for patterns across systems and domains in
hopes of developing new theories and better heuristics that describe and explain the structure and
behavior of engineering systems.
Section 3: Non-“Network” Based Approaches:

131-191
A non-network analytical method, multi-disciplinary design optimization (MDO), was used to
determine the optimal design configuration of the aircraft that would maximize the flight endurance
and minimize the longest-linear dimension of the aircraft. The analysis required information from
the functional domain and technical domain, namely system requirements in the form of the
objective function (the mathematical formulas that describes the MAV technical performance) and a
physics-based model of the MAV system.
Figure 81: Objective Function
A physics-based model describing the performance of the MAV was created by the United States
Air Force Academy. The model was validated and verified by the AFRL MAV engineers. Figure 82
is a screenshot of the user interface for the UAV model written in Microsoft Excel.
100081.9
/ max ××
××××=
eMAVnoengin
trimmotorpropengine
mVetaetaeDL
Endurance
2
2
⎟⎟⎠
⎞⎜⎜⎝
⎛+=
wing
wingwingLinDim b
SbS ⎟
⎟⎠
⎞⎜⎜⎝
⎛+××=
wingr
wingtwingr
wingwing c
cc
bS
_
__ 1
2
1.
2. Where:
Minimize (- Endurance, Longest Linear Dimension) Where:

132-191
Figure 82: Screenshot of MAV Physics-based Model
The result of the analysis was a design tradespace that approximated a Pareto frontier (red circles) as
shown in Figure 83.
Figure 83: Design Tradespace for MAV
Each element in the diagram represents a different design configuration for the air vehicle. The
designs that lie on the upper left are the approximated Pareto optimal designs or the designs that
cannot be simultaneously improved along both dimensions.
Endurance vs. Longest Wing Dimension
0.4
0.5
0.6
0.7
0.8
0.9
1
1.1
1.2
18 28 38 48 58 68 78 88
Xo1
Xo2
Xo3
Xo4
Xo5
Xo6
Approx. Pareto Front
Longest Linear Dimension (cm.)
End
uran
ce (h
r.)

133-191
The MDO analysis is useful to examine alternative design configurations for the MAV. For the
purpose of this research, the analysis demonstrated that the information required for the analysis
could be represented and organized in the ESM.
Section 4: Hybrid Modeling
In addition to the methods presented, the ESM might be useful for organizing the data to support
model mixing and hybrid modeling. This section explores the concept of using information from
different models to identify the components (or sets of components) in the system that are good
candidates for designing “flexibility” or where to platform, or what has been coined in this research
“hot/cold” spot analysis.
Hot/Spot Cold Spot Analysis The engineering design community has been exploring methods for designing flexible systems or
systems that are able to change with relative ease. Clarkson and Eckert (2004) define two sources of
change in engineered system, emergent and directed. The term, emergent, describes unexpected
change that occurs from within the boundary of the system. For example, in the development of
the MAV, one of the engineers on the team accidentally broke the wing of one of the prototypes of
the system, while “playing” with system at his desk. This failure propagated throughout the system,
causing several schedule delays, work disruptions, and other problems. Directed changes are
prescribed by the stakeholders, usually in the form of declared requirements changes. In the case of
the previous example, the engineer “playing” with the wing included bending the composite wing
while brainstorming ideas for fitting the MAV in a small backpack. While bending the wing, he
conceived of a new “wing roll-up” requirement for the system. He called the contractor responsible
for the design of the wing and levied the new requirement. This requirement change initiated a
completely new design for the wing and affected various other aspects of the system. In order to
manage the uncertainties surrounding there systems, engineers are devising new methods to design
systems that are flexible (easy to change).
One of the challenges for engineers is how to design flexibility or create “Real Options” that allow
systems designers and managers to easily change the system in order to maximize benefit and
minimize cost. (de Neufville 2002) defines two types of Real Options, those “in” and those “on” a
system. Real options “on” are financial options taken on technical things or projects. A real option

134-191
“on” a system treats technology as a “black box”. On the other hand, real options “in” systems are
taken by changing the design of the technical system. Real options “in” require deep knowledge
about the structure and behavior of the technical system. The real options literature has produced
many strategies and methods for valuing flexibility; however, few methods and strategies have been
developed to screen a system to locate the best opportunities for options or the “hot” spots in the
design.
Kalligeros (2006) and Suh (2006) are first attempts to identify where in the system to design options.
Kalligeros presents a new methodology, using the sensitivity DSM (S-DSM), for identifying the
elements within the system least sensitive to change and suggests that these components are the best
candidates for platform design. In some sense, Kalligeros identifies the “cold” spots or the spots in
the systems that are not sensitive to change. Kalligeros shows how system designers can better
manage uncertainties and realize cost savings by developing platforms that consist of these
components. He demonstrates his methodology on a large engineered system, and off-shore oil
drilling platform.
Suh (2006) presents an alternative approach for identifying where to lay options in the system that is
more aligned with locating “hot” spots. His framework examines uncertainties in demand and
functional requirements of variants of a car-door assembly from a common platform and first maps
these to elements in the functional domain, namely the system objective, and then to the design
variables in the technical domain. He then applies network-based change propagation analysis to the
system components to identify the components classified as “change multipliers”. He also examines
the system to identify where there are likely to be substantial switching costs. These elements are
identified as candidates for embedding flexibility, i.e. they are “hot”. He concludes his analysis with a
scenario in which future uncertainty is modeled as the effectiveness of an existing platform design is
compared against his conception of a “flexible" platform.
Despite many positives, one serious limitation of both Kalligeros and Suh is that they both focus
their attention to the functional and technical domains. Neither attempt to represent the
interactions in the social, process, or environmental domains as found in the ESM. For “hot/cold”
spot analysis there are several advantages of representing each domain and the corresponding
interactions between domains. For example, the ESM provides a richer picture for how changes

135-191
propagate across domains (e.g. highlight how changes in the technical domain affect the process
domain and social domains), and the identification of exogenous sources of uncertainties that might
each of the domains by constructing the systems drivers matrix. Below is a proposed approach
using the ESM that incorporates and extends both Kalligeros’ and Suh’s work.
1. Construct the ESM for a particular system
2. Identify sources of uncertainty driving change
3. Define change scenarios
4. Determine the system sensitivity for each change scenario (e.g. Kallegeros’ Sensitivity DSM.
5. Identify change modes for each scenario (e.g. Suh’s change propagation method)
6. Calculate the cost of change for each scenario (e.g. Suh’s cost analysis)
7. Identify Hot/Cold Spots for each scenario
8. Examine Hot/Cold spots across scenarios
9. Value flexibility using Real Options Analysis
A “back of the envelope” variant of this approach was used to identify “Hot/Cold” spots in the
MAV-PD. The analysis is summarized in Figure 84.

136-191
Figure 84: Hot/Cold Spot Analysis
In constructing the MAV-PD ESM, several sources of uncertainty can be identified. These
uncertainties include organizational changes, funding instability, technology innovation, and changing
customer requirements.
For the MAV-PD, several change scenarios were defined. Change scenarios describe how the MAV
might change in the future due to new technologies, new threats, or other source of change. For
example, one change scenario was that new customers would request a MAV with a longer endurance
requirement than the existing system. Another change scenario was that suppliers would soon deliver a
suite of miniaturized components (batteries) with better technical performance. A simplified version
of the “Hot/Cold” spot analysis was performed for designing a flexible MAV for changing endurance
requirements based on these two scenarios.
Using the proposed steps outlined on page 137, an ESM was created, the sources of uncertainty were
defined, and the change scenarios were proposed. Once the change scenarios were determined, a
sensitivity analysis to determine which of system variables affected the objectives of the system the
most. For design a system able to change easily to the change scenarios, it was determined that the
wing/tail configuration and batteries affected the flight endurance the most.

137-191
The data needed to perform Suh’s change propagation analysis was not collected. Nevertheless, the
cost of designing and manufacturing various wing and tail configurations was significantly more
expensive than upgrading the batteries. In addition, the battery technology was changing rapidly as
smaller, more powerful batteries are being introduced to the market. Therefore, the wing and tail
connectors and the batteries were identified as hot spots for changing user requirements. the batteries
subsystem was identified as the hot spot. An examination across scenarios highlighted that the team
could add flexibility by design the fuselage and battery interfaces such that the MAV could
accommodate more batteries and upgrade more easily.
This approach is a first attempt for using the ESM as a basis for identifying real options “in” as system.
Future work will seek to integrate Suh and Kalligeros’ methods into the ESM framework.
Future Work: Future research will apply the ESM framework for modeling other engineering systems. As
mentioned previously, Glazner (2007) is using the ESM to represent the operations of a small
manufacturing company. He is exploring how to use the information represented in the ESM to
model the system-level dynamics of the firm by integrating various systems models (including
system dynamics, agent-based modeling, and discrete-event simulation). Shah (2007) used the ESM
to organize information for a hybrid model of a Space Surveillance Network that integrates a game-
theoretic model of stakeholder interactions with a system dynamics model of the operations of a
satellite network. Wilds (2007) is extending the work MAV-PD by applying various DSM analytical
techniques and exploring improvements to the proposed “Hot/Cold” spot analysis using the
existing MAV-PD dataset.
Limitations of the ESM and QKC: There are several limitations to the proposed methodology and framework that deserve
consideration. Some limitations are discussed below:
New Network Metrics: With respect to the analyses discussed in this chapter, using social network
measures assumes that all of the nodes and relations are the same type. In an engineering system,
this is clearly not the case. As such, efforts to develop new, more meaningful measures for multi-
domain analysis are a worthy endeavor that will require more observation and theory building.

138-191
Garbage In – Garbage Out: Models are only as good as the underlying assumptions and information.
The process of constructing an ESM using the QKC approach does not mitigate all concerns about
bad information and assumptions. However, the methodology does provide transparency of
assumptions and content. This is an improvement to many complex models that are intended to be
perceived as “black-boxes” by observers not involved in the process of building the model. In
addition, the methodology does not prevent humans from responding strategically or
misrepresenting information. Again, some of these risks can be mitigated by scrutinizing the data
and the assumptions. Lastly, for large projects that require multiple researchers or analysts to input
data, many open questions exist. Will two people examining the same system construct the same
ESM? Will the researchers interpret the information the same of differently? How can various points
of view represented by multiple researchers and analysts be integrated into the same ESM? To
address these challenges, qualitative researchers have developed methods for reviewing each other’s
codes and other calibrating techniques. More work must be done to resolve these issues. By
establishing references in the ESM to raw data, the proposed methodology provides a transparency
of assumptions that represents an improvement to other modeling approaches.
This Methodology is Too Time Consuming and Costly: Another concern for the methodology relates to the
time and effort required to develop a systems-level model. In the case of the MAV-PD, the process
of gathering data and building the ESM took several months. It is important to note, however, that
this researcher had no familiarity with the system before starting the project. The process of
interviewing and observation was challenging due to the limited availability of subjects. Lastly, the
majority of the data gathering was done without the benefit of the SMaRT tool (See Appendix A).
For analysts with access to data and a computerized tool (like SMaRT) to streamline the modeling
process, the time to build a detailed ESM can be greatly reduced.
An important direction for future work is to examine strategies for abstracting the complexity of the
system. It may be the case that choosing the appropriate level of abstraction depends on the
questions being asked. For example, systems engineers using the ESM as a means for representing a
system in development may need to represent several of levels of decomposition to successfully
integrate the system. However, the financial team (for the same system) may not need information
at a granular level of detail; rather they might want accounting information at a higher level of

139-191
abstraction. In the future, work to determine abstraction strategies might provide insight into how
best to simplify the ESM construction process.
Scalability: As discussed in chapter 2, engineering systems exist at multiple levels of complexity.
There are some questions about the efficacy of the ESM for modeling a large engineering system.
Again, this depends greatly on the questions being asked. For large scale systems, modelers will
need to determine which details are important to abstract and what level of detail is required to
answer the question being asked. In most cases, there will be a trade between model fidelity and
level of abstraction. For example, systems analysts hoping to use the ESM to represent the DoD as
an engineering system may choose to aggregate details at the organizational level of abstraction
rather than at the group or individual level as the organizations supporting the DoD count in the
hundreds, while individuals are measured in the 100,000s. In the future, scholars may develop good
theories for scaling complex models based on the characteristics of the systems analyzed. For
example, engineering systems with highly modularized components may be easy to scale as
constituent components are tightly coupled with few cross component interactions. Integrated
systems with complex, multilevel interactions on the other hand may not be easily scaled. Future
work must be done to unpack the questions raised about scaling.
Visualization techniques: The ESM as a hyperspace of nodes, relations, and attributes that exist over
time is a far more complex structure that existing methods are able to visualize. On-going work in
the visualization of dimensional spaces represents a valuable area of future work. .
In Summary:
This thesis presents a new methodology (Qualitative Knowledge Construction) for creating models
of complex systems and an improved framework for representing engineering systems the
Engineering Systems Matrix. It explains how QKC extends the state of the art in research methods
used to study complex systems by providing a means for translating qualitative data into quantitative
matrices for analysis. In addition, the thesis presents the ESM as an improvement to existing
systems modeling frameworks for representing engineering systems. These contributions are used to
develop a dynamic, end-to-end representation of a real-life engineering system. Several promising
analytical methods and approaches suggest that the ESM can be used to learn about an engineering

140-191
system. Future work is required to determine the extent for which the methodology and framework
will be used as a means to learn about the structure and behavior of engineering systems.

141-191
Ackoff, R. L. (1973). "Science in the Systems Age: Beyond IE, OR, and MS." Operations Research 21(3): 661-671.
Albert, R. and A.-L. Barabási (2001). "Statistical Mechanics of Complex Networks." Rev. Mod. Phys. 74(1): 47-97.
Allen, T., D. J. Nightengale, et al. (2004). "Engineering Systems: An Enterprise Perspective." Engineering Systems Monograph.
Allison, G. T. and P. Zelikow (1999). Essence of decision : explaining the Cuban Missile Crisis. New York, Longman.
Argyris, C. and D. A. Schon (1978). Organizational Learning: A Theory of Action Perspective. Reading MA, Addison-Wesley.
Ashby, W. R. (1963). An introduction to cybernetics. New York, Science Editions. Axelrod, R. M. (1984). The evolution of cooperation. New York, Basic Books. Badham, R., C. Clegg, et al. (2000). Socio-technical Theory. New York, John Wiley. Barabási, A.-L. (2002). Linked : the new science of networks. Cambridge, Mass., Perseus Pub. Becker, H. S. (2001). The Epistemology of Qualitative Research. Contemporary Research
Methods. R. M. Emerson. Long Grove, Illinois, Waveland Press, Inc. Beer, S. (1967). Cybernetics and management. London,, English Universities P. Beer, S. (1981). The Brain of the Firm. Chichester, Wiley. Beer, S. (1984). "The Viable System Model: Its Provenance, Development, Methodology and
Pathology." Journal of the Operational Research Society 35: 7-35. Bertalanffy, L. v. (1968). General system theory; foundations, development, applications. New
York,, G. Braziller. bHall, A. D. (1962). A methodology for systems engineering. Princeton NJ, Van Nostrand. Bijker, W. E. (1995). Of Bicycles, Bakelites, and Bulbs: Toward a Theory of Sociotechnical
Change. Cambridge MA, The MIT Press. Bijker, W. E., T. P. Hughes, et al. (1987). The social construction of technological systems : new
directions in the sociology and history of technology. Cambridge, MA, MIT Press. Blumer, H. (1969). Symbiolic Interactionism: Perspective and Method. Englewood Cliffs NJ,
Prentice Hall. Borgatti, S. (2002). UCINET 6. Harvard MA, Analytic Technologies. Boulding, K. E. (1956). "General Systems Theory: The Skeleton of Science." Management
Science 2: 197-208. Browning, T. R. (2001). "Applying the design structure matrix to system decomposition and
integration problems: a review and new directions." IEEE Transations on Engineering Management 48(3).
Buede, D. (2000). The Engineering Design of Systems. New York, John Wiley & Sons, INC. Bunge, M. (1979). Ontology II: A World of Systems. Dordrecht, D. Reidel. Callon, M. (1990). Society in the Making: The Study of Technology as a Tool for Sociological
Analysis. The Social Construction of Technological Systems. W. E. Bijker, T. P. Hughes and T. J. Pinch. Cambridge MA, The MIT Press: 83-103.
Carlile, P. (2004). "Transferring, translating, and Transforming: An Integrative Framework for Managing Knowledge Across Boundaries." Orranization Science 15: 555-568.
Charmaz, K. (2001). Grounded Theory. Contemporary Field Research. R. M. Emerson. Long Grove, Illinois, Waveland Press.

142-191
Charmaz, K. (2004). Grounded Theory. The Sage Encyclopedia of Social Science Research Methods. M. S. Lewis-Beck, A. Bryman and T. F. Liao. Thousand Oaks CA, SAGE. 2: 440-442.
Checkland, P. (1999). Systems thinking, systems practice. Chichester ; New York, John Wiley. Churchman, C. W. (1971). The design of inquiring systems: basic concepts of systems and
organization. New York,, Basic Books. Clarkson, P. J., C. Simons, et al. (2001). Predicting Change Propogation in Complex Design.
ASME 2001 Seign Engineering Technical Conferences and Computers and Information in Engineering Conference, Pittsburg PA.
Cohen, W. M. and D. A. Levinthal (1990). "Absorptive Capacity: A New Perspective on Learning and Innovation." Administrative Science Quarterly 35: 128-152.
Cooper, C. A., M. L. Ewoldt, et al. (2005). A Systems Architectural Model for Man-Packable/Operable Intelligence, Surveillance, and Reconnaissance Mini/Micro Aerial Vehicles. Department of Aeronautical Engineering. Wright-Patterson Air Force Base OH, AFIT.
Danilovic, M. and T. R. Browning (2007). "Managing Complex Product Development Projects with Design Structure Matrices and Domain Mapping Matrices." International Journal of Management 25: 300-314.
de Neufville, R. (2002). Architecting/Designing Engineering Systems Using Real Options. ESD Internal Symposium, Cambridge MA, MIT Engineering Systems Division.
de Neufville, R., O. de Weck, et al. (2004). Uncertainty Management for Engineering Systems Planning and Design. MIT Engineering Systems Symposium, Cambridge MA.
Deming, W. E. (1986). Out of the crisis. Cambridge, Mass., Massachusetts Institute of Technology, Center for Advanced Engineering Study.
DoD (2003). DoD Architecture Framework: Version 1.0. D. A. F. W. Group. Dodder, R., J. McConnell, et al. (2005). The Concept for Using the "CLIOS Process":
Integrating the Study of Physical and Policy Systems Using Mexico City as an Example. MIT Engineering Systems Working Papers. Cambridge MA, MIT.
Dong, Q. (1999). Representing information flow and knowledge management in product design using the design structure matrix. Mechanical Engineering. Cambridge MA, MIT. MS.
Dong, Q. (2002). Predicting and managing system interactions at early phase of the product development process. Mechanical Engineering. Cambridge MA, MIT. PhD.
Easton, D. (1965). A System Analysis of Political Life. New York NY, John Wiley. Eckert, C., P. J. Clarkson, et al. (2004). "Change and customisation in complex engineering
domains." Research in Engineering Design 15: 1-21. Emery, F. (1993). Characteristics of Socio-Technical Systems. The Social Engagement of Social
Science, Volume II: The Socio-Technical Perspective. E. L. Trist and H. Murray. Philadelphia, University of Pennsylvania Press.
Eppinger, S. D. (1997). A Planning Method for Integration of Large-Scale Engineering Systems. International Conference on Engineering Design, Tampere,Finland.
Eppinger, S. D. (2001). "Innovation at the speed of information." Harvard Business Review 79(1): 149-+.
Eppinger, S. D. (2003). Patterns of Product Development Interactions. ESD Internal Symposium, Cambridge MA, MIT Engineering Systems Division.
Eppinger, S. D., D. E. Whitney, et al. (1994). "A Model-Based Method for Organizing Tasks in Product Development." Research in Engineering Design 6: 1-13.

143-191
Epstein, J. M., R. Axtell, et al. (1996). Growing artificial societies : social science from the bottom up. Washington, D.C., Brookings Institution Press.
Forrester, J. (1961). Industrial Dynamics. Portland OR, Productivity Press. Fowler, T. C. (1990). Value Analysis in Design. New York NY, Van Nostrand. Geertz, C. (1973). The Interpretation of Cultures. New York, Basic Books. Gergen, K. J. (1999). An invitation to social constructionism. London, SAGE. Getner, D. (1983). "Structure-Mapping: A Theoretical Framework for Analogy." Cognitive
Science 12: 306-355. Glaser, B. and A. Strauss (1967). The discovery of grounded theory. Chicago, Aldine. Graedel, T. E. and B. R. Allenby (2003). Industrial ecology. Upper Saddle River NJ, Prentice
Hall. Henderson, R. (1994). "Managing Innovation in the Information Age." Harvard Business
Review(January-February): 100-105. Hillier, F. S. and G. J. Lieberman (2005). Introduction to operations research. Dubuque, Iowa,
McGraw-Hill. Hughes, T. P. (1983). Networks of power : electrification in Western society, 1880-1930.
Baltimore, Johns Hopkins University Press. Hughes, T. P. (1987). The Evolution of Large Technological Systems. The Social Construction
of Technological Systems. W. E. Bijker, T. P. Hughes and T. J. Pinch. Cambridge MA, The MIT Press.
Hughes, T. P. (1990). American genesis : a century of invention and technological enthusiasm, 1870-1970. New York NY, Penguin Books.
Hughes, T. P. (1998). Rescuing Prometheus. New York, Pantheon Books. Jordan, N. (1968). Themes in Speculative Psycology. London, Tavistock. Juran, J. M. and A. B. Godfrey (1999). Juran's quality handbook. New York, McGraw Hill. Katz, D. and R. L. Kahn (1966). The social psychology of organizations. New York,, Wiley. Kalligeros, Konstantinos (2006). Platforms and Real Options in Large-Scale Engineering
Systems. Unpublished PhD Dissertation. MIT Cambridge MA. Kitano (2002). Systems Biology: A Brief Overview. Science: 1662-1664. Kometer, M. W. (2005). Command in Air War: Centralized vs. Decentralized Control of Combat
Airpower. Engineering Systems Division. Cambridge MA, MIT. PhD. Koo, B. (2005). A Meta-Language for Systems Architecting. Engineering Systems Division.
Cambridge MA, MIT. PhD. Kuffner, T. A. and D. G. Ullman (1991). The Information Requests of Mechanical Design
Engineers. Proceedings of 2nd American Society of Mechanical Engineers Conference on Design Automation (Design Theory and Methodology Track), Chicago IL, ASME.
Laszlo, E. (1972). The systems view of the world; the natural philosophy of the new developments in the sciences. New York,, G. Braziller.
Lesk, A. M. (2005). Introduction to bioinformatics. Oxford ; New York, Oxford University Press.
M'Pherson, P. K. (1974). "A Perspective on Systems Science and Systems Philosophy." Futures 6: 219-239.
Magee, C. L. and O. L. de Weck (2002). An Attempt at Complex System Classification. ESD Internal Symposium, Cambridge, MA, MIT.
Maier, M. and E. Rechtin (2000). The art of systems architecting. Boca Raton, CRC Press.

144-191
Malmstrom, J. and J. Malmquist (1998). Trade-Off Analysis of Product Decompositions. ASME Conference on Design Theory and Methodology, Minneapolis MN.
Marchal, J. H. (1975). "On the Concept of a System." Philosophy of Science 42: 448-468. Mayntz, R., T. P. Hughes, et al. (1988). The Development of large technical systems. Boulder,
Colo., Westview Press. Miller, J. G. (1978). Living Systems. New York, McGraw-Hill. Moses, J. (2004). Foundational Issues in Engineering Systems: A Framing Paper. Engineering
Systems Monograph. Cambridge MA: http://esd.mit.edu/resources/symposium2004.html. Moses, J. (2004). Foundational Issues in Engineering Systems: A Framing Paper. Engineering
Systems Monograph. Cambridge MA: 16. Moses, J. and T. Allen (2002). ESD Symposium Summary. ESD Internal Symposium,
Cambridge MA. Mostashari, A. (2005). Stakeholder-assisted modeling and policy design for engineering
systems: 462. Murman, E. and T. Allen (2002). Engineering Systems: An Aircraft Perspective. ESD Internal
Symposium, Cambridge MA. Newman, M. E. J. (2003). "The Structure and Function of Complex Networks." SIAM Review
42(2): 167-256. Nonaka, I. and H. Takeuchi (1995). The Knowledge-Creating COmpany: How Japanese
Companies Creat the Dynamics of Innovation. New York NY, Oxford University Press. Nonaka, I., R. Toyama, et al. (2000). "SECI, Ba, and Leadership: a Unified Model of Dynamic
Knowledge Creation." Long Range Planning 33(1): 5-34. Ono, T. (1988). Toyota production system : beyond large-scale production. Cambridge, Mass.,
Productivity Press. Otto, K. N. and K. L. Wood (2001). Product design : techniques in reverse engineering and new
product development. Upper Saddle River, NJ, Prentice Hall. Park, H. and M. R. Cutowsky (1999). "Framework for Modeling Dependencies in Collaborative
Engineering Processes." Research in Engineering Design 6(1): 1-12. Parsons, T. (1964). "Evolutionary Universals in Society." American Sociological Review 29:
339-357. Patil, S. (2000). Mapping product development process to IT solutions through use models.
Cambridge, MIT. MS. Pielou, E. C. (1969). An introduction to mathematical ecology. New York,, Wiley-Interscience. Pimmler, T. U. and S. D. Eppinger (1994). Integration analysis of product decompositions.
Cambridge, Mass., Massachusetts Institute of Technology. MS. Pinch, T. J. and W. E. Bijker (1987). The Social Construction of Facts and Artifacts: Or How the
Sociology og Science and the Sociology of Technology Might Benefit Each Other. The Social Construction of Technological Systems. W. E. Bijker, T. P. Hughes and T. J. Pinch. Cambridge MA, The MIT Press.
Popper, K. (1961). The Poverty of Historicism. London, Routledge. Popper, K. (1972). Objective Knowledge. Oxford, Oxford University Press. Quade, E. S. and W. I. Boucher (1968). Systems analysis and policy planning; applications in
defense. New York,, American Elsevier. Rasmussen, J., A. M. Pejtersen, et al. (1994). Cognititve Systems Engineering. New York NY,
John Wiley & Sons.

145-191
Rescher, N. (1979). Congnitive Systematization: A Systems-Theoretic Approach to a Coherentist Theory of Knowledge. Totowa NJ, Rowan and Littlefield.
Richards, M. G., N. B. Shah, et al. (2006). Managing Complexity with the Department of Defense Architecture Framework: Development of a Dynamic System Architecture Model. CSER 2006, Los Angeles.
Richards, M. G., N. B. Shah, et al. (2007). Architecture Frameworks in System Design: Motivation, Theory, and Implementation. 2007 Annual Symposium for International Council on System Engineering (INCOSE), San Diego CA.
Ritchie, S. W. (1999). Rescuing Endangered Knowledge: A Systems Approach. Cambridge MA, MIT MS.
Sage, A. P. (1992). Systems engineering. New York, J. Wiley. Sage, A. P. and J. E. Armstrong (2000). Introduction to systems engineering. New York, Wiley. Sandelowski, M. (2004). Qualitative Research. The SAGE Encyclopedia of Social Science
Research Methods. M. S. Lewis-Beck. Thousand Oaks, SAGE Publications. 3. Schekkerman, J. (2004). How to survive in the jungle of Enterprise Architectural Frameworks.
Victoria, British Columbia, Canada, Trafford. Schelling, T. C. (1963). The strategy of conflict. New York, Oxford University Press. Senge, P. M. (2006). The fifth discipline : the art and practice of the learning organization. New
York, Doubleday/Currency. Shannon, C. E. (1948). "A Mathematical Theory of Communication." The Bell System
Technical Journal 27(3): 379-423. Simon, H. A. (1962). "The Architecture of Complexity." Proceedings of the American
Philosophical Society 106(6): 467-482. Simon, H. A. (1982). Models of bounded rationality. Cambridge MA, MIT Press. Smith, R. P. and S. D. Eppinger (1997). "Identifying controlling features of engineering design
iteration." Management Science 43(3): 276-293. Sosa, M. E., S. D. Eppinger, et al. (2002). "Factors that influence technical communication in
distributed product development: An empirical study in the telecommunications industry." Ieee Transactions on Engineering Management 49(1): 45-58.
Sosa, M. E., S. D. Eppinger, et al. (2000). Understanding the effects of product architecture on technical communication in product develoment organizations. Cambridge MA, Massachusetts Institute of Technology Sloan School of Management.
Sterman, J. D. (2000). Business Dynamics--Systems Thinking and Modeling for a Complex World. Boston, Irwin McGraw-Hill.
Steward, D. V. (1981). "The Design Structure System: A Method for Managing the Design of Complex Systems." IEEE Transactions on Engineering Management 28: 71-74.
Suh, Eun Suk (2005) Flexible Product Platforms, Unpublished PhD Dissertation, MIT Cambridge MA,
Suh, N. P. (1998). "Axiomatic Design Theory for Systems." Research in Engineering Design 10: 189-209.
Suh, N. P. (2001). Axiomatic Design--Advances and Applications. New York, Oxford University Press.
Sussman (2000). Toward Engineering Systems as a Discipline. Cambridge, Massachusetts Institute of Technology: 6.

146-191
Sussman, J. (2002). Collected Views on Complexity in Systems. ESD Symposium on Engineering Systems Research and Practice, Cambridge MA, http://esd.mit.edu/resources/symposium2004.html.
Sussman, J. (2002). Collected Views on Complexity in Systems. ESD Symposium on Engineering Systems Research and Practice, Cambridge MA.
Trist, E. L. (1953). Some Observations on the MAchine Face as a Socio-Technical System. Tavistock Instititue Document 341. London.
Trist, E. L. and K. W. Bamforth (1951). "Some Social and Psycological Consequences of the Longwall Method of Coal Getting." Human Relations 4: 3-38.
Troncale, L. R. (1985). "The Future of General Systems Research: Obstacles, Potentials, and Case Studies." Systems Research 2(1): 43-84.
Ullman, D. G. (1995). "Engineering Decision Problems and Support Systems." Artificial Intelligence for Engineering Design, Analysis, and Manufacturing 9: 427-438.
Ullman, D. G., Stauffer, et al. (1983). "Toward Expert CAD." Computers in Mechanical Engineering Nov-Dec: 56-70.
Ulrich, K. T. and S. D. Eppinger (2000). Product Design and Development. Boston, Irwin McGraw-Hill.
Vickers, G. (1983). The art of judgement : a study of policy making. London, Harper & Row. Voland, G. (2004). Engineering by Design. Upper Saddle River NJ, Prentice Hall. Von Neumann, J. and O. Morgenstern (1953). Theory of games and economic behavior.
Princeton,, Princeton University Press. Warfield, J. N. (1990). A science of generic design : managing complexity through systems
design. Salinas, Calif., Intersystems Publications. Warfield, J. N. and J. D. Hill (1972). "Unified Program Planning." IEEE Transactions on
Systems, Man, and Cybernetics--Part A SMC-2(5): 14.1-14-14. Wasserman, S. and K. Faust (1994). Social network analysis : methods and applications. New
York NY, Cambridge University Press. Watts, D. J. (2003). Six degrees : the science of a connected age. New York, W.W. Norton. Weiner, N. (1948). "Cybernetics." Scientific American: 14-19. Wells, S. (2001). EPlane Speadsheet. Colorado Springs CO, Department of Aeronautics, United
States Air Force Academy. Whitney, D. E., O. de Weck, et al. (2004). The Influence of Architecture in Engineering
Systems. MIT Engineering Systems Symposium, Cambridge MA. Zeigler, B. P. (1976). Theory of modeling and simulation. New York, Wiley.

147-191

148-191
Appendix A: System Modeling and Representation Tool (SMaRT)
The System Modeling and Representation Tool (SMaRT) is a software application for storing and
analyzing knowledge about complex systems. It is a hierarchical entity-relation-attribute model that
is useful for representing large data sets and is able to abstract details so that human analysts can
better understand a system. SMaRT provides a time-series extension to the system model that
abstracts temporal details. The implementation of the model includes an execution engine that can
simulate the model at a given time-slice or as a function of time.
The software application speeds up data acquisition and simplifies the visualization of Engineering
Systems knowledge. The application is based on the concept of the Design Structure Matrix (DSM)
and Qualitative Knowledge Construction (QKC) as presented in Chapters 3 and 5 respectively. The
goal of SMaRT is to provide a collaborative model-building environment with support for
concurrent data access, a persistent data storage system, and an intuitive graphical user interface.
Motivation
The Design Structure Matrix (DSM) is a methodology used to model complex systems in a compact
form that represents the dependencies in a system. System components, or entities, are represented
on the diagonal of the matrix. The dependencies between entities, or relations, are indicated by off-
diagonal entries.
From a computer science perspective, a DSM is the adjacency matrix of a directed graph with
colored edges. The nodes and the edges are called the entities of the system. Entities are associated
with a set of attributes that provide them with identity. Attributes store name-value pairs as a
function of time.
Model and Software Requirements
The primary goal of SMaRT is to simplify the acquisition and entry of the information for creating
and managing DSMs. At a high level, the application is a framework that provides rapid data entry

149-191
and simplified dependency visualization. Tacitly, a DSM represents the decomposition of a system
and its internal dependencies. To verify/evaluate the decomposition, analysts must be able to review
the assumptions underpinning the system representation. To answer such questions, as “Why do we
think that Entity A depends on Entities B, C and D?” SMaRT allows analysts to easily review
assumptions by associating an entity or relation with its source documents or, preferably, the
pertinent snippets of those documents.
Software Implementation
Using the knowledge model developed in the previous chapter, we are ready to describe SMaRT, the
software implementation for the knowledge framework. SMaRT’s main purpose is to serve as a
knowledge repository. Additionally, SMaRT facilitates the management, sharing, and visualization of
knowledge. To this end, the software toolkit requires:
• The Table View is an interactive window that allows the users to see all of the entities
simultaneously. The user has the option to view nodes, relations, or all entities at once. Each
class of node exists in designated columns.
• The ESM (Matrix) View is an interactive window of the ESM with nodes along the diagonal and
relations in the off diagonal cells
• Qualitative Coder: Allows user to create ESM inputs directly from text.
• Attribute Pane: Displays the attributes for a selected node or relation
• Attribute Window: Allows user to enter time-series values for a node or relation attribute.

150-191
Figure 85: Table View and Relation Pane

151-191
. Figure 86: New Database View
Figure 87: ESM View

152-191
Figure 88: Qualitative Coder
Figure 89: Table View

153-191
Figure 90: Attribute Pane and Attribute Window
For more information about SMaRT please contact [email protected].

154-191
Appendix B – Analyzing the MAV-PD
The goal of this appendix is to demonstrate how the QKC methodology and framework provided the
basis for several analytical insights about MAV-PD. Qualitatively the methodology leads to a number
of observations about the MAV-PD that might serve as a basis for developing researchable questions
for future research. Quantitatively, the ESM provides a useful framework to apply various well-
established analysis methods that include classic DSM, network models, as well as more sophisticated
methods. Embedded within the account are sample quantitative analyses using information from the
ESM. Section 2 explores other analytical tools that can be applied using information found within the
ESM for additional analysis.
THE MAV STORY
December 2001: The Beginning
On a cold, arid early-December day, on a hilltop north of Kandahar overlooking the Arghendab
River, a team of US special forces and Northern Alliance fighters were protecting future Afghani
Prime Minister Hamid Karzai while combating the lingering elements of a defeated Taliban regime.
There was a sweet air of satisfaction in the air for US and Afghan forces that had crushed the now
gasping Taliban regime in less than 3 months after the attacks of 9/11. For US Special Forces, the
swift victory sealed their fate in history as winners of the first war of the century with ingenuity,
bravery, and, most importantly, a minimal loss of life. For the Pentagon, this victory was to be the
culmination of the many decades of transformative action towards moving the services to a cohesive
“Joint” force. US Air Force and Navy airpower, combined with near seamless teamwork of US
Special Forces demonstrated the efficacy of joint operations.
This seamless teamwork was best seen in the few days prior, as US- and Karzai-led Northern
Alliance forces orchestrated a brilliant defense of the nearby town Sayyd Alma Kalay. On
November 30, the coalition forces had advanced and seized the town. On the night of December 3,
the Taliban forces launched a massive counterattack in an attempt to reoccupy the town. Despite
being outnumbered two-to-one and in grave danger of being overrun the coalition forces gallantly
defended the town. The lone US Air Force Special Tactics (ST) operator, named STYA, embedded
with the joint US/Northern Alliance team, had been trained for this type of battle. He was able to

155-191
single-handedly orchestrated several danger close air-strikes, crushing the Taliban attack and
ultimately forcing the enemy to retreat to the southern side of the Arghendab river.
On December 4, STYA, accompanied by the Joint US/Northern Alliance forces, attacked the
hilltop, strategically overlooking the only bridge in the sector for crossing the river. STYA advanced
toward the hilltop to locate the three key targets on the hillside, while exposed to intense machine-
gun fire and rocket-propelled grenades. Under heavy fire, he plotted the GPS coordinates of the
enemy positions and called in air strikes to neutralize the enemy threat. After 8 hours of ceaseless
fighting, Karzai and the coalition forces safely occupied the high ground. For his bravery, STYA
would receive a US Air Force Silver Star.
It was now December 5, and reinforcements were beginning to arrive as the team of Navy SEALS,
Army Green Berets, Marine Force Reconnaissance, and Air Force Special Tactics operators gathered
with Northern Alliance fighters atop the hill. Final preparations to defeat the Taliban fighters were
underway as the team was determining the positions of remaining Taliban forces below, south of the
river. Weary from 5 days of combat, STYA transferred air control to a TAC operator, who had
arrived in Afghanistan only hours before. Despite differences in training and equipment, STYA
handed over responsibilities to the TAC. The TAC began targeting the Taliban positions for air
strike. The Navy F-18 Super Hornet fighter aircraft providing the air support were relieved by Air
Force B-52 Bombers, ready to drop GPS-enabled bombs on the remaining Taliban positions.
The TAC quickly identified the Taliban positions using the GPS targeting device. Ready to provide
the position information to the B-52s, the TAC noticed that the batteries for his GPS device were
running low. He quickly replaced the batteries and proceeded to send the GPS information
displayed on the device to the B-52, without knowing that the GPS device had defaulted to his own
position when the batteries were replaced. Within seconds, the B-52 dropped the precision bomb
that would instantly kill 3 US Soldiers and 5 Afghan soldiers and wound 40 others. Among the
casualties was STYA, who permanently lost partial use of his right arm, no longer able to fight or
salute again, and Mr. Karzai, who narrowly escaped with minor injuries.
This event reverberated at all levels. The Bush administration had avoided a strategic disaster, as
Karzai had the support of each of the anti-Taliban factions, which had unanimously selected him to

156-191
serve as the interim prime minister while meeting in Bonn, Germany that same day and would ratify
a cease-fire with Taliban leaders later that day. For the Pentagon, the US death toll tripled, as there
had only been 1 US combat fatality, a CIA agent, Johnny Michael Spann, who was killed 10 days
prior in a bloody prison uprising in Northern Afghanistan on November 25, 2001. Military
leadership initiated an investigation to better understand the events that contributed to the incident.
The first investigation was conducted by the Army, which lost three Green Berets in the accident. A
follow-on investigation was conducted by the US Air Force.
The investigations found that problems began when the Navy F-18s were replaced by the Air Force
B-52s. Both weapon systems require different targeting formats. The TAC, which had arrived in the
theatre only hours before, was unfamiliar with the targeting equipment and lacked experience
directing close air support missions for high-altitude bombers dropping GPS-guided munitions.
Among the findings were that the TAC failed to correct the GPS reset when calculating coordinates
and that he did not confirm his calculations with his assistant. The investigation uncovered a variety
of other areas of concern for the TACs and STs as well. Technology was poorly integrated. In some
instances, ground operators could not communicate directly with air assets, and individual ground
operators were overloaded by backpacks filled with heavy equipment.
January 2003 – August 2003:
These findings were not a surprise to the men in the field, least of all STYA, who had spent the past
several months recovering from his injuries and undergoing therapy at Pope Air Force Base. While
in recovery, STYA’s story of gallantry and sacrifice had captured the attention of senior leaders
throughout the Pentagon. Frustrated by the disaster at Sayyd Alma Kalay, STYA decided to take
action to prevent future mishaps from occurring. In January 2003, the Secretary of the Air Force
(SECAF) presented STYA with a Purple Heart for the injuries he received on that ill-fated day. In
their meeting, SECAF asked STYA if there was anything in his power as SECAF to help the other
Air Force special force teams. STYA explained that the future deaths were preventable if actions
were taken to integrate existing technologies. Further, he explained that the men in Afghanistan
lacked some of the most basic supplies, even supplies that could be found in the Radio Shack
around the corner. The SECAF was so moved by the exchange that he and STYA left the

157-191
engagement together, and the SECAF personally purchased some of the items requested by STYA
at the local Radio Shack.
The SECAF challenged STYA to lead a task force to look into these technical challenges and
returned to DC on a mission. Many in DoD leadership were growning weary of a military-industrial
complex that seemed unable to develop systems on time and on budget. With billion dollar cost
overruns, multi-year schedule delays, and fifteen year development cycles, the post-Cold War
military industrial base and the DoD acquisition process seemed inept. The SECAF drafted a
memorandum for STYA to lead a novel acquisition approach to rapidly acquire and deploy
technologies specifically designed to help the Air Force Special Operations Command (AFSOC)
units.
The SECAF, with prior experience in the military and defense industry, was well known as a
champion for efforts to exceed the acquisitions status quo. The country was at war, and his airman
could not afford to wait on a military-industrial base still moving at a Cold War pace. The new
enemy was industrious, agile, and adaptive, and the acquisitions community needed to rise up to
meet the challenge with better acquisitions processes, bold leadership, and unprecedented
technologies.
In February 2003, the SECAF met with senior air force leaders in AFSOC and the Air Force
Research Lab (AFRL). He challenged the Air Force Research Lab to pool resources, both
intellectually and financially, to support the development effort. He drafted a memo that anointed
STYA the procurement authority and gave him the license to cut through the traditional acquisition
bureaucracy. With the memo in hand, STYA was empowered to move quickly and to work with the
lab to develop equipment to help the men in the field.
STYA and his small team were given full responsibility and authority by the AFSOC command to
lead the development program, which was named the Battlefield Air Operations (BAO) Toolkit to
address ground operator technology deficiencies. The BAO project quickly became a high-profile,
experimental development program. STYA had two main objectives. First, it was to improve the
integration of new technologies and support precision weapons across aircraft platforms from the

158-191
different services. Second, it was to reduce the equipment weight carried by the operators without
losing combat capability.
These objectives were based on the findings from Sayyd Alma Kalay’s report. The report indicated
two significant problems facing the operators. First, integration of technology across weapon
systems platforms and across the services was poor. Second, ground operators, like STYA, were
weighed down with ~160-lb. sacks of equipment during operations. The weight problem was well
known within the community. The men, otherwise known for their toughness and reluctance to
complain, were known to cringe when engineers would bring new gadgets to the field. They feared
that someone would demand yet another technology added to the “bag”. Nevertheless, as
technology kept being added, the men continued to dutifully prosecute mission after mission
overcoming fatigue and frequent injuries from low-altitude jumps and traversing harsh terrain.
The source of the excessive weight was also attributed to a poor integration of technologies within
the sack. The operators carried various technologies developed on different timescales, by different
contractors, and in some cases, for different purposes, yet each found its way into the bag. In some
ways, the goal was to develop a suite of systems that were akin to the weapons of corporate warfare,
the Blackberry and Treo (other multipurpose PDAs) that have proven to be a godsend for
professional who have spent years fiddling with multiple electronic accessories like cell phones,
pagers, laptops, and text messengers. The ground operators needed similar integrating technologies
to reduce weight without losing combat effectiveness.
Figure 91: USAF Operators Current and Future

159-191
Within AFRL, the SECAF’s pointed direction rattled throughout the command. AFRL was tasked
to find $25M of internal funding to support STYA’s AFSOC team. AFRL leadership ordered each
sub-unit in the lab to “tie” into the BAO program. The directive mandated that AFRL leadership to
make challenging budgetary decisions to release the necessary funds for BAO Toolkit project.
Several ongoing projects were affected as AFRL took action to make resources available.
Within AFRL, some organizations seized the BAO opportunity and began competing for the
funding by proposing projects to STYA and his team. Within weeks, the BAO team initiated
projects ranging from lighter batteries, to lighter communications equipment, a lightweight laptop
among others. Each program was chosen based on interactions between the operators, who
understood how each technology would be applied, and the engineers who understood what
technologies were available and what was technically feasible.
One of the teams in AFRL’s Munitions Directorate was developing small UAV (Uninhabited Air
Vehicle) technology for a variety of missions. The team had developed an innovative micro air
vehicle system to assess bomb damage. This was done by placing miniature air planes, with six inch
wingspans inside a bomb. The planes would be ejected before the bomb hit the target and would
loiter around the target for a short period to assess the bomb damage. The team’s leader was a bright
and industrious engineering officer, named PMAJ.
PMAJ had led the small UAV design project for 2 years prior. PMAJ was a career engineering officer
who had gained the respect of peers both technically and professionally. PMAJ seemed to have the
rare combination of superb technical skills, as he had recently completed a PhD in aeronautical
engineering, and excellent leadership skills that had been cultivated through his diverse experiences
in various assignments.
PMAJ met with ENFC, a leader for another small UAV team, to discuss possible opportunities to
support the BAO project. Upon their review of AFSOC’s support equipment, they discovered that
AFSOC operators were using a UAV system. The UAV was large and heavy, weighing a few lbs
with a long wing span of several feet. The system required multiple operators to carry, launch, and
operate.

160-191
In mid-February 2003, PMAJ and ENFC met with STYA to see the existing system. Despite its
large size, the system was quite capable. It was able to fly for long periods, it had exceptional range,
and it came with a variety of payloads for different types of missions. The features were not
perfectly tailored to the operators’ mission. However, the UAV effectively provided them with the
ability to observe targets from safe distances and was valued by the airmen. The UAV was so
valuable that STYA and his team were not considering a replacement.
After seeing the existing system, PMAJ and ENFC believed there was an opportunity to deliver
better solution. They knew that their micro air vehicle could not meet STYA’s needs. That
afternoon, they sat and brainstormed how they might modify their existing system to meet STYA’s
needs. They had immediately determined that they could give the operators a smaller UAV, but
there would be a significant tradeoff in capability. They knew that they would never be able to
develop a system that could beat the existing UAV in the air. However, they did believe that if they
could beat the existing UAV logistically, they might be successful.
PMAJ had listened carefully to STYA as he described the existing UAV, operational needs, and his
needs. Based on the conversation, intuition, and technical expertise, PMAJ created a list of
requirements for a new UAV to improve STYA’s capability. These requirements were simple. First,
the new UAV must be “man-packable”. Thus, it must be able to be carried by a single operator and
must fit in his bag. Second, the system must be “man-operable”, meaning it must be able to be
launched, operated, and retrieved by a single person. Third, the system must have a certain range.
PMAJ intuitively knew, based on his observation and impressions, that the system must be able to
fly that range to capture STYA’s attention. Fourth, the system must be able to fly for a certain
number of minutes. Lastly, it would need to be semi-autonomous. PMAJ and ENFC established
these basic requirements on their own; they were not defined by the user. They believed that unless
they were able to deliver a system with these qualities, the AFSOC community would not be
interested.
After a few days, PMAJ and ENFC had convinced themselves that they could design and develop a
new UAV capability for the STYA and the AFSOC team. They presented the idea to WCOL, their
senior supervisor, who reported to the AFRL commander. WCOL had over 20 years of experience

161-191
serving in the US Air Force and provided the administrative support needed to get the project off
the ground.
WCOL thought the idea to take on a mini-UAV project was terrific. Even though the system had
not been fully defined, he supported the effort. He authorized PMAJ and ENFC to establish a team
and to begin formalizing a plan; however, he did not authorize funding. He provided top-cover and
a long leash to make something happen. For highly motivated and industrious officers like PMAJ,
top-cover is exactly what he needed.
With support from leadership, PMAJ contacted the AFSOC office. In a few short weeks, the
science and engineer community had moved quickly and STYA became the point man for a
portfolio of projects. To cope with the managerial complexity, other former ST operators and
support staff were included in the development efforts. For the UAV development, no ST operator
was better than STCC, who, after many years of operations, was now responsible for representing
AFSOC interests for new technologies. In recent years, he had evaluated the UAV technologies used
by the AFSOC team. His job was to test and develop technologies to meet the needs of the
operators in the field.
At the meeting, STCC asked many questions. PMAJ stated that the system would be man-packable,
single man-operable, and semi-autonomous, and it would be able to achieve the minimum
performance requirements for range and flight endurance. In retrospect, PMAJ admitted that
although his assessments were based on technical judgment and intuition, he was not absolutely
certain the goals were going to be achieved. The meeting was a success, STCC was impressed, but he
still wanted to see something.
With the green light from management and AFSOC, PMAJ had the blessing and the curse to deliver
a product. He hand picked a team to begin work. ENFC became the assistant project manager.
ENSD became the chief engineer. In addition, he found several freshly commissioned USAF
engineering officers (lieutenants) and various technicians. Lastly, he recruited a new intern, PMJW, a
newly minted aerospace engineering undergraduate.

162-191
PMAJ and ENFC scrambled to find sources of money to support the project, leveraging resources
and equipment from other projects.
For their existing projects, PMAJ and ENFC had established research relations with a number of
university research programs developing small scale UAVs. The research team supporting the battle
damage assessment UAV included a university professor, who had been developing UAVs for
intercollegiate competitions on which where undergraduate students design small controlled aircraft
optimized for size and performance.
Figure 92: 6in MAV
PMAJ called the professor, described the project, and explained that there was no funding for the
project. Despite no funding, the professor invited PMAJ to his lab to see a variety of UAVs that he
and his graduate students had already developed. The professor’s team had developed UAVs with a
variety of wingspans. Each system had a rigid wing with a control surface in the back of the plane.
The small systems flew, but they did not display performance characteristics that could satisfy
AFSOCs needs. PMAJ took photographs of the UAVs to present to STYA and STCC.
STYA and STCC were impressed with the photographs and were particularly impressed with the
small models. In retrospect, their interest in the smaller systems was not operationally driven. Rather
the “cool factor” of a pocket sized UAV was the driving force. After a few discussions with PMAJ
and the professor, the STs decided that the mid-sized models would be a good start.
Aerodynamically, this size of the UAV was large enough to integrate different payloads yet small
enough for an operator to carry. PMAJ asked the professor if he would be willing to build a
prototype for a mid-sized UAV based on conversations with STYA and STCC. Despite the lack of
funding, the professor moved forward and tasked his students to build the prototype.

163-191
While the professor and his team started building and experimenting with different aircraft designs,
PMAJ and the AFRL team started researching payloads. PMAJ had promised autonomy, endurance,
and range. After a few phone conversations around the industry and contacting other ongoing
projects in the lab, the team found many promising technologies. One might think the military was
the driver of technology for UAVs. In reality, however, this is not the case as commercial industry
drove the technology in the field. For UAVs, the multi-million dollar radio-controlled aircraft
toy/hobby market was pushing technological advancements far beyond military requirements.
Weekend enthusiasts were demanding technologies like autopilots, advanced radios, highly capable
electric motors, and pinhole cameras. Other industries, like the cellular phones and PDAs, were
producing unprecedented battery technologies. The AFRL team soon realized that the development
challenge would be to integrate existing technologies rather than to reinvent the wheel.
The AFRL team was well acquainted with most of these technologies, as there was significant
overlap between the AFSOC project and their previous UAV projects. One of the most important
technologies was an autopilot. As previously discussed, thanks to a vibrant R/C market, several
autopilots were available off the shelf. The team began testing different technologies and found that
existing autopilots were either too large or technologically challenged. After a few weeks, the team
made contact with another project to develop miniaturized autopilots. The team made contact with
that research team and took action to integrate the autopilot into their UAV prototype.
Figure 93: Miniaturized Autopilot
The AFRL team designed the technical architecture of the internal components (autopilot, radio,
cameras, and batteries) for the system, while the professor and his team developed the airframe.
Engineering a system that met the defined requirements was not without challenges. Despite the
fact that the current UAV flown by AFSOC had a much larger wingspan, measured in feet,

164-191
compared to the MAV prototype with a wingspan measured in inches. There was some concern
among the team as how to fit the system into STYA’s backpack. One afternoon, PMAJ and ENFC
were sitting in the office as PMAJ was holding one of the very small UAVs. While fiddling with
aircraft PMAJ broke the rigid wing. As he held the two pieces of the system in his hand, thousands
of dollars of research seemingly down the drain in an instant, PMAJ had a great idea. “What if the
wings folded?” He immediately called the professor. The professor was not happy about the
destruction of the system. After a few words of encouragement and challenge to fold the wings, the
professor’s team began work on a folding solution.
Two weeks later, the professor called PMAJ. His team had figured out a solution to the problem.
The professor and his team had developed a rolled-up wing configuration. PMAJ was thrilled. He
had not thought about rolling the wing.
Figure 94: Rolling the MAV wing
Things were moving quickly, far faster than “normal” government projects, but not fast enough for
PMAJ. In March 2003, PMAJ negotiated with the professor to send his intern PMWJ and three
lieutenants to learn how to build the composite airframes from scratch. In less than three weeks,
PMWJ returned and demonstrated to PMAJ and the team how to build the UAV. Soon after, the
AFRL team was able to rapidly design and fabricate new MAV platforms in hours. On demand,
PMAJ and the team could call STYA and STCC, who worked a few miles away, to meet and fly the
new plane.
The organic capability to design and fabricate the aircraft gave the AFRL team unprecedented
flexibility. First, they were no longer dependent on the professor and his team for airframes. What
used to take weeks now only took hours, as AFRL engineers were able to inexpensively and

165-191
efficiently build diverse prototypes. In addition, the team could experiment with the user. The team
would meet frequently each week with the users. The AFRL team would take 5 planes to the field
with the user to evaluate each system. Some mornings, the users would make a comment about how
they wished the system were different and the team would turn around an improved system in the
same afternoon. This reduced development cycle-time, as designers had direct feedback from the
users, unlike many other environments, which remove the engineers from the customer. The
teamwork and camaraderie that existed between STYA’s team and PMAJ’s team was superb. The
responsiveness of the AFRL team and their ability to interpret user needs and to implement
effective solutions was greatly appreciated. Mutual trust and commitment between AFRL and
AFSOC was at an all time high.
Insights from the ESM #1: Using the DSM Sequencing Algorithm for Managing Design Tasks
The impact of cultivating an organic capability for building MAV airframes can be measured using DSM sequencing.
DSM sequencing is an analytical method designed to reorder system components with time-based dependencies. In an
engineering system, the system components with time-based dependencies are generally found in the process domain.
As such, managers and operations staffs desiring to improve process or streamline work tasks can apply the sequencing
algorithm to examine strategies for process design.
Danilovic and Browning (2007) provide a sample analysis for DSM sequencing for a product development system. The
system components represent product development activities and tasks. The off-diagonal elements represent a
precedence relationship between tasks, meaning information or material is required from the column task to the row
task. Thus, the DSM is read that element 1 “offer” precedes element 2 “contract review”. This relationship is
represented by the “1” in lower triangle of the matrix. The sequencing algorithm reorders the design tasks by lower
triangularizing the matrix. The intuition is that lower triangularizing the matrix and reordering the system components
such that the sub-diagonal ticks are close to the diagonal maximizes the feed-forward flow of information and materials,
and simultaneously minimizes possible inefficiencies caused by feedback and rework.
Figures 95 and 96 from Danilovic and Browning (2007) illustrate the before and after of a sequenced product
development task structure. Figure 95 is the unsequenced task structure where Figure 96 is the sequenced task structure.
The alternating light and dark bands show independent activities that can be accomplished concurrently. The elements
below the diagonal represent precedence relations, where the elements about the diagonal represent where assumptions
about downstream activities must be made.
Danilovic and Browning explain that “the assumptions are often the drivers of rework in projects, so it is important to
expose them clearly and early and account for their potential impacts (risks) during project planning. Once the
assumptions and couplings that drive iteration and rework in the PD project are identified and ‘unwound’, then
traditional, linear project management tools and techniques like Gantt charts, project evaluation and review technique

166-191
(PERT), critical path method (CPM), and critical chain can be applied.” (Danilovic and Browning 2007:304)
The DSM algorithms are well documented in the literature and provide useful insights to system analysts through a
relatively simply construction of component and relation identification. For the MAV-PD, the design tasks for designing
and fabricating the MAV system could be represented in the Activities Matrix. The development team analyzes the
difference between outsourcing the MAV air frame and building the system in house. For the MAV-PD, because there
was so much experimentation, having the organic capacity to build their own air frame allowed the team to reduce
design cycle time.
Figure 95: Activities Matrix before Sequencing (Danilovic and Browning 2007)
Figure 966: Activities DSM after Sequencing (Danilovic and Browning 2007)

167-191
By late spring 2003, PMAJ’s team was awarded substantial funding to develop a new mini-UAV
(MAV) technology for AFSOC. In only a few weeks, PMAJ and ENFC had identified an
opportunity, mobilized a team and resources on a shoe string budget, and developed an organic
capability to build cutting edge UAV systems. The MAV project became the darling of the US Air
Force leadership and one of the best programs in AFRL. The MAV team was flying, experimenting,
testing, rebuilding, and flying again. All the while, they were using what was being learned through
the experimentation to refine system requirements.
These successes were not without consequences. AFRL was tasked to identify ~$20M to cover the
AFSOC development project. Efforts to identify external sources of funding were quickly
exhausted, and AFRL had to reallocate funds from within. Difficult decisions were made as many
exciting projects and significant human investment were cancelled or stripped of funding to meet
budgetary needs. Having won funding meant that work on the MAV would continue forward.
However, some stakeholders from other directorates were not particularly happy or supportive.
Although the team had funding for now, and the future was uncertain.
The team continued to move quickly, the MAV team had written subcontracts and research grants
to a handful of companies and universities. Contracts were written for the development of a ground
station and autopilot. The ground station and human interface development was lead by KTR1.
The KTR1 team, led by KTRDM, was collocated with AFRL and AFSOC in northern Florida. The
autopilot was developed by researchers at a university and KTR2. The design of the fuselage and
the integration of the subsystems stayed within AFRL and were managed under the supervision of
ENSD.
The MAV team was knowledgeable about every aspect of the system, programmatically and
technically. In particular, ENSD and PMWJ took the role of system architect for the entire system.
They cultivated deep technical knowledge for every piece of hardware and software within the
system. When testing in the field, they were able to troubleshoot, coordinate action, and
communicate troubles with each of the contractors. In many cases, the AFRL team could fix bugs
or make changes on the fly. For more complicated problems, contractors were asked to implement
changes. The MAV team’s intricate knowledge of the system made for efficient and speedy changes.

168-191
Within 30 days, the team designed, fabricated, and flew 12 different body shapes. PMAJ
emphasized Simon’s (1996) the idea of satisficing. The team was never asked to find the perfect
answer or a silver bullet. In working with the user, the team experimented and iterated
improvements. Because of the frequent experimenting, the team began to recognize what the user
needed before the user was able to articulate the need. For example, PMAJ wanted a fuselage with
larger volume, because he knew there needed to be enough space for “cool stuff” (even though he
did not know what that cool stuff was going to be). For example, the first aircraft only had one
camera. PMAJ pushed the team to make a fuselage large enough for 2 cameras. When the users
asked for 2 cameras, the team knew what to do because they had anticipated this requirement. In
addition, PMAJ pushed to have as much room in the fuselage as possible for more batteries. He
understood that batteries were the lifeline of the system. A larger fuselage provided flexibility for
the system. This point is discussed in more detail in Insight #5 below.
In August 2003, the team experienced its first major organizational disruption. PMAJ’s 3-year tenure
was ending, as he was selected by the USAF to attend the prestigious Air Command and Staff
College. The rotation was not unexpected, as the US Air Force uniformly transfers officers every 36
months in a deliberate effort to broaden officer exposure. In many circumstances, the downside
risks of organizational turnover are mitigated through civilian continuity. Thus, ENFC would
remain on board, as she was promoted to an AFRL oversight position for the MAV and the other
AFSOC programs. In addition, other civilians like PMWJ and ENSD were still on board.
Before PMAJ left, the MAV team achieved his objective. The team delivered a prototype accepted
by AFSOC. AFSOC called it an 80% solution. The system met or exceeded all of PMAJ’s original
requirements. The system weighted little and rolled up, could fit in a back-pack, was single-man
operable, flew longer and farther than originally advertised, and was semi-autonomous. This was
accomplished because of the great technical leadership, ingenuity, and tireless efforts of the AFRL
team, many of whom worked 80-hour weeks to deliver this capability. The BAO team was eager to
field this capability; it was time to transition to the “acquisition professionals” at the System
Program Office.
AFRL leadership selected PMID to replace PMAJ. PMID had been serving as the personal assistant
to the lab commander prior to taking over on the MAV team. In his previous post, PMID had

169-191
observed the MAV project from above. As the command executive officer, he was particularly
sensitive to the internal politics within the organization. He understood the programmatic challenges
facing the MAV team and sought to guide the program transition to the SPO and keep AFRL
development moving forward.
Insight from the ESM #2: Using ESM to Calculate Network Metrics
A MAV-PD ESM was constructed using the QKC methodology presented in Chapter 6. Figure 97 is a network
representation of the ESM at a particular time instantiation. The colors of the nodes represent the different classes of
information. The size of the nodes based on a common network metric called degree centrality that is a measure of the
connectedness of each node. In the diagram, it is interesting to note that the degree centrality of the chief engineer
(ENSD) and the engineering intern (PMWJ) is much higher than the program manager (PMAJ). This result was not
surprising as ENSD and PMWJ were responsible for the selection of the technical components and oversaw the design
tasks. The connectedness to the technical and process domains as well as the social domain provides insight in the
structure of the system. Some might conclude from the diagram that PMWJ and ENSD are more important than PMAJ.
However, as described in the text, PMAJ’s leadership and management was absolutely essential for the MAV-PD early
success. Expanding the analysis beyond the social interactions many lead to interesting insights about engineering
systems.
Figure 97: Network Representation of MAV-PD ESM at Time 1 (Summer 2003)
September 2003 – August 2004
For many, the transition from R&D to a full procurement activity to provide a capability to the
warfighter is considered a great success. This transition is not without challenges as the projects are
thrust into a government acquisitions process filled with red tape and legalities. According to federal

170-191
law, the US government is not legally able to design, develop, and produce weapon system
platforms. All development and production must be done by an industrial entity. Consequently,
government laboratories, like AFRL, are not organized to acquire weapon systems.. Therefore, the
AFRL and AFSOC leadership needed to identify a mechanism to transition the prototype
technology developed by the MAV team to another US Air Force agency able to procure the system.
The organization designated to accomplish this task was several hundred miles away from both the
lab and the user at the Aeronautical Systems Center at Wright-Patterson Air Force Base in Dayton,
Ohio.
“Wright-Patt” has a long history in aerospace. Dayton is the birthplace of Orville and Wilbur
Wright and is home to the small bike-shop where they designed the world’s first airplane capable of
powered flight. Many technologies like stealth, the ability to create aircraft transparent to radar,
were created by engineers in Wright-Patterson laboratories. Since the beginning, all aircraft projects,
including the F-16, B-2, F-117, and F-22 were conceived and managed by special offices designated
for each system. These project offices are named “System Program Offices” or SPO by the US Air
Force. Today, the base is the home to the corps of engineers, managers, and researchers, both
military and civilians, responsible for management and oversight of all aircraft development
programs.
For AFSOC, the System Program Office responsible for development and production activities was
led by SPOGC. SPOGC, the managers responsible for all Special Operations aeronautical projects,
assigned SPOPW to manage this special AFSOC portfolio of projects. Unlike the other legacy
programs in the SPO, the AFSOC project was unique in that it was a “Quick Reaction Project”.
The tasking to support the BAO project came quickly, thus manpower and resources for supporting
the procurement activity were scarce, as the SPO team was responsible for many other on going
projects. In addition to SPOPW, junior officer SPOGR was assigned to manage procurement for
the MAV team. Despite serving in the lowest military officer rank, SPOGR had 10 years of prior
military experience as an enlisted airman. SPOPW and SPOGR had sole responsibility for the MAV
and the other BAO programs until additional resources were made available.
In a traditional acquisitions project, the SPO would have developed a formal acquisition strategy
over several months or years to guide the development process. The acquisition strategy would

171-191
consist of several documents that outline the resources, budget expenditures, decision milestones,
and the various other systems engineering documents relevant to the procurement of a military
system. For the BAO portfolio, none of these documents existed; instead, the team held a personal
letter from SECAF, declaring the BAO project as an “urgent and compelling” wartime procurement.
The letter authorized SPOPW and SPOGR to move quickly and to procure the weapon system.
AFRL leadership declared the BAO project as an Advanced Technology Demonstration (ATD)
program. The primary purpose for choosing the ACAT I ATD was that is would provide close
oversight by AFRL leadership. In addition, the contract mechanism provided the ability to program
for future funding. In addition, because the BAO projects were observed closely by SECAF, AFRL
leadership wanted to maintain close oversight.
Now that the team had identified the contract mechanism, the next task was to select a contractor to
serve as the lead contractor for the production of the system.
Insight from the ESM #3: Using the ESM to Examine Project Management Structure:
At Time 2, the ESM provides interesting insights into some of the design decision made by the MAV-PD team. In
particular, as a quick reaction project, the team made a special effort to use commercially available sub-systems. Figure
98 represents the MAV-PD at time 2. The arrows point to the components with the greatest betweeness centrality.
Betweenness is a measure of the number of times a vertex occurs on a geodesic (the short path connecting 2 vertices)
Figure 98: Network Representation of the MAV-PD ESM at Time 2 (Fall 2003)
A closer look at the metrics provides interesting insights:
Time 2
MAV Subsystems

172-191
Figure 99: Comparing Betweeness Rankings in the Objects Matrix and MAV-PD ESM Figure 99 compares measures of betweeness among the top ten ranked objects in the objects matrix and the top ten
ranked objects in the MAV-PD ESM. The result showed different rankings. Based on the results from the MAV-PD
ESM the sub-systems had a higher ranking than individual components. The result is different when looking at the
rankings in the object matrix, where several components are ranked in the top ten. This result suggests that the
subsystems have greater connectivity than components in the larger system as the stakeholders and process were being
accomplished at the sub-system level rather than the component level. Intuitively, this makes sense since the team made
special effort to leverage commercially available technology. For another system managed at the component level, the
results would likely be different. Thus, the ESM provides a means to understand how an organization manages the
product development process.
With a prototype in hand, the AFRL team had identified a composite manufacturer, KTR3, to mass
produce the fuselage and wing assemblies. With KTR1 and KTR2 identified as the lead developers
for the ground station and autopilot, the system was now ready for production. The only remaining
piece of the puzzle was to identify a lead contractor to serve as the system integrator. The role of
the system integrator was to serve as the single point of contact responsible for the integration of
the system, which includes the assembly and packaging of the parts developed by the
subcontractors. The lead contractor is managerially and legally liable for meeting contractual
agreements. The team from KTR1 stepped up and volunteered to serve as the lead contractor for
MAV development. For KTR1, the situation was near ideal. AFRL had successfully developed a
prototype that was nearly a “build to print”. The opportunity to enter the rapidly growing small
UAV market could be a completely new profit center for the company. It is worth noting that
KTR1 had no experience with UAV production—only a specialty in ground stations and ground
robotics.
Rank Objects Network Alone Rank MAV-PD1 Engine Subsystem 372.797 1 Autopilot Subsystem 1977.1952 Ground Station Transmitter 271.913 2 Communication Subsystem (Datalink) 1822.323 Control Subsystem 243.768 3 Ground Station Subsystem 1749.3174 Ground Station Subsystem 211.846 4 Air Vehicle 1388.3255 Ground Station Software 197.242 5 Wing Subsystem 1298.7566 Actuator #1 153.585 6 Battery Subsystem 1013.1867 Wing Subsystem 138.008 7 Fuselage Subsystem 1007.7388 Battery Connectors 134.774 8 Ground Station Software 992.1189 Ribs 127.143 9 Control Subsystem 967.4410 Wing Composite Structure 102.837 10 Fuselage Structure 967.42

173-191
The AFSOC, AFRL, and SPO team planned to implement what was coined a “Quick Reaction”
development effort. The quick reaction concept would embrace a “spiral” development model for
the development program where development occurred in 12-18 month intervals. Each spiral began
in the research and development environment, in which the MAV team would work closely with
AFSOC to modify the design through experimentation. AFRL would have flexibility to continue
work with development contractors to iterate quickly. Once the spiral was improved and accepted
by AFSOC and AFRL team, the process would transition to the SPO environment, where SPO
would initiate production contracts, award contracts, obligate funds, and oversee production and
acceptance. Once the system transitioned to the SPO, the AFRL/AFSOC team would begin
iterating on the next spiral. The plan seemed great on paper as it fulfilled the SECAF’s intent for
streamlining the acquisitions process. The idea was that acquisition cycle-time could move from
years to months, especially in the time of war, when soldiers and airmen needed capabilities
delivered to the field quickly.
Figure 100: Quick Reaction Concept
In the fall of 2003, the SPO awarded production contracts with KTR1. Within the production
contract, KTR1 was awarded funding to procure several weapon systems. The dollars were
production dollars only, meaning KTR1 was not authorized to develop any additional capabilities
outside of the prototype.
Soon KTR1 was in a challenging situation. According to AFRL policy and the Federal Acquisition
Regulation (FAR), the AFRL MAV team could not deliver a full technical data package for the
MAV. This was a liability issue. Thus, KTR1 had no documentation and the government was not
AFRL-led R&D SPiRAL 1
SPO-led Spiral 1 Development and
AFRL-led R&D SPiRAL 2
SPO-led Spiral 2 Development and
……
12-18 Month Spirals
MAV Development Quick Reaction Concept

174-191
authorized to direct the production of the aircraft. KTR1 was expected to rely on the institutional
knowledge of the parties working on the system to develop the production aircraft.
At AFRL, ENSD and PMWJ were fixing bugs in the system and creating system documentation for
the production system to the SPO, not to be provided to KTR1. The MAV team took the
prototypes to official military exercises demonstrating the operational value of the system. The
prototype was tested in various terrains around the country. The bugs were quickly fixed,
documents transitioned to the SPO who had awarded production contracts. ENSD and PMWJ
began planning for Spiral 2, investigating new camera, battery, and other technologies, as well as
redesigning the fuselage and wing configuration to improve flight characteristics.
Meanwhile, the MAV had become a sensational success. US Air Force leadership routinely invited
STYA to Washington to tell the story. Briefings to senior DoD leadership, congressional testimony,
and site visits were routine. As AFRL program manager, PMID deftly sheltered his team from these
interruptions as he routinely represented the program at these events. In addition, PMID took the
MAV prototype on the road to trade-shows and exercises. The MAV was on display to top-brass
across the services. Several agencies express interest in the MAV-PD beyond the USAF.
Insights from ESM #4: Design Optimization and the MAV-PD ESM
As the AFRL team showcased the MAV, this increased the possibility that new stakeholders could be introduced in the
system increased. Each new stakeholder could potentially bring new objectives for the MAV system. For example, the
size requirement for the USAF was not a constraint for stakeholders like the Army. Additionally, other agencies wanted
a system that had longer air endurance capabilities.
Using information that could be represented in the MAV-PD ESM, a classic multi-disciplinary optimization (MDO) was
done to analyze the tradespace of optimal design configurations of the aircraft that would maximize the flight endurance
and minimize the longest-linear dimension of the aircraft. The analysis required information from the functional domain
and technical domain, namely system requirements in the form of the objective function and a physics-based model of
the system that described the MAV’s technical performance. Using information from the objectives matrix, the
objective functions were defined as shown in Figure 102.

175-191
Figure 101: Where to Find Information for MDO in the ESM
Figure 102: Objective Function
A physics-based model describing the performance of the MAV was created by the United States Air Force Academy.
The model was validated and verified by the AFRL MAV engineers. The model is an Excel spreadsheet that calculates a
variety of aerodynamic performance characteristics, including endurance and longest linear dimension for miniature
electric air vehicles. Figure 103 is a screenshot of the user interface.
Objects
Functions
Objectives
Stakeholders
SystemDrivers
ObjectsFunctionsObjectivesStakeholdersSystemDrivers
Objects
Functions
Objectives
Stakeholders
SystemDrivers
ObjectsFunctionsObjectivesStakeholdersSystemDrivers
System B
oundary
Activities
Activities
100081.9
/ max ××
××××=
eMAVnoengin
trimmotorpropengine
mVetaetaeDL
Endurance
2
2
⎟⎟⎠
⎞⎜⎜⎝
⎛+=
wing
wingwingLinDim b
SbS ⎟
⎟⎠
⎞⎜⎜⎝
⎛+××=
wingr
wingtwingr
wingwing c
cc
bS
_
__ 1
2
1.
2. Where:
Minimize (- Endurance, Longest Linear Dimension) Where:

176-191
Figure 103: Screenshot of MAV Physics-based Model
The result of the analysis was a design tradespace and approximated Pareto frontier (red circles), as shown in Figure 104.
Figure 104: Design Tradespace for MAV
Each element in the diagram represents a different design configuration for the air vehicle. The designs that lie on the
upper left are the approximated Pareto optimal designs or the designs that cannot be simultaneously improved along
both dimensions.
Although it was not used, the MDO analysis could have been useful for the MAV-PD team as they examined alternative
design configurations for the MAV. In particular, the team could have used the analysis to identify platform strategies
that could meet the needs of a variety of the stakeholders at significantly less cost than developing customized MAVs for
each user.
Endurance vs. Longest Wing Dimension
0.4
0.5
0.6
0.7
0.8
0.9
1
1.1
1.2
18 28 38 48 58 68 78 88
Xo1
Xo2
Xo3
Xo4
Xo5
Xo6
Approx. Pareto Front
Longest Linear Dimension (cm.)
Endu
ranc
e (h
r.)

177-191
February 2004
In February 2004, nearly one year from the date when PMAJ met with STYA for the first time, the
SPO held a “pre-transition meeting” with AFSOC, AFRL, and KTR1 team. This meeting was a
final program review for the initial purchase of the MAV systems, called Spiral 1 MAVs, to be
delivered in early Summer 2004. At the meeting KTRDM (from KTR1) proposed slight
modifications for the production version of the Spiral 1 MAV that included updated software suite
they were developing with KTR2, the subcontractor responsible for the autopilot.
This came as surprise to the AFRL and AFSOC team, as they had spent the past several months
refining the current design and felt that the Spiral 1 MAVs were stable and could be taken to field as
designed. The recommendation from AFSOC and AFRL was for the SPO to not accept any
changes for the initial delivery of the MAVs and wait for the Spiral 2 MAV already in development.
Under the existing contract to procure the Spiral 1 MAVs, KTR1 was selected as a sole source
contractor. KTR1 and the SPO had negotiated a firm-fixed price contract, which meant that KTR1
would assume all risks associated with integrating the new code. From the SPO’s perspective, if
KTR1 was willing to take the risk to deliver increased capability, then they should be given the
opportunity to deliver.
After deliberations, the SPO authorized KTR1 to implement a new software package for a MAV
delivery on a firm-fixed price contract. The details of the contract were agreed upon by the SPO
and KTR1. This was a rare form of requirements creep. Ordinarily, the customer changes system
requirements. These were KTR1 directed changes. In the ensuing months between the first
deliveries, ENSD and PMWJ continue working with STCC on Spiral 2 development. KTR1 pushed
to meet the May 2004 delivery through visits with subcontractors, etc. Meanwhile, PMID continued
to support inquires from US leadership and demonstrations at military exercises and other events.
One event was particularly significant. PMID participated in a joint military exercise. The exercise
was a real-time war game, designed for units representing the different services, to simulate
battlefield activities. Each year, the exercise planners invited organizations like the military labs to
bring new technologies to the battlefield to test concept of operations for the systems. In the spring
2004 exercise, PMID and two lieutenants showcased the MAV to other US Air Force units, and to
US Army, Marine, and Navy units participating in the exercise.

178-191
The MAV technology caught the attention from members from the Army who saw an opportunity
for the small UAV to support operations. After the exercise, the Army cadre that had seen this
technology briefed the MAV capability up the Army chain-of-command. The Army, looking for
promising technologies to defeat the devastating roadside bomb attacks in Iraq, saw the MAV as
candidate technology for convoy support in theater. The unit responsible for identifying and
procuring technology for battlespace is the Army’s Rapid Equipping Force (REF). The REF is a
“selectively-manned” organization of 120 officers, enlisted, and civilian personnel whose mission is
acquire and to deploy technology to the field in 90 days.
The REF is a finely tuned and well-oiled machine, with deep pockets for spending, aggressive
tactics, and a well-defined mission. Soon after the exercise, the REF contacted PMID to explore
whether the MAV technology would be suitable for Army mission needs. PMID directed the REF
to the SPO to discuss procurement options. In the meantime, KTR1 continued to fine tune the
Spiral 1 MAV, unaware of a mounting storm.
When May 2003 arrived, KTR1 was having difficulties. Without a technical data package, the KTR1
team was having significant difficulties integrating the MAV. In addition, their proposed changes to
the software code were not working. The AFRL prototype seemed operationally stable, yet the
KTR1’s production MAV was crashing unexpectedly in tests. After nearly 2 months of schedule
delays, KTR1 delivered systems to AFSOC to begin testing.
During the course of the pre-developmental testing, the production aircraft did not meet
expectations. STCC tested the production MAV. The system did not perform as well as the
prototype developed by AFRL. He documented several undesirable modes of behavior and critical
failures. A notable critical failure was discovered when the system was in autonomous flight waiting
for operator commands; the MAV was programmed to return to the operator in the event of a loss
of communication. This was an obvious “show-stopper” for a system designed to keep the users
safe in operations. The problems were somewhat unexpected by AFSOC, since they had been flying
workable, stable AFRL prototypes for nearly 8 months.

179-191
In the spirit of the Quick Reaction Concept, STCC requested that KTR1 fix a number of the
problems with the KTR1 MAV. The expectation was for KTR1 to deliver a deployable asset.
KTR1 was a bit frustrated with the number of changes the user was “demanding”. They felt they
had met the contractual obligation as defined by the firm-fixed price contract. They could not
financially afford to find themselves in a design, build, and fix relationship with AFSOC under the
current firm-fixed price arrangement. The KTR1 team treated STCC’s “suggestions” as contractual
obligations. They made a few of the changes and sent a bill to the SPO for new work activities
outside of the original agreement. There was contention as to what was being asked, as AFSOC
claims that the KTR1 was only being asked to fix documented problems. KTR1 was asked to give
an estimate of work and time to fix the systems.
The bill caught the SPO and particularly AFSOC by surprise. Neither party had budgeted to pay for
the bill. The SPO promptly invoiced AFSOC to pay the bill. The SPO took the position that KTR1
had delivered everything that was agreed to in the firm-fixed price contract. Because AFSOC had
not developed a complete, well-defined requirements/key performance parameters document,
KTR1 was legally correct in complaining. AFSOC disagreed, as they felt the SPO and contractor had
created this situation many months prior, by accepting the changes proposed by ARA. After several
weeks of deliberations, KTR1 ate the bill.
The experimental environment that served AFRL and AFSCO so well in the beginning was not
duplicated with KTR1 and AFSOC. KTR1’s strong relationship with AFRL and AFSOC that had
existed through the early development of the ground station was beginning to erode as a result of
KTR1’s perceived difficulties to integrate at the MAV system level. The technical challenges,
contractual limitations, and communication failures were threatening the program.
In addition, the SPO demanded that AFSOC start planning a transition to a traditional acquisitions
process. AFSOC began the tedious process of developing official documents, formalized
requirements, etc. The Quick Reaction Concept was losing wind and speed. The program, once
conceived as a non-traditional acquisitions program to avoid the lengthy 5- to 10- years development
cycletime, was regressing back to business as usual.

180-191
In July 2004, while AFSOC, AFRL, and the SPO struggled to salvage what was turning into the
quagmire of organizational mistrust, technical challenges, and strained communication. The Army
REF approached SPOGR about participating in the MAV project. The REF explained that they
were prepared to purchase a large number of combat-ready MAVs in the next 90 days. The REFs
contract was significantly larger (almost 3 times larger) than the AFSOC’s existing production
contract.
The REF representative had contract authority and carried a laptop and a portable printer, and with
a few modifications and the push of the button was able to generate contracts, statements of work,
and all of the other necessary documentation in minutes. They made the SPO’s job easy. In the
SPO world, initiating a joint contract with the Army and delivering a joint capability to warfighter in
90 days is a great opportunity. For KTR1, the REF was a prospective customer that wanted
hundreds (possibly thousand) of MAVs compared to the AFSOC’s hundreds (or less).
The REF negotiated a different contractual agreement that was an “off-the-shelf” purchase. The
contract provided a means for the Army and KTR1 to make technical changes as needed. In the
same month KTR1 and AFSOC discovered the MAV problems; the REF moved a team of
individuals to the KTR. The REF representatives were lodged in a hotel minutes from KTR1 and
worked with the team daily. The KTR1 and REF team would fly the MAV daily. The REF
suggestions were immediately incorporated in the design. The REF and KTR1 were creating a
development environment very similar to the AFRL/AFSOC relationship used to develop the first
prototype. Meanwhile, KTR1 still maintained a development relationship with AFRL, working on
spiral 2 for AFSOC.
In addition, the Army was moving to award KTR1 a development contract in addition to a
production contract. Unlike AFSOC, who planned to use the AFRL team to lead development, the
Army planned to use KTR1 directly. For KTR1, development contracts were far more valuable
than production contracts for a variety of reasons. For example, development contracts were
normally “cost plus” contracts, which meant there was very little financial risk to KTR1. The
government would pay all costs for development and the contractor’s profit would be awarded
based on performance. A part of the costs were infrastructure, labor, and technology investment
that would serve to enhance KTR1 position in the competitive UAV market.

181-191
In the REF, the Army had seemingly developed an acquisitions process that could accommodate
rapid technological advancement. The REF team would generate contracts, statements of work, and
obligate funds very quickly. This made the USAF acquisitions officer’s job easy and makes the SPO
look good. In a matter of days, the REF was able to check all of the boxes to initiate work on a
contract. When compared to the REF, the Quick Reaction Concept disorganized and unnecessarily
complicated. However, the REF process was not without challenges. Many operators in the field
what has been coined the “drive-by” fielding of technology, meaning that they often procured
technology so quickly that many life-cycle considerations were neglected. Testing, sustainment
strategies, configuration control, and logistic support were often abandoned in efforts to push
technology into the field very quickly.
The KTR1 team devoted most of their attention to the Army’s variant of the MAV. AFRL and
AFSOC watched as KTR1 and the REF made significant changes to the user interface, ground
stations and various other elements of the design that better met the Army’s needs. Some of the
technologies being developed under the AFRL/AFSOC Spiral 2 development contract were
prematurely pushed into the Army’s variant with bugs and other problems. AFSOC felt as though
they were losing the design as the REF needs were superseding AFSOC needs.
In an effort to salvage the Spiral 1 MAV, AFSOC demanded to the SPO that KTR1 resolve the
problems. In AFSOC’s eyes, the SPO was neglecting to take action. The SPO’s response was that
KTR1 had fulfilled their contractual agreement under the production contract. KTR1 would agree
to make a few changes, but not all of the changes. No new contract was created.
Insights from ESM #5: “Hot/Cold” Spot Analysis for Identifying Real Options in MAV-PD
In addition to classic MDO analysis, the engineering design community has been exploring methods for designing
flexible systems or systems that are able to change with relative ease. For the MAV-PD, designing a system that was
flexible to simultaneously meet the REF and AFSOC’s needs would have been desirable. Technically speaking, scholars
are developing new methods and strategies for creating flexible designs. Clarkson and Eckert (2004) define two sources
of change in engineered system, emergent and directed. Emergent describes the type of change that occurs from within
the boundary of the system that are perceived as unexpected. For example, in the development of the MAV, when
PMAJ accidentally broke the wing of one of the prototypes of the system, while “playing” with system at his desk. As a
consequence, this failure propagated throughout the system, causing several schedule delays, work disruptions, and other

182-191
problems. Directed changes are initiated by the stakeholders, usually in the form of declared requirements changes. In
the case of the previous example, the engineer “playing” with the wing included bending the composite wing while
brainstorming ideas for fitting the MAV in a small backpack. While bending the wing, the team conceived of a new
“wing roll-up” requirement for the system. He called the contractor responsible for the design of the wing and levied
the new requirement. This requirement change initiated a completely new design for the wing and affected various other
aspects of the system. To manage the uncertainties surrounding these systems, engineers are devising new methods to
designing systems that are flexible.
One of the challenges for designers is to identify where in the system to lay in flexibility, or real options, that allow
systems designers and managers to easily change the system to maximize benefit and minimize cost. (de Neufville 2002)
defines two types of Real Options, those “in” and those “on” a system. Real options “on” are financial options taken
on technical things or projects. Real options “on” a system treats technology as a “black box”. Whereas, a real option
“in” systems are taken by changing the design of the technical system. Real options “in” require deep knowledge about
the structure and behavior of the technical system. The real options literature has produced many strategies and
methods for valuing flexibility; however few methods and strategies have been developed to screen a system to locate
the best opportunities for options or the “hot” spots in the design.
Kalligeros (2006) and Suh (2006) are first attempts to identify where in the system to design options. Kalligeros presents
a new methodology, using the sensitivity DSM, for identifying the elements within the system least sensitive to change
and suggests that these components are the best candidates for platform design. In some sense, Kalligeros identifies the
“cold” spots or the spots in the systems that are not sensitive to change. Kalligeros shows how system designers can
better manage uncertainties and realize development savings by developing platforms that consist of these components.
He demonstrates his methodology on a large engineered system an off-shore oil drilling platform.
Suh (2006) presents an alternative approach for identifying where to lay options in the system that is more aligned with
locating “hot” spots. His framework examines uncertainties in demand and functional requirements of variants of a car-
door assembly from a common platform and first maps these to elements in the functional domain, namely the system
objective, and then to the design variables in the technical domain. He then applies network-based change propagation
analysis to the system components in order to identify the components classified as “change multipliers”. He also
examines the system to identify where there are likely to be substantial switching costs. It is these elements that are
identified as candidates for embedding flexibility or are “hot”. He concludes his analysis through a scenario where future
uncertainty is modeled the effectiveness of an existing platform design is compared against his conception of a “flexible"
platform.
Despite many positives, one serious limitation of both Kalligeros and Suh is that they both focus their attention to the
functional and technical domains. Neither attempt to represent the interactions in the social, process, or environmental
domains as found in the ESM. For “hot/cold” spot analysis there are several advantages of representing each domain
and the corresponding interactions between domains. For example, the ESM provides a richer picture for how changes

183-191
propagate across domains (eg highlight how changes in the technical domain affect the process domain and social
domains) and the identification of exogenous sources of uncertainties that might each of the domains by constructing
the systems drivers matrix. Below is a proposed approach using the ESM that incorporates and extends both Kalligeros
and Suh’s work.
Construct ESM of a particular system
- Identify sources of uncertainty driving change
- Define change scenarios
- Identify change modes for each scenario (E.g. Suh’s change propagation method)
- Calculate how change modes affect objectives for each scenario (e.g. Kallegeros’ Sensitivity DSM.
- Calculate the cost of change for each scenario (e.g. Suh’s cost analysis)
- Identify Hot/Cold Spots for each scenario
- Examine Hot/Cold spots across scenarios
- Value flexibility using Real Options Analysis
A “back of the envelope” variant of this approach was used to identify “Hot/Cold” spots in the MAV-PD. This is
discussed in detail in Chapter 7.
August 2004 – May 2005
In August 2004, the AFRL team was hit with yet another organizational disturbance. With less that
one year on the project, PMID the program manager, was transitioned to his next assignment. A
more serious disruption was the departure of ENSD, the AFRL MAV chief engineer, who took a
faculty position at a research university. In response, the AFRL team reorganized yet again. PMBI
was identified as PMID’s replacement; like PMID, PMBI had no prior engagement with the
program and minimal transition time with PMID. PMWJ and STCC were the remaining individuals
with institutional knowledge about the project. PMWJ, was promoted to chief engineer. PMWJ had
established herself as a technical leader and the MAV system architect. In addition, the AFRL team
hired ENBK, a low Reynold’s number aerodynamicist, from industry.

184-191
Insights for the ESM #6: Organizational Redundancy
One might think that losing the chief engineer would be a significant event. In the MAV-PD, however, this was not the
case. PMWJ’s connectedness nearly shadowed ENSD’s and provided a necessary redundancy for the organization.
Figure 105 represents the state of the MAV-PD before and after ENSD left the system. In time 2, PMWJ and ENSD
are the two most connected nodes as measured by degree centrality and betweeness centrality. The impact of ENSD
leaving the system was minimal because PMWJ was well positioned to take over. This was not the case when PMWJ left
the system which will be discussed later.
Figure 105: MAV-PD ESM for Times 2 and 3
PMWJ and STCC worked to troubleshoot the Spiral 1 design. The new program manager, PMBI,
who had migrated from another project at AFRL, began the tedious process of learning his new
position by negotiating contracts for Spiral 2 development. ENBK began familiarizing himself with
Time 2
Time 3
ENSDPMWJ
PMWJ

185-191
the program. For the next several months, the many organizational changes and disruptions slowed
technical advancement for Spiral 2. Some might argue that technological advancement was moving
backwards. In one instance, ENBK and some of the technical assistants designed a new fuselage
configuration for Spiral 2 MAV. PMWJ, who had been working outside of the AFRL for several
weeks, returned to the office to see the new design. The team resized the tail of the aircraft and
added a large vertical stabilizer to augment the oversized v-tail to improve aerodynamic
performance. Upon seeing the system PMWJ reminded them that although they had designed a
more technically elegant solution, the new design no longer fit into the backpack. At one level, it
may sound surprising that the new AFRL engineers would design a system that failed to meet the
most basic requirements.
In early fall, a REF officer told members from AFRL that the US Army was going to “hijack” the
MAV development program. This understandably offended the AFRL team and fueled mistrurst
between AFRL, AFSOC, KTR1 and SPO. From AFSOCs perspective, KTR1 and REF were
implementing many changes to the MAV that threatened AFSOC requirements. Some within
AFSOC were concerned that an Army variant would reduce systems effectiveness for AFSOC, and
others feared a complete failure of delivery. KTR1 had decided not to produce two versions of the
product to maintain streamlined, low cost manufacturing. They did not want to have to customize
low quantity buys. When KTR1 finally conceded to diversifying the product, the AFSOC platform
quickly fell behind in terms of capability. Developments for the AFSOC version were being
prematurely integrated into the Army version; however, the extensive development time spent on
the Army version was not being offered to AFSOC.
In December 2004, REF and the SPO delivered the first lot of Army MAVs to the Army. This
occurs while AFSOC was still waiting for the Spiral 1 MAV to be delivered with the requested
modifications. The army fielded their MAVs immediately. The REF contract with the SPO expired
and REF started their own formal relationship with KTR1 to build the Army’s version of the MAV
without involving the SPO. While the Army is flying their MAV in theatre, AFSOC shelves the
entire lot of Spiral 1 MAVs that had still never been fixed.
In January 2005, the SPO initiates an “independent review” of the systems. The SPO provided
funding to AFRL to hire PMWJ to conduct the review. After over 3 months of testing and

186-191
troubleshooting, PMWJ delivers a comprehensive 80 page report that includes ~20 critical problems
that must be fixed to get the Spiral 1 MAVs operationally ready. In March 2005, PMWJ presented
the report to SPOGR and the SPO. .
Also in January 2005, the SECAF stepped down from his position. The impact to the MAV project
was near instantaneous. This created significant uncertainty surrounding the validity of the letter
that had been used to shelter the MAV project from traditional acquisitions.
In addition, the SPO transitioned leadership from SPOPW to a new program manager, SPOKE,
shortly after the SECAF stepped down. SPOKE, a career acquisition officer, entered the program
with a fresh perspective. The SECAF was now gone and with no formal documentation about the
program, and what seemed as a bunch of gentleman’s agreements with KTR1 contracts, SPOKE
sought to bring order to the project with traditional acquisitions thinking.
Meanwhile, AFSOC involves new personnel to take responsibility to generate the program
documentation necessary to begin formal procurement activities. Leading this effort was AFSOCSR,
a career acquisitions officer. With AFSOCSR on board, AFSOC creates a “High Performance
Team” (HPT). Both STCC and PMWJ are removed from Spiral 2 development to participate as
Subject Matter Experts for the team. The team begins the tedious process of generating a
capabilities document and other products for submission a long coordination process with approvals
from a number of agencies. This is done because the new SPOPM, SPOKE, is formulating
traditional acquisition strategy requiring formal documentation for procurement. He refuses to
honor the agreements defined by the memo from the former SECAF.
Insight for the ESM #7: Comparing Social Network Metrics with ESM Network Metrics:
Another analysis performed of the MAV-PD was to examine the metrics of the social actors in the system. As mentioned
in the previous section, betweeness is the measure of the number of times a vertex occurs on the shortest path between two
vertices. In social network analysis, this measure is associated with the control of information. Thus, stakeholders with
higher betweeness have greater influence on a social network when compared with stakeholders with lower betweeness.
This analysis compare how betweeness measures of the social actors differed when comparing the social network only are
entire, multi-domain ESM network.
In Figure 106, the table on the right shows the top ten stakeholders ranked by betweeness measure within the social

187-191
network of the MAV-PD at time 3. The table on the left shows the top ten stakeholders ranked by betweeness over the
entire, multi-domain MAV-PD network at time 3.
Rank MAV-PD Social Network Betweeness Rank MAV-PD Entire Network Betweeness1 PMWJ 500.199 1 PMWJ 10972.9932 STCC 199.471 2 KTRDM 3680.0173 PMBI (MAV-PD PM 3) 84.154 3 KTRNM 1972.0814 SPOMD 54.547 4 STCC 1556.7075 SPOKE 45.143 5 PMBI (MAV-PD PM 3) 1372.5886 SPOGR 43.867 6 KTRRC 1004.0627 KTRDM 40.153 7 KTRTT 618.3128 STYA 21.676 8 KTRBR 390.4639 STSP 20.47 9 SPOMD 293.35410 PMFC 15.23 10 STYA 275.212
Figure 106: Stakeholder Betweeness Ranking Comparison The tables show that the stakeholder betweeness rankings changed. On the left, the ranking for betweeness revealed no
surprises. The highest ranked stakeholders were PMWJ and STCC who were highlighted in the previous section. PMWJ
was the MAV-PD chief engineer, and STCC the user representative for the system. PMBI was the MAV-PD program
manager. SPOMD, SPOKE, and SPOGR were USAF staff responsible for managing the MAV production contract.
KTRDM was the lead contractor responsible for the MAV ground station and the MAV production contract. The
results were as one might have expected. However, when the analysis was expanded to include the functional, technical,
and process domains, the rankings changed. For example, subcontractor KTRDM’s betweeness rankings surpassed the
MAV program manager PMBI, suggesting that KTRDM’s influence within the system may be more significant than
what is suggested by only looking at the stakeholder (social) network. In other words, by isolating analysis to the social
domain, analysts may limit the significance of actors in the greater system.
May 2005 – August 2006
In May 2005, AFSOC returned the entire Spiral 1 lot to KTR1. The AFSOC team submitted the
CDD documentation to the joint coordination process. At AFRL, PMWJ returned to development
efforts for Spiral 2 in June 2005. These are the first developmental improvements since Aug 2003.
In 20 months, no substantial technological improvements were made. PMBI, ENBK and the rest of
AFRL staff had spent several months getting up to speed on the project, yet real progress was
difficult without PMWJ who had become the MAV system architect. With the documentation
submitted and hope lost for the Spiral 1 MAVs, the AFRL and AFSOC team sought to jumpstart
the iterative, “build and fly” process that made the initial development so successful.
During the summer and fall months, the AFRL team made several improvements to the design.
Since 2003, the R/C market had achieved several advancements, as there were better batteries, more
payload options, and other available subsystem options to integrate into Spiral 2 aircraft. The AFRL

188-191
development team improved the airframe for size by creating a larger, modular payload bay for
more/better payloads and batteries.
In January 2006, 6 months after submission, the AFSOC HPT received over 500 comments and
issues raised by reviewers in the acquisition coordination process. The AFSOC team had to address
each issue to be approved from formal acquisitions. AFSOCSR and the HPT spent several months
addressing each concern raised. SPOGR was replaced by a civilian program manager, SPOMD.
In March 2006, the AFRL program manager, PMBI, was replaced. AFRL appointed PMWJ the
project manager. PMWJ led all development activities in the program. The team continued to make
improvements in the Spiral 2 system while AFSOC and the SPO waited for the paperwork to be
approved.
On 18 May 2006, AFSOC had finally received formal approval to begin a traditional acquisition for
the MAV. Three and half years since PMAJ began the project, 12 months after submitting the
required paperwork, AFSOC had finally delivered to the SPO the necessary documentation.
SPOMD was replaced by SPORC, another civilian program manager, who was now tasked to
develop an acquisition strategy for procuring the systems.
Over the summer, the SPO team decided to abandon the original Quick Reaction Concept that
allowed AFRL to continue to develop the systems. Instead, the SPO elected to perform a source
selection process by which various contractors could compete for the contract. Based on the
requirements proposed in the acquisitions documentation, an evaluation team would evaluate the
different contractor proposals and select the “best” design based on each contractor’s cost,
schedule, and performance estimates.
August 2006 to Present
In August 2006, PMWJ and STCC, the last remaining members of the original team, moved on from
the MAV project. PMWJ left for graduate school. STCC retired after 20+ years of honorable
service. PMWJ was replaced by a military officer, named PMMD., while STCC was replaced by
another operator, STND.

189-191
Insights from the ESM #8:
Figure 107 compares PMWJ and STCC’s degree centrality and betweeness with the MAV-PD averages for each time
instantiation and the measures for their replacements at time 5. The metrics show that both stakeholders’ centrality
measures grow over time and are significantly larger when compared to the MAV-PD averages at each time instantiation.
At time 5, both PMWJ and STCC were removed from the network and replaced with two new agents with significantly
smaller measures.
PM and ST ReplacementsPMWJ Time 1 Time 2 Time 3 Time 4 Time 5Degree Centrality 38 46 61 53 8Betweeness 3643 5427 11836 10331 1769.191
STCCDegree Centrality 16 21 28 23 4Betweeness 820 866 1667 3501 240.846
MAV-PD AvgsDegree Centrality 4.87 4.93 4.7 4.96 3.777Betweeness 238 258 280 296 338.777
Figure 107: Individual Metrics for PMWJ and STCC The network measures provide quantitative insights into the MAV-PD; however, to further unpack the meaning of these
metrics requires a return to the raw data. The data provides qualitative insights into the significance of PMWJ and STCC
and provides possible answers to questions that the metrics raise. For example, if one follows PMWJ’s rise of importance in
the network through the data the metrics are not surprising. PMWJ began on the project as an engineer intern who was
given the responsibility for design and hand fabricating the first AFRL prototypes developed by the AFRL team. Over time
PMWJ was promoted to deputy engineer, chief engineer, and after 2 years was made the program manager for MAV-PD.
Socially, there are stories one might expect about PMWJ’s commitment to the project, long-hours, and the decision-making
authority for many technical decisions. In addition, PMWJ was embraced by the user community and was able to form
many non-traditional social ties with stakeholders across organizations and up-and-down the chain of command.
As shown at the bottom five rows in Figure 109, the size of the MAV-PD network and the density of the relationships
changed over the five different time instantiations. The changes of the network are not surprising, as frequent
organizational changes and various technology changes were well documented and observed in the MAV-PD. It is
interesting to note the difference in network metrics at time 5, as there seemed to be a degradation of the number of
relations, far exceeds the degradation in the number of nodes, the average degree <k> and clustering coefficient is lower as
compared to the other time instantiations and path length seems much longer. After observing these changes in the
network metrics, the data was reexamined for insights as to why these metrics might have changed.

190-191
# of nodes# or
relations avg. degreeavg. path
lengthRand Grph
theo l Clus. Coef Clus. CoefRand Grph
theo C
Network Type n m <k> l C(1) C2) <k >/n
Technological
Internet undirected 10 697 31 992 5.98 3.31 5.19 0.035 0.39 0.0005power grid undirected 4 941 6 594 2.67 18.99 8.67 0.1 0.08 0.0004Train routes undirected 587 19 603 66.79 2.16 1.52 0.69 0.12software packages directed 1 439 1 723 1.2 2.42 39.81 0.07 0.082 0.0008software classes directed 1 377 2 213 1.61 1.51 15.18 0.033 0.012 0.0012electronic circuits undirected 24 097 53 248 4.34 11.05 6.87 0.01 0.03 0.0002peer-to-peer network undirected 880 1 296 1.47 4.28 17.6 0.012 0.011 0.002BOSTON T undirected 81 3684 45.48 1.887 1.15 0.94 0.857 0.565Biological
Silwood Park Food Web 154 4.75 3.4 3.23266053 0.15 0.03 0.03084416C. Elegans 282 14 2.65 2.13784938 0.28 0.05 0.04964539Social Networks
Movie Actors undirected 225226 61 3.65 2.99811184 0.79 0.00027084LANL Coauthorship undirected 52909 9.7 5.9 4.78685129 0.43 0.00018333
MAV-PD Time 1 undirected 184 884 4.87 3.61 3.2941417 0.293 0.209 0.02646739MAV-PD Time 2 undirected 196 956 4.93 3.665 3.30845964 0.314 0.2 0.02515306MAV-PD Time 3 undirected 262 1232 4.702 3.621 3.59714977 0.316 0.196 0.01794656MAV-PD Time 4 undirected 223 1106 4.96 3.667 3.37651579 0.299 0.19 0.02224215MAV-PD Time 5 undirected 206 778 3.77 4.437 4.01475136 0.221 0.126 0.01830097
>< kn
loglog
Figure 108: Network Metrics
At time 5, the changes in the network metrics reflect the changes observed within the system. The loss of PMWJ and
STCC to the system was devastating for the MAV-PD system. The replacement stakeholders were brought in from outside
organizations with no experience with the MAV-PD. As a consequence, the cohesion of the MAV-PD was disrupted as
the structure of the system changed into what seemed to be a classic military stovepipe, as compared to the flat structure
created by PMWJ and STCC’s social connections. The time 5 network shows a longer average path length and a smaller
average clustering coefficient, which supports the qualitative data that indicates that there were significant structural changes
when PMWJ and STCC left the MAV-PD. The consequences of these changes proved devastating as efforts to develop
new MAV prototypes rapidly diminished. Within 6 months after the PMWJ and STCC left the system, the MAV-PD’s
capacity to develop MAV prototypes diminished so severely that the system stopped advancing MAV prototypes. The
objectives for the system turned to the development of a small subset of the original system.
There are many observations that provide insight into what happened. First, the data and the analysis show that PMWJ and
STCC were significant system components. The interview transcripts and field notes support the finding that PMWJ and
STCC maintained depth of knowledge about the MAV system and decision-making authority and influence in the social
and technical domains. Their replacements had different skill sets, social capacity, familiarity, personalities, and professional
interests. The direction of the system was constrained by the attributes, interests, and constraints of the social actors
involved. The ESM provides a framework for scholars to engage the system, organize observations, and apply analytical
techniques to learn about the system.
The source selection was initiated in late summer 2006. The KTR1 team and several other
companies competed for the contract. In January 2007, the another contractor won the contract .
The contractor plans to design a completely different MAV than the one KTR1, AFRL, and AFSOC

191-191
had designed. The initial systems will be delivered in late 2007 or early 2008 assuming there are no
problems. Sadly, this is three years after the AFRL and AFSOC team had developed a mission-
capable prototype.
Today, the AFSOC operators are still overloaded with 150lb sacks. Only one project in the BAO
portfolio has successfully transitioned to operational environment, better batteries. The team is still
waiting for their SPOs to deliver. Many of the BAO projects are stalled by SPO traditional
acquisition strategies.
The ~20 MAV developed and paid for by the US Air Force have been picked up and shelved for
storage at AFSOC. No plans for use.
Summary: The goal of this appendix was to suggest interesting analyses that can be accomplished with
information represented in the ESM. The chapter presented a variety of analyses ranging from the
classical DSM clustering and sequencing routines to new analytical methods for learning about the
structure and behavior of engineering systems. Ongoing research and future work seeks to further
develop these ideas.