quality assurance final report - united states ... assurance final report for the fresno supersite...
TRANSCRIPT

Quality Assurance Final Report
for the
Fresno Supersite
Prepared By
John G. Watson Judith C. Chow
Prakash Doraiswamy L.-W. Antony Chen
Douglas H. Lowenthal Dana Trimble Kihong Park
Desert Research Institute 2215 Raggio Parkway
Reno, NV 89512
Report Prepared for The U.S. Environmental Protection Agency
US EPA OAQPS Research Triangle Park, NC
October 31, 2005

Table of Contents 1. Introduction............................................................................................................................. 4 2. Data Quality Objectives.......................................................................................................... 5
2.1 Precision.......................................................................................................................... 5 2.2 Bias ................................................................................................................................. 6 2.3 Accuracy ......................................................................................................................... 6 2.4 Detection Limits.............................................................................................................. 7 2.5 Completeness .................................................................................................................. 8 2.6 Representativeness.......................................................................................................... 8 2.7 Comparability ................................................................................................................. 8
3. Quality Assurance Results .................................................................................................... 11 3.1 Audits............................................................................................................................ 11
Laboratory Systems Audit .................................................................................................... 11 Inter-laboratory Comparisons ............................................................................................... 13 Field Audits........................................................................................................................... 14
3.2 Accuracy and Precision................................................................................................. 14 3.3 Detection Limits............................................................................................................ 19 3.4 Bias and Comparability................................................................................................. 24 3.5 Data Completeness........................................................................................................ 28
4. Conclusions........................................................................................................................... 52 5. References............................................................................................................................. 52 APPENDICES .............................................................................................................................. 56
2
List of Tables Table 3-1. Summary of Updated Laboratory-related Standard Operating Procedures (SOPs). .. 12 Table 3-2. Sampler Descriptions.................................................................................................. 15 Table 3-3. Particulate Sampler Flow Accuracy. .......................................................................... 16 Table 3-4. Continuous Gaseous Analyzer Accuracy. .................................................................. 17 Table 3-5. Meteorological Measurement Accuracy..................................................................... 19 Table 3-6. Instrument Detection Limits....................................................................................... 20 Table 3-7. Minimum Detection Limits (MDL) of Samples Collected Using Andersen Single
Channel FRM Sampler for the Complete Study Period........................................................ 21 Table 3-8. Minimum Detection Limits (MDL) of Samples Collected Using Sequential Filter
Samplers (SFS) for the Complete Study Period. .................................................................. 22 Table 3-9. Minimum Detection Limits (MDL) of Samples Collected Using Andersen RAAS 6-
Channel Speciation Sampler for the Complete Study Period. .............................................. 23 Table 3-10. Mass Comparisons.................................................................................................... 25 Table 3-11. Carbon Measurement Comparisons. ........................................................................ 26 Table 3-12. Nitrate and Sulfate Measurement Comparisons. ...................................................... 27 Table 3-13. Data Completeness of Continuous Instruments ....................................................... 29 Table 3-14. Data Completeness of Integrated Samplers: Mass, Ions, Metals and Elements....... 32 Table 3-15. Data Completeness of Integrated Samplers: Carbon................................................ 45 Table 3-16. Data Completeness for Meteorological Measurements............................................. 51
List of Figures Figure 2-1. Location of the Fresno First Street (FSF) Supersite with nearby satellite aites near a
freeway on-ramp (FREM) and in a nearby residential neighborhood (FRES)....................... 9 Figure 2-2. The Fresno Supersite's location in California’s San Joaquin Valley. Clovis (CLO)
was a PM2.5 compliance site. Selma (SELM) was a downwind transport site. Angiola (ANGI) was part of the California Regional PM10/PM2.5 Air Quality Study, located in a non-urban area, and acquired measurements similar to those at the supersite. .................... 10
3

1 INTRODUCTION
The intention of the U.S. Environmental Protection Agency’s (EPA) Supersites Program was to
operate research-grade air monitoring stations to improve understanding of measurement
technologies, source contributions and control strategies, and effects of suspended particles on
health. The Fresno Supersite was established with focus on the following objectives (Watson et
al., 2000):
1. Testing and evaluation of non-routine monitoring methods, with the intent to establish
their comparability with existing methods and determine their applicability to air quality
planning, exposure assessment, and health impact determination;
2. Increasing the knowledge base of aerosol characteristics, behavior, and sources so
regulatory agencies can develop standards and strategies that protect public health; and
3. Acquiring measurements that can be used to evaluate relationships between aerosol
properties, co-factors, and observed health end-points.
Specific hypotheses were formulated related to each of these objectives (Watson et al., 2000).
Measurement methods were selected to provide the variables needed to test these hypotheses.
Supersite measurements were coordinated with health and toxicological studies in the region,
specifically a multi-million dollar effort by the state of California to better understand the
relationships between air quality and asthma. Previous studies show that emissions, aerosol
composition, and meteorology change substantially over the course of a day, between seasons,
and between different years in central California where Fresno is located. It was conjectured that
relationships between different measurement methods, aerosol characteristics, and health end-
points are contingent upon these changes. Evaluating these relationships required frequent
sampling over short durations for a multi-year monitoring period.
The Supersite observables included in-situ, continuous, and short duration measurements of:
• PM2.5, PM10, and coarse (PM10 minus PM2.5) mass;
• PM2.5 sulfate, nitrate, carbon, light absorption, and light extinction;
• Number of particles in discrete size bins ranging from 0.01 µm to ~10 µm;
• Criteria pollutant gases (O3, CO, NOx);
4
• Reactive gases (NOy, NO2, HNO3, NH3); and
• Single particle characterization by time-of-flight mass spectrometry.
Field sampling and laboratory analysis were applied for: 1) gaseous and particulate organic
compounds (light hydrocarbons, heavy hydrocarbons, carbonyls, polycyclic aromatic
hydrocarbons [PAH] and other semi-volatiles); and 2) PM2.5 mass, elements, ions, and carbon.
The results obtained from the Supersite measurements have been published in various articles
(California Air Resources Board, 2003,Chow et al., 2004,Chu et al., 2004,Evans et al.,
2000,Gemmill, D. B., 2002b,Held et al., 2004,Howard-Reed et al., 2000,Lawless et al.,
2001,Park et al., 2005,Poore, 2000,Poore, 2002,Schauer and Cass, 2000,Watson and Chow,
2002a,Watson and Chow, 2002b,Watson et al., 2002,Watson et al., 2002a,Watson et al.,
2005a,Watson et al., 2005b,Watson et al., 2005c). In addition, some manuscripts are in
preparation. This report summarizes the quality assurance activities carried out at the Fresno
Supersite and their findings.
2 DATA QUALITY OBJECTIVES
The Data Quality Indicators (DQIs) that were used to characterize measurements at the Fresno
Supersite are listed and defined below. They were explained in detail in the Quality Assurance
Project Plan (QAPP) (Watson et al., 2001a).
2.1 Precision
Precision represents the reproducibility of measurements as determined by collocated sampling
using the same methods or by propagation of individual measurement precisions determined by
replicate analysis, blank analysis, and performance tests (Watson et al., 2001b). The precision
can thus be defined as deviations from the average response to the same measurable quantity.
The precision of the continuous analyzers is typically determined from replicate analyses of
calibration standards, span checks, and/or precision check records. The precision for filter-based
instruments are propagated from precisions of the volumetric measurements, the chemical
5

composition measurements, and the field blank variability using the methods of Bevington
(1969) and Watson et al. (1995). The project goal for precision was ±10%, expressed as the
coefficient of variation (CV), for values that exceed ten times their lower quantifiable limits. The
precision goal for gravimetric mass was ±5% CV as determined from replicate weighing.
2.2 Bias
Bias is the systematic or persistent distortion of a measurement process that causes error in one
direction. Bias is determined through performance audits and/or by inter-comparisons of the
performance of similar instruments. Quantifiable biases that exceed precision intervals are
corrected as part of the data validation process.
2.3 Accuracy
Accuracy is the correctness of data and refers to the degree of difference between a measured
value and a known, or “true,” value. For particulate measurements, there are no known true
values. Relative accuracy may be determined by comparing a measured value with a presumed
reference or standard, such as a PM2.5 FRM sampler. Since no true reference samples exist for
the chemistry of airborne particulate matter, the accuracy of other speciated atmospheric
components cannot be inherently determined. Analytical accuracy of the analytes were
determined by analyzing known reference materials in the laboratory. The accuracy of
gravimetric and speciated fine particle samplers were measured by performance (flow rate)
checks and audits between the sampler and a certified flow meter as follows:
% Accuracy = [(Qm-Qa)/Qa] x 100
where,
Qa is the flow rate measured using a NIST traceable flow device, and
Qm is the flow rate indicated by the sampler.
The goal of filter sampler accuracy was ±5% relative percent difference (RPD) or better.
6

The accuracy of the continuous analyzers was determined from performance audits conducted by
the California Air Resources Board (CARB). The analyzers were challenged with standards
from an independent, NIST-traceable source not used for calibration, encompassing the
operational range of the instrument. A minimum of three data points, including zero comprised
the performance audit. A linear regression analysis in the following form was used to determine
the slope, intercept and correlation coefficient:
y = mx + b
where,
x the audit concentration
y is the reported analyzer response
m is the slope, and
b is intercept.
The deviation of the slope from unity was used as the measure of accuracy. The goal for the
continuous analyzers was ± 10%, or a slope within the range of 0.900 to 1.100.
2.4 Detection Limits
The detection limit is the low range critical value that a method-specific procedure can reliably
discern. Analytical procedures and sampling equipment impose specific constraints on the
determination of minimum detection limits (MDLs). For the gaseous analyzers, MDLs are
determined by repeatedly challenging the analyzer with zero air; and for filter-based methods,
the MDLs are determined by the use of field and laboratory blanks. Generally, the MDL for
measurements were determined as three times the standard deviation of field blanks or three
times the standard deviation of the noise of an instrument when subjected to clean air. The
instrument detection limit (IDL) represents the ability of the analytical instrument to differentiate
a specific concentration from zero. The IDL was determined as three times the standard
deviation of the laboratory blanks. There was no specific acceptance criteria set for MDLs.
7

2.5 Completeness
Completeness is the percentage of valid data reported, compared to the total number of
samples/data that was possible to collect during the year. All data was subject to a rigorous
validation procedure eliminating all invalid data. For this project, in which many of the
instruments were prototypes, or newer technology, the completeness objective for all species and
measurements was 75%.
2.6 Representativeness
Representativeness is the degree to which the data accurately and precisely represents a
characteristic of a population, parameter variations at a sampling point, a process condition, or an
environment condition. For this project, spatial and temporal data representativeness were
achieved by following siting criteria for particulate monitoring sites (Watson et al., 1997) and by
comparing measurements at the Fresno “First Street Site” (FSF) with those from other
monitoring stations in the region, including the satellite sites shown in Figure 2-1 and Figure 2-2.
2.7 Comparability
Comparability reflects the extent to which measurements of the same observable agree among
different methods. Comparability may vary by method, aerosol composition, and meteorological
conditions. Several of the hypotheses tested at the Fresno Supersite included formal
comparisons of measurements for different measurement configurations, aerosol compositions,
and times of the year.
8

Figure 2-1. Location of the Fresno First Street (FSF) Supersite with nearby satellite aites near a freeway on-ramp (FREM) and in a nearby residential
neighborhood (FRES).
9
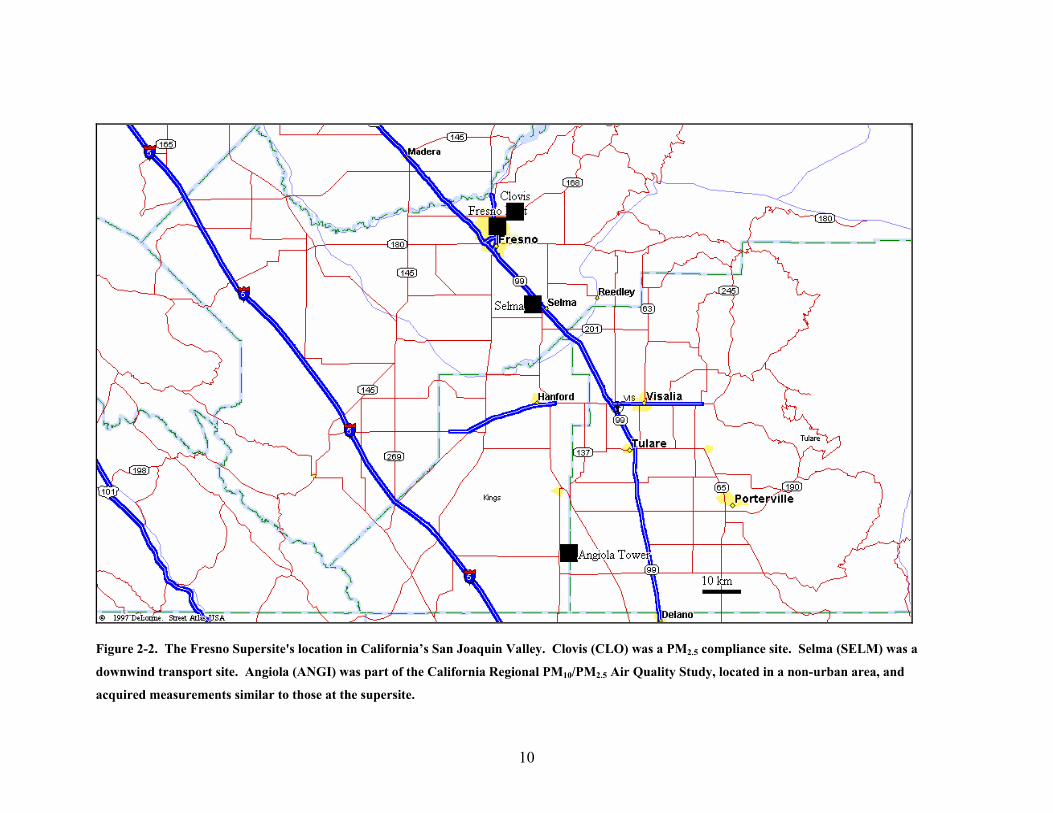
Figure 2-2. The Fresno Supersite's location in California’s San Joaquin Valley. Clovis (CLO) was a PM2.5 compliance site. Selma (SELM) was a
downwind transport site. Angiola (ANGI) was part of the California Regional PM10/PM2.5 Air Quality Study, located in a non-urban area, and
acquired measurements similar to those at the supersite.
10
3 QUALITY ASSURANCE RESULTS
3.1 Audits
3.1.1 Laboratory Systems Audit
The systems audit is intended to be a cooperative assessment resulting in improved data, rather
than a judgmental activity. A laboratory systems audit was conducted on the Environmental
Analysis Facility (EAF) and the Organic Analysis Laboratories (OAL) at the Desert Research
Institute (DRI) in the fall of 2002. The complete audit report with detailed findings is available
elsewhere (Engelbrecht, 2002). The laboratory systems audit was conducted on the following
eight measurement laboratories: (1) Atomic Absorption Spectroscopy (AA) analysis, (2)
Automated Colorimetry (AC) analysis, (3) Gravimetric analysis, (4) Ion Chromatography (IC)
analysis, (5) Thermal Optical Reflectance (TOR) analysis, (6) X-ray Fluorescence Spectrometry
(XRF) analysis, (7) Gas Chromatograph with Mass Spectrometry (GC/MS) analysis, and (8) Gas
Chromatograph with Flame Ionization Detection (GC/FID) analysis. The systems audit
examined all phases of measurement and data processing to evaluate if the Standard Operating
Procedures SOPs were followed and that operational staff were properly trained.
Overall the systems audit findings were encouraging. The audit identified the personnel to be
highly trained and extremely familiar with the instruments. Other noteworthy practices
identified by the audit included meticulous handling of samples and meticulous data validation.
The common deficiency pointed out by the audit was the need to review and update the SOPs
periodically. In addition, the audit noted the need for developing corrective action plans and to
maintain a record of training activities (Engelbrecht, 2002).
The SOPs are now continually reviewed and updated as and when necessary. Various SOPs
have been updated since 2002 and are listed in Table 3-1.
11
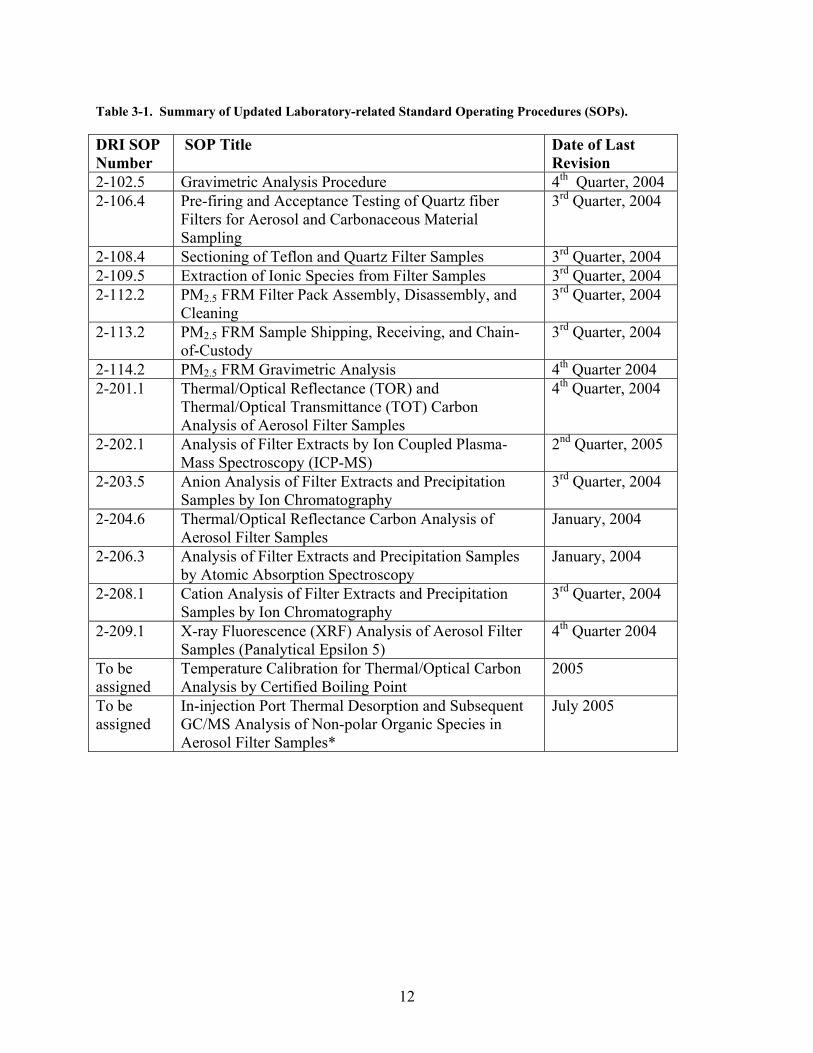
Table 3-1. Summary of Updated Laboratory-related Standard Operating Procedures (SOPs).
DRI SOP Number
SOP Title Date of Last Revision
2-102.5 Gravimetric Analysis Procedure 4th Quarter, 2004 2-106.4 Pre-firing and Acceptance Testing of Quartz fiber
Filters for Aerosol and Carbonaceous Material Sampling
3rd Quarter, 2004
2-108.4 Sectioning of Teflon and Quartz Filter Samples 3rd Quarter, 2004 2-109.5 Extraction of Ionic Species from Filter Samples 3rd Quarter, 2004 2-112.2 PM2.5 FRM Filter Pack Assembly, Disassembly, and
Cleaning 3rd Quarter, 2004
2-113.2 PM2.5 FRM Sample Shipping, Receiving, and Chain-of-Custody
3rd Quarter, 2004
2-114.2 PM2.5 FRM Gravimetric Analysis 4th Quarter 2004 2-201.1 Thermal/Optical Reflectance (TOR) and
Thermal/Optical Transmittance (TOT) Carbon Analysis of Aerosol Filter Samples
4th Quarter, 2004
2-202.1 Analysis of Filter Extracts by Ion Coupled Plasma-Mass Spectroscopy (ICP-MS)
2nd Quarter, 2005
2-203.5 Anion Analysis of Filter Extracts and Precipitation Samples by Ion Chromatography
3rd Quarter, 2004
2-204.6 Thermal/Optical Reflectance Carbon Analysis of Aerosol Filter Samples
January, 2004
2-206.3 Analysis of Filter Extracts and Precipitation Samples by Atomic Absorption Spectroscopy
January, 2004
2-208.1 Cation Analysis of Filter Extracts and Precipitation Samples by Ion Chromatography
3rd Quarter, 2004
2-209.1 X-ray Fluorescence (XRF) Analysis of Aerosol Filter Samples (Panalytical Epsilon 5)
4th Quarter 2004
To be assigned
Temperature Calibration for Thermal/Optical Carbon Analysis by Certified Boiling Point
2005
To be assigned
In-injection Port Thermal Desorption and Subsequent GC/MS Analysis of Non-polar Organic Species in Aerosol Filter Samples*
July 2005
12

3.1.2 Inter-laboratory Comparisons
A technical systems audit (TSA) of the DRI EAF laboratory was conducted by USEPA in March
2005. This audit intended to establish consistency between DRI XRF, IC, and TOR/Thermal
Optical Transmittance (TOT) measurements and EPA-certified laboratories. Inter-laboratory
comparisons were made on performance evaluation (PE) samples prepared by the National Air
and Radiation Environmental Laboratory (NAREL). Replicate sets of the PE samples were also
analyzed by EPA, as well as three other laboratories that were part of the Speciation Trends
Network (STN). Overall, the TSA concluded that the DRI laboratory performance met or
exceeded compliance standards and no deficiencies were found in any of the inspected areas
(Taylor and Boswell, 2005).
The results of PE sample inter-comparisons for mass, ions, elements and carbon fractions
showed good overall analytical agreement between NAREL and DRI measurements. A
comparison of the DRI Model 2001 carbon analyzer with NAREL’s Sunset TOT/TOR analyzer
showed good agreement when performing the Interagency Monitoring for Protected Visual
Environment’s IMPROVE-A method. Good inter-laboratory comparison was demonstrated for
OC, EC, and TC as well as the sub-fractions. However, when performing the STN TOT method,
good inter-laboratory agreement was seen for OC and TC, while not for EC and the carbon sub-
fraction. It was noted that possible oxygen contamination of the DRI 2001 system during the
non-oxidizing stage of analysis (He atmosphere) potentially had the greatest impact on the
analysis. DRI already has procedures in place to minimize and monitor for oxygen in helium.
The audit recommended that DRI should continue its efforts to eliminate or at least reduce
oxygen contamination of the Model 2001 instruments, and required that instruments performing
the STN method routinely analyze a sucrose standard solution as an additional check for
excessive oxygen in helium (Taylor and Boswell, 2005).
DRI has done a comprehensive evaluation of the current Model 2001 system, particularly for the
temperature bias and oxygen contamination, and the results have been reported to the IMPROVE
committee (Chow et al., 2005). A temperature calibration procedure has been developed (Chow
et al., 2005a) and is reflected in the most recent SOPs.
13

3.1.3 Field Audits
A field audit was conducted on March 06-07, 2002 by the Center for Environmental Research
and Technology at University of California at Riverside, UCR (UC-CERT) (Gemmill, 2002b).
The audit was conducted on the continuous gas analyzers (TEI 42, TEI42CY and UCR Luminol
analyzer) that measured nitric oxide (NO), nitrogen dioxide (NO2), oxides of nitrogen (NOx),
nitric acid (HNO3), and total reactive nitrogen compounds (NOy). Calibration standards of NO,
NO2 and NOx were generated and instrument readings were noted. In addition, flow rates of
filter-based and continuous particulate monitors and light scattering instruments were audited.
The California Air Resources Board (CARB) conducted an audit on July 15-17, 2002, the results
of which are summarized by Gemmill (2002a). In addition, a follow-up audit was conducted by
UC-CERT on September 17-19, 2002 (Gemmill, 2002a). The CARB audit covered sulfur
dioxide (SO2) and ozone (O3) analyzers and the meteorological instruments. More information
on these audits are available in Gemmill (2002b,2002a) and are attached in the Appendix.
The audit results showed that all the analyzers, except the UCR research instrument, were within
the ±10% objective as mentioned in the QAPP (Watson et al., 2001a) and showed excellent
performance. The UCR analyzer failed to meet the ±20% objective (Gemmill, 2002b,2002a).
All the particulate samplers audited had flow rates within ±5%, except the Greentek GT640A
which was off by 10-15% (Gemmill, 2002b,2002a). Overall, the audit found the samplers to be
in good condition and to be working properly. An audit of the general system condition,
operation and maintenance showed satisfactory results. All procedures were found to be
consistent with that described in the QAPP. The meteorological instruments performed
satisfactorily (Gemmill, 2002a).
3.2 Accuracy and Precision
Table 3-2 summarizes the different samplers discussed in this report along with the acronyms
used to depict them. Table 3-3 summarizes the flow checks conducted during the different field
audits. As may be seen, the samplers were accurate within 5% most of the time, except for the
GreenTek GT640 photometer. Table 3-4 summarizes the performance of the various continuous
gas analyzers during the field performance audits conducted by CARB and UC-CERT. The
instruments were challenged against NIST traceable gases. The responses of the analyzers were
14

within the ±10 to ±20% objective stated in the QAPP, except for the UCR instrument. Table 3-5
lists the performance of the meteorological instruments. As seen in the table, all the
meteorological parameters were within the respective objectives stated in QAPP.
Table 3-2. Sampler Descriptions.
Sampler Code Model Manufacturer
AE-1 AE-16 (single wavelength) Magee Scientific, Berkley, CAAE-2 AE-21 (dual wavelength) Magee Scientific, Berkley, CAAE-7 AE-31 (seven wavelength) Magee Scientific, Berkley, CAAN100 RAAS 100 Andersen Instruments, Smyrna, GAAN300 RAAS 300 Andersen Instruments, Smyrna, GAAN400 RAAS 400 Andersen Instruments, Smyrna, GAAPI 100A API 100A Advanced Pollution Instrumentation, Inc., San Diego, CAAPI 400 API 400 Advanced Pollution Instrumentation, Inc., San Diego, CABAM BAM-1020 Met One Instruments, Granst Pass, ORClimet Climet Spectro .3 Climet Instruments Company, Redlands, CADasibi 3008 Dasibi 3008 Dasibi Environmental Corp., Glendale, CADICHOT SA-246B Dichotomous Sampler Andersen Instruments, Smyrna, GADUSTTRAK DustTrak 8520 TSI Inc., Shoreview, MNGreenTek Green Tek GT640A Green Tek, Atlanta, GAHIVOL10V GMW-1200 Andersen Instruments, Smyrna, GAHIVOL25 Andersen 321A Andersen Instruments, Smyrna, GALasair PMS Lasair 1003 Particle Measurement Systems, Inc. Boulder, COM1ST SASS Speciation Sampler Met One Instruments, Granst Pass, ORMiniVol Mini Vol Portable Air Metrics Inc. Eugene, ORMOUDI Model 100 MSP Corporation, Minneapolis, MNNGN_2 NGN2 ambient temperature nephelometer Optec, Inc., Lowell, MIPAH EcoChem PAS2000 EcoChem Analytics, League City, TXR&P8400N R&P 8400N Rupprecht & Patashnick, Albany, NYR&P8400S R&P 8400S Rupprecht & Patashnick, Albany, NYRAD M903 (nephelometer) Radiance Research, Seattle, WARAD25 M903 (nephelometer) with PM2.5 inlet Radiance Research, Seattle, WARP2K R&P 2000 Rupprecht & Patashnick, Albany, NYRP5400 R&P 5400 Rupprecht & Patashnick, Albany, NYSFS Sequential Filter Sampler Desert Research Institute (DRI), Reno, NVSunset Sunset Continuous OC/EC analyzer Sunset Laboratory, Inc., Tigard, ORTEI 42C TEI 42C Thermo Electron Corporation, Franklin, MATEI 55C TEI 55C Thermo Electron Corporation, Franklin, MATEOM TEOM 1400a Rupprecht & Patashnick, Albany, NYSMPS-Long TSI 3936L10 TSI Inc., Shoreview, MNSMPS-nano TSI 3936N25 TSI Inc., Shoreview, MN
15

Table 3-3. Particulate Sampler Flow Accuracy.
Agency Audit Date Sampler % Difference
UC-CERT Mar 06-07, 2002 AE-1 7 lpm 6.77 lpm 3.4UC-CERT Sep 17-19, 2002 AE-1 6.9 lpm 7.1 lpm -2.8UC-CERT Mar 06-07, 2002 AE-7 7 lpm 7.13 lpm -1.8UC-CERT Sep 17-19, 2002 AE-7 7 lpm 6.9 lpm 1.4UC-CERT Sep 17-19, 2002 HIVOL25 38.9 cfm 41.9 cfm -7.2CARB Jul 15-17, 2002 HIVOL10V 40.9 cfm 41.3 cfm -1.0UC-CERT Mar 06-07, 2002 AN400 Channel 1 15.41 lpm 15.96 lpm -3.4UC-CERT 2 6.98 lpm 6.92 lpm 0.9UC-CERT 4 7.34 lpm 7.29 lpm 0.7UC-CERT 5 8.07 lpm 8.17 lpm -1.2UC-CERT 6 7.88 lpm 7.68 lpm 2.6UC-CERT Mar 06-07, 2002 AN100 PM2.5 S/N 79 16.64 lpm 16.58 lpm 0.4UC-CERT Sep 17-19, 2002 AN100 PM2.5 S/N 79 16.62 lpm 16.82 lpm -1.2UC-CERT Mar 06-07, 2002 AN100 PM2.5 S/N 83 16.75 lpm 16.83 lpm -0.5CARB Jul 15-17, 2002 AN100 PM2.5 16.68 lpm 16.78 lpm -0.6UC-CERT Sep 17-19, 2002 AN100 PM2.5 S/N 83 16.65 lpm 16.48 lpm 1.0UC-CERT Mar 06-07, 2002 BAM PM10 17.3 lpm 16.49 lpm 4.9UC-CERT Sep 17-19, 2002 BAM PM10 15.9 lpm 16.2 lpm -1.9UC-CERT Mar 06-07, 2002 BAM PM2.5 16.6 lpm 15.9 lpm 4.4UC-CERT Sep 17-19, 2002 BAM PM2.5 16.3 lpm 16.2 lpm 0.6UC-CERT Mar 06-07, 2002 GreenTek 5.2 lpm 4.7 lpm 10.6UC-CERT Sep 17-19, 2002 GreenTek 5.33 lpm 4.61 lpm 15.6UC-CERT Sep 17-19, 2002 Minivol S/N 1315 5.013 lpm 5.033 lpm -0.4UC-CERT Sep 17-19, 2002 Minivol S/N 1259 5.03 lpm 5.095 lpm -1.3UC-CERT Sep 17-19, 2002 Minivol S/N 1325 5.1 lpm 5.161 lpm -1.2UC-CERT Sep 17-19, 2002 Minivol S/N 1183 5.025 lpm 5.017 lpm 0.2UC-CERT Sep 17-19, 2002 Minivol S/N 1177 5.205 lpm 5.281 lpm -1.4UC-CERT Mar 06-07, 2002 OPC* System 15.81 lpm 15.61 lpm 1.3UC-CERT Sep 17-19, 2002 OPC* System 16.4 lpm 15.7 lpm 4.5UC-CERT Mar 06-07, 2002 RP5400 16 lpm 15.45 lpm 3.6UC-CERT Sep 17-19, 2002 RP5400 15.2 lpm 15.55 lpm -2.3UC-CERT Mar 06-07, 2002 TEOM PM10 Total 16.65 lpm 16.26 lpm 2.4UC-CERT Sep 17-19, 2002 TEOM PM10 Total 16.66 lpm 16.69 lpm -0.2UC-CERT Sep 17-19, 2002 TEOM PM10 Main 2.99 lpm 2.94 lpm 1.7UC-CERT Mar 06-07, 2002 TEOM PM2.5 Total 16.64 lpm 16.96 lpm -1.9UC-CERT Sep 17-19, 2002 TEOM PM2.5 Total 16.6 lpm 17.21 lpm -3.5UC-CERT Sep 17-19, 2002 TEOM PM2.5 Main 3.1 lpm 2.99 lpm 3.7* Optical Particle Counters
Audit FlowIndicated Flow
16
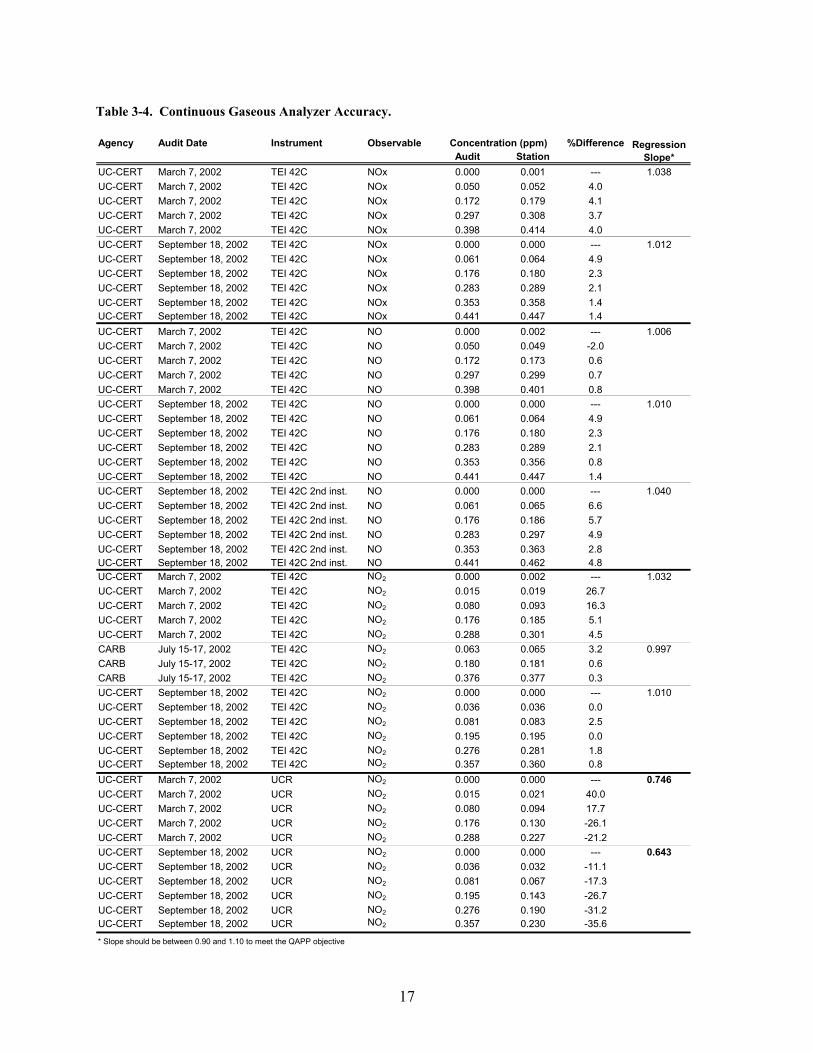
Table 3-4. Continuous Gaseous Analyzer Accuracy.
Agency Audit Date Instrument Observable %DifferenceAudit Station
UC-CERT March 7, 2002 TEI 42C NOx 0.000 0.001 --- 1.038UC-CERT March 7, 2002 TEI 42C NOx 0.050 0.052 4.0UC-CERT March 7, 2002 TEI 42C NOx 0.172 0.179 4.1UC-CERT March 7, 2002 TEI 42C NOx 0.297 0.308 3.7UC-CERT March 7, 2002 TEI 42C NOx 0.398 0.414 4.0UC-CERT September 18, 2002 TEI 42C NOx 0.000 0.000 --- 1.012UC-CERT September 18, 2002 TEI 42C NOx 0.061 0.064 4.9UC-CERT September 18, 2002 TEI 42C NOx 0.176 0.180 2.3UC-CERT September 18, 2002 TEI 42C NOx 0.283 0.289 2.1UC-CERT September 18, 2002 TEI 42C NOx 0.353 0.358 1.4UC-CERT September 18, 2002 TEI 42C NOx 0.441 0.447 1.4UC-CERT March 7, 2002 TEI 42C NO 0.000 0.002 --- 1.006UC-CERT March 7, 2002 TEI 42C NO 0.050 0.049 -2.0UC-CERT March 7, 2002 TEI 42C NO 0.172 0.173 0.6UC-CERT March 7, 2002 TEI 42C NO 0.297 0.299 0.7UC-CERT March 7, 2002 TEI 42C NO 0.398 0.401 0.8UC-CERT September 18, 2002 TEI 42C NO 0.000 0.000 --- 1.010UC-CERT September 18, 2002 TEI 42C NO 0.061 0.064 4.9UC-CERT September 18, 2002 TEI 42C NO 0.176 0.180 2.3UC-CERT September 18, 2002 TEI 42C NO 0.283 0.289 2.1UC-CERT September 18, 2002 TEI 42C NO 0.353 0.356 0.8UC-CERT September 18, 2002 TEI 42C NO 0.441 0.447 1.4UC-CERT September 18, 2002 TEI 42C 2nd inst. NO 0.000 0.000 --- 1.040UC-CERT September 18, 2002 TEI 42C 2nd inst. NO 0.061 0.065 6.6UC-CERT September 18, 2002 TEI 42C 2nd inst. NO 0.176 0.186 5.7UC-CERT September 18, 2002 TEI 42C 2nd inst. NO 0.283 0.297 4.9UC-CERT September 18, 2002 TEI 42C 2nd inst. NO 0.353 0.363 2.8UC-CERT September 18, 2002 TEI 42C 2nd inst. NO 0.441 0.462 4.8UC-CERT March 7, 2002 TEI 42C NO2 0.000 0.002 --- 1.032UC-CERT March 7, 2002 TEI 42C NO2 0.015 0.019 26.7UC-CERT March 7, 2002 TEI 42C NO2 0.080 0.093 16.3UC-CERT March 7, 2002 TEI 42C NO2 0.176 0.185 5.1UC-CERT March 7, 2002 TEI 42C NO2 0.288 0.301 4.5CARB July 15-17, 2002 TEI 42C NO2 0.063 0.065 3.2 0.997CARB July 15-17, 2002 TEI 42C NO2 0.180 0.181 0.6CARB July 15-17, 2002 TEI 42C NO2 0.376 0.377 0.3UC-CERT September 18, 2002 TEI 42C NO2 0.000 0.000 --- 1.010UC-CERT September 18, 2002 TEI 42C NO2 0.036 0.036 0.0UC-CERT September 18, 2002 TEI 42C NO2 0.081 0.083 2.5UC-CERT September 18, 2002 TEI 42C NO2 0.195 0.195 0.0UC-CERT September 18, 2002 TEI 42C NO2 0.276 0.281 1.8UC-CERT September 18, 2002 TEI 42C NO2 0.357 0.360 0.8UC-CERT March 7, 2002 UCR NO2 0.000 0.000 --- 0.746UC-CERT March 7, 2002 UCR NO2 0.015 0.021 40.0UC-CERT March 7, 2002 UCR NO2 0.080 0.094 17.7UC-CERT March 7, 2002 UCR NO2 0.176 0.130 -26.1UC-CERT March 7, 2002 UCR NO2 0.288 0.227 -21.2UC-CERT September 18, 2002 UCR NO2 0.000 0.000 --- 0.643UC-CERT September 18, 2002 UCR NO2 0.036 0.032 -11.1UC-CERT September 18, 2002 UCR NO2 0.081 0.067 -17.3UC-CERT September 18, 2002 UCR NO2 0.195 0.143 -26.7UC-CERT September 18, 2002 UCR NO2 0.276 0.190 -31.2UC-CERT September 18, 2002 UCR NO2 0.357 0.230 -35.6
* Slope should be between 0.90 and 1.10 to meet the QAPP objective
Concentration (ppm) Regression Slope*
17
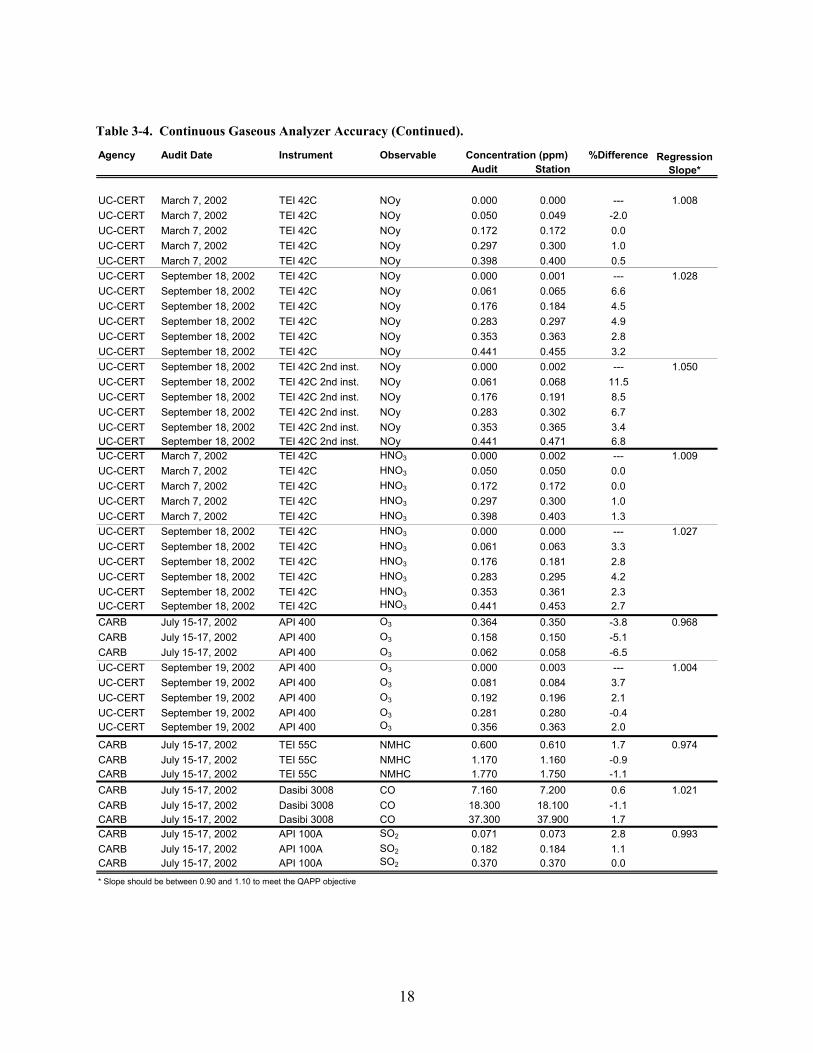
Table 3-4. Continuous Gaseous Analyzer Accuracy (Continued).
Agency Audit Date Instrument Observable %DifferenceAudit Station
UC-CERT March 7, 2002 TEI 42C NOy 0.000 0.000 --- 1.008UC-CERT March 7, 2002 TEI 42C NOy 0.050 0.049 -2.0UC-CERT March 7, 2002 TEI 42C NOy 0.172 0.172 0.0UC-CERT March 7, 2002 TEI 42C NOy 0.297 0.300 1.0UC-CERT March 7, 2002 TEI 42C NOy 0.398 0.400 0.5UC-CERT September 18, 2002 TEI 42C NOy 0.000 0.001 --- 1.028UC-CERT September 18, 2002 TEI 42C NOy 0.061 0.065 6.6UC-CERT September 18, 2002 TEI 42C NOy 0.176 0.184 4.5UC-CERT September 18, 2002 TEI 42C NOy 0.283 0.297 4.9UC-CERT September 18, 2002 TEI 42C NOy 0.353 0.363 2.8UC-CERT September 18, 2002 TEI 42C NOy 0.441 0.455 3.2UC-CERT September 18, 2002 TEI 42C 2nd inst. NOy 0.000 0.002 --- 1.050UC-CERT September 18, 2002 TEI 42C 2nd inst. NOy 0.061 0.068 11.5UC-CERT September 18, 2002 TEI 42C 2nd inst. NOy 0.176 0.191 8.5UC-CERT September 18, 2002 TEI 42C 2nd inst. NOy 0.283 0.302 6.7UC-CERT September 18, 2002 TEI 42C 2nd inst. NOy 0.353 0.365 3.4UC-CERT September 18, 2002 TEI 42C 2nd inst. NOy 0.441 0.471 6.8UC-CERT March 7, 2002 TEI 42C HNO3 0.000 0.002 --- 1.009UC-CERT March 7, 2002 TEI 42C HNO3 0.050 0.050 0.0UC-CERT March 7, 2002 TEI 42C HNO3 0.172 0.172 0.0UC-CERT March 7, 2002 TEI 42C HNO3 0.297 0.300 1.0UC-CERT March 7, 2002 TEI 42C HNO3 0.398 0.403 1.3UC-CERT September 18, 2002 TEI 42C HNO3 0.000 0.000 --- 1.027UC-CERT September 18, 2002 TEI 42C HNO3 0.061 0.063 3.3UC-CERT September 18, 2002 TEI 42C HNO3 0.176 0.181 2.8UC-CERT September 18, 2002 TEI 42C HNO3 0.283 0.295 4.2UC-CERT September 18, 2002 TEI 42C HNO3 0.353 0.361 2.3UC-CERT September 18, 2002 TEI 42C HNO3 0.441 0.453 2.7CARB July 15-17, 2002 API 400 O3 0.364 0.350 -3.8 0.968CARB July 15-17, 2002 API 400 O3 0.158 0.150 -5.1CARB July 15-17, 2002 API 400 O3 0.062 0.058 -6.5UC-CERT September 19, 2002 API 400 O3 0.000 0.003 --- 1.004UC-CERT September 19, 2002 API 400 O3 0.081 0.084 3.7UC-CERT September 19, 2002 API 400 O3 0.192 0.196 2.1UC-CERT September 19, 2002 API 400 O3 0.281 0.280 -0.4UC-CERT September 19, 2002 API 400 O3 0.356 0.363 2.0
CARB July 15-17, 2002 TEI 55C NMHC 0.600 0.610 1.7 0.974CARB July 15-17, 2002 TEI 55C NMHC 1.170 1.160 -0.9CARB July 15-17, 2002 TEI 55C NMHC 1.770 1.750 -1.1CARB July 15-17, 2002 Dasibi 3008 CO 7.160 7.200 0.6 1.021CARB July 15-17, 2002 Dasibi 3008 CO 18.300 18.100 -1.1CARB July 15-17, 2002 Dasibi 3008 CO 37.300 37.900 1.7CARB July 15-17, 2002 API 100A SO2 0.071 0.073 2.8 0.993CARB July 15-17, 2002 API 100A SO2 0.182 0.184 1.1CARB July 15-17, 2002 API 100A SO2 0.370 0.370 0.0
* Slope should be between 0.90 and 1.10 to meet the QAPP objective
Concentration (ppm) Regression Slope*
18
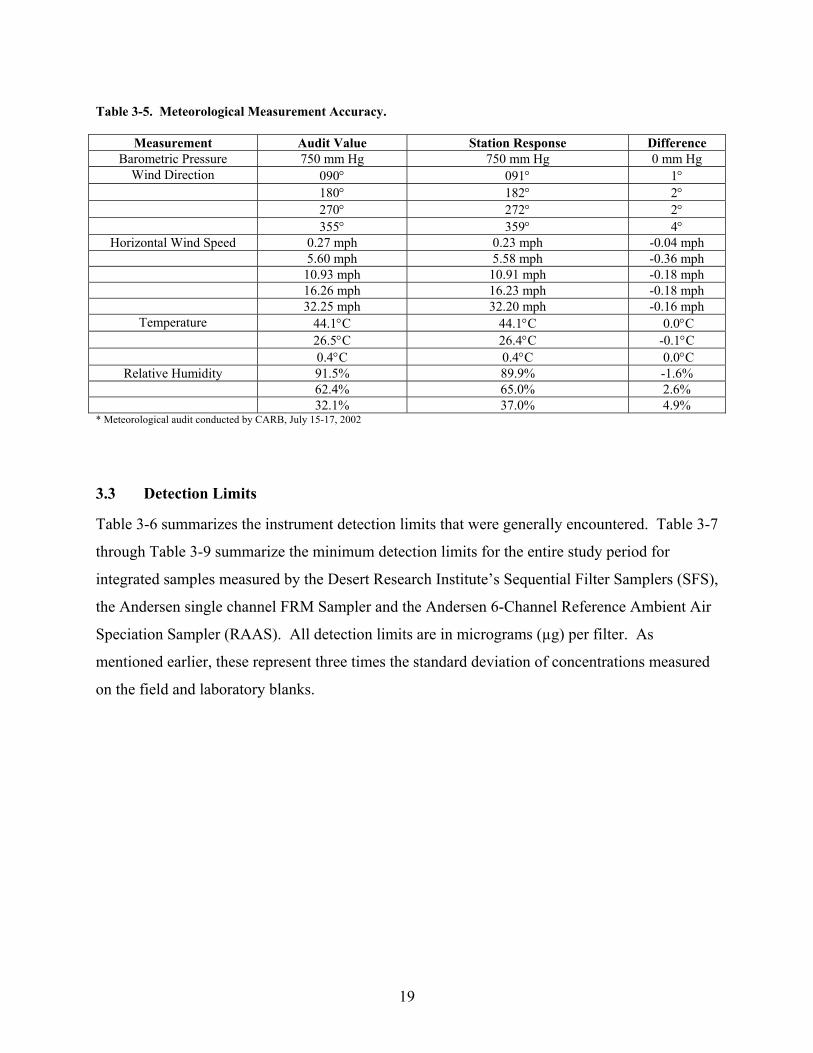
Table 3-5. Meteorological Measurement Accuracy.
Measurement Audit Value Station Response Difference Barometric Pressure 750 mm Hg 750 mm Hg 0 mm Hg
Wind Direction 090° 091° 1° 180° 182° 2° 270° 272° 2° 355° 359° 4°
Horizontal Wind Speed 0.27 mph 0.23 mph -0.04 mph 5.60 mph 5.58 mph -0.36 mph 10.93 mph 10.91 mph -0.18 mph 16.26 mph 16.23 mph -0.18 mph 32.25 mph 32.20 mph -0.16 mph
Temperature 44.1°C 44.1°C 0.0°C 26.5°C 26.4°C -0.1°C 0.4°C 0.4°C 0.0°C
Relative Humidity 91.5% 89.9% -1.6% 62.4% 65.0% 2.6% 32.1% 37.0% 4.9%
* Meteorological audit conducted by CARB, July 15-17, 2002
3.3 Detection Limits
Table 3-6 summarizes the instrument detection limits that were generally encountered. Table 3-7
through Table 3-9 summarize the minimum detection limits for the entire study period for
integrated samples measured by the Desert Research Institute’s Sequential Filter Samplers (SFS),
the Andersen single channel FRM Sampler and the Andersen 6-Channel Reference Ambient Air
Speciation Sampler (RAAS). All detection limits are in micrograms (µg) per filter. As
mentioned earlier, these represent three times the standard deviation of concentrations measured
on the field and laboratory blanks.
19

Table 3-6. Instrument Detection Limits.
Analysis IDLb
Species Methoda
Chloride (Cl-) IC 1.50048Nitrite (NO2
-) IC 1.50048Nonvolatilized Nitrate (NO3
-) IC 1.50048Volatilized Nitrate (NO3-) IC 1.50048Phosphate (PO4
3-) IC 1.50048Sulfate (SO4
=) IC 1.50048Ammonium (NH4
+) AC 1.50048Ammonia (NH3) AC 1.50048Soluble Sodium (Na+) AAS 0.23616Soluble Magnesium (Mg2+) AAS 0.05472Soluble Potassium (K+) AAS 0.14976Soluble Calcium (Ca2+) AAS 0.09792Organic Carbon (OC) TOR 2.75904Elemental Carbon (EC) TOR 2.75904Sodium (Na) XRF 0.95328Magnesium (Mg) XRF 0.3456Aluminum (Al) XRF 0.13824Silicon (Si) XRF 0.0864Phosphorus (P) XRF 0.07776Sulfur (S) XRF 0.06912Chlorine (Cl) XRF 0.13824Patassium (K) XRF 0.08352Calcium (Ca) XRF 0.06336Titanium (Ti) XRF 0.04032Vanadium (V) XRF 0.03456Chromium (Cr) XRF 0.02592Manganese (Mn) XRF 0.02304Iron (Fe) XRF 0.02016Cobalt (Co) XRF 0.01152Nickel (Ni) XRF 0.01152Copper (Cu) XRF 0.0144Zinc (Zn) XRF 0.0144Gallium (Ga) XRF 0.02592Arsenic (As) XRF 0.02304Selenium (Se) XRF 0.01728Bromine (Br) XRF 0.0144Rubidium (Rb) XRF 0.0144Strontium (Sr) XRF 0.0144Yttrium (Y) XRF 0.01728Zerconium (Zr) XRF 0.02304Molybdenum (Mo) XRF 0.03744Palladium (Pd) XRF 0.15264Silver (Ag) XRF 0.16704Cadmium (Cd) XRF 0.16704Indium (In) XRF 0.17856Tin (Sn) XRF 0.23328Antimony (Sb) XRF 0.24768Barium (Ba) XRF 0.71712Lanthanum (La) XRF 0.85536Gold (Au) XRF 0.0432Mercury (Hg) XRF 0.03456Thallium (Tl) XRF 0.03456Lead (Pb) XRF 0.04032Uranium (U) XRF 0.03168a IC=ion chromatography. AC=automated colorimetry. AAS=atomic absorption spectrophotometry. TOR=thermal/optical reflectance. XRF=x-ray fluorescence.
b Instrument detection limit (IDL) is the concentration at which instrument response equals three times the standard deviation of the response to a known concentration of zero.
Values in µg/filter
20

Table 3-7. Minimum Detection Limits (MDL) of Samples Collected Using Andersen Single Channel FRM Sampler for the Complete Study Period.
Species MDL No. of blanksMass 23.56 51Chloride (Cl-) 3.7976 48Non-Volatilized Nitrate (NO3
-) 4.5797 48Sulfate (SO4
=) 4.8114Ammonium (NH4
+) 1.7294Soluble Sodium (Na+) 1.1355 52Soluble Potassium (K+) 0.3719 52OC1* 2.2337 34OC2* 11.5692 34OC3* 9.1794 34OC4* 2.1659 34Pyrolized Organics 0.3910 34Organic Carbon 18.1885 51EC1* 0.5160 34EC2* 0.6027 34EC3* 0.2058 34Elemental Carbon (EC) 0.7920 51Total Carbon 18.4730 51Sodium (Na) 8.6650 52Magnesium (Mg) 2.4607 52Aluminum (Al) 0.7388 52Silicon (Si) 0.9187 52Phosphorous (P) 0.1764 52Sulfur (S) 0.1557 52Chlorine (Cl) 0.2352 52Potassium (K) 0.1572 52Calcium (Ca) 0.1567 52Titanium (Ti) 0.3949 52Vanadium (V) 0.2126 52Chromium (Cr) 0.0609 52Manganese (Mn) 0.0323 52Iron (Fe) 0.4096 52Cobalt (Co) 0.0173 52Nickel (Ni) 0.0221 52Copper (Cu) 0.0881 52Zinc (Zn) 0.1651 52Gallium (Ga) 0.0744 52Arsenic (As) 0.0338 52Selenium (Se) 0.0206 52Bromine (Br) 0.0160 52Rubidium (Rb) 0.0134 52Strontium (Sr) 0.0206 52Yttrium (Y) 0.0285 52Zirconium (Zr) 0.0287 52Molybdenum (Mo) 0.0774 52Palladium (Pd) 0.1362 52Silver (Ag) 0.1694 52Cadmium (Cd) 0.1730 52Indium (In) 0.1701 52Tin (Sn) 0.2296 52Antimony (Sb) 0.2090 52Barium (Ba) 1.1214 52Lanthanum (La) 1.2050 52Gold (Au) 0.0847 52Mercury (Hg) 0.0347 52Thallium (Tl) 0.0321 52Lead (Pb) 0.0932 52Uranium (U) 0.0399 52
* OC1-OC4 and EC1-EC3 refer to the organic carbon and elemental carbon fractions, respectively, obtained by Thermal Optical Reflectance (TOR) method using IMPROVE protocol.
Values in µg/filter
4851
21

Table 3-8. Minimum Detection Limits (MDL) of Samples Collected Using Sequential Filter Samplers (SFS) for the Complete Study Period.
Species MDL No. of blanksMass 24.40 55Chloride (Cl-) 1.6909 9Non-Volatilized Nitrate (NO3
-) 4.9553 9Volatilized Nitrate (NO3
-) 0.0000 7Sulfate (SO4
=) 4.0933 9Ammonium (NH4
+) 0.6698 9Soluble Potassium (K+) 0.0912 9Soluble Sodium (Na+) 0.3379 9OC1 6.6157 7OC2 2.5391 7OC3 5.2456 7OC4 2.7475 7Pyrolized Organics 0.0000 7Organic Carbon 13.6294 7EC 1 0.2495 7EC 2 1.1825 7EC 3 0.0000 7Elemental Carbon (EC) 1.1013 7Total Carbon 14.0645 7Sodium (Na) 9.7579 7Magnesium (Mg) 1.3531 7Aluminum (Al) 0.6437 7Silicon (Si) 0.1191 7Phosphorous (P) 0.1267 7Sulfur (S) 0.1699 7Chlorine (Cl) 0.2226 7Potassium (K) 0.1197 7Calcium (Ca) 0.0718 7Titanium (Ti) 0.3408 7Vanadium (V) 0.2468 7Chromium (Cr) 0.0770 7Manganese (Mn) 0.0200 7Iron (Fe) 0.1199 7Cobalt (Co) 0.0136 7Nickel (Ni) 0.0151 7Copper (Cu) 0.0344 7Zinc (Zn) 0.1872 7Gallium (Ga) 0.0593 7Arsenic (As) 0.0347 7Selenium (Se) 0.0179 7Bromine (Br) 0.0125 7Rubidium (Rb) 0.0143 7Strontium (Sr) 0.0268 7Yttrium (Y) 0.0194 7Zirconium (Zr) 0.0417 7Molybdenum (Mo) 0.0539 7Palladium (Pd) 0.0820 7Silver (Ag) 0.1791 7Cadmium (Cd) 0.2265 7Indium (In) 0.0762 7Tin (Sn) 0.2759 7Antimony (Sb) 0.2865 7Barium (Ba) 1.1247 7Lanthanum (La) 2.3500 7Gold (Au) 0.0600 7Mercury (Hg) 0.0186 7Thallium (Tl) 0.0311 7Lead (Pb) 0.0654 7Uranium (U) 0.0474 7Ammonia (NH3) 7.0608 6
Values in µg/filter
* OC1-OC4 and EC1-EC3 refer to the organic carbon and elemental carbon fractions, respectively, obtained by Thermal Optical Reflectance (TOR) method using IMPROVE protocol.
22
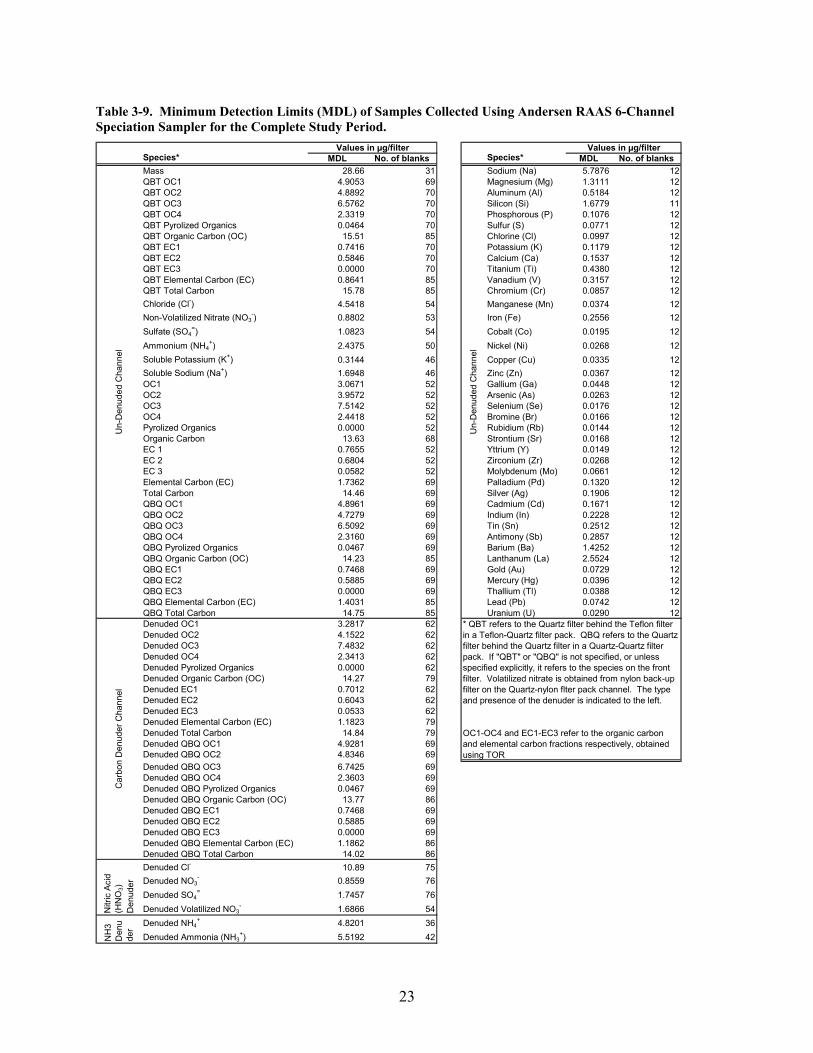
Table 3-9. Minimum Detection Limits (MDL) of Samples Collected Using Andersen RAAS 6-Channel Speciation Sampler for the Complete Study Period.
Species* MDL No. of blanks Species* MDL No. of blanksMass 28.66 31 Sodium (Na) 5.7876 12QBT OC1 4.9053 69 Magnesium (Mg) 1.3111 12QBT OC2 4.8892 70 Aluminum (Al) 0.5184 12QBT OC3 6.5762 70 Silicon (Si) 1.6779 11QBT OC4 2.3319 70 Phosphorous (P) 0.1076 12QBT Pyrolized Organics 0.0464 70 Sulfur (S) 0.0771 12QBT Organic Carbon (OC) 15.51 85 Chlorine (Cl) 0.0997 12QBT EC1 0.7416 70 Potassium (K) 0.1179 12QBT EC2 0.5846 70 Calcium (Ca) 0.1537 12QBT EC3 0.0000 70 Titanium (Ti) 0.4380 12QBT Elemental Carbon (EC) 0.8641 85 Vanadium (V) 0.3157 12QBT Total Carbon 15.78 85 Chromium (Cr) 0.0857 12Chloride (Cl-) 4.5418 54 Manganese (Mn) 0.0374 12Non-Volatilized Nitrate (NO3
-) 0.8802 53 Iron (Fe) 0.2556 12Sulfate (SO4
=) 1.0823 54 Cobalt (Co) 0.0195 12Ammonium (NH4
+) 2.4375 50 Nickel (Ni) 0.0268 12Soluble Potassium (K+) 0.3144 46 Copper (Cu) 0.0335 12Soluble Sodium (Na+) 1.6948 46 Zinc (Zn) 0.0367 12OC1 3.0671 52 Gallium (Ga) 0.0448 12OC2 3.9572 52 Arsenic (As) 0.0263 12OC3 7.5142 52 Selenium (Se) 0.0176 12OC4 2.4418 52 Bromine (Br) 0.0166 12Pyrolized Organics 0.0000 52 Rubidium (Rb) 0.0144 12Organic Carbon 13.63 68 Strontium (Sr) 0.0168 12EC 1 0.7655 52 Yttrium (Y) 0.0149 12EC 2 0.6804 52 Zirconium (Zr) 0.0268 12EC 3 0.0582 52 Molybdenum (Mo) 0.0661 12Elemental Carbon (EC) 1.7362 69 Palladium (Pd) 0.1320 12Total Carbon 14.46 69 Silver (Ag) 0.1906 12QBQ OC1 4.8961 69 Cadmium (Cd) 0.1671 12QBQ OC2 4.7279 69 Indium (In) 0.2228 12QBQ OC3 6.5092 69 Tin (Sn) 0.2512 12QBQ OC4 2.3160 69 Antimony (Sb) 0.2857 12QBQ Pyrolized Organics 0.0467 69 Barium (Ba) 1.4252 12QBQ Organic Carbon (OC) 14.23 85 Lanthanum (La) 2.5524 12QBQ EC1 0.7468 69 Gold (Au) 0.0729 12QBQ EC2 0.5885 69 Mercury (Hg) 0.0396 12QBQ EC3 0.0000 69 Thallium (Tl) 0.0388 12QBQ Elemental Carbon (EC) 1.4031 85 Lead (Pb) 0.0742 12QBQ Total Carbon 14.75 85 Uranium (U) 0.0290 12Denuded OC1 3.2817 62Denuded OC2 4.1522 62Denuded OC3 7.4832 62Denuded OC4 2.3413 62Denuded Pyrolized Organics 0.0000 62Denuded Organic Carbon (OC) 14.27 79Denuded EC1 0.7012 62Denuded EC2 0.6043 62Denuded EC3 0.0533 62Denuded Elemental Carbon (EC) 1.1823 79Denuded Total Carbon 14.84 79Denuded QBQ OC1 4.9281 69Denuded QBQ OC2 4.8346 69Denuded QBQ OC3 6.7425 69Denuded QBQ OC4 2.3603 69Denuded QBQ Pyrolized Organics 0.0467 69Denuded QBQ Organic Carbon (OC) 13.77 86Denuded QBQ EC1 0.7468 69Denuded QBQ EC2 0.5885 69Denuded QBQ EC3 0.0000 69Denuded QBQ Elemental Carbon (EC) 1.1862 86Denuded QBQ Total Carbon 14.02 86Denuded Cl- 10.89 75Denuded NO3
- 0.8559 76Denuded SO4
= 1.7457 76Denuded Volatilized NO3
- 1.6866 54Denuded NH4
+ 4.8201 36Denuded Ammonia (NH3
+) 5.5192 42
Un-
Den
uded
Cha
nnel
Values in µg/filter Values in µg/filter
Un-
Den
uded
Cha
nnel
Car
bon
Den
uder
Cha
nnel
Nitr
ic A
cid
(HN
O3)
D
enud
er
NH
3 D
enu
der
* QBT refers to the Quartz filter behind the Teflon filter in a Teflon-Quartz filter pack. QBQ refers to the Quartz filter behind the Quartz filter in a Quartz-Quartz filter pack. If "QBT" or "QBQ" is not specified, or unless specified explicitly, it refers to the species on the front filter. Volatilized nitrate is obtained from nylon back-up filter on the Quartz-nylon flter pack channel. The type and presence of the denuder is indicated to the left.
OC1-OC4 and EC1-EC3 refer to the organic carbon and elemental carbon fractions respectively, obtained using TOR
23

3.4 Bias and Comparability
Various articles on the inter-comparability of the different samplers and measurements (Chow et
al., 2005b,2005d,2005c,Park et al., 2005) have either been published, or are in the process of
preparation. Table 3-10 through Table 3-12 list the different comparison metrics for mass,
carbon, nitrate and sulfate measurements as discussed in the QAPP. The mass comparisons
against the FRM sampler showed correlation coefficients (r), typically greater than 0.90, except
for the TEOM. The TEOM sampler inlet was maintained at 50 oC, resulting in the loss of semi-
volatile components and hence under-estimating the mass concentrations significantly (Chow et
al., 2005b). The BAM measurements were consistently biased higher than the FRM
measurements possibly due to water absorption by hygroscopic species (Chow et al., 2005b). Table 3-11 shows that the organic carbon (OC), elemental carbon (EC) and total carbon (TC)
measurements were, in general, comparable between the AN100 FRM, the AN400 RAAS and
the SFS integrated samplers (Chow et al., 2005c,Watson and Chow, 2002b). The inter-
comparison of the three integrated samplers showed high correlations (r ≥ 0.95), indicating a
highly predictable linear relationship. The R&P 5400 continuous ambient carbon analyzer was
neither comparable to, nor predictable of, the integrated SFS sampler measurements (Chow et
al., 2005c).
While the R&P 8400N continuous nitrate analyzer under-predicted nitrate concentrations in
comparison to the integrated speciation sampler (AN400), they were, in general, highly
correlated (r > 0.84) (Table 3-12). The comparison between the R&P 8400S continuous sulfate
analyzer and the integrated samplers showed poorer correlations, possibly because of low
ambient sulfate concentrations. The comparison between the FRM and the AN400 samplers
showed excellent agreement for both nitrate and sulfate (Park et al., 2005a).
24

Table 3-10. Mass Comparisons.
Begin EndY X N Slope ± unc int ± unc. r avg ± std dev <1σ 1σ-2σ 2σ-3σ >3σ avg ± std dev Date Date
AN300_2 AN300_1 151 0.95 ± 0.01 0.64 ± 0.31 0.99 -0.38 ± 2.72 0.99 ± 0.12 01/06/99 01/26/02RP2K_2 RP2K_1 77 0.91 ± 0.02 0.34 ± 0.48 0.99 -1.86 ± 3.14 0.93 ± 0.13 09/11/02 12/29/03AN300_1 AN100 106 0.98 ± 0.02 1.47 ± 0.50 0.99 1.06 ± 3.66 44 37 16 9 1.10 ± 0.16 07/05/99 02/01/02AN300_2 AN100 148 0.92 ± 0.01 1.63 ± 0.28 0.99 0.02 ± 3.01 89 40 16 3 1.04 ± 0.11 07/05/99 11/04/02RP2K_1 AN100 103 0.91 ± 0.01 1.11 ± 0.29 0.99 -0.50 ± 2.45 69 28 3 3 1.00 ± 0.14 02/07/02 12/29/03RP2K_2 AN100 66 0.87 ± 0.01 1.18 ± 0.31 0.99 -1.59 ± 2.93 39 17 7 3 0.96 ± 0.20 09/11/02 12/29/03
SFS AN100 60 0.85 ± 0.02 1.02 ± 0.65 0.99 -3.04 ± 6.27 18 16 12 14 0.97 ± 0.31 12/02/99 01/31/01AN400 AN100 239 0.96 ± 0.01 0.89 ± 0.19 0.99 -0.07 ± 2.44 155 63 13 8 1.03 ± 0.19 07/05/99 12/29/03DICHOT PM2.5 AN100 114 0.81 ± 0.02 2.71 ± 0.87 0.95 -1.75 ± 9.10 75 33 4 2 0.97 ± 0.10 07/05/99 10/28/01M1ST AN100 185 0.98 ± 0.01 1.25 ± 0.31 0.99 0.87 ± 3.19 96 37 21 31 1.11 ± 0.25 04/06/00 12/29/03BAM PM2.5 AN100 206 0.95 ± 0.01 4.40 ± 0.46 0.98 3.34 ± 5.07 42 36 26 102 1.30 ± 0.33 12/20/99 09/24/03TEOM PM2.5 AN100 222 0.40 ± 0.03 4.66 ± 0.88 0.74 -9.62 ± 18.95 55 47 15 105 0.78 ± 0.37 07/11/99 12/29/03DUSTTRAK AN100 142 1.86 ± 0.07 12.46 ± 1.91 0.92 29.34 ± 22.97 1 2 1 138 2.73 ± 0.98 04/30/00 06/20/03GREENTEK AN100 66 1.44 ± 0.06 -2.95 ± 1.85 0.95 7.72 ± 13.95 13 7 10 36 1.20 ± 0.39 10/04/01 01/21/03
BAM PM10 HIVOL10V 105 1.05 ± 0.03 4.76 ± 1.32 0.97 7.02 ± 8.48 1.18 ± 0.23 12/08/99 08/29/01TEOM PM10 HIVOL10V 111 0.67 ± 0.05 2.17 ± 2.45 0.81 -11.51 ± 17.66 0.72 ± 0.23 07/11/99 06/24/01
AN400 SFS 63 1.10 ± 0.02 0.57 ± 0.84 0.98 2.97 ± 5.69 19 17 10 17 1.14 ± 0.20 12/02/99 01/31/01MOUDI SFS 15 1.09 ± 0.21 6.28 ± 16.15 0.82 12.54 ± 27.00 5 1 1 8 1.21 ± 0.39 12/15/00 02/03/01DUSTTRAK BAM PM2.5 830 2.13 ± 0.03 3.41 ± 0.80 0.94 30.34 ± 24.73 2.33 ± 0.79 04/26/00 06/23/03GREENTEK BAM PM2.5 373 1.52 ± 0.03 -9.79 ± 0.97 0.94 4.91 ± 14.94 1.04 ± 0.39 09/16/01 01/22/03
RAD25 AN100 115 4.07 ± 0.13 -9.52 ± 4.97 0.95 3.34 1.02 11/20/00 08/25/03RAD AN100 192 4.49 ± 0.08 -9.79 ± 2.42 0.97 3.67 1.18 03/25/00 08/01/03RAD SFS 74 5.46 ± 0.17 7.08 ± 7.40 0.96 5.31 1.90 03/25/00 02/03/01
Y/X
(µg/m3)(µg/m3)
Samplers Distribution of Y-XOrdinary Least Squares Regression Y-X
25

Table 3-11. Carbon Measurement Comparisons.
Begin EndY X N Slope ± unc int ± unc. r avg ± std dev <1σ 1σ-2σ2σ-3σ >3σ avg ± std dev Date Date
SFS OC RP5400 OC 19 0.59 ± 0.11 0.17 ± 0.97 0.79 -3.35 ± 1.51 2 0 0 17 0.62 ± 0.20 01/19/00 02/03/01SFS EC RP5400 EC 19 0.55 ± 0.08 0.32 ± 0.16 0.86 -0.49 ± 0.55 3 9 4 3 0.79 ± 0.27 01/19/00 02/03/01SFS TC RP5400 TC 19 0.60 ± 0.10 0.34 ± 1.05 0.83 -3.84 ± 1.87 1 1 1 16 0.65 ± 0.20 01/19/00 02/03/01
AN100 OC SFS OC 55 1.05 ± 0.02 -0.38 ± 0.27 0.99 0.02 ± 1.34 40 13 1 1 0.99 ± 0.13 12/02/99 01/31/01AN400 OC SFS OC 55 1.08 ± 0.03 -0.10 ± 0.31 0.98 0.55 ± 1.59 33 18 3 1 1.06 ± 0.18 12/02/99 01/31/01AN400 OC AN100 OC 56 1.02 ± 0.02 0.32 ± 0.25 0.99 0.51 ± 1.25 40 9 5 2 1.07 ± 0.17 12/02/99 01/31/01
AN100 EC SFS EC 55 1.01 ± 0.03 0.12 ± 0.10 0.98 0.14 ± 0.50 42 10 2 1 1.11 ± 0.25 12/02/99 01/31/01AN400 EC SFS EC 55 1.04 ± 0.03 -0.09 ± 0.08 0.98 0.01 ± 0.43 40 13 1 1 1.01 ± 0.3 12/02/99 01/31/01AN400 EC AN100 EC 56 0.99 ± 0.04 -0.12 ± 0.11 0.97 -0.14 ± 0.58 26 24 4 2 0.92 ± 0.24 12/02/99 01/31/01
AN100 TC SFS TC 55 1.04 ± 0.02 -0.32 ± 0.28 0.99 0.15 ± 1.40 39 14 1 1 1.01 ± 0.13 12/02/99 01/31/01AN400 TC SFS TC 55 1.08 ± 0.02 -0.24 ± 0.33 0.99 0.59 ± 1.79 34 16 4 1 1.04 ± 0.17 12/02/99 01/31/01AN400 TC AN100 TC 56 1.03 ± 0.02 0.10 ± 0.27 0.99 0.40 ± 1.36 37 14 4 1 1.04 ± 0.16 12/02/99 01/31/01
Y/X
(µg/m3) (µg/m3)
Samplers Ordinary Least Squares Regression Y-X Distribution of Y-X
26

Table 3-12. Nitrate and Sulfate Measurement Comparisons.
Samplingperiod Y X* N Slope Intercept r
Nirate (NO 3- )
2001 R&P8400N AN400 NV 50 0.49 0.83 0.97AN400 Total 50 0.38 0.71 0.94
2002 R&P8400N AN400 NV 57 0.61 0.61 0.97AN400 Total 57 0.64 -0.10 0.97
2003 R&P8400N AN400 NV 54 0.54 0.94 0.91AN400 Total 54 0.61 0.03 0.96
Winter 01-03a R&P8400N AN400 NV 41 0.53 0.94 0.98AN400 Total 41 0.38 2.22 0.91
Summer 01-03b R&P8400N AN400 NV 41 0.41 0.57 0.19AN400 Total 42 0.60 0.01 0.87
2001 R&P8400N AN100 50 0.50 0.95 0.972002 R&P8400N AN100 59 0.65 0.86 0.972003 R&P8400N AN100 54 0.44 1.50 0.84
Winter 01-03 R&P8400N AN100 40 0.52 1.27 0.96Summer 01-03 R&P8400N AN100 43 0.09 0.90 0.03
2001-2004 R&P8400N R&P8400N 1064 0.86 -0.08 0.93
2001-2003 AN400 AN100 168 1.02 0.43 0.99
Sulfate (SO 4= )
2002 R&P8400S AN400 53 0.98 0.09 0.742003 R&P8400S AN400 44 0.46 0.74 0.57
Winter 02-03c R&P8400S AN400 23 0.63 0.82 0.77Summer 02-03d R&P8400S AN400 28 0.40 0.71 0.52
2002 R&P8400S AN100 53 1.03 0.18 0.772003 R&P8400S AN100 43 0.49 0.66 0.54
Winter 02-03 R&P8400S AN100 22 0.86 0.48 0.87Summer 02-03 R&P8400S AN100 28 0.19 1.09 0.29
2001-2003 AN400 AN100 166 1.01 0.05 0.97* NV = Non-Volatilized nitrate*Total = Total particulate nitrate = sum of volatilzed and non-volatilized nitratea Winter 01-03: Dec 2000, Jan-Feb 2001, Dec 2001-Feb 2002, Dec 2002-Feb 2003, Dec 2003b Summer 01-03: Jun-Aug 2001, Jun-Aug 2002, Jun-Aug 2003c Winter 02-03: Feb 2002, Dec 2002-Feb 2003, Dec 2003d Summer 02-03: Jun-Aug 2002, Jun-Aug 2003
Samplers Ordinary Least Squares Regression
27
3.5 Data Completeness
Table 3-13 through Table 3-16 summarize the data completeness for the various instruments at
the Fresno Supersite. As seen, the average data recovery was typically greater than 75% for
most instruments. While certain instruments had data recovery less than 75% for specific years,
the average data recovery exceeds the goal of 75%, except for the R&P 5400 carbon analyzer.
This was mostly attributed to instrument malfunction and downtime for maintenance and repair.
The R&P 5400 carbon analyzer malfunctioned frequently and presented numerous maintenance
issues compared to other continuous instruments. The experience at the Fresno Supersite
suggests that the R&P 5400 carbon analyzer was unreliable. The integrated sampler
measurements showed more than 90% recovery for all parameters. The meteorological
measurements also exhibited more than 95% data recovery.
28

Table 3-13. Data Completeness of Continuous Instruments
Instrument Year Start Date End Date % RecoveryLight Scattering InstrumentsDusttrak 2000 25-Apr-00 31-Dec-00 55.3%Dusttrak 2001 01-Jan-01 31-Dec-01 86.5%Dusttrak 2002 01-Jan-02 31-Dec-02 88.6%Dusttrak 2003 01-Jan-03 24-Jun-03 99.7%
82.5%GreenTek, 1-hr 2000 25-Apr-00 31-Dec-00 98.5%GreenTek, 1-hr 2001 01-Jan-01 31-Aug-01 97.8%
98.2%GreenTek. 5 min 2001 15-Sep-01 31-Dec-01 65.2%GreenTek. 5 min 2002 01-Jan-02 31-Dec-02 93.9%
79.6%NGN_2 2000 01-Feb-00 31-Dec-00 83.6%NGN_2 2001 01-Jan-01 31-Dec-01 83.3%NGN_2 2002 01-Jan-02 31-Dec-02 78.7%NGN_2 2003 01-Jan-03 21-Dec-03 88.1%
83.4%RAD25, 5 min 2000 08-Sep-00 31-Dec-00 99.2%RAD25, 5 min 2001 01-Jan-01 31-Dec-01 92.4%RAD25, 5 min 2002 01-Jan-02 31-Dec-02 98.5%RAD25, 5 min 2003 01-Jan-03 05-Aug-03 97.5%
96.9%RAD25, 1-min 2003 05-Aug-03 31-Dec-03 97.9%RAD25, 1-min 2004 01-Jan-04 31-Dec-04 83.0%
90.5%RAD, 5 min 2000 21-Mar-00 31-Dec-00 94.7%RAD, 5 min 2001 01-Jan-01 31-Dec-01 97.3%RAD, 5 min 2002 01-Jan-02 31-Dec-02 99.3%RAD, 5 min 2003 01-Jan-03 05-Aug-03 97.0%
97.1%RAD, 1-min 2003 05-Aug-03 31-Dec-03 96.9%RAD, 1-min 2004 01-Jan-04 31-Dec-04 83.0%
89.9%Light Absorption InstrumentsAE-1 1999 17-Dec-99 31-Dec-99 73.8%AE-1 2000 01-Jan-00 31-Dec-00 88.8%AE-1 2001 01-Jan-01 31-Dec-01 68.8%AE-1 2002 01-Jan-02 31-Dec-02 72.0%
75.8%AE-2 2003 25-Feb-03 31-Dec-03 89.9%AE-2 2004 01-Jan-04 31-Dec-04 85.8%
87.8%AE-7 1999 12-May-99 31-Dec-99 88.8%AE-7 2000 01-Jan-00 31-Dec-00 79.0%AE-7 2001 01-Jan-01 31-Dec-01 92.7%AE-7 2002 01-Jan-02 31-Dec-02 93.7%AE-7 2003 01-Jan-03 31-Dec-03 93.5%AE-7 2004 01-Jan-04 31-Dec-04 94.5%
90.4%
Average
Average
Average
Average
Average
Average
Average
Average
Average
Average
Average
29

Table 3-13. Data Completeness of Continuous Instruments (Continued). Instrument Year Start Date End Date % RecoveryPM10 MassBAM 1999 04-Dec-99 31-Dec-99 96.9%BAM 2000 01-Jan-00 31-Dec-00 98.3%BAM 2001 01-Jan-01 31-Dec-01 97.4%BAM 2002 01-Jan-02 31-Dec-02 99.3%BAM 2003 01-Jan-03 31-Dec-03 97.1%
97.8%TEOM 1999 10-Jul-99 31-Dec-99 93.0%TEOM 2000 01-Jan-00 31-Dec-00 97.0%TEOM 2001 01-Jan-01 31-Dec-01 58.4%TEOM 2002 01-Jan-02 31-Dec-02 98.6%TEOM 2003 01-Jan-03 31-Dec-03 99.9%TEOM 2004 01-Jan-04 31-Dec-04 72.4%
86.5%PM2.5 MassBAM 1999 16-Dec-99 31-Dec-99 91.7%BAM 2000 01-Jan-00 31-Dec-00 96.2%BAM 2001 01-Jan-01 31-Dec-01 91.4%
93.1%TEOM 1999 10-Jul-99 31-Dec-99 89.6%TEOM 2000 01-Jan-00 31-Dec-00 98.6%TEOM 2001 01-Jan-01 31-Dec-01 64.0%TEOM 2002 01-Jan-02 31-Dec-02 100.0%TEOM 2003 01-Jan-03 31-Dec-03 99.9%TEOM 2004 01-Jan-04 31-Dec-04 99.6%
91.9%NitrateR&P8400N - 1 2000 12-Oct-00 31-Dec-00 78.8%R&P8400N - 1 2001 01-Jan-01 31-Dec-01 79.6%R&P8400N - 1 2002 01-Jan-02 31-Dec-02 96.9%R&P8400N - 1 2003 01-Jan-03 31-Dec-03 86.7%R&P8400N - 1 2004 01-Jan-04 31-Dec-04 98.3%
88.0%R&P8400N - 2 2000 16-Aug-00 31-Dec-00 88.5%R&P8400N - 2 2001 01-Jan-01 31-Dec-01 97.8%R&P8400N - 2 2002 01-Jan-02 31-Dec-02 85.6%R&P8400N - 2 2003 01-Jan-03 31-Dec-03 53.0%R&P8400N - 2 2004 01-Jan-04 31-Dec-04 98.4%
84.7%SulfateR&P8400S 2002 29-Jan-02 31-Dec-02 91.1%R&P8400S 2003 01-Jan-03 31-Dec-03 77.0%R&P8400S 2004 01-Jan-04 31-Dec-04 82.9%
83.7%
Average
Average
Average
Average
Average
Average
Average
30

Table 3-13. Data Completeness of Continuous Instruments (Continued). Instrument Year Start Date End Date % RecoveryCarbonRP5400 2000 13-Jan-00 31-Dec-00 48.6%RP5400 2001 01-Jan-01 31-Dec-01 70.0%RP5400 2002 01-Jan-02 31-Dec-02 68.7%RP5400 2003 01-Jan-03 31-Dec-03 43.3%RP5400 2004 01-Jan-04 31-Dec-04 48.4%
55.8%Sunset 2003 23-Jul-03 31-Dec-03 89.0%Sunset 2004 01-Jan-04 31-Dec-04 89.9%
89%PAH 1999 30-Sep-99 31-Dec-99 99.4%PAH 2000 01-Jan-00 31-Dec-00 98.9%PAH 2001 01-Jan-01 31-Dec-01 100.0%PAH 2002 01-Jan-02 31-Dec-02 100.0%PAH 2003 01-Jan-03 31-Dec-03 97.8%PAH 2004 01-Jan-04 31-Dec-04 91.0%
97.8%Particle CountersLasair 2000 06-Jan-00 31-Dec-00 92.4%Lasair 2001 01-Jan-01 31-Dec-01 89.0%Lasair 2002 01-Jan-02 31-Dec-02 94.1%Lasair 2003 01-Jan-03 31-Dec-03 98.0%Lasair 2004 01-Jan-04 31-Dec-04 99.2%
94.5%Climet 2000 06-Jan-00 31-Dec-00 97.8%Climet 2001 01-Jan-01 31-Dec-01 84.9%Climet 2002 01-Jan-02 31-Dec-02 89.3%Climet 2003 01-Jan-03 31-Dec-03 92.7%Climet 2004 01-Jan-04 31-Dec-04 98.1%
92.6%SMPS_LONG 2000 17-Mar-00 31-Dec-00 98.0%SMPS_LONG 2001 01-Jan-01 31-Dec-01 89.7%SMPS_LONG 2002 01-Jan-02 31-Dec-02 95.9%SMPS_LONG 2003 01-Jan-03 31-Dec-03 95.2%SMPS_LONG 2004 01-Jan-04 31-Dec-04 76.0%
90.9%SMPS_Nano 2002 25-Aug-02 31-Dec-02 99.3%SMPS_Nano 2003 01-Jan-03 31-Dec-03 60.4%SMPS_Nano 2004 01-Jan-04 31-Dec-04 87.7%
82.4%NO and NOy MeasurementsTEI 42C 2000 13-Jan-00 31-Dec-00 86.7%TEI 42C 2001 01-Jan-01 31-Dec-01 89.3%
88.0%
Average
Average
Average
Average
Average
Average
Average
Average
31

Table 3-14. Data Completeness of Integrated Samplers: Mass, Ions, Metals and Elements.
Instrument Parameter Year Start Date End Date % RecoveryAN100 Mass 1999 05-Jul-99 31-Dec-99 96.7%AN100 Mass 2000 01-Jan-00 31-Dec-00 95.1%AN100 Mass 2001 01-Jan-01 31-Dec-01 95.1%AN100 Mass 2002 01-Jan-02 31-Dec-02 100.0%AN100 Mass 2003 01-Jan-03 31-Dec-03 100.0%
97.4%AN400 Mass 1999 05-Jul-99 31-Dec-99 90.0%AN400 Mass 2000 01-Jan-00 14-Dec-00 91.5%
90.8%SFS Mass 1999 01-Dec-99 31-Dec-99 96.8%SFS Mass 2000 01-Jan-00 14-Dec-00 96.8%SFS Mass 2001 18-Jan-01 30-Jan-01 100.0%
97.9%AN100 Chloride (Cl-) 1999 05-Jul-99 31-Dec-99 93.3%AN100 Chloride (Cl-) 2000 01-Jan-00 31-Dec-00 91.8%AN100 Chloride (Cl-) 2001 01-Jan-01 31-Dec-01 96.7%AN100 Chloride (Cl-) 2002 01-Jan-02 31-Dec-02 100.0%AN100 Chloride (Cl-) 2003 01-Jan-03 31-Dec-03 100.0%
96.4%AN400 Chloride (Cl-) 1999 05-Jul-99 31-Dec-99 100.0%AN400 Chloride (Cl-) 2000 01-Jan-00 14-Dec-00 94.9%
97.5%SFS Chloride (Cl-) 1999 01-Dec-99 31-Dec-99 96.8%SFS Chloride (Cl-) 2000 01-Jan-00 14-Dec-00 96.3%SFS Chloride (Cl-) 2001 18-Jan-01 30-Jan-01 100.0%
97.7%AN400 Denuded Cl- 1999 05-Jul-99 31-Dec-99 100.0%AN400 Denuded Cl- 2000 01-Jan-00 14-Dec-00 94.9%
97.5%AN100 Non-Volatilized Nitrate (NO3
-) 1999 05-Jul-99 31-Dec-99 93.3%AN100 Non-Volatilized Nitrate (NO3
-) 2000 01-Jan-00 31-Dec-00 91.8%AN100 Non-Volatilized Nitrate (NO3
-) 2001 01-Jan-01 31-Dec-01 96.7%AN100 Non-Volatilized Nitrate (NO3
-) 2002 01-Jan-02 31-Dec-02 100.0%AN100 Non-Volatilized Nitrate (NO3
-) 2003 01-Jan-03 31-Dec-03 100.0%96.4%
AN400 Non-Volatilized Nitrate (NO3-) 1999 05-Jul-99 31-Dec-99 100.0%
AN400 Non-Volatilized Nitrate (NO3-) 2000 01-Jan-00 14-Dec-00 94.9%
97.5%SFS Non-Volatilized Nitrate (NO3
-) 1999 01-Dec-99 31-Dec-99 96.8%SFS Non-Volatilized Nitrate (NO3
-) 2000 01-Jan-00 14-Dec-00 96.3%SFS Non-Volatilized Nitrate (NO3
-) 2001 18-Jan-01 30-Jan-01 100.0%97.7%
SFS Volatilized Nitrate (NO3-) 1999 01-Dec-99 31-Dec-99 96.8%
SFS Volatilized Nitrate (NO3-) 2000 01-Jan-00 14-Dec-00 96.3%
SFS Volatilized Nitrate (NO3-) 2001 18-Jan-01 30-Jan-01 100.0%
97.7%AN400 Denuded NO3
- 1999 05-Jul-99 31-Dec-99 100.0%AN400 Denuded NO3
- 2000 01-Jan-00 14-Dec-00 94.9%97.5%
AN400 Denuded Volatilized NO3- 1999 05-Jul-99 31-Dec-99 100.0%
AN400 Denuded Volatilized NO3- 2000 01-Jan-00 14-Dec-00 94.9%
97.5%
Average
Average
Average
Average
Average
Average
Average
Average
Average
Average
Average
Average
Average
32
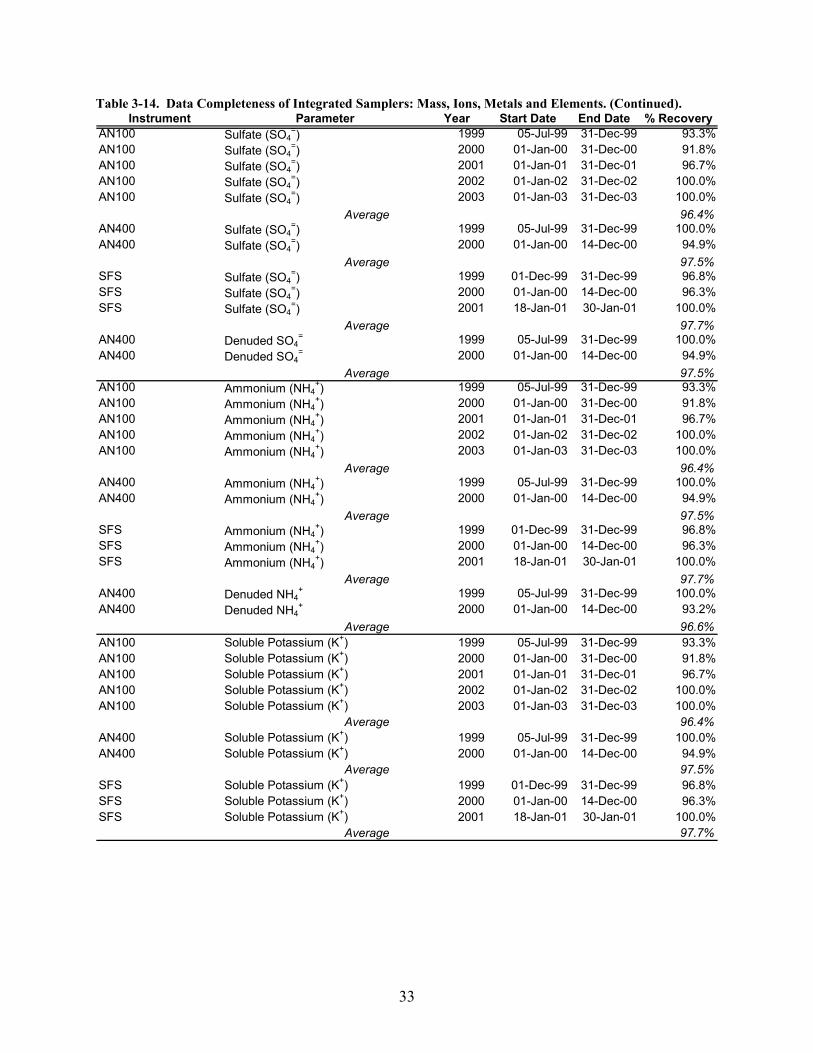
Table 3-14. Data Completeness of Integrated Samplers: Mass, Ions, Metals and Elements. (Continued). Instrument Parameter Year Start Date End Date % Recovery
AN100 Sulfate (SO4=) 1999 05-Jul-99 31-Dec-99 93.3%
AN100 Sulfate (SO4=) 2000 01-Jan-00 31-Dec-00 91.8%
AN100 Sulfate (SO4=) 2001 01-Jan-01 31-Dec-01 96.7%
AN100 Sulfate (SO4=) 2002 01-Jan-02 31-Dec-02 100.0%
AN100 Sulfate (SO4=) 2003 01-Jan-03 31-Dec-03 100.0%
96.4%AN400 Sulfate (SO4
=) 1999 05-Jul-99 31-Dec-99 100.0%AN400 Sulfate (SO4
=) 2000 01-Jan-00 14-Dec-00 94.9%97.5%
SFS Sulfate (SO4=) 1999 01-Dec-99 31-Dec-99 96.8%
SFS Sulfate (SO4=) 2000 01-Jan-00 14-Dec-00 96.3%
SFS Sulfate (SO4=) 2001 18-Jan-01 30-Jan-01 100.0%
97.7%AN400 Denuded SO4
= 1999 05-Jul-99 31-Dec-99 100.0%AN400 Denuded SO4
= 2000 01-Jan-00 14-Dec-00 94.9%97.5%
AN100 Ammonium (NH4+) 1999 05-Jul-99 31-Dec-99 93.3%
AN100 Ammonium (NH4+) 2000 01-Jan-00 31-Dec-00 91.8%
AN100 Ammonium (NH4+) 2001 01-Jan-01 31-Dec-01 96.7%
AN100 Ammonium (NH4+) 2002 01-Jan-02 31-Dec-02 100.0%
AN100 Ammonium (NH4+) 2003 01-Jan-03 31-Dec-03 100.0%
96.4%AN400 Ammonium (NH4
+) 1999 05-Jul-99 31-Dec-99 100.0%AN400 Ammonium (NH4
+) 2000 01-Jan-00 14-Dec-00 94.9%97.5%
SFS Ammonium (NH4+) 1999 01-Dec-99 31-Dec-99 96.8%
SFS Ammonium (NH4+) 2000 01-Jan-00 14-Dec-00 96.3%
SFS Ammonium (NH4+) 2001 18-Jan-01 30-Jan-01 100.0%
97.7%AN400 Denuded NH4
+ 1999 05-Jul-99 31-Dec-99 100.0%AN400 Denuded NH4
+ 2000 01-Jan-00 14-Dec-00 93.2%96.6%
AN100 Soluble Potassium (K+) 1999 05-Jul-99 31-Dec-99 93.3%AN100 Soluble Potassium (K+) 2000 01-Jan-00 31-Dec-00 91.8%AN100 Soluble Potassium (K+) 2001 01-Jan-01 31-Dec-01 96.7%AN100 Soluble Potassium (K+) 2002 01-Jan-02 31-Dec-02 100.0%AN100 Soluble Potassium (K+) 2003 01-Jan-03 31-Dec-03 100.0%
96.4%AN400 Soluble Potassium (K+) 1999 05-Jul-99 31-Dec-99 100.0%AN400 Soluble Potassium (K+) 2000 01-Jan-00 14-Dec-00 94.9%
97.5%SFS Soluble Potassium (K+) 1999 01-Dec-99 31-Dec-99 96.8%SFS Soluble Potassium (K+) 2000 01-Jan-00 14-Dec-00 96.3%SFS Soluble Potassium (K+) 2001 18-Jan-01 30-Jan-01 100.0%
97.7%
Average
Average
Average
Average
Average
Average
Average
Average
Average
Average
Average
33
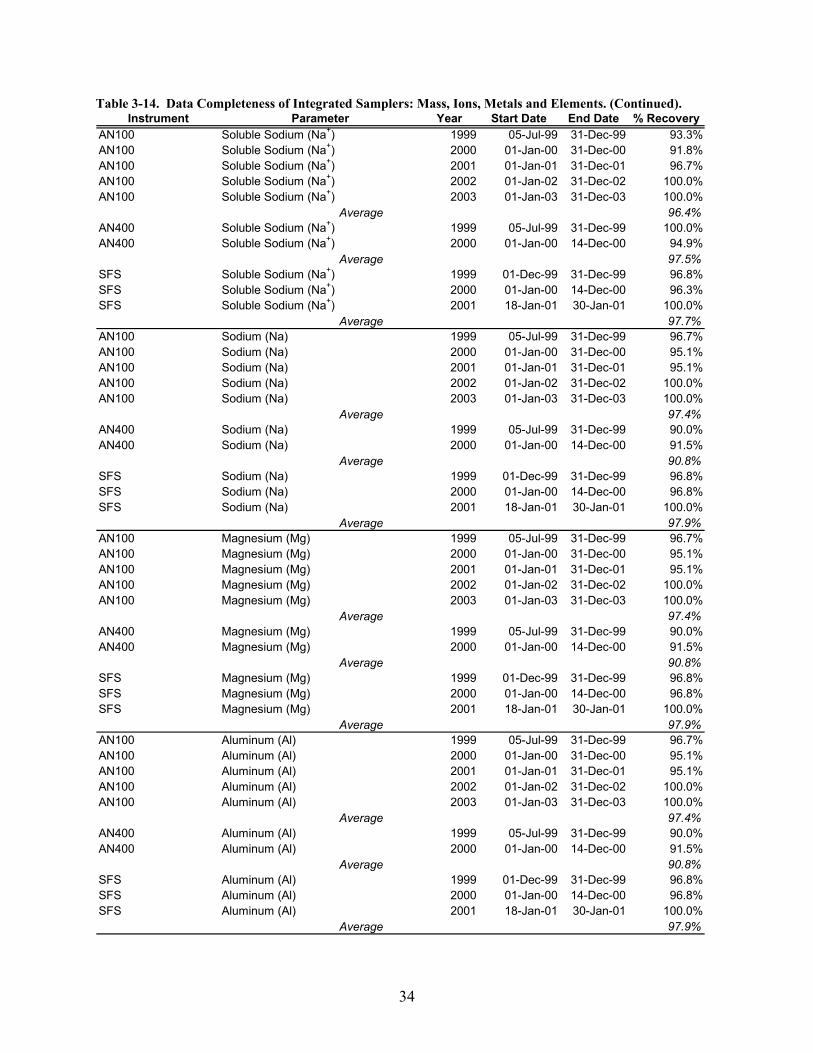
Table 3-14. Data Completeness of Integrated Samplers: Mass, Ions, Metals and Elements. (Continued). Instrument Parameter Year Start Date End Date % Recovery
AN100 Soluble Sodium (Na+) 1999 05-Jul-99 31-Dec-99 93.3%AN100 Soluble Sodium (Na+) 2000 01-Jan-00 31-Dec-00 91.8%AN100 Soluble Sodium (Na+) 2001 01-Jan-01 31-Dec-01 96.7%AN100 Soluble Sodium (Na+) 2002 01-Jan-02 31-Dec-02 100.0%AN100 Soluble Sodium (Na+) 2003 01-Jan-03 31-Dec-03 100.0%
96.4%AN400 Soluble Sodium (Na+) 1999 05-Jul-99 31-Dec-99 100.0%AN400 Soluble Sodium (Na+) 2000 01-Jan-00 14-Dec-00 94.9%
97.5%SFS Soluble Sodium (Na+) 1999 01-Dec-99 31-Dec-99 96.8%SFS Soluble Sodium (Na+) 2000 01-Jan-00 14-Dec-00 96.3%SFS Soluble Sodium (Na+) 2001 18-Jan-01 30-Jan-01 100.0%
97.7%AN100 Sodium (Na) 1999 05-Jul-99 31-Dec-99 96.7%AN100 Sodium (Na) 2000 01-Jan-00 31-Dec-00 95.1%AN100 Sodium (Na) 2001 01-Jan-01 31-Dec-01 95.1%AN100 Sodium (Na) 2002 01-Jan-02 31-Dec-02 100.0%AN100 Sodium (Na) 2003 01-Jan-03 31-Dec-03 100.0%
97.4%AN400 Sodium (Na) 1999 05-Jul-99 31-Dec-99 90.0%AN400 Sodium (Na) 2000 01-Jan-00 14-Dec-00 91.5%
90.8%SFS Sodium (Na) 1999 01-Dec-99 31-Dec-99 96.8%SFS Sodium (Na) 2000 01-Jan-00 14-Dec-00 96.8%SFS Sodium (Na) 2001 18-Jan-01 30-Jan-01 100.0%
97.9%AN100 Magnesium (Mg) 1999 05-Jul-99 31-Dec-99 96.7%AN100 Magnesium (Mg) 2000 01-Jan-00 31-Dec-00 95.1%AN100 Magnesium (Mg) 2001 01-Jan-01 31-Dec-01 95.1%AN100 Magnesium (Mg) 2002 01-Jan-02 31-Dec-02 100.0%AN100 Magnesium (Mg) 2003 01-Jan-03 31-Dec-03 100.0%
97.4%AN400 Magnesium (Mg) 1999 05-Jul-99 31-Dec-99 90.0%AN400 Magnesium (Mg) 2000 01-Jan-00 14-Dec-00 91.5%
90.8%SFS Magnesium (Mg) 1999 01-Dec-99 31-Dec-99 96.8%SFS Magnesium (Mg) 2000 01-Jan-00 14-Dec-00 96.8%SFS Magnesium (Mg) 2001 18-Jan-01 30-Jan-01 100.0%
97.9%AN100 Aluminum (Al) 1999 05-Jul-99 31-Dec-99 96.7%AN100 Aluminum (Al) 2000 01-Jan-00 31-Dec-00 95.1%AN100 Aluminum (Al) 2001 01-Jan-01 31-Dec-01 95.1%AN100 Aluminum (Al) 2002 01-Jan-02 31-Dec-02 100.0%AN100 Aluminum (Al) 2003 01-Jan-03 31-Dec-03 100.0%
97.4%AN400 Aluminum (Al) 1999 05-Jul-99 31-Dec-99 90.0%AN400 Aluminum (Al) 2000 01-Jan-00 14-Dec-00 91.5%
90.8%SFS Aluminum (Al) 1999 01-Dec-99 31-Dec-99 96.8%SFS Aluminum (Al) 2000 01-Jan-00 14-Dec-00 96.8%SFS Aluminum (Al) 2001 18-Jan-01 30-Jan-01 100.0%
97.9%
Average
Average
Average
Average
Average
Average
Average
Average
Average
Average
Average
Average
34
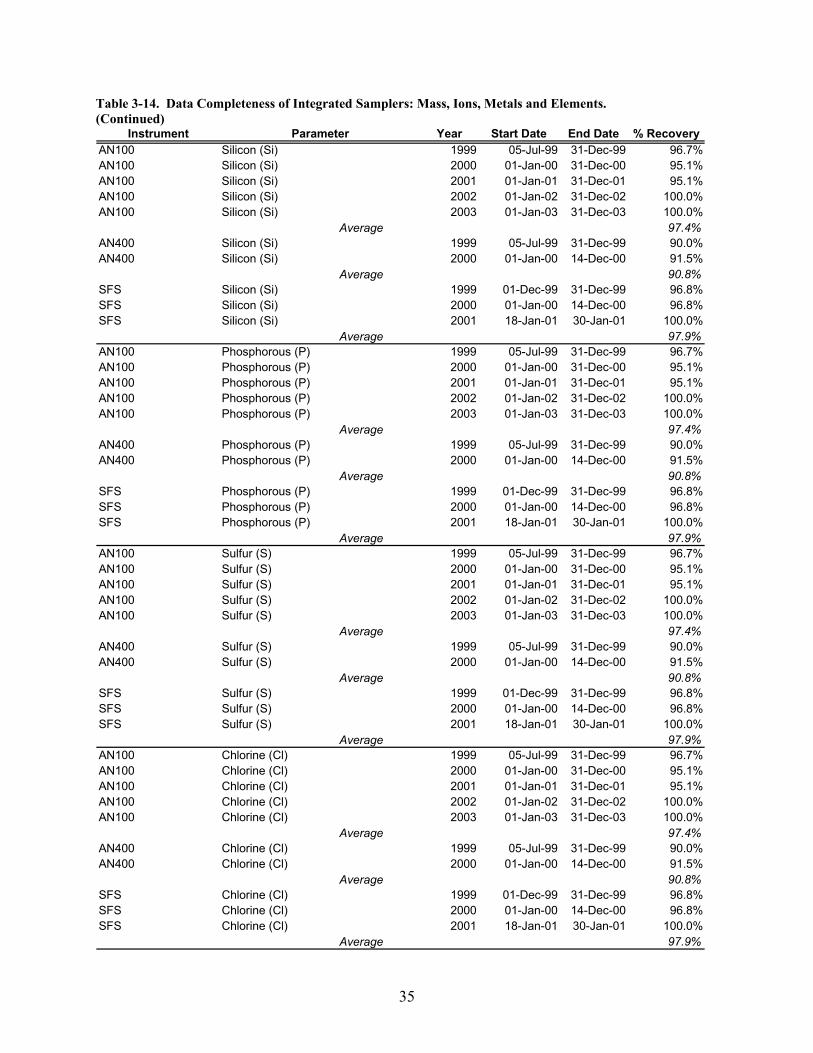
Table 3-14. Data Completeness of Integrated Samplers: Mass, Ions, Metals and Elements. (Continued)
Instrument Parameter Year Start Date End Date % RecoveryAN100 Silicon (Si) 1999 05-Jul-99 31-Dec-99 96.7%AN100 Silicon (Si) 2000 01-Jan-00 31-Dec-00 95.1%AN100 Silicon (Si) 2001 01-Jan-01 31-Dec-01 95.1%AN100 Silicon (Si) 2002 01-Jan-02 31-Dec-02 100.0%AN100 Silicon (Si) 2003 01-Jan-03 31-Dec-03 100.0%
97.4%AN400 Silicon (Si) 1999 05-Jul-99 31-Dec-99 90.0%AN400 Silicon (Si) 2000 01-Jan-00 14-Dec-00 91.5%
90.8%SFS Silicon (Si) 1999 01-Dec-99 31-Dec-99 96.8%SFS Silicon (Si) 2000 01-Jan-00 14-Dec-00 96.8%SFS Silicon (Si) 2001 18-Jan-01 30-Jan-01 100.0%
97.9%AN100 Phosphorous (P) 1999 05-Jul-99 31-Dec-99 96.7%AN100 Phosphorous (P) 2000 01-Jan-00 31-Dec-00 95.1%AN100 Phosphorous (P) 2001 01-Jan-01 31-Dec-01 95.1%AN100 Phosphorous (P) 2002 01-Jan-02 31-Dec-02 100.0%AN100 Phosphorous (P) 2003 01-Jan-03 31-Dec-03 100.0%
97.4%AN400 Phosphorous (P) 1999 05-Jul-99 31-Dec-99 90.0%AN400 Phosphorous (P) 2000 01-Jan-00 14-Dec-00 91.5%
90.8%SFS Phosphorous (P) 1999 01-Dec-99 31-Dec-99 96.8%SFS Phosphorous (P) 2000 01-Jan-00 14-Dec-00 96.8%SFS Phosphorous (P) 2001 18-Jan-01 30-Jan-01 100.0%
97.9%AN100 Sulfur (S) 1999 05-Jul-99 31-Dec-99 96.7%AN100 Sulfur (S) 2000 01-Jan-00 31-Dec-00 95.1%AN100 Sulfur (S) 2001 01-Jan-01 31-Dec-01 95.1%AN100 Sulfur (S) 2002 01-Jan-02 31-Dec-02 100.0%AN100 Sulfur (S) 2003 01-Jan-03 31-Dec-03 100.0%
97.4%AN400 Sulfur (S) 1999 05-Jul-99 31-Dec-99 90.0%AN400 Sulfur (S) 2000 01-Jan-00 14-Dec-00 91.5%
90.8%SFS Sulfur (S) 1999 01-Dec-99 31-Dec-99 96.8%SFS Sulfur (S) 2000 01-Jan-00 14-Dec-00 96.8%SFS Sulfur (S) 2001 18-Jan-01 30-Jan-01 100.0%
97.9%AN100 Chlorine (Cl) 1999 05-Jul-99 31-Dec-99 96.7%AN100 Chlorine (Cl) 2000 01-Jan-00 31-Dec-00 95.1%AN100 Chlorine (Cl) 2001 01-Jan-01 31-Dec-01 95.1%AN100 Chlorine (Cl) 2002 01-Jan-02 31-Dec-02 100.0%AN100 Chlorine (Cl) 2003 01-Jan-03 31-Dec-03 100.0%
97.4%AN400 Chlorine (Cl) 1999 05-Jul-99 31-Dec-99 90.0%AN400 Chlorine (Cl) 2000 01-Jan-00 14-Dec-00 91.5%
90.8%SFS Chlorine (Cl) 1999 01-Dec-99 31-Dec-99 96.8%SFS Chlorine (Cl) 2000 01-Jan-00 14-Dec-00 96.8%SFS Chlorine (Cl) 2001 18-Jan-01 30-Jan-01 100.0%
97.9%
Average
Average
Average
Average
Average
Average
Average
Average
Average
Average
Average
Average
35
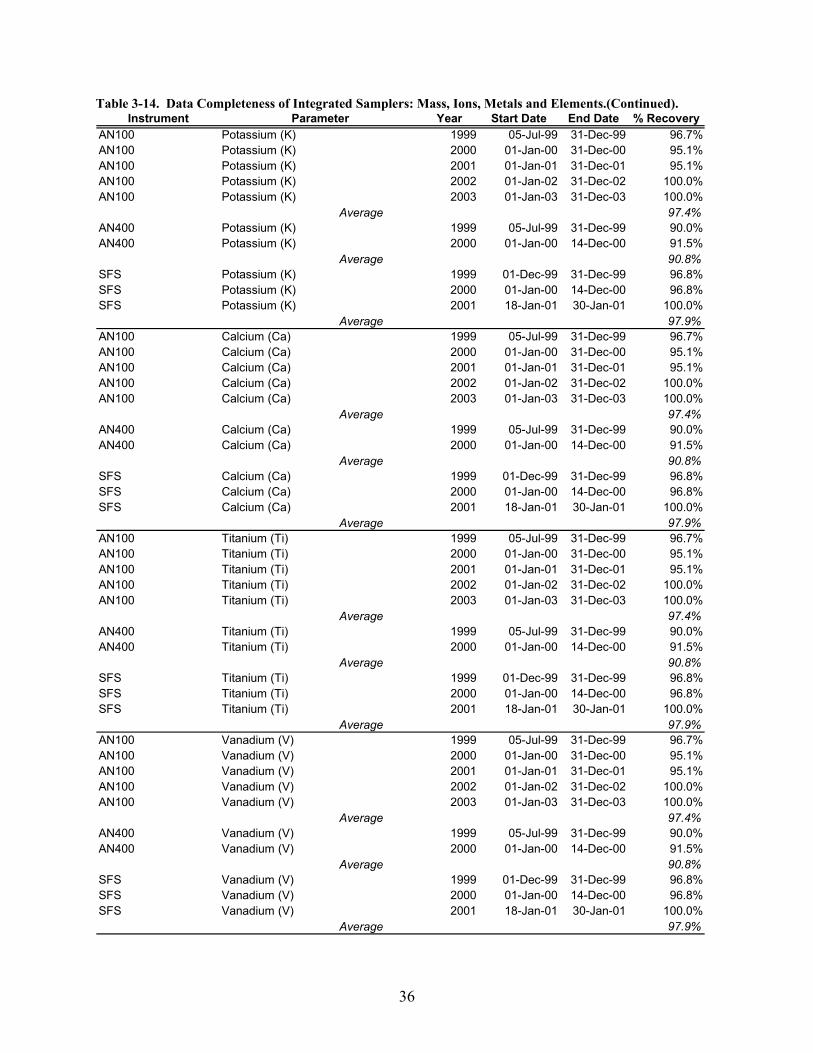
Table 3-14. Data Completeness of Integrated Samplers: Mass, Ions, Metals and Elements.(Continued). Instrument Parameter Year Start Date End Date % Recovery
AN100 Potassium (K) 1999 05-Jul-99 31-Dec-99 96.7%AN100 Potassium (K) 2000 01-Jan-00 31-Dec-00 95.1%AN100 Potassium (K) 2001 01-Jan-01 31-Dec-01 95.1%AN100 Potassium (K) 2002 01-Jan-02 31-Dec-02 100.0%AN100 Potassium (K) 2003 01-Jan-03 31-Dec-03 100.0%
97.4%AN400 Potassium (K) 1999 05-Jul-99 31-Dec-99 90.0%AN400 Potassium (K) 2000 01-Jan-00 14-Dec-00 91.5%
90.8%SFS Potassium (K) 1999 01-Dec-99 31-Dec-99 96.8%SFS Potassium (K) 2000 01-Jan-00 14-Dec-00 96.8%SFS Potassium (K) 2001 18-Jan-01 30-Jan-01 100.0%
97.9%AN100 Calcium (Ca) 1999 05-Jul-99 31-Dec-99 96.7%AN100 Calcium (Ca) 2000 01-Jan-00 31-Dec-00 95.1%AN100 Calcium (Ca) 2001 01-Jan-01 31-Dec-01 95.1%AN100 Calcium (Ca) 2002 01-Jan-02 31-Dec-02 100.0%AN100 Calcium (Ca) 2003 01-Jan-03 31-Dec-03 100.0%
97.4%AN400 Calcium (Ca) 1999 05-Jul-99 31-Dec-99 90.0%AN400 Calcium (Ca) 2000 01-Jan-00 14-Dec-00 91.5%
90.8%SFS Calcium (Ca) 1999 01-Dec-99 31-Dec-99 96.8%SFS Calcium (Ca) 2000 01-Jan-00 14-Dec-00 96.8%SFS Calcium (Ca) 2001 18-Jan-01 30-Jan-01 100.0%
97.9%AN100 Titanium (Ti) 1999 05-Jul-99 31-Dec-99 96.7%AN100 Titanium (Ti) 2000 01-Jan-00 31-Dec-00 95.1%AN100 Titanium (Ti) 2001 01-Jan-01 31-Dec-01 95.1%AN100 Titanium (Ti) 2002 01-Jan-02 31-Dec-02 100.0%AN100 Titanium (Ti) 2003 01-Jan-03 31-Dec-03 100.0%
97.4%AN400 Titanium (Ti) 1999 05-Jul-99 31-Dec-99 90.0%AN400 Titanium (Ti) 2000 01-Jan-00 14-Dec-00 91.5%
90.8%SFS Titanium (Ti) 1999 01-Dec-99 31-Dec-99 96.8%SFS Titanium (Ti) 2000 01-Jan-00 14-Dec-00 96.8%SFS Titanium (Ti) 2001 18-Jan-01 30-Jan-01 100.0%
97.9%AN100 Vanadium (V) 1999 05-Jul-99 31-Dec-99 96.7%AN100 Vanadium (V) 2000 01-Jan-00 31-Dec-00 95.1%AN100 Vanadium (V) 2001 01-Jan-01 31-Dec-01 95.1%AN100 Vanadium (V) 2002 01-Jan-02 31-Dec-02 100.0%AN100 Vanadium (V) 2003 01-Jan-03 31-Dec-03 100.0%
97.4%AN400 Vanadium (V) 1999 05-Jul-99 31-Dec-99 90.0%AN400 Vanadium (V) 2000 01-Jan-00 14-Dec-00 91.5%
90.8%SFS Vanadium (V) 1999 01-Dec-99 31-Dec-99 96.8%SFS Vanadium (V) 2000 01-Jan-00 14-Dec-00 96.8%SFS Vanadium (V) 2001 18-Jan-01 30-Jan-01 100.0%
97.9%
Average
Average
Average
Average
Average
Average
Average
Average
Average
Average
Average
Average
36
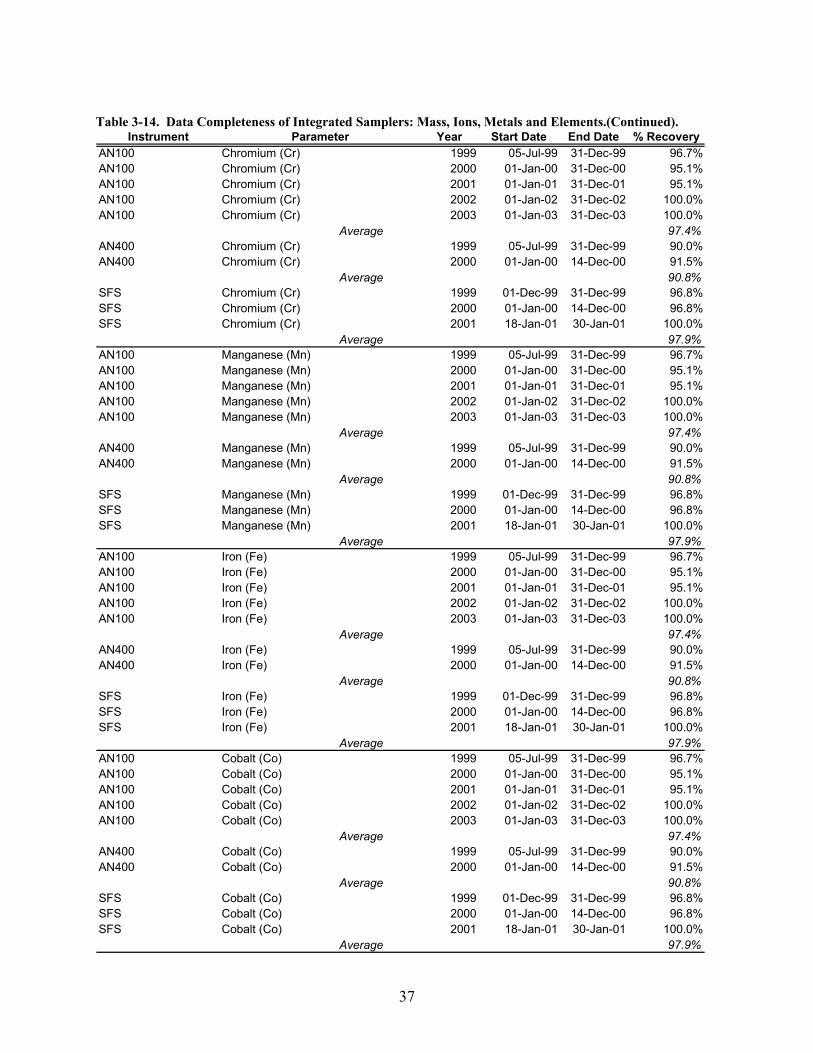
Table 3-14. Data Completeness of Integrated Samplers: Mass, Ions, Metals and Elements.(Continued).
Instrument Parameter Year Start Date End Date % RecoveryAN100 Chromium (Cr) 1999 05-Jul-99 31-Dec-99 96.7%AN100 Chromium (Cr) 2000 01-Jan-00 31-Dec-00 95.1%AN100 Chromium (Cr) 2001 01-Jan-01 31-Dec-01 95.1%AN100 Chromium (Cr) 2002 01-Jan-02 31-Dec-02 100.0%AN100 Chromium (Cr) 2003 01-Jan-03 31-Dec-03 100.0%
97.4%AN400 Chromium (Cr) 1999 05-Jul-99 31-Dec-99 90.0%AN400 Chromium (Cr) 2000 01-Jan-00 14-Dec-00 91.5%
90.8%SFS Chromium (Cr) 1999 01-Dec-99 31-Dec-99 96.8%SFS Chromium (Cr) 2000 01-Jan-00 14-Dec-00 96.8%SFS Chromium (Cr) 2001 18-Jan-01 30-Jan-01 100.0%
97.9%AN100 Manganese (Mn) 1999 05-Jul-99 31-Dec-99 96.7%AN100 Manganese (Mn) 2000 01-Jan-00 31-Dec-00 95.1%AN100 Manganese (Mn) 2001 01-Jan-01 31-Dec-01 95.1%AN100 Manganese (Mn) 2002 01-Jan-02 31-Dec-02 100.0%AN100 Manganese (Mn) 2003 01-Jan-03 31-Dec-03 100.0%
97.4%AN400 Manganese (Mn) 1999 05-Jul-99 31-Dec-99 90.0%AN400 Manganese (Mn) 2000 01-Jan-00 14-Dec-00 91.5%
90.8%SFS Manganese (Mn) 1999 01-Dec-99 31-Dec-99 96.8%SFS Manganese (Mn) 2000 01-Jan-00 14-Dec-00 96.8%SFS Manganese (Mn) 2001 18-Jan-01 30-Jan-01 100.0%
97.9%AN100 Iron (Fe) 1999 05-Jul-99 31-Dec-99 96.7%AN100 Iron (Fe) 2000 01-Jan-00 31-Dec-00 95.1%AN100 Iron (Fe) 2001 01-Jan-01 31-Dec-01 95.1%AN100 Iron (Fe) 2002 01-Jan-02 31-Dec-02 100.0%AN100 Iron (Fe) 2003 01-Jan-03 31-Dec-03 100.0%
97.4%AN400 Iron (Fe) 1999 05-Jul-99 31-Dec-99 90.0%AN400 Iron (Fe) 2000 01-Jan-00 14-Dec-00 91.5%
90.8%SFS Iron (Fe) 1999 01-Dec-99 31-Dec-99 96.8%SFS Iron (Fe) 2000 01-Jan-00 14-Dec-00 96.8%SFS Iron (Fe) 2001 18-Jan-01 30-Jan-01 100.0%
97.9%AN100 Cobalt (Co) 1999 05-Jul-99 31-Dec-99 96.7%AN100 Cobalt (Co) 2000 01-Jan-00 31-Dec-00 95.1%AN100 Cobalt (Co) 2001 01-Jan-01 31-Dec-01 95.1%AN100 Cobalt (Co) 2002 01-Jan-02 31-Dec-02 100.0%AN100 Cobalt (Co) 2003 01-Jan-03 31-Dec-03 100.0%
97.4%AN400 Cobalt (Co) 1999 05-Jul-99 31-Dec-99 90.0%AN400 Cobalt (Co) 2000 01-Jan-00 14-Dec-00 91.5%
90.8%SFS Cobalt (Co) 1999 01-Dec-99 31-Dec-99 96.8%SFS Cobalt (Co) 2000 01-Jan-00 14-Dec-00 96.8%SFS Cobalt (Co) 2001 18-Jan-01 30-Jan-01 100.0%
97.9%
Average
Average
Average
Average
Average
Average
Average
Average
Average
Average
Average
Average
37

Table 3-14. Data Completeness of Integrated Samplers: Mass, Ions, Metals and Elements. (Continued) Instrument Parameter Year Start Date End Date % Recovery
AN100 Nickel (Ni) 1999 05-Jul-99 31-Dec-99 96.7%AN100 Nickel (Ni) 2000 01-Jan-00 31-Dec-00 95.1%AN100 Nickel (Ni) 2001 01-Jan-01 31-Dec-01 95.1%AN100 Nickel (Ni) 2002 01-Jan-02 31-Dec-02 100.0%AN100 Nickel (Ni) 2003 01-Jan-03 31-Dec-03 100.0%
97.4%AN400 Nickel (Ni) 1999 05-Jul-99 31-Dec-99 90.0%AN400 Nickel (Ni) 2000 01-Jan-00 14-Dec-00 91.5%
90.8%SFS Nickel (Ni) 1999 01-Dec-99 31-Dec-99 96.8%SFS Nickel (Ni) 2000 01-Jan-00 14-Dec-00 96.8%SFS Nickel (Ni) 2001 18-Jan-01 30-Jan-01 100.0%
97.9%AN100 Copper (Cu) 1999 05-Jul-99 31-Dec-99 96.7%AN100 Copper (Cu) 2000 01-Jan-00 31-Dec-00 95.1%AN100 Copper (Cu) 2001 01-Jan-01 31-Dec-01 95.1%AN100 Copper (Cu) 2002 01-Jan-02 31-Dec-02 100.0%AN100 Copper (Cu) 2003 01-Jan-03 31-Dec-03 100.0%
97.4%AN400 Copper (Cu) 1999 05-Jul-99 31-Dec-99 90.0%AN400 Copper (Cu) 2000 01-Jan-00 14-Dec-00 91.5%
90.8%SFS Copper (Cu) 1999 01-Dec-99 31-Dec-99 96.8%SFS Copper (Cu) 2000 01-Jan-00 14-Dec-00 96.8%SFS Copper (Cu) 2001 18-Jan-01 30-Jan-01 100.0%
97.9%AN100 Zinc (Zn) 1999 05-Jul-99 31-Dec-99 96.7%AN100 Zinc (Zn) 2000 01-Jan-00 31-Dec-00 95.1%AN100 Zinc (Zn) 2001 01-Jan-01 31-Dec-01 95.1%AN100 Zinc (Zn) 2002 01-Jan-02 31-Dec-02 100.0%AN100 Zinc (Zn) 2003 01-Jan-03 31-Dec-03 100.0%
97.4%AN400 Zinc (Zn) 1999 05-Jul-99 31-Dec-99 90.0%AN400 Zinc (Zn) 2000 01-Jan-00 14-Dec-00 91.5%
90.8%SFS Zinc (Zn) 1999 01-Dec-99 31-Dec-99 96.8%SFS Zinc (Zn) 2000 01-Jan-00 14-Dec-00 96.8%SFS Zinc (Zn) 2001 18-Jan-01 30-Jan-01 100.0%
97.9%AN100 Gallium (Ga) 1999 05-Jul-99 31-Dec-99 96.7%AN100 Gallium (Ga) 2000 01-Jan-00 31-Dec-00 95.1%AN100 Gallium (Ga) 2001 01-Jan-01 31-Dec-01 95.1%AN100 Gallium (Ga) 2002 01-Jan-02 31-Dec-02 100.0%AN100 Gallium (Ga) 2003 01-Jan-03 31-Dec-03 100.0%
97.4%AN400 Gallium (Ga) 1999 05-Jul-99 31-Dec-99 90.0%AN400 Gallium (Ga) 2000 01-Jan-00 14-Dec-00 91.5%
90.8%SFS Gallium (Ga) 1999 01-Dec-99 31-Dec-99 96.8%SFS Gallium (Ga) 2000 01-Jan-00 14-Dec-00 96.8%SFS Gallium (Ga) 2001 18-Jan-01 30-Jan-01 100.0%
97.9%
Average
Average
Average
Average
Average
Average
Average
Average
Average
Average
Average
Average
38

Table 3-14. Data Completeness of Integrated Samplers: Mass, Ions, Metals and Elements. (Continued) Instrument Parameter Year Start Date End Date % Recovery
AN100 Arsenic (As) 1999 05-Jul-99 31-Dec-99 96.7%AN100 Arsenic (As) 2000 01-Jan-00 31-Dec-00 95.1%AN100 Arsenic (As) 2001 01-Jan-01 31-Dec-01 95.1%AN100 Arsenic (As) 2002 01-Jan-02 31-Dec-02 100.0%AN100 Arsenic (As) 2003 01-Jan-03 31-Dec-03 100.0%
97.4%AN400 Arsenic (As) 1999 05-Jul-99 31-Dec-99 90.0%AN400 Arsenic (As) 2000 01-Jan-00 14-Dec-00 91.5%
90.8%SFS Arsenic (As) 1999 01-Dec-99 31-Dec-99 96.8%SFS Arsenic (As) 2000 01-Jan-00 14-Dec-00 96.8%SFS Arsenic (As) 2001 18-Jan-01 30-Jan-01 100.0%
97.9%AN100 Selenium (Se) 1999 05-Jul-99 31-Dec-99 96.7%AN100 Selenium (Se) 2000 01-Jan-00 31-Dec-00 95.1%AN100 Selenium (Se) 2001 01-Jan-01 31-Dec-01 95.1%AN100 Selenium (Se) 2002 01-Jan-02 31-Dec-02 100.0%AN100 Selenium (Se) 2003 01-Jan-03 31-Dec-03 100.0%
97.4%AN400 Selenium (Se) 1999 05-Jul-99 31-Dec-99 90.0%AN400 Selenium (Se) 2000 01-Jan-00 14-Dec-00 91.5%
90.8%SFS Selenium (Se) 1999 01-Dec-99 31-Dec-99 96.8%SFS Selenium (Se) 2000 01-Jan-00 14-Dec-00 96.8%SFS Selenium (Se) 2001 18-Jan-01 30-Jan-01 100.0%
97.9%AN100 Bromine (Br) 1999 05-Jul-99 31-Dec-99 96.7%AN100 Bromine (Br) 2000 01-Jan-00 31-Dec-00 95.1%AN100 Bromine (Br) 2001 01-Jan-01 31-Dec-01 95.1%AN100 Bromine (Br) 2002 01-Jan-02 31-Dec-02 100.0%AN100 Bromine (Br) 2003 01-Jan-03 31-Dec-03 100.0%
97.4%AN400 Bromine (Br) 1999 05-Jul-99 31-Dec-99 90.0%AN400 Bromine (Br) 2000 01-Jan-00 14-Dec-00 91.5%
90.8%SFS Bromine (Br) 1999 01-Dec-99 31-Dec-99 96.8%SFS Bromine (Br) 2000 01-Jan-00 14-Dec-00 96.8%SFS Bromine (Br) 2001 18-Jan-01 30-Jan-01 100.0%
97.9%AN100 Rubidium (Rb) 1999 05-Jul-99 31-Dec-99 96.7%AN100 Rubidium (Rb) 2000 01-Jan-00 31-Dec-00 95.1%AN100 Rubidium (Rb) 2001 01-Jan-01 31-Dec-01 95.1%AN100 Rubidium (Rb) 2002 01-Jan-02 31-Dec-02 100.0%AN100 Rubidium (Rb) 2003 01-Jan-03 31-Dec-03 100.0%
97.4%AN400 Rubidium (Rb) 1999 05-Jul-99 31-Dec-99 90.0%AN400 Rubidium (Rb) 2000 01-Jan-00 14-Dec-00 91.5%
90.8%SFS Rubidium (Rb) 1999 01-Dec-99 31-Dec-99 96.8%SFS Rubidium (Rb) 2000 01-Jan-00 14-Dec-00 96.8%SFS Rubidium (Rb) 2001 18-Jan-01 30-Jan-01 100.0%
97.9%
Average
Average
Average
Average
Average
Average
Average
Average
Average
Average
Average
Average
39

Table 3-14. Data Completeness of Integrated Samplers: Mass, Ions, Metals and Elements. (Continued). Instrument Parameter Year Start Date End Date % Recovery
AN100 Strontium (Sr) 1999 05-Jul-99 31-Dec-99 96.7%AN100 Strontium (Sr) 2000 01-Jan-00 31-Dec-00 95.1%AN100 Strontium (Sr) 2001 01-Jan-01 31-Dec-01 95.1%AN100 Strontium (Sr) 2002 01-Jan-02 31-Dec-02 100.0%AN100 Strontium (Sr) 2003 01-Jan-03 31-Dec-03 100.0%
97.4%AN400 Strontium (Sr) 1999 05-Jul-99 31-Dec-99 90.0%AN400 Strontium (Sr) 2000 01-Jan-00 14-Dec-00 91.5%
90.8%SFS Strontium (Sr) 1999 01-Dec-99 31-Dec-99 96.8%SFS Strontium (Sr) 2000 01-Jan-00 14-Dec-00 96.8%SFS Strontium (Sr) 2001 18-Jan-01 30-Jan-01 100.0%
97.9%AN100 Yttrium (Y) 1999 05-Jul-99 31-Dec-99 96.7%AN100 Yttrium (Y) 2000 01-Jan-00 31-Dec-00 95.1%AN100 Yttrium (Y) 2001 01-Jan-01 31-Dec-01 95.1%AN100 Yttrium (Y) 2002 01-Jan-02 31-Dec-02 100.0%AN100 Yttrium (Y) 2003 01-Jan-03 31-Dec-03 100.0%
97.4%AN400 Yttrium (Y) 1999 05-Jul-99 31-Dec-99 90.0%AN400 Yttrium (Y) 2000 01-Jan-00 14-Dec-00 91.5%
90.8%SFS Yttrium (Y) 1999 01-Dec-99 31-Dec-99 96.8%SFS Yttrium (Y) 2000 01-Jan-00 14-Dec-00 96.8%SFS Yttrium (Y) 2001 18-Jan-01 30-Jan-01 100.0%
97.9%AN100 Zirconium (Zr) 1999 05-Jul-99 31-Dec-99 96.7%AN100 Zirconium (Zr) 2000 01-Jan-00 31-Dec-00 95.1%AN100 Zirconium (Zr) 2001 01-Jan-01 31-Dec-01 95.1%AN100 Zirconium (Zr) 2002 01-Jan-02 31-Dec-02 100.0%AN100 Zirconium (Zr) 2003 01-Jan-03 31-Dec-03 100.0%
97.4%AN400 Zirconium (Zr) 1999 05-Jul-99 31-Dec-99 90.0%AN400 Zirconium (Zr) 2000 01-Jan-00 14-Dec-00 91.5%
90.8%SFS Zirconium (Zr) 1999 01-Dec-99 31-Dec-99 96.8%SFS Zirconium (Zr) 2000 01-Jan-00 14-Dec-00 96.8%SFS Zirconium (Zr) 2001 18-Jan-01 30-Jan-01 100.0%
97.9%AN100 Molybdenum (Mo) 1999 05-Jul-99 31-Dec-99 96.7%AN100 Molybdenum (Mo) 2000 01-Jan-00 31-Dec-00 95.1%AN100 Molybdenum (Mo) 2001 01-Jan-01 31-Dec-01 95.1%AN100 Molybdenum (Mo) 2002 01-Jan-02 31-Dec-02 100.0%AN100 Molybdenum (Mo) 2003 01-Jan-03 31-Dec-03 100.0%
97.4%AN400 Molybdenum (Mo) 1999 05-Jul-99 31-Dec-99 90.0%AN400 Molybdenum (Mo) 2000 01-Jan-00 14-Dec-00 91.5%
90.8%SFS Molybdenum (Mo) 1999 01-Dec-99 31-Dec-99 96.8%SFS Molybdenum (Mo) 2000 01-Jan-00 14-Dec-00 96.8%SFS Molybdenum (Mo) 2001 18-Jan-01 30-Jan-01 100.0%
97.9%
Average
Average
Average
Average
Average
Average
Average
Average
Average
Average
Average
Average
40

Table 3-14. Data Completeness of Integrated Samplers: Mass, Ions, Metals and Elements. (Continued) Instrument Parameter Year Start Date End Date % Recovery
AN100 Palladium (Pd) 1999 05-Jul-99 31-Dec-99 96.7%AN100 Palladium (Pd) 2000 01-Jan-00 31-Dec-00 95.1%AN100 Palladium (Pd) 2001 01-Jan-01 31-Dec-01 95.1%AN100 Palladium (Pd) 2002 01-Jan-02 31-Dec-02 100.0%AN100 Palladium (Pd) 2003 01-Jan-03 31-Dec-03 100.0%
97.4%AN400 Palladium (Pd) 1999 05-Jul-99 31-Dec-99 90.0%AN400 Palladium (Pd) 2000 01-Jan-00 14-Dec-00 91.5%
90.8%SFS Palladium (Pd) 1999 01-Dec-99 31-Dec-99 96.8%SFS Palladium (Pd) 2000 01-Jan-00 14-Dec-00 96.8%SFS Palladium (Pd) 2001 18-Jan-01 30-Jan-01 100.0%
97.9%AN100 Silver (Ag) 1999 05-Jul-99 31-Dec-99 96.7%AN100 Silver (Ag) 2000 01-Jan-00 31-Dec-00 95.1%AN100 Silver (Ag) 2001 01-Jan-01 31-Dec-01 95.1%AN100 Silver (Ag) 2002 01-Jan-02 31-Dec-02 100.0%AN100 Silver (Ag) 2003 01-Jan-03 31-Dec-03 100.0%
97.4%AN400 Silver (Ag) 1999 05-Jul-99 31-Dec-99 90.0%AN400 Silver (Ag) 2000 01-Jan-00 14-Dec-00 91.5%
90.8%SFS Silver (Ag) 1999 01-Dec-99 31-Dec-99 96.8%SFS Silver (Ag) 2000 01-Jan-00 14-Dec-00 96.8%SFS Silver (Ag) 2001 18-Jan-01 30-Jan-01 100.0%
97.9%AN100 Cadmium (Cd) 1999 05-Jul-99 31-Dec-99 96.7%AN100 Cadmium (Cd) 2000 01-Jan-00 31-Dec-00 95.1%AN100 Cadmium (Cd) 2001 01-Jan-01 31-Dec-01 95.1%AN100 Cadmium (Cd) 2002 01-Jan-02 31-Dec-02 100.0%AN100 Cadmium (Cd) 2003 01-Jan-03 31-Dec-03 100.0%
97.4%AN400 Cadmium (Cd) 1999 05-Jul-99 31-Dec-99 90.0%AN400 Cadmium (Cd) 2000 01-Jan-00 14-Dec-00 91.5%
90.8%SFS Cadmium (Cd) 1999 01-Dec-99 31-Dec-99 96.8%SFS Cadmium (Cd) 2000 01-Jan-00 14-Dec-00 96.8%SFS Cadmium (Cd) 2001 18-Jan-01 30-Jan-01 100.0%
97.9%AN100 Indium (In) 1999 05-Jul-99 31-Dec-99 96.7%AN100 Indium (In) 2000 01-Jan-00 31-Dec-00 95.1%AN100 Indium (In) 2001 01-Jan-01 31-Dec-01 95.1%AN100 Indium (In) 2002 01-Jan-02 31-Dec-02 100.0%AN100 Indium (In) 2003 01-Jan-03 31-Dec-03 100.0%
97.4%AN400 Indium (In) 1999 05-Jul-99 31-Dec-99 90.0%AN400 Indium (In) 2000 01-Jan-00 14-Dec-00 91.5%
90.8%SFS Indium (In) 1999 01-Dec-99 31-Dec-99 96.8%SFS Indium (In) 2000 01-Jan-00 14-Dec-00 96.8%SFS Indium (In) 2001 18-Jan-01 30-Jan-01 100.0%
97.9%
Average
Average
Average
Average
Average
Average
Average
Average
Average
Average
Average
Average
41

Table 3-14. Data Completeness of Integrated Samplers: Mass, Ions, Metals and Elements. (Continued). Instrument Parameter Year Start Date End Date % Recovery
AN100 Tin (Sn) 1999 05-Jul-99 31-Dec-99 96.7%AN100 Tin (Sn) 2000 01-Jan-00 31-Dec-00 95.1%AN100 Tin (Sn) 2001 01-Jan-01 31-Dec-01 95.1%AN100 Tin (Sn) 2002 01-Jan-02 31-Dec-02 100.0%AN100 Tin (Sn) 2003 01-Jan-03 31-Dec-03 100.0%
97.4%AN400 Tin (Sn) 1999 05-Jul-99 31-Dec-99 90.0%AN400 Tin (Sn) 2000 01-Jan-00 14-Dec-00 91.5%
90.8%SFS Tin (Sn) 1999 01-Dec-99 31-Dec-99 96.8%SFS Tin (Sn) 2000 01-Jan-00 14-Dec-00 96.8%SFS Tin (Sn) 2001 18-Jan-01 30-Jan-01 100.0%
97.9%AN100 Antimony (Sb) 1999 05-Jul-99 31-Dec-99 96.7%AN100 Antimony (Sb) 2000 01-Jan-00 31-Dec-00 95.1%AN100 Antimony (Sb) 2001 01-Jan-01 31-Dec-01 95.1%AN100 Antimony (Sb) 2002 01-Jan-02 31-Dec-02 100.0%AN100 Antimony (Sb) 2003 01-Jan-03 31-Dec-03 100.0%
97.4%AN400 Antimony (Sb) 1999 05-Jul-99 31-Dec-99 90.0%AN400 Antimony (Sb) 2000 01-Jan-00 14-Dec-00 91.5%
90.8%SFS Antimony (Sb) 1999 01-Dec-99 31-Dec-99 96.8%SFS Antimony (Sb) 2000 01-Jan-00 14-Dec-00 96.8%SFS Antimony (Sb) 2001 18-Jan-01 30-Jan-01 100.0%
97.9%AN100 Barium (Ba) 1999 05-Jul-99 31-Dec-99 96.7%AN100 Barium (Ba) 2000 01-Jan-00 31-Dec-00 95.1%AN100 Barium (Ba) 2001 01-Jan-01 31-Dec-01 95.1%AN100 Barium (Ba) 2002 01-Jan-02 31-Dec-02 100.0%AN100 Barium (Ba) 2003 01-Jan-03 31-Dec-03 100.0%
97.4%AN400 Barium (Ba) 1999 05-Jul-99 31-Dec-99 90.0%AN400 Barium (Ba) 2000 01-Jan-00 14-Dec-00 91.5%
90.8%SFS Barium (Ba) 1999 01-Dec-99 31-Dec-99 96.8%SFS Barium (Ba) 2000 01-Jan-00 14-Dec-00 96.8%SFS Barium (Ba) 2001 18-Jan-01 30-Jan-01 100.0%
97.9%AN100 Lanthanum (La) 1999 05-Jul-99 31-Dec-99 96.7%AN100 Lanthanum (La) 2000 01-Jan-00 31-Dec-00 95.1%AN100 Lanthanum (La) 2001 01-Jan-01 31-Dec-01 95.1%AN100 Lanthanum (La) 2002 01-Jan-02 31-Dec-02 100.0%AN100 Lanthanum (La) 2003 01-Jan-03 31-Dec-03 100.0%
97.4%AN400 Lanthanum (La) 1999 05-Jul-99 31-Dec-99 90.0%AN400 Lanthanum (La) 2000 01-Jan-00 14-Dec-00 91.5%
90.8%SFS Lanthanum (La) 1999 01-Dec-99 31-Dec-99 96.8%SFS Lanthanum (La) 2000 01-Jan-00 14-Dec-00 96.8%SFS Lanthanum (La) 2001 18-Jan-01 30-Jan-01 100.0%
97.9%
Average
Average
Average
Average
Average
Average
Average
Average
Average
Average
Average
Average
42

Table 3-14. Data Completeness of Integrated Samplers: Mass, Ions, Metals and Elements. (Continued) Instrument Parameter Year Start Date End Date % Recovery
AN100 Gold (Au) 1999 05-Jul-99 31-Dec-99 96.7%AN100 Gold (Au) 2000 01-Jan-00 31-Dec-00 95.1%AN100 Gold (Au) 2001 01-Jan-01 31-Dec-01 95.1%AN100 Gold (Au) 2002 01-Jan-02 31-Dec-02 100.0%AN100 Gold (Au) 2003 01-Jan-03 31-Dec-03 100.0%
97.4%AN400 Gold (Au) 1999 05-Jul-99 31-Dec-99 90.0%AN400 Gold (Au) 2000 01-Jan-00 14-Dec-00 91.5%
90.8%SFS Gold (Au) 1999 01-Dec-99 31-Dec-99 96.8%SFS Gold (Au) 2000 01-Jan-00 14-Dec-00 96.8%SFS Gold (Au) 2001 18-Jan-01 30-Jan-01 100.0%
97.9%AN100 Mercury (Hg) 1999 05-Jul-99 31-Dec-99 96.7%AN100 Mercury (Hg) 2000 01-Jan-00 31-Dec-00 95.1%AN100 Mercury (Hg) 2001 01-Jan-01 31-Dec-01 95.1%AN100 Mercury (Hg) 2002 01-Jan-02 31-Dec-02 100.0%AN100 Mercury (Hg) 2003 01-Jan-03 31-Dec-03 100.0%
97.4%AN400 Mercury (Hg) 1999 05-Jul-99 31-Dec-99 90.0%AN400 Mercury (Hg) 2000 01-Jan-00 14-Dec-00 91.5%
90.8%SFS Mercury (Hg) 1999 01-Dec-99 31-Dec-99 96.8%SFS Mercury (Hg) 2000 01-Jan-00 14-Dec-00 96.8%SFS Mercury (Hg) 2001 18-Jan-01 30-Jan-01 100.0%
97.9%AN100 Thallium (Tl) 1999 05-Jul-99 31-Dec-99 96.7%AN100 Thallium (Tl) 2000 01-Jan-00 31-Dec-00 95.1%AN100 Thallium (Tl) 2001 01-Jan-01 31-Dec-01 95.1%AN100 Thallium (Tl) 2002 01-Jan-02 31-Dec-02 100.0%AN100 Thallium (Tl) 2003 01-Jan-03 31-Dec-03 100.0%
97.4%AN400 Thallium (Tl) 1999 05-Jul-99 31-Dec-99 90.0%AN400 Thallium (Tl) 2000 01-Jan-00 14-Dec-00 91.5%
90.8%SFS Thallium (Tl) 1999 01-Dec-99 31-Dec-99 96.8%SFS Thallium (Tl) 2000 01-Jan-00 14-Dec-00 96.8%SFS Thallium (Tl) 2001 18-Jan-01 30-Jan-01 100.0%
97.9%AN100 Lead (Pb) 1999 05-Jul-99 31-Dec-99 96.7%AN100 Lead (Pb) 2000 01-Jan-00 31-Dec-00 95.1%AN100 Lead (Pb) 2001 01-Jan-01 31-Dec-01 95.1%AN100 Lead (Pb) 2002 01-Jan-02 31-Dec-02 100.0%AN100 Lead (Pb) 2003 01-Jan-03 31-Dec-03 100.0%
97.4%AN400 Lead (Pb) 1999 05-Jul-99 31-Dec-99 90.0%AN400 Lead (Pb) 2000 01-Jan-00 14-Dec-00 91.5%
90.8%SFS Lead (Pb) 1999 01-Dec-99 31-Dec-99 96.8%SFS Lead (Pb) 2000 01-Jan-00 14-Dec-00 96.8%SFS Lead (Pb) 2001 18-Jan-01 30-Jan-01 100.0%
97.9%
Average
Average
Average
Average
Average
Average
Average
Average
Average
Average
Average
Average
43
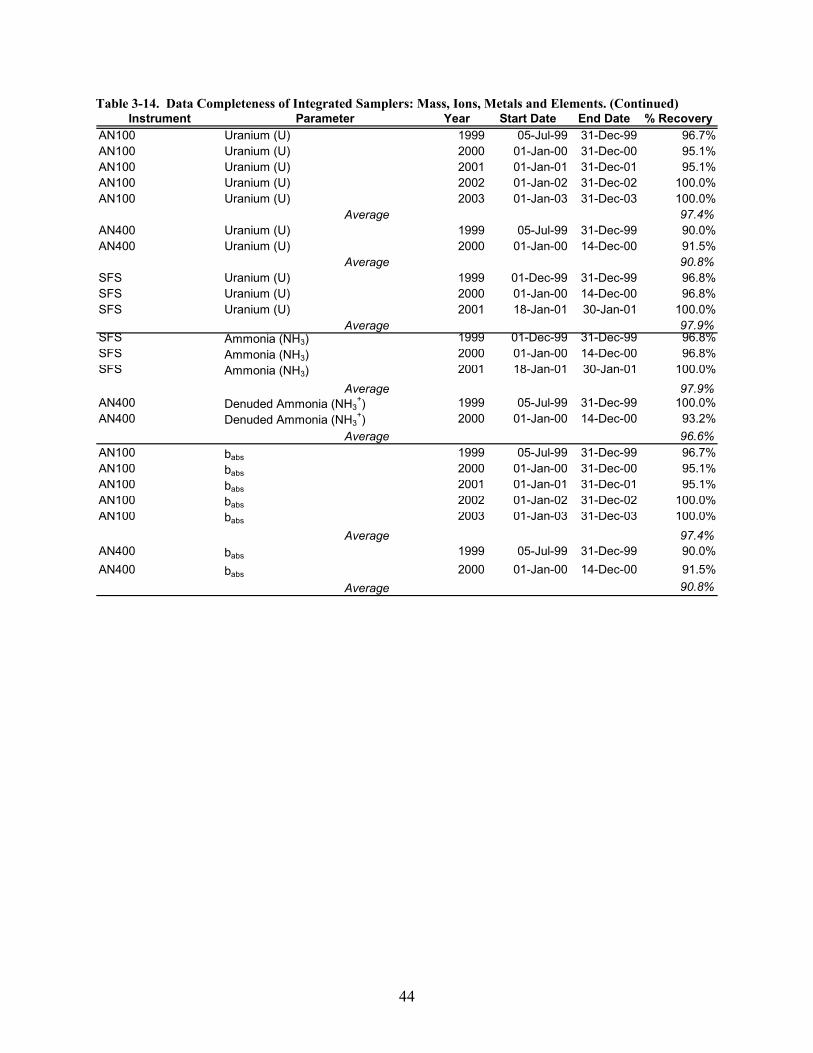
Table 3-14. Data Completeness of Integrated Samplers: Mass, Ions, Metals and Elements. (Continued) Instrument Parameter Year Start Date End Date % Recovery
AN100 Uranium (U) 1999 05-Jul-99 31-Dec-99 96.7%AN100 Uranium (U) 2000 01-Jan-00 31-Dec-00 95.1%AN100 Uranium (U) 2001 01-Jan-01 31-Dec-01 95.1%AN100 Uranium (U) 2002 01-Jan-02 31-Dec-02 100.0%AN100 Uranium (U) 2003 01-Jan-03 31-Dec-03 100.0%
97.4%AN400 Uranium (U) 1999 05-Jul-99 31-Dec-99 90.0%AN400 Uranium (U) 2000 01-Jan-00 14-Dec-00 91.5%
90.8%SFS Uranium (U) 1999 01-Dec-99 31-Dec-99 96.8%SFS Uranium (U) 2000 01-Jan-00 14-Dec-00 96.8%SFS Uranium (U) 2001 18-Jan-01 30-Jan-01 100.0%
97.9%SFS Ammonia (NH3) 1999 01-Dec-99 31-Dec-99 96.8%SFS Ammonia (NH3) 2000 01-Jan-00 14-Dec-00 96.8%SFS Ammonia (NH3) 2001 18-Jan-01 30-Jan-01 100.0%
97.9%AN400 Denuded Ammonia (NH3
+) 1999 05-Jul-99 31-Dec-99 100.0%AN400 Denuded Ammonia (NH3
+) 2000 01-Jan-00 14-Dec-00 93.2%96.6%
AN100 babs 1999 05-Jul-99 31-Dec-99 96.7%AN100 babs 2000 01-Jan-00 31-Dec-00 95.1%AN100 babs 2001 01-Jan-01 31-Dec-01 95.1%AN100 babs 2002 01-Jan-02 31-Dec-02 100.0%AN100 babs 2003 01-Jan-03 31-Dec-03 100.0%
97.4%AN400 babs 1999 05-Jul-99 31-Dec-99 90.0%AN400 babs 2000 01-Jan-00 14-Dec-00 91.5%
90.8%
Average
Average
Average
Average
Average
Average
Average
44
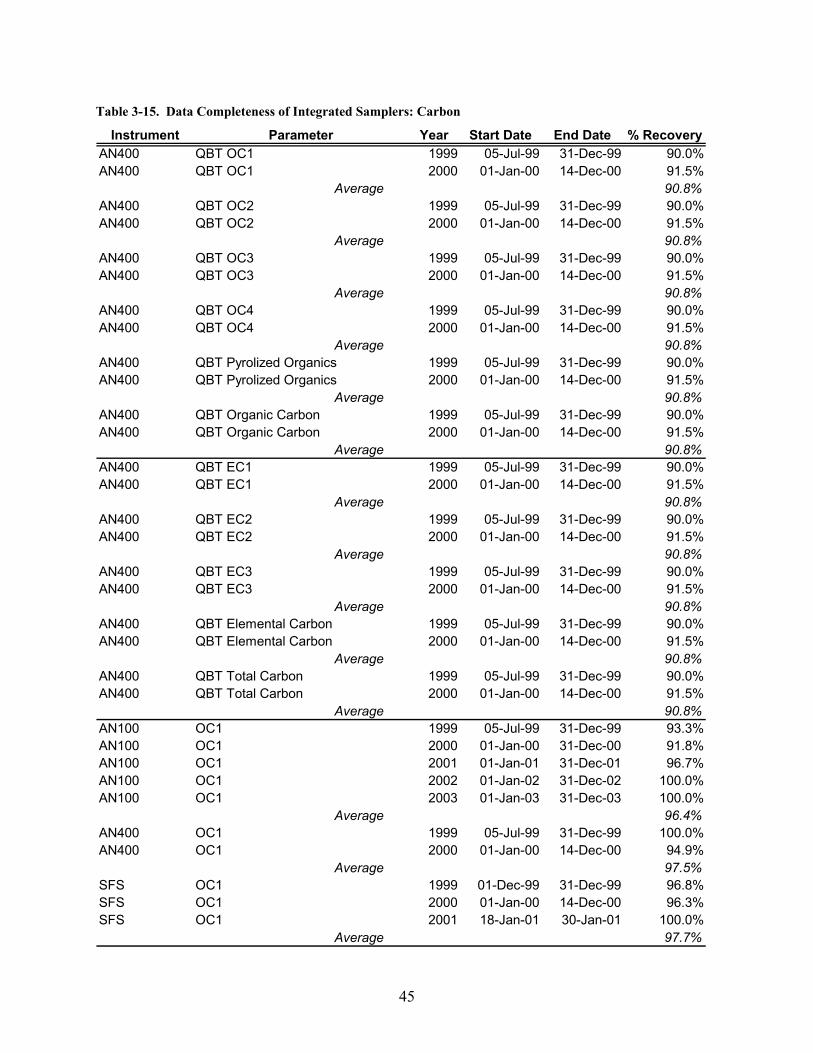
Table 3-15. Data Completeness of Integrated Samplers: Carbon
Instrument Parameter Year Start Date End Date % RecoveryAN400 QBT OC1 1999 05-Jul-99 31-Dec-99 90.0%AN400 QBT OC1 2000 01-Jan-00 14-Dec-00 91.5%
90.8%AN400 QBT OC2 1999 05-Jul-99 31-Dec-99 90.0%AN400 QBT OC2 2000 01-Jan-00 14-Dec-00 91.5%
90.8%AN400 QBT OC3 1999 05-Jul-99 31-Dec-99 90.0%AN400 QBT OC3 2000 01-Jan-00 14-Dec-00 91.5%
90.8%AN400 QBT OC4 1999 05-Jul-99 31-Dec-99 90.0%AN400 QBT OC4 2000 01-Jan-00 14-Dec-00 91.5%
90.8%AN400 QBT Pyrolized Organics 1999 05-Jul-99 31-Dec-99 90.0%AN400 QBT Pyrolized Organics 2000 01-Jan-00 14-Dec-00 91.5%
90.8%AN400 QBT Organic Carbon 1999 05-Jul-99 31-Dec-99 90.0%AN400 QBT Organic Carbon 2000 01-Jan-00 14-Dec-00 91.5%
90.8%AN400 QBT EC1 1999 05-Jul-99 31-Dec-99 90.0%AN400 QBT EC1 2000 01-Jan-00 14-Dec-00 91.5%
90.8%AN400 QBT EC2 1999 05-Jul-99 31-Dec-99 90.0%AN400 QBT EC2 2000 01-Jan-00 14-Dec-00 91.5%
90.8%AN400 QBT EC3 1999 05-Jul-99 31-Dec-99 90.0%AN400 QBT EC3 2000 01-Jan-00 14-Dec-00 91.5%
90.8%AN400 QBT Elemental Carbon 1999 05-Jul-99 31-Dec-99 90.0%AN400 QBT Elemental Carbon 2000 01-Jan-00 14-Dec-00 91.5%
90.8%AN400 QBT Total Carbon 1999 05-Jul-99 31-Dec-99 90.0%AN400 QBT Total Carbon 2000 01-Jan-00 14-Dec-00 91.5%
90.8%AN100 OC1 1999 05-Jul-99 31-Dec-99 93.3%AN100 OC1 2000 01-Jan-00 31-Dec-00 91.8%AN100 OC1 2001 01-Jan-01 31-Dec-01 96.7%AN100 OC1 2002 01-Jan-02 31-Dec-02 100.0%AN100 OC1 2003 01-Jan-03 31-Dec-03 100.0%
96.4%AN400 OC1 1999 05-Jul-99 31-Dec-99 100.0%AN400 OC1 2000 01-Jan-00 14-Dec-00 94.9%
97.5%SFS OC1 1999 01-Dec-99 31-Dec-99 96.8%SFS OC1 2000 01-Jan-00 14-Dec-00 96.3%SFS OC1 2001 18-Jan-01 30-Jan-01 100.0%
97.7%
Average
Average
Average
Average
Average
Average
Average
Average
Average
Average
Average
Average
Average
Average
45

Table 3-15. Data Completeness of Integrated Samplers: Carbon (Continued) Instrument Parameter Year Start Date End Date % Recovery
AN100 OC2 1999 05-Jul-99 31-Dec-99 93.3%AN100 OC2 2000 01-Jan-00 31-Dec-00 91.8%AN100 OC2 2001 01-Jan-01 31-Dec-01 96.7%AN100 OC2 2002 01-Jan-02 31-Dec-02 100.0%AN100 OC2 2003 01-Jan-03 31-Dec-03 100.0%
96.4%AN400 OC2 1999 05-Jul-99 31-Dec-99 100.0%AN400 OC2 2000 01-Jan-00 14-Dec-00 94.9%
97.5%SFS OC2 1999 01-Dec-99 31-Dec-99 96.8%SFS OC2 2000 01-Jan-00 14-Dec-00 96.3%SFS OC2 2001 18-Jan-01 30-Jan-01 100.0%
97.7%AN100 OC3 1999 05-Jul-99 31-Dec-99 93.3%AN100 OC3 2000 01-Jan-00 31-Dec-00 91.8%AN100 OC3 2001 01-Jan-01 31-Dec-01 96.7%AN100 OC3 2002 01-Jan-02 31-Dec-02 100.0%AN100 OC3 2003 01-Jan-03 31-Dec-03 100.0%
96.4%AN400 OC3 1999 05-Jul-99 31-Dec-99 100.0%AN400 OC3 2000 01-Jan-00 14-Dec-00 94.9%
97.5%SFS OC3 1999 01-Dec-99 31-Dec-99 96.8%SFS OC3 2000 01-Jan-00 14-Dec-00 96.3%SFS OC3 2001 18-Jan-01 30-Jan-01 100.0%
97.7%AN100 OC4 1999 05-Jul-99 31-Dec-99 93.3%AN100 OC4 2000 01-Jan-00 31-Dec-00 91.8%AN100 OC4 2001 01-Jan-01 31-Dec-01 96.7%AN100 OC4 2002 01-Jan-02 31-Dec-02 100.0%AN100 OC4 2003 01-Jan-03 31-Dec-03 100.0%
96.4%AN400 OC4 1999 05-Jul-99 31-Dec-99 100.0%AN400 OC4 2000 01-Jan-00 14-Dec-00 94.9%
97.5%SFS OC4 1999 01-Dec-99 31-Dec-99 96.8%SFS OC4 2000 01-Jan-00 14-Dec-00 96.3%SFS OC4 2001 18-Jan-01 30-Jan-01 100.0%
97.7%AN100 Pyrolized Organics 1999 05-Jul-99 31-Dec-99 93.3%AN100 Pyrolized Organics 2000 01-Jan-00 31-Dec-00 91.8%AN100 Pyrolized Organics 2001 01-Jan-01 31-Dec-01 96.7%AN100 Pyrolized Organics 2002 01-Jan-02 31-Dec-02 100.0%AN100 Pyrolized Organics 2003 01-Jan-03 31-Dec-03 100.0%
96.4%AN400 Pyrolized Organics 1999 05-Jul-99 31-Dec-99 100.0%AN400 Pyrolized Organics 2000 01-Jan-00 14-Dec-00 94.9%
97.5%
Average
Average
Average
Average
Average
Average
Average
Average
Average
Average
Average
46

Table 3-15. Data Completeness of Integrated Samplers: Carbon (Continued) Instrument Parameter Year Start Date End Date % Recovery
SFS Pyrolized Organics 1999 01-Dec-99 31-Dec-99 96.8%SFS Pyrolized Organics 2000 01-Jan-00 14-Dec-00 96.3%SFS Pyrolized Organics 2001 18-Jan-01 30-Jan-01 100.0%
97.7%AN100 Organic Carbon 1999 05-Jul-99 31-Dec-99 93.3%AN100 Organic Carbon 2000 01-Jan-00 31-Dec-00 91.8%AN100 Organic Carbon 2001 01-Jan-01 31-Dec-01 96.7%AN100 Organic Carbon 2002 01-Jan-02 31-Dec-02 100.0%AN100 Organic Carbon 2003 01-Jan-03 31-Dec-03 100.0%
96.4%AN400 Organic Carbon 1999 05-Jul-99 31-Dec-99 100.0%AN400 Organic Carbon 2000 01-Jan-00 14-Dec-00 94.9%
97.5%SFS Organic Carbon 1999 01-Dec-99 31-Dec-99 96.8%SFS Organic Carbon 2000 01-Jan-00 14-Dec-00 96.3%SFS Organic Carbon 2001 18-Jan-01 30-Jan-01 100.0%
97.7%AN100 EC1 1999 05-Jul-99 31-Dec-99 93.3%AN100 EC1 2000 01-Jan-00 31-Dec-00 91.8%AN100 EC1 2001 01-Jan-01 31-Dec-01 96.7%AN100 EC1 2002 01-Jan-02 31-Dec-02 100.0%AN100 EC1 2003 01-Jan-03 31-Dec-03 100.0%
96.4%AN400 EC1 1999 05-Jul-99 31-Dec-99 100.0%AN400 EC1 2000 01-Jan-00 14-Dec-00 94.9%
97.5%SFS EC1 1999 01-Dec-99 31-Dec-99 96.8%SFS EC1 2000 01-Jan-00 14-Dec-00 96.3%SFS EC1 2001 18-Jan-01 30-Jan-01 100.0%
97.7%AN100 EC2 1999 05-Jul-99 31-Dec-99 93.3%AN100 EC2 2000 01-Jan-00 31-Dec-00 91.8%AN100 EC2 2001 01-Jan-01 31-Dec-01 96.7%AN100 EC2 2002 01-Jan-02 31-Dec-02 100.0%AN100 EC2 2003 01-Jan-03 31-Dec-03 100.0%
96.4%AN400 EC2 1999 05-Jul-99 31-Dec-99 100.0%AN400 EC2 2000 01-Jan-00 14-Dec-00 94.9%
97.5%SFS EC2 1999 01-Dec-99 31-Dec-99 96.8%SFS EC2 2000 01-Jan-00 14-Dec-00 96.3%SFS EC2 2001 18-Jan-01 30-Jan-01 100.0%
97.7%
Average
Average
Average
Average
Average
Average
Average
Average
Average
Average
47

Table 3-15. Data Completeness of Integrated Samplers: Carbon (Continued) Instrument Parameter Year Start Date End Date % Recovery
AN100 EC3 1999 05-Jul-99 31-Dec-99 93.3%AN100 EC3 2000 01-Jan-00 31-Dec-00 91.8%AN100 EC3 2001 01-Jan-01 31-Dec-01 96.7%AN100 EC3 2002 01-Jan-02 31-Dec-02 100.0%AN100 EC3 2003 01-Jan-03 31-Dec-03 100.0%
96.4%AN400 EC3 1999 05-Jul-99 31-Dec-99 100.0%AN400 EC3 2000 01-Jan-00 14-Dec-00 94.9%
97.5%SFS EC3 1999 01-Dec-99 31-Dec-99 96.8%SFS EC3 2000 01-Jan-00 14-Dec-00 96.3%SFS EC3 2001 18-Jan-01 30-Jan-01 100.0%
97.7%AN100 Elemental Carbon 1999 05-Jul-99 31-Dec-99 93.3%AN100 Elemental Carbon 2000 01-Jan-00 31-Dec-00 91.8%AN100 Elemental Carbon 2001 01-Jan-01 31-Dec-01 96.7%AN100 Elemental Carbon 2002 01-Jan-02 31-Dec-02 100.0%AN100 Elemental Carbon 2003 01-Jan-03 31-Dec-03 100.0%
96.4%AN400 Elemental Carbon 1999 05-Jul-99 31-Dec-99 100.0%AN400 Elemental Carbon 2000 01-Jan-00 14-Dec-00 94.9%
97.5%SFS Elemental Carbon 1999 01-Dec-99 31-Dec-99 96.8%SFS Elemental Carbon 2000 01-Jan-00 14-Dec-00 96.3%SFS Elemental Carbon 2001 18-Jan-01 30-Jan-01 100.0%
97.7%AN100 Total Carbon 1999 05-Jul-99 31-Dec-99 93.3%AN100 Total Carbon 2000 01-Jan-00 31-Dec-00 91.8%AN100 Total Carbon 2001 01-Jan-01 31-Dec-01 96.7%AN100 Total Carbon 2002 01-Jan-02 31-Dec-02 100.0%AN100 Total Carbon 2003 01-Jan-03 31-Dec-03 100.0%
96.4%AN400 Total Carbon 1999 05-Jul-99 31-Dec-99 100.0%AN400 Total Carbon 2000 01-Jan-00 14-Dec-00 94.9%
97.5%SFS Total Carbon 1999 01-Dec-99 31-Dec-99 96.8%SFS Total Carbon 2000 01-Jan-00 14-Dec-00 96.3%SFS Total Carbon 2001 18-Jan-01 30-Jan-01 100.0%
97.7%AN400 QBQ OC1 1999 05-Jul-99 31-Dec-99 100.0%AN400 QBQ OC1 2000 01-Jan-00 14-Dec-00 94.9%
97.5%AN400 QBQ OC2 1999 05-Jul-99 31-Dec-99 100.0%AN400 QBQ OC2 2000 01-Jan-00 14-Dec-00 94.9%
97.5%Average
Average
Average
Average
Average
Average
Average
Average
Average
Average
Average
48

Table 3-15. Data Completeness of Integrated Samplers: Carbon (Continued) Instrument Parameter Year Start Date End Date % Recovery
AN400 QBQ OC3 1999 05-Jul-99 31-Dec-99 100.0%AN400 QBQ OC3 2000 01-Jan-00 14-Dec-00 94.9%
97.5%AN400 QBQ OC4 1999 05-Jul-99 31-Dec-99 100.0%AN400 QBQ OC4 2000 01-Jan-00 14-Dec-00 94.9%
97.5%AN400 QBQ Pyrolized Organics 1999 05-Jul-99 31-Dec-99 100.0%AN400 QBQ Pyrolized Organics 2000 01-Jan-00 14-Dec-00 94.9%
97.5%AN400 QBQ Organic Carbon 1999 05-Jul-99 31-Dec-99 100.0%AN400 QBQ Organic Carbon 2000 01-Jan-00 14-Dec-00 94.9%
97.5%AN400 QBQ EC1 1999 05-Jul-99 31-Dec-99 100.0%AN400 QBQ EC1 2000 01-Jan-00 14-Dec-00 94.9%
97.5%AN400 QBQ EC2 1999 05-Jul-99 31-Dec-99 100.0%AN400 QBQ EC2 2000 01-Jan-00 14-Dec-00 94.9%
97.5%AN400 QBQ EC3 1999 05-Jul-99 31-Dec-99 100.0%AN400 QBQ EC3 2000 01-Jan-00 14-Dec-00 94.9%
97.5%AN400 QBQ Elemental Carbon 1999 05-Jul-99 31-Dec-99 100.0%AN400 QBQ Elemental Carbon 2000 01-Jan-00 14-Dec-00 94.9%
97.5%AN400 QBQ Total Carbon 1999 05-Jul-99 31-Dec-99 100.0%AN400 QBQ Total Carbon 2000 01-Jan-00 14-Dec-00 94.9%
97.5%AN400 Denuded OC1 1999 05-Jul-99 31-Dec-99 100.0%AN400 Denuded OC1 2000 01-Jan-00 14-Dec-00 93.2%
96.6%AN400 Denuded OC2 1999 05-Jul-99 31-Dec-99 100.0%AN400 Denuded OC2 2000 01-Jan-00 14-Dec-00 93.2%
96.6%AN400 Denuded OC3 1999 05-Jul-99 31-Dec-99 100.0%AN400 Denuded OC3 2000 01-Jan-00 14-Dec-00 93.2%
96.6%AN400 Denuded OC4 1999 05-Jul-99 31-Dec-99 100.0%AN400 Denuded OC4 2000 01-Jan-00 14-Dec-00 93.2%
96.6%AN400 Denuded Pyrolized Organics 1999 05-Jul-99 31-Dec-99 100.0%AN400 Denuded Pyrolized Organics 2000 01-Jan-00 14-Dec-00 93.2%
96.6%AN400 Denuded Organic Carbon 1999 05-Jul-99 31-Dec-99 100.0%AN400 Denuded Organic Carbon 2000 01-Jan-00 14-Dec-00 93.2%
96.6%AN400 Denuded EC1 1999 05-Jul-99 31-Dec-99 100.0%AN400 Denuded EC1 2000 01-Jan-00 14-Dec-00 93.2%
96.6%
Average
Average
Average
Average
Average
Average
Average
Average
Average
Average
Average
Average
Average
Average
Average
Average
49

Table 3-15. Data Completeness of Integrated Samplers: Carbon (Continued) Instrument Parameter Year Start Date End Date % Recovery
AN400 Denuded EC2 1999 05-Jul-99 31-Dec-99 100.0%AN400 Denuded EC2 2000 01-Jan-00 14-Dec-00 93.2%
96.6%AN400 Denuded EC3 1999 05-Jul-99 31-Dec-99 100.0%AN400 Denuded EC3 2000 01-Jan-00 14-Dec-00 93.2%
96.6%AN400 Denuded Elemental Carbon 1999 05-Jul-99 31-Dec-99 100.0%AN400 Denuded Elemental Carbon 2000 01-Jan-00 14-Dec-00 93.2%
96.6%AN400 Denuded Total Carbon 1999 05-Jul-99 31-Dec-99 100.0%AN400 Denuded Total Carbon 2000 01-Jan-00 14-Dec-00 93.2%
96.6%AN400 Denuded QBQ OC1 1999 05-Jul-99 31-Dec-99 100.0%AN400 Denuded QBQ OC1 2000 01-Jan-00 14-Dec-00 93.2%
96.6%AN400 Denuded QBQ OC2 1999 05-Jul-99 31-Dec-99 100.0%AN400 Denuded QBQ OC2 2000 01-Jan-00 14-Dec-00 93.2%
96.6%AN400 Denuded QBQ OC3 1999 05-Jul-99 31-Dec-99 100.0%AN400 Denuded QBQ OC3 2000 01-Jan-00 14-Dec-00 93.2%
96.6%AN400 Denuded QBQ OC4 1999 05-Jul-99 31-Dec-99 100.0%AN400 Denuded QBQ OC4 2000 01-Jan-00 14-Dec-00 93.2%
96.6%AN400 Denuded QBQ Pyrolized Organics 1999 05-Jul-99 31-Dec-99 100.0%AN400 Denuded QBQ Pyrolized Organics 2000 01-Jan-00 14-Dec-00 93.2%
96.6%AN400 Denuded QBQ Organic Carbon 1999 05-Jul-99 31-Dec-99 100.0%AN400 Denuded QBQ Organic Carbon 2000 01-Jan-00 14-Dec-00 93.2%
96.6%AN400 Denuded QBQ EC1 1999 05-Jul-99 31-Dec-99 100.0%AN400 Denuded QBQ EC1 2000 01-Jan-00 14-Dec-00 93.2%
96.6%AN400 Denuded QBQ EC2 1999 05-Jul-99 31-Dec-99 100.0%AN400 Denuded QBQ EC2 2000 01-Jan-00 14-Dec-00 93.2%
96.6%AN400 Denuded QBQ EC3 1999 05-Jul-99 31-Dec-99 100.0%AN400 Denuded QBQ EC3 2000 01-Jan-00 14-Dec-00 93.2%
96.6%AN400 Denuded QBQ Elemental Carbon 1999 05-Jul-99 31-Dec-99 100.0%AN400 Denuded QBQ Elemental Carbon 2000 01-Jan-00 14-Dec-00 93.2%
96.6%AN400 Denuded QBQ Total Carbon 1999 05-Jul-99 31-Dec-99 100.0%AN400 Denuded QBQ Total Carbon 2000 01-Jan-00 14-Dec-00 93.2%
96.6%
Average
Average
Average
Average
Average
Average
Average
Average
Average
Average
Average
Average
Average
Average
Average
50

Table 3-16. Data Completeness of Meteorological Measurements
Instrument Year Start Date End Date % RecoveryMeteorological MeasurementsMet One 060A-2 Ambient Temperature 1999 10-Jul-99 31-Dec-99 97.6%Met One 060A-2 Ambient Temperature 2000 01-Jan-00 31-Dec-00 99.5%Met One 060A-2 Ambient Temperature 2001 01-Jan-01 31-Dec-01 98.2%Met One 060A-2 Ambient Temperature 2002 01-Jan-02 31-Dec-02 99.8%Met One 060A-2 Ambient Temperature 2003 01-Jan-03 31-Dec-03 99.1%Met One 060A-2 Ambient Temperature 2004 01-Jan-04 31-Dec-04 99.9%
99.0%Met One 083V Relative Humidity 1999 10-Jul-99 31-Dec-99 99.7%Met One 083V Relative Humidity 2000 01-Jan-00 31-Dec-00 99.6%Met One 083V Relative Humidity 2001 01-Jan-01 31-Dec-01 100.0%Met One 083V Relative Humidity 2002 01-Jan-02 31-Dec-02 100.0%Met One 083V Relative Humidity 2003 01-Jan-03 31-Dec-03 100.0%Met One 083V Relative Humidity 2004 01-Jan-04 31-Dec-04 100.0%
99.9%Met One 010-SC Wind Speed 1999 10-Jul-99 31-Dec-99 99.7%Met One 010-SC Wind Speed 2000 01-Jan-00 31-Dec-00 99.5%Met One 010-SC Wind Speed 2001 01-Jan-01 31-Dec-01 100.0%Met One 010-SC Wind Speed 2002 01-Jan-02 31-Dec-02 100.0%Met One 010-SC Wind Speed 2003 01-Jan-03 31-Dec-03 100.0%Met One 010-SC Wind Speed 2004 01-Jan-04 31-Dec-04 100.0%
99.9%Met One 025-5C Wind Direction 1999 10-Jul-99 31-Dec-99 99.5%Met One 025-5C Wind Direction 2000 01-Jan-00 31-Dec-00 99.6%Met One 025-5C Wind Direction 2001 01-Jan-01 31-Dec-01 100.0%Met One 025-5C Wind Direction 2002 01-Jan-02 31-Dec-02 100.0%Met One 025-5C Wind Direction 2003 01-Jan-03 31-Dec-03 100.0%Met One 025-5C Wind Direction 2004 01-Jan-04 31-Dec-04 100.0%
99.8%Met One 090D Barometric Pressure 2000 24-May-00 31-Dec-00 100.0%Met One 090D Barometric Pressure 2001 01-Jan-01 31-Dec-01 100.0%Met One 090D Barometric Pressure 2002 01-Jan-02 31-Dec-02 100.0%Met One 090D Barometric Pressure 2003 01-Jan-03 31-Dec-03 100.0%Met One 090D Barometric Pressure 2004 01-Jan-04 31-Dec-04 100.0%
100.0%LI-COR LI-200SA Solar Radiation 1999 30-Sep-99 31-Dec-99 99.3%LI-COR LI-200SA Solar Radiation 2000 01-Jan-00 31-Dec-00 99.6%LI-COR LI-200SA Solar Radiation 2001 01-Jan-01 31-Dec-01 100.0%LI-COR LI-200SA Solar Radiation 2002 01-Jan-02 31-Dec-02 100.0%LI-COR LI-200SA Solar Radiation 2003 01-Jan-03 31-Dec-03 100.0%LI-COR LI-200SA Solar Radiation 2004 01-Jan-04 31-Dec-04 99.2%
99.7%
Average
Average
Average
Average
Average
Average
51

4 CONCLUSIONS
The intention of the U.S. Environmental Protection Agency’s Supersite Program was to operate
research-grade air monitoring stations to improve understanding of measurement technologies,
source contributions and control strategies, and effects of suspended particles on health. This
report summarized the quality assurance activities carried out for the Fresno Supersite project
and their findings. It also supplements the Fresno Supersite Final Report (Watson et al., 2005a).
Pursuant to the laboratory systems audit, the Standard Operating Procedures are now reviewed
continually and updated as, and when, necessary. An inter-laboratory comparison showed good
analytical agreement between the DRI and EPA analyses. DRI laboratory performance met or
exceeded the compliance standards, and no deficiencies were found. The field audits showed the
flow accuracy to be within the respective instrument objective stated in the QAPP, except for the
GreenTek photometer. Various articles have been published on the inter-comparability of the
samplers, suggesting in general that, except for the TEOM, the mass measurements were highly
correlated. The R&P 5400 continuous carbon analyzer was neither comparable to, nor
predictable of, the integrated filter carbon measurements. The R&P 8400N continuous nitrate
monitor, while being well-correlated with filter measurements, was consistently low biased. On
average, all the continuous and integrated samplers showed data recoveries greater than 75%,
except for the R&P 5400 carbon analyzer. The experience at the Fresno Supersite indicated that
the R&P 5400 carbon analyzer was unreliable. All the meteorological measurements had data
recoveries greater than 75%.
5 REFERENCES Bevington, P.R. (1969). Data Reduction and Error Analysis for the Physical Sciences. McGraw
Hill, New York, NY.
California Air Resources Board (2003). Aethalometer intercomparison field study. Prepared by California Air Resources Board, Sacramento, CA.
Chow, J.C.; Watson, J.G.; Chen, L.W.A.; Paredes-Miranda, G.; Chang, M.C.; Trimble, D.; Fung, K.K.; Zhang, J.; and Yu, J.Z. (2005a). Refining temperature measures in thermal/optical carbon analysis. Atmos. Chem. Physics Discussion, 5:4477-4505.
52
Chow, J.C.; Watson, J.G.; Chen, L.-W.A.; Arnott, W.P.; Moosmüller, H.; and Fung, K.K. (2004). Equivalence of elemental carbon by Thermal/Optical Reflectance and Transmittance with different temperature protocols. Environ. Sci. Technol., 38(16):4414-4422.
Chow, J.C.; Watson, J.G.; Chen, L.-W.A.; Chang, M.C.; and Paredes-Miranda, G. (2005). Comparison of the DRI/OGC and Model 2001 Thermal/Optical carbon analyzers. Prepared for IMPROVE Steering Committee, Fort Collins, CO, by Desert Research Institute, Reno, NV.
Chow, J.C.; Watson, J.G.; Lowenthal, D.H.; Chen, L.W.A.; Tropp, R.J.; Park, K.; and Magliano, K. (2005b). PM2.5 and PM10 mass measurements in California's San Joaquin Valley. Aerosol Sci. Technol., submitted.
Chow, J.C.; Watson, J.G.; Lowenthal, D.H.; Chen, L.-W.A.; and Magliano, K. (2005c). Particulate carbon measurements in California's San Joaquin Valley. Chemosphere, in press.
Chow, J.C.; Watson, J.G.; Park, K.; Lowenthal, D.H.; Chen, L.W.A.; Robinson, N.F.; and Magliano, K. (2005d). Comparison of particle light scattering and PM2.5 mass in central California. J. Environ. Toxicol., submitted.
Chu, S.H.; Paisie, J.W.; and Jang, B.W.L. (2004). PM data analysis - a comparison of two urban areas: Fresno and Atlanta. Atmos. Environ., 38(20):3155-3164. ISI:000221838500005.
Engelbrecht, J.P. (2002). Laboratory Measurement Systems Audit - California Regional PM10/PM2.5 Air Quality Study. Prepared by Desert Research Institute, Reno, NV.
Evans, G.F.; Highsmith, R.V.; Sheldon, L.S.; Suggs, J.C.; Williams, R.W.; Zweidinger, R.B.; Creason, J.P.; Walsh, D.; Rodes, C.E.; and Lawless, P.A. (2000). The 1999 Fresno Particulate Matter Exposure Studies: Comparison of community, outdoor, and residential PM mass measurements. JAWMA, 50(11):1887-1896.
Gemmill, D. (2002a). Quality Assurance Audit Report - Fresno Supersite. Prepared by University of California, College of Engineering–Center for Environmental Research and Technology, Riverside, CA.
Gemmill, D.B. (2002b). Draft Quality Assurance Audit Report - Fresno Supersite. Prepared by University of California, College of Engineering–Center for Environmental Research and Technology, Riverside, CA.
Held, T.; Ying, Q.; Kaduwela, A.; and Kleeman, M. (2004). Modeling particulate matter in the San Joaquin Valley with a source-oriented externally mixed three-dimensional photochemical grid model. Atmos. Environ., 38(22):3689-3711. ISI:000222214900013.
Howard-Reed, C.; Rea, A.W.; Zufall, M.J.; Burke, J.M.; Williams, R.W.; Suggs, J.C.; Sheldon, L.S.; Walsh, D.; and Kwok, R. (2000). Use of a continuous nephelometer to measure
53

personal exposure to particles during the U.S. Environmental Protection Agency Baltimore and Fresno panel studies. JAWMA, 50(7):1125-1132.
Lawless, P.A.; Rodes, C.E.; Evans, G.; Sheldon, L.; and Creason, J. (2001). Aerosol concentrations during the 1999 Fresno Exposure Studies as functions of size, season, and meteorology. Aerosol Sci. Technol., 34(1):66-74.
Park, K.; Chow, J.C.; Watson, J.G.; Arnott, W.P.; Trimble, D.; Bowers, K.; Bode, R.; Petzold, A.; and Hansen, A.D.A. (2005). Comparison of continuous and filter-based carbon measurements at the Fresno Supersite. JAWMA, accepted.
Park, K. et al. (2005a). Semi-continuous and filter-based measurements of nitrate and sulfate at the Fresno Supersite . JAWMA, In Preparation.
Poore, M.W. (2000). Oxalic acid in PM2.5 in California. JAWMA, 50(11):1874-1875.
Poore, M.W. (2002). Levoglucosan in PM2.5 at the Fresno supersite. JAWMA, 52(1):3-4.
Schauer, J.J.; and Cass, G.R. (2000). Source apportionment of wintertime gas-phase and particle-phase air pollutants using organic compounds as tracers. Environ. Sci. Technol., 34(9):1821-1832.
Taylor, S.; and Boswell, E. (2005). Performance Evaluation of DRI Laboratory- Technical Memorandum. Prepared by the U.S. Environmental Protection Agency. http://www.epa.gov/ttn/amtic/files/ambient/pm25/spec/driaudit.pdf.
Watson, J.G.; and Chow, J.C. (2002a). A wintertime PM2.5 episode at the Fresno, CA, supersite. Atmos. Environ., 36(3):465-475.
Watson, J.G.; and Chow, J.C. (2002b). Comparison and evaluation of in-situ and filter carbon measurements at the Fresno Supersite. J. Geophys. Res., 107(D21):ICC 3-1-ICC 3-15. doi: 10.1029/2001JD000573.
Watson, J.G.; Chow, J.C.; Bowen, J.L.; Lowenthal, D.H.; Hering, S.; Ouchida, P.; and Oslund, W. (2000). Air quality measurements from the Fresno Supersite. JAWMA, 50(8):1321-1334. ISI:000089085700005.
Watson, J.G.; Chow, J.C.; Chen, L.W.A.; Lowenthal, D.H.; Trimble, D.L.; and Park, K. (2005a). Fresno supersite final report. Prepared for US Environmental Protection Agency OAQPS, by Desert Research Institute, Reno, NV.
Watson, J.G.; Chow, J.C.; DuBois, D.W.; Green, M.C.; Frank, N.H.; and Pitchford, M.L. (1997). Guidance for network design and optimal site exposure for PM2.5 and PM10. Report No. EPA-454/R-99-022. Prepared by U.S. Environmental Protection Agency, Research Triangle Park, NC. http://www.epa.gov/ttn/amtic/pmstg.html.
54

Watson, J.G.; Chow, J.C.; Fitz, D.; and Ouchida, P. (2001a). Quality Assurance Project Plan, Fresno Supersite - Phase II (Revision 1). Prepared for the U.S. Environmental Protection Agency by Desert Research Institute, Reno, NV.
Watson, J.G.; Chow, J.C.; Hering, S.V.; and Fitz, D.R. (2002). Final report for Phase I of Fresno supersite measurements. Prepared for Cooperative Institute for Atmospheric Sciences and Terrestrial Applications, Las Vegas, NV, by Desert Research Institute, Reno, NV.
Watson, J.G.; Chow, J.C.; Lowenthal, D.H.; Kreisberg, N.; Hering, S.V.; and Stolzenburg, M.R. (2005b). Variations of nanoparticle concentrations at the Fresno supersite. Sci. Total Environ., in press.
Watson, J.G.; Chow, J.C.; Lowenthal, D.H.; Stolzenburg, M.R.; Kreisberg, N.M.; and Hering, S.V. (2002). Particle size relationships at the Fresno supersite. JAWMA, 52(7):822-827.
Watson, J.G.; Chow, J.C.; Park, K.; and Lowenthal, D.H. (2005c). Nanoparticle and ultrafine particle events at the Fresno Supersite. JAWMA, 55:submitted.
Watson, J.G.; Lioy, P.J.; and Mueller, P.K. (1995). The measurement process: Precision, accuracy, and validity. In Air Sampling Instruments for Evaluation of Atmospheric Contaminants, 8th ed., B.S. Cohen and S.V. Hering, Eds. American Conference of Governmental Industrial Hygienists, Cincinnati, OH, pp. 187-194.
Watson, J.G.; Turpin, B.J.; and Chow, J.C. (2001b). The measurement process: Precision, accuracy, and validity. In Air Sampling Instruments for Evaluation of Atmospheric Contaminants, Ninth Edition, 9th ed., B.S. Cohen and C.S.J. McCammon, Eds. American Conference of Governmental Industrial Hygienists, Cincinnati, OH, pp. 201-216.
55

56
APPENDICES

DRAFT QUALITY ASSURANCE AUDIT REPORT FRESNO SUPERSITE OPERATED BY: California Air Resources Board Monitoring and Laboratory Division, Air Quality Surveillance Branch 1927 13th Street Sacramento, CA 95812 Desert Research Institute 2215 Raggio Parkway Reno, NV 89512 Audit Date: March 6-7, 2002 Prepared by: David Gemmill Quality Assurance Officer College of Engineering Center for Environmental Research and Technology University of California at Riverside Riverside, CA 92507 August 28, 2002
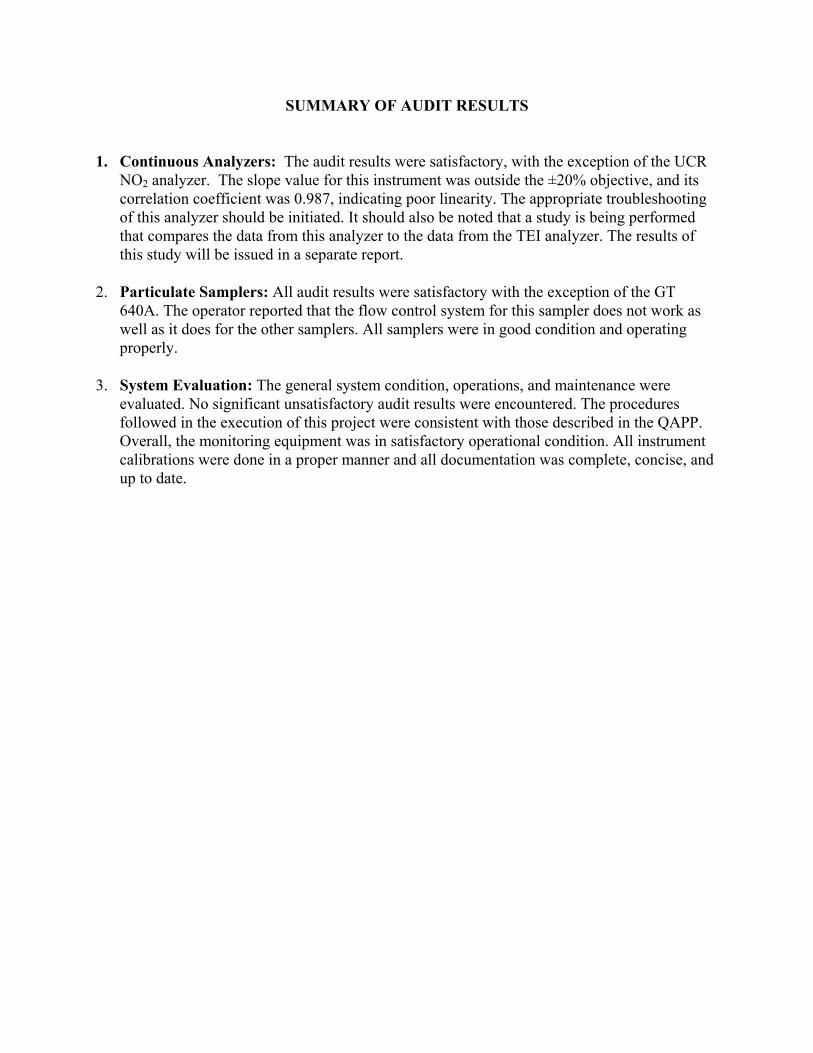
SUMMARY OF AUDIT RESULTS 1. Continuous Analyzers: The audit results were satisfactory, with the exception of the UCR
NO2 analyzer. The slope value for this instrument was outside the ±20% objective, and its correlation coefficient was 0.987, indicating poor linearity. The appropriate troubleshooting of this analyzer should be initiated. It should also be noted that a study is being performed that compares the data from this analyzer to the data from the TEI analyzer. The results of this study will be issued in a separate report.
2. Particulate Samplers: All audit results were satisfactory with the exception of the GT
640A. The operator reported that the flow control system for this sampler does not work as well as it does for the other samplers. All samplers were in good condition and operating properly.
3. System Evaluation: The general system condition, operations, and maintenance were
evaluated. No significant unsatisfactory audit results were encountered. The procedures followed in the execution of this project were consistent with those described in the QAPP. Overall, the monitoring equipment was in satisfactory operational condition. All instrument calibrations were done in a proper manner and all documentation was complete, concise, and up to date.

CONTENTS SUMMARY OF AUDIT RESULTS ............................................................................................... i 1.0 INTRODUCTION .....................................................................................................................1 2.0 DESCRIPTION OF MONITORING EQUIPMENT.................................................................1
2.1 Continuous Analyzers....................................................................................................1 2.2 Sampling Technique ......................................................................................................2 2.3 Calibration Equipment for Continuous Analyzers.........................................................2 2.4 Data Acquisition System ...............................................................................................2 2.5 Particulate and Light Scattering Samplers.....................................................................3
3.0 CALIBRATION PROCEDURES..............................................................................................3 4.0 AUDIT PROCEDURES, EQUIPMENT AND STANDARDS ................................................3
4.1 Continuous Analyzers....................................................................................................3 4.1.1 Evaluation of Audit Results ............................................................................4 4.1.2 Audit Equipment for Continuous Analyzers ..................................................4 4.1.3 Audit NO Standard .........................................................................................5 4.1.4 Audit NO2 Standard and NO2 Converter Efficiency ......................................5
4.2 Particulate and Light Scattering Samplers.....................................................................5 4.3 System Evaluation .........................................................................................................6
5.0 AUDIT RESULTS.....................................................................................................................7
5.1 Continuous Analyzers....................................................................................................7 5.2 Particulate and Light Scattering Samplers.....................................................................8 5.3 System Evaluation .........................................................................................................8
TABLES Table 1 Continuous Analyzers Audited...........................................................................................2 Table 2 Continuous Analyzer Audit Results ...................................................................................9 Table 3 Audit Gas Standard...........................................................................................................10 Table 4 Particulate Sampler Audit Results ....................................................................................11
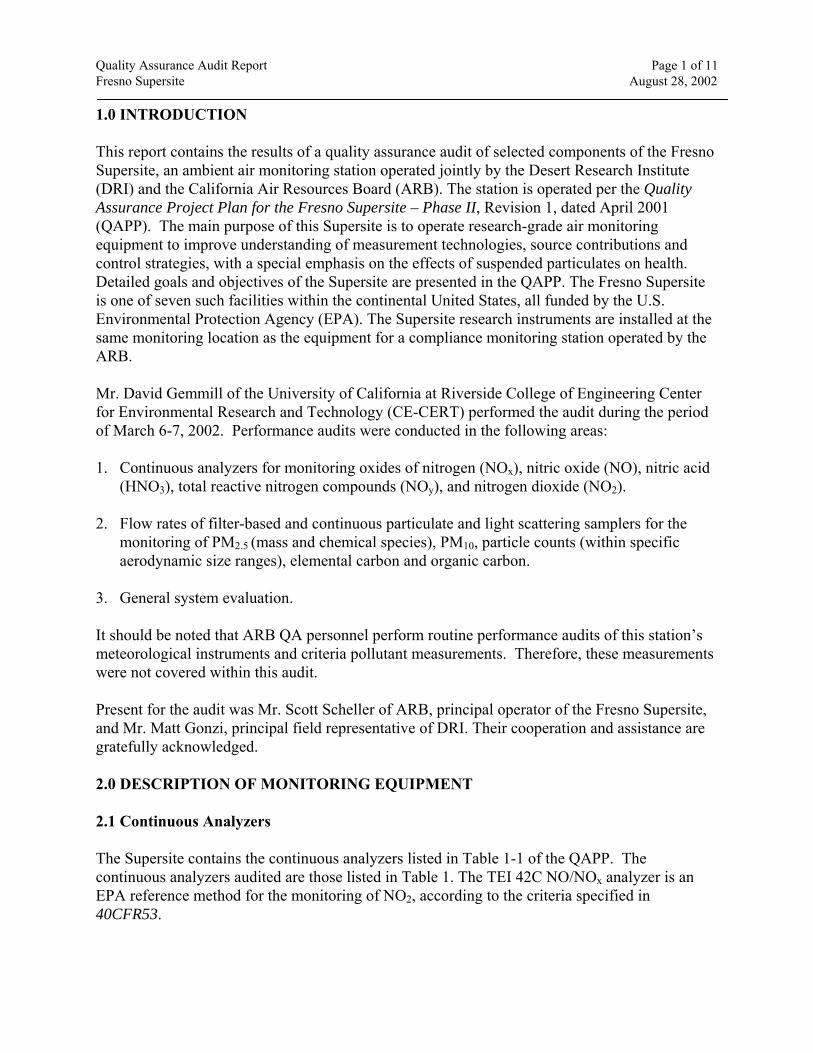
Quality Assurance Audit Report Fresno Supersite August 28, 2002
Page 1 of 11
1.0 INTRODUCTION This report contains the results of a quality assurance audit of selected components of the Fresno Supersite, an ambient air monitoring station operated jointly by the Desert Research Institute (DRI) and the California Air Resources Board (ARB). The station is operated per the Quality Assurance Project Plan for the Fresno Supersite – Phase II, Revision 1, dated April 2001 (QAPP). The main purpose of this Supersite is to operate research-grade air monitoring equipment to improve understanding of measurement technologies, source contributions and control strategies, with a special emphasis on the effects of suspended particulates on health. Detailed goals and objectives of the Supersite are presented in the QAPP. The Fresno Supersite is one of seven such facilities within the continental United States, all funded by the U.S. Environmental Protection Agency (EPA). The Supersite research instruments are installed at the same monitoring location as the equipment for a compliance monitoring station operated by the ARB.
Mr. David Gemmill of the University of California at Riverside College of Engineering Center for Environmental Research and Technology (CE-CERT) performed the audit during the period of March 6-7, 2002. Performance audits were conducted in the following areas: 1. Continuous analyzers for monitoring oxides of nitrogen (NOx), nitric oxide (NO), nitric acid
(HNO3), total reactive nitrogen compounds (NOy), and nitrogen dioxide (NO2). 2. Flow rates of filter-based and continuous particulate and light scattering samplers for the
monitoring of PM2.5 (mass and chemical species), PM10, particle counts (within specific aerodynamic size ranges), elemental carbon and organic carbon.
3. General system evaluation. It should be noted that ARB QA personnel perform routine performance audits of this station’s meteorological instruments and criteria pollutant measurements. Therefore, these measurements were not covered within this audit. Present for the audit was Mr. Scott Scheller of ARB, principal operator of the Fresno Supersite, and Mr. Matt Gonzi, principal field representative of DRI. Their cooperation and assistance are gratefully acknowledged. 2.0 DESCRIPTION OF MONITORING EQUIPMENT 2.1 Continuous Analyzers The Supersite contains the continuous analyzers listed in Table 1-1 of the QAPP. The continuous analyzers audited are those listed in Table 1. The TEI 42C NO/NOx analyzer is an EPA reference method for the monitoring of NO2, according to the criteria specified in 40CFR53.

Quality Assurance Audit Report Fresno Supersite August 28, 2002
Page 2 of 11
The UCR NO2/PAN GC is a research instrument that operates as follows: The analyzer draws ambient air through a sample loop. Once per cycle (one minute cycle time) a valve switches and the sample is pushed into a capillary column using air carrier gas. NO2 and PAN are separated from each other in this column. The separated constituents elute from the column onto a fabric wick wetted with Luminol solution. NO2 and PAN react with Luminol, emitting photons of light proportional to their concentration. The central portion of the wick is viewed by a photomultiplier, the signal of which is proportional to the mixing ratio of NO2 in the air. A particular objective of this audit was to evaluate the performance of this analyzer with respect to the TEI analyzer.
Table 1 Continuous Analyzers Audited
Analyzer Make Pollutants and Model Range, ppm NO, NOx, NO2 TEI 42C 0-0.500 NOy, HNO3 TEI 42C 0-0.500 NO2, PAN UCR NO2/PAN GC 0-0.500
2.2 Sampling Technique Ambient air is drawn into a borosilicate glass sample manifold by means of a blower, located downstream of the manifold. Excess manifold flow is vented through an exit in the bottom of the shelter. The inlet of this manifold is approximately 15 meters above ground level, and one meter above the shelter roof, which satisfies all appropriate EPA probe siting criteria described in 40CFR58, Appendix E. Each analyzer draws its own sample from the manifold through its own Teflon sample line and pump. Each sample line contains a particulate filter in order to keep the internal analyzer pneumatics clean. 2.3 Calibration Equipment for Continuous Analyzers The calibration system for the analyzers audited consists of an Environics 9100 calibrator (dilutor), which is used to perform zero, span, and multipoint calibrations of the continuous analyzers. The calibrator is equipped with mass flow controllers and an ozone generator. Appropriate span concentrations for calibrations are generated by using the calibrator to dilute a multiblend standard gas cylinder. The cylinder certifications were performed by the supplier in accordance with the procedures in the EPA Traceability Protocol for Assay and Certification of Gaseous Calibration Standards (September 1997). The calibrations of the O3 analyzer are performed using a certified ozone transfer standard. 2.4 Data Acquisition Systems The analyzers under audit are interfaced to a computer configured with LabView® data
Quality Assurance Audit Report Fresno Supersite August 28, 2002
Page 3 of 11
acquisition software, which updates the signal from each device at the preset averaging periods listed in Table 1-1 of the QAPP. The averaging period for most continuous analyzers is five minutes. The data are telemetered at least daily to the DRI data processing center in Reno. 2.5 Particulate and Light Scattering Samplers The Supersite contains the samplers listed in Table 1-1 of the QAPP. Nearly all of these samplers received audits of their indicated flow rates and integrity checks. 3.0 CALIBRATION PROCEDURES The calibration procedures for the Fresno Supersite instrumentation are generally described in Section 2.7 and Table 2-6 of the QAPP. Detailed calibration procedures are described in the Standard Operating Procedures (SOPs) for each individual instrument. The calibration gases for the analyzers audited are generated by dilution of standard gas cylinders using the Environics 9100 calibrator. The dilution air and span gas mass flow controllers in the system’s calibrator are periodically calibrated using an authoritative flow rate reference device.
Span concentrations for the UCR NO2 analyzer are generated using the calibration system to perform gas phase titration of NO with O3 while the TEI 42C concurrently samples the same test atmosphere. This procedure consists of first performing a multipoint calibration of the TEI NO and NOx channels using NO only. The calibrator is then set to generate an NO concentration of about 80% of full scale to the TEI 42C analyzer, and the ozone generator is turned on to convert a portion of the NO to NO2. The resulting drop in the NO channel is corrected to true NO concentration and (according to the GPT method) is equal to the input NO2 concentration. Several different ozone lamp settings are used to achieve the desired NO2 concentrations.
During all calibrations the calibrator flow rate and ozone lamp settings are recorded, along with the resulting analyzer responses.
4.0 AUDIT PROCEDURES, EQUIPMENT AND STANDARDS 4.1 Continuous Analyzers The procedures used for the NO/NOx, NO2, NOy and HNO3 analyzer audits met or exceeded the guidelines and requirements in the Quality Assurance Handbook for Air Pollution Measurement Systems (EPA-600-R-94/038b), Section 2.0.12; and 40CFR58, Appendix A. The audit consists of delivering to each analyzer five different concentrations of pollutant, including zero ppm, using a portable audit calibration system. The audit system consists of a standard cylinder, a zero air cylinder, and a calibrator (diluter). The NO audit concentrations are generated by dilution of a standard cylinder using the audit

Quality Assurance Audit Report Fresno Supersite August 28, 2002
Page 4 of 11
calibrator, and the NO2 concentrations are generated using the gas phase titration procedure. The audit gas concentrations enter each analyzer through the same sample line and in-line particulate filters normally encountered by ambient air. After the analyzer response has equilibrated, the analyzer output is read from the data logger and, if necessary, is corrected to reported concentrations. The audit is thus a multipoint comparison between the audit concentrations and the corresponding corrected system analyzer responses. The audit concentrations are generated within the ranges required in the references cited above, with special emphasis on expected ambient concentrations. 4.1.1 Evaluation of Audit Results The percent difference at each concentration is calculated using the following equation:
%Dif. = [(C2 - C1)/C1] Η 100 In this equation and the equation to follow, C1 is the audit concentration and C2 is the corresponding reported (corrected) analyzer concentration. The multipoint comparison data for each channel audited is used to generate a linear regression equation in the following form:
C2 = Slope (C1) + Intercept The slope, intercept, and correlation coefficient (r) are used to evaluate the audit results. The following evaluation guidelines are from the Quality Assurance Handbook for Air Pollution Measurement Systems (EPA-600-R-94/038b), Section 2.0.12: The audit results are satisfactory if the slope is within a 0.850 to 1.150 range, the intercept is within ±3% of the analyzer range, and the correlation coefficient is ∃ 0.9950. The criterion specified in Table 2-6 the QAPP is ±10% for the measurements made with the TEI 42C analyzers, and ±20% for the measurements performed with the UCR NO2/PAN GC. 4.1.2 Audit Equipment for Continuous Analyzers The calibrator used for the audit is a CSI Model 1700. The calibrator contains two mass flow controllers, which provide known flow rates of dilution air from a zero air cylinder and span gas from a standard gas cylinder. Therefore the calibrator is capable of delivering the desired gas concentrations by adjusting each mass flow controller to provide previously determined flow rates. The span gas flow controller has a nominal range of 10-100 standard cubic centimeters per minute (sccm), and the dilution air flow controller has a nominal range of 1000-10,000 sccm. Repeated checks of these mass flow controllers have shown that the calibrations are usually accurate to within ∀1%, and nearly always accurate to within ∀2%. These mass flow controllers were calibrated using a Bios meter on 03/3/02. The calibrator contains an ozone generator, which is used to conduct O3 and NO2 audits. The ozone stream can be directed into the dilution air stream, enabling an O3 audit. The ozone stream may also be directed into a NO span gas stream, enabling NO2 audits by means of the gas
Quality Assurance Audit Report Fresno Supersite August 28, 2002
Page 5 of 11
phase titration (GPT) procedure. The calibrator has a reaction chamber and a mixing chamber of appropriate dimensions, which when taken together with the flow rates used, comply with the EPA requirements for the dynamic reaction parameter specifications for NO2 generation by means of the gas phase titration procedure, as described in the EPA Technical Assistance Document for the Chemiluminescence Measurement of NO2 (EPA-600/4-75-003), December 1975. As required by EPA, high concentration span gases come in contact with only stainless steel, Teflon, and glass. Diluted gases come in contact with only glass or Teflon, and are sampled from the calibrator at ambient pressure. 4.1.3 Audit NO Standard A NIST-traceable gas cylinder containing a nominal concentration 50 ppm NO was used to audit the TEI 42C and UCR Luminol analyzers. Analysis of this cylinder was performed in accordance with the procedures in the EPA Traceability Protocol for Assay and Certification of Gaseous Calibration Standards (Revised September 1997). Documentation of NIST traceability of the standard used for this audit is presented in Table 3 of this report. 4.1.4 Audit NO2 Standard and NO2 Converter Efficiency The audit NO2 concentrations are generated using the gas phase titration (GPT) procedure, which consists of adding O3 to excess NO. Each NO2 concentration is determined using the calibrated NO channel to measure the decrease in the NO concentration after O3 is added to the known NO concentration. All NO2 concentrations are generated in such a way that the remaining NO concentration is within the required 0.080 to 0.120 ppm range. This procedure is described in detail in the Quality Assurance Handbook for Air Pollution Measurement Systems, (EPA-600-R-94/038b), Sections 2.3.2, and Section 2.0.12. The audit of the TEI 42C NO/NOx analyzer calibrated each audit calibrator span gas flow rate and ozone lamp setting with respect to a known NO2 concentration. These same calibrator settings were then used to perform the audit of the NO2 component of the UCR NO2/PAN GC. The NO2 converter efficiency of the TEI 42C NO/NOx analyzer was tested during the gas phase titration procedure. The converter efficiency (CE) is calculated by the equation below:
CE = 100 x [1 - (ΔNOx/ΔNO)] In this equation ΔNOx and ΔNO are the decreases in the NOx and NO concentrations as indicated by the respective analyzer channels when changing from the NO-only test atmosphere to those containing NO and NO2. The CE values for each upscale NO2 concentration are averaged, and the resulting value must be 96% or higher for the converter to pass the test.

Quality Assurance Audit Report Fresno Supersite August 28, 2002
Page 6 of 11
4.2 Particulate and Light Scattering Samplers The samplers are audited using the procedures described in the Quality Assurance Handbook for Air Pollution Measurement Systems (EPA-600-R-94/038b), Sections 2.10.7, and 2.12.10.2. Generally, the audit consists of a test of the accuracy of the sampler's indicated flow rate and a comparison of the sampler's measured flow rates to its design flow rate. In addition, the sampler is inspected for proper operation, leaks, cleanliness, and structural integrity. All gaskets and fittings are inspected, and the sample filter holders are inspected for integrity. The standard used to provide the audit flow rates is a Model HC-1 HC Bios Meter, S/N H810. The Bios Meter is an authoritative volume standard which meets all applicable NIST specifications. The sampler is turned on and allowed to warm up for at least five minutes. Next, the sampler's inlet head is removed, and an adaptor is attached to the downtube to which the audit flow rate measurement standard is connected. The following are then recorded: 1. Ambient temperature in ΕK, and barometric pressure in mm Hg. 2. The flow rates as read by the sampler’s measurement/recording system. 3. The flow rate as read by the audit standard in actual liters per minute (ALM). If the sampler flow rates differ significantly from the target set points, all audit data are recorded without adjustments being made to the sampler flow rates. At that time, with the permission of the operator, the sampler flow rate is adjusted to the correct set point, and the audit is then repeated. If this adjustment to the sampler flow rate is necessary, both sets of audit results (before and after adjustment) are presented in the audit report. If necessary, the indicated sampler flow rates are corrected to ALM, using the latest calibration equations and the ambient temperature and pressure. These corrections to the sampler flow rates are done in the same manner as a routine sample. The corrected sampler flow rate is compared to the corresponding audit flow rate in percent difference, using the following equation: %Dif. = [(S-A)/A] × 100 In this equation, S is the indicated sampler flow rate in actual ALM, and A is the measured audit flow rate in ALM. The ranges for satisfactory results for this test depend on the device under audit, and are presented in Table 2-6 of the QAPP. Generally, however the satisfactory criterion is ±5%. 4.3 System Evaluation The system evaluation consists of an inspection and evaluation of critical on-site air monitoring

Quality Assurance Audit Report Fresno Supersite August 28, 2002
Page 7 of 11
equipment components. This includes a review of the fabrication, assembly and operation of the test systems in their operational mode. The major items reviewed are general system condition, documentation and operations, and the sample intake systems. During this evaluation the auditor looked for anything that could have an adverse effect on the air monitoring system's ability to produce accurate, precise, and reliable data. 5.0 AUDIT RESULTS 5.1 Continuous Analyzers The continuous analyzer audit results presented in Table 2 contain the following information:
1. Each audit concentration (C1) and its resulting reported analyzer concentration (C2) as
read by the data logger for each channel audited. Also shown is the percent difference between each audit and analyzer concentration, which is calculated using the following equation:
%Dif. = [(C2-C1)/C1] Η 100
2. Slope, intercept, and correlation coefficient, r, based on a linear regression between C1
and C2 for each channel audited. These constants are calculated by comparing the audit concentrations (C1) to the corresponding analyzer concentrations (C2) according to the following equation:
C2 = slope (C1) + intercept
C2 is the concentration as would be routinely reported as valid data. It should be noted that the audit standards for all three analyzers were NO or NO2 only. The audit results indicate that with regard to slope, the results for both TEI 42C analyzers are well within the ±10% objective. The 0.747 slope value for the UCR NO2 analyzer is outside the ±20% objective. In addition, the correlation coefficient was 0.987, indicating poor linearity. A comparison of the NO2 data from this analyzer versus the data from the chemiluminescence analyzer is being performed, and will be issued in a separate report. Table 3 presents documentation of the audit NO standard. 5.2 Particulate and Light Scattering Samplers The results of the audits of the particulate samplers are presented in Table 4. All audit results were in the satisfactory ±5% range with the exception of the GT 640A. The operator indicated that the flow rate regulation system on this sampler is relatively unreliable with respect to the

Quality Assurance Audit Report Fresno Supersite August 28, 2002
Page 8 of 11
other devices. The reported flow rate for this device is based on the results of the monthly flow rate check, and is not based on the indicated flow rate. All samplers were in good condition and were operating properly. 5.3 System Evaluation A cursory evaluation of the operation indicated that no significant unsatisfactory audit results were encountered. The following summarizes the results of this evaluation.
• All samplers and sample intake systems are properly sited. • All monitoring equipment was in satisfactory operational condition and was properly
operated. • The time synchronization for all the various systems agreed to within ±2 minutes. • The sample custody documentation for the integrated samples was complete, concise, and
thorough. • All continuous analyzer calibrations are performed in a proper manner and are well
documented. • A calibration of the particle sizing instruments using PSL beads in five different sizes
was observed. The calibration methodology was sound and its documentation was complete.
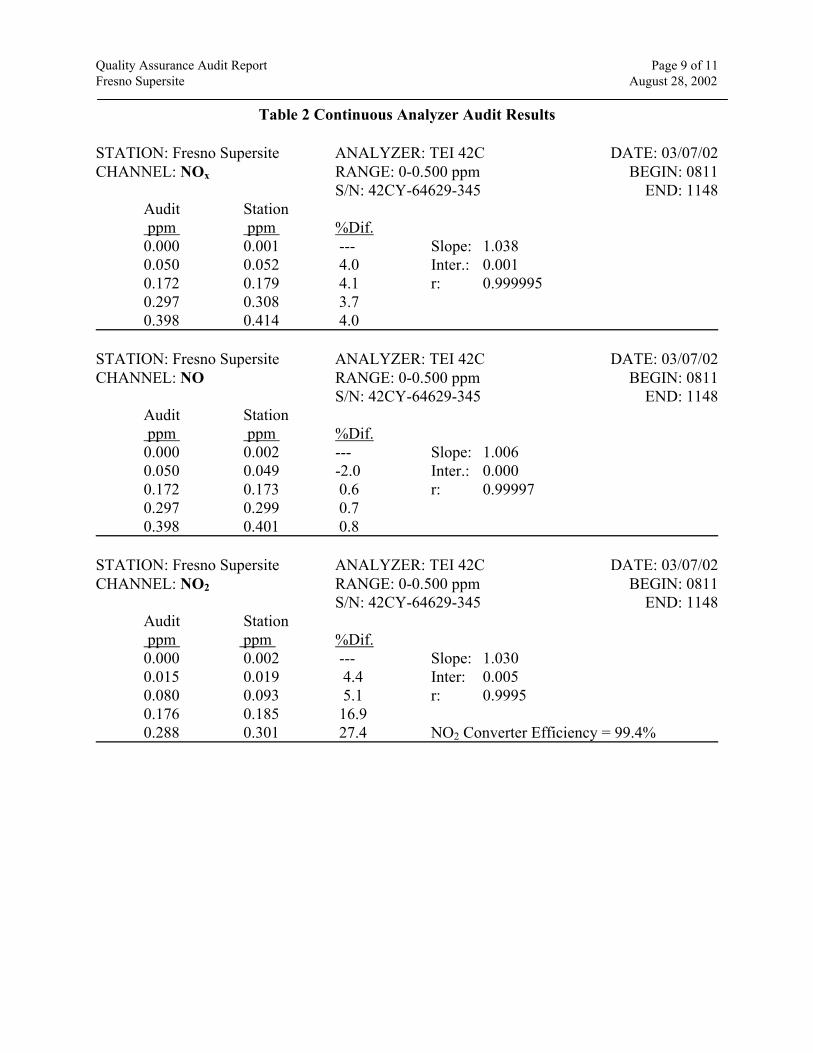
Quality Assurance Audit Report Fresno Supersite August 28, 2002
Page 9 of 11
Table 2 Continuous Analyzer Audit Results STATION: Fresno Supersite ANALYZER: TEI 42C DATE: 03/07/02 CHANNEL: NOx RANGE: 0-0.500 ppm BEGIN: 0811
S/N: 42CY-64629-345 END: 1148 Audit Station ppm ppm %Dif. 0.000 0.001 --- Slope: 1.038 0.050 0.052 4.0 Inter.: 0.001 0.172 0.179 4.1 r: 0.999995 0.297 0.308 3.7 0.398 0.414 4.0
STATION: Fresno Supersite ANALYZER: TEI 42C DATE: 03/07/02 CHANNEL: NO RANGE: 0-0.500 ppm BEGIN: 0811
S/N: 42CY-64629-345 END: 1148 Audit Station ppm ppm %Dif. 0.000 0.002 --- Slope: 1.006 0.050 0.049 -2.0 Inter.: 0.000 0.172 0.173 0.6 r: 0.99997 0.297 0.299 0.7 0.398 0.401 0.8
STATION: Fresno Supersite ANALYZER: TEI 42C DATE: 03/07/02 CHANNEL: NO2 RANGE: 0-0.500 ppm BEGIN: 0811
S/N: 42CY-64629-345 END: 1148 Audit Station ppm ppm %Dif. 0.000 0.002 --- Slope: 1.030 0.015 0.019 4.4 Inter: 0.005 0.080 0.093 5.1 r: 0.9995 0.176 0.185 16.9 0.288 0.301 27.4 NO2 Converter Efficiency = 99.4%
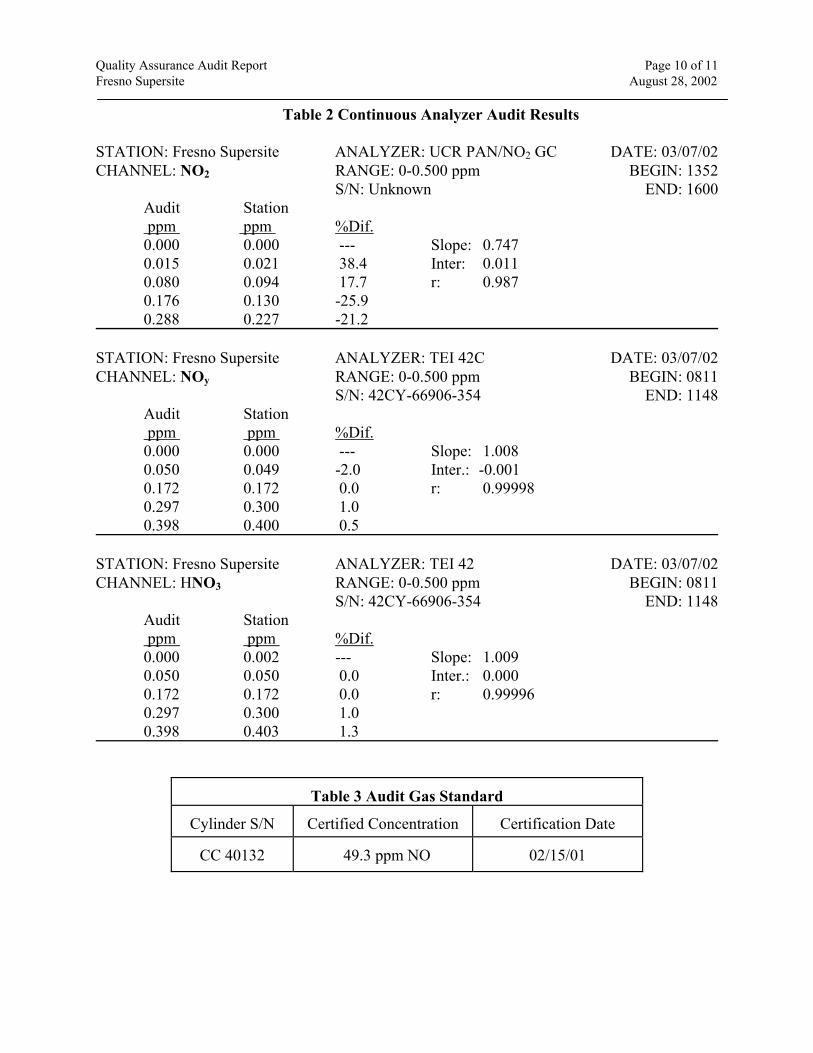
Quality Assurance Audit Report Fresno Supersite August 28, 2002
Page 10 of 11
Table 2 Continuous Analyzer Audit Results STATION: Fresno Supersite ANALYZER: UCR PAN/NO2 GC DATE: 03/07/02 CHANNEL: NO2 RANGE: 0-0.500 ppm BEGIN: 1352
S/N: Unknown END: 1600 Audit Station ppm ppm %Dif. 0.000 0.000 --- Slope: 0.747 0.015 0.021 38.4 Inter: 0.011 0.080 0.094 17.7 r: 0.987 0.176 0.130 -25.9 0.288 0.227 -21.2
STATION: Fresno Supersite ANALYZER: TEI 42C DATE: 03/07/02 CHANNEL: NOy RANGE: 0-0.500 ppm BEGIN: 0811
S/N: 42CY-66906-354 END: 1148 Audit Station ppm ppm %Dif. 0.000 0.000 --- Slope: 1.008 0.050 0.049 -2.0 Inter.: -0.001 0.172 0.172 0.0 r: 0.99998 0.297 0.300 1.0 0.398 0.400 0.5
STATION: Fresno Supersite ANALYZER: TEI 42 DATE: 03/07/02 CHANNEL: HNO3 RANGE: 0-0.500 ppm BEGIN: 0811
S/N: 42CY-66906-354 END: 1148 Audit Station ppm ppm %Dif. 0.000 0.002 --- Slope: 1.009 0.050 0.050 0.0 Inter.: 0.000 0.172 0.172 0.0 r: 0.99996 0.297 0.300 1.0 0.398 0.403 1.3
Table 3 Audit Gas Standard
Cylinder S/N
Certified Concentration
Certification Date
CC 40132
49.3 ppm NO
02/15/01

Quality Assurance Audit Report Fresno Supersite August 28, 2002
Page 11 of 11
Table 4 Particulate Sampler Audit Results
Sampler
Channel
Indicated, ALM
Audit, ALM
Δ%
Andersen RAAS 100 PM2.5;
S/N: 79
16.64
16.58
0.4
Andersen RAAS 100 PM2.5;
S/N: 83
16.75
16.83
-0.5
Andersen 400 PM2.5 Speciation Sampler
1
15.41
15.96
-3.4
2
6.98
6.92
0.9
4
7.34
7.29
0.7
5
8.07
8.17
-1.2
6
7.88
7.68
2.6
Green Tech GT 640A
5.2
4.7
10.6
Aethelometer - PM2.5
Single-
wavelength
7.0
6.77
3.4
Aethelometer - PM2.5
7-
wavelength
7.0
7.13
-1.8
R&P Carbon 5400
16.00
15.45
3.6
OPC System
15.81
15.61
1.3
TEOM PM2.5
16.64
16.96
-1.9
TEOM PM10
16.65
16.26
2.4
BAMS PM10
17.3
16.49
4.9
BAMS PM2.5
16.6
15.9
4.4

QUALITY ASSURANCE AUDIT REPORT FRESNO SUPERSITE OPERATED BY: California Air Resources Board Monitoring and Laboratory Division, Air Quality Surveillance Branch 1927 13th Street Sacramento, CA 95812 Desert Research Institute 2215 Raggio Parkway Reno, NV 89512 Audit Dates: September 17-19, 2002 Prepared by: David Gemmill Quality Assurance Officer College of Engineering Center for Environmental Research and Technology University of California at Riverside Riverside, CA 92507 November 7, 2002

SUMMARY OF AUDIT RESULTS 1. Continuous Analyzers: All audit results were satisfactory. However, the UCR NO2
analyzer indicated a slope of 0.642, but the analyzer response data were taken directly from the data logger and no calibration correction was applied. It should also be noted that this analyzer was repaired the day before the audit. In addition, a study is being performed that compares the data from this analyzer to the data from the TEI 42 analyzer. The results of this study will be issued in a separate report.
2. Particle Count Devices: The Supersite particle counting devices were collocated with a
UCR SEMS. The SEMS provides particle counts within numerous bins within the 0.03 to 0.73 micron range in 75-second increments. The collocation included ambient sampling and a calibration of both systems at zero and 0.27 microns using PSL beads. The results of this collocation will be presented in a separate report.
3. Particulate Samplers: All audit results were satisfactory with the exceptions of the Green
Tech 640A and the new PM2.5 High-Volume sampler. The operator reported that the flow control system for the Green Tech sampler does not work as well as it does for the other samplers. Re-calibration of the hi-vol is recommended, since the ±7% limit was exceeded. However, it is recognized that the experimental errors inherent in this vintage of technology will make it difficult to maintain the flow rates within this range. All samplers were in good condition and were operating properly.
4. System Evaluation: The general system condition, operations, maintenance, and
documentation were evaluated. No significant unsatisfactory audit results were encountered. The procedures followed in the execution of this project are consistent with those described in the QAPP. Overall, the monitoring equipment was in satisfactory operational condition. All instrument calibrations are performed in a proper manner and all documentation is complete, concise, and up to date.
CONTENTS SUMMARY OF AUDIT RESULTS ............................................................................................... i 1.0 INTRODUCTION .....................................................................................................................1 2.0 DESCRIPTION OF MONITORING EQUIPMENT.................................................................1
2.1 Continuous Analyzers....................................................................................................1 2.2 Sampling Technique ......................................................................................................2 2.3 Calibration Equipment for Continuous Analyzers.........................................................2 2.4 Data Acquisition Systems..............................................................................................3 2.5 Particulate and Light Scattering Samplers.....................................................................3
3.0 CALIBRATION PROCEDURES..............................................................................................3 4.0 AUDIT PROCEDURES, EQUIPMENT AND STANDARDS ................................................3
4.1 Continuous Analyzers....................................................................................................3 4.1.1 Evaluation of Audit Results ............................................................................4 4.1.2 Audit Equipment for Continuous Analyzers ..................................................4 4.1.3 Audit NO Standard .........................................................................................5 4.1.4 Audit NO2 Standard and NO2 Converter Efficiency ......................................5
4.2 Particulate and Light Scattering Samplers.....................................................................6 4.2.1 Medium and Low-Volume Samplers..............................................................6 4.2.2 High-Volume Sampler ....................................................................................7
4.2.2.1 Accuracy Test ..................................................................................7 4.2.2.2 Design Flow Rate Test.....................................................................7
4.3 System Evaluation .........................................................................................................8 5.0 AUDIT RESULTS.....................................................................................................................8
5.1 Continuous Analyzers....................................................................................................8 5.2 Particulate and Light Scattering Samplers.....................................................................9 5.3 System Evaluation .........................................................................................................9 5.4 ARB Audit Results ......................................................................................................10
TABLES Table 1 Supersite Continuous Analyzers.........................................................................................2 Table 2 Continuous Analyzer Audit Results .................................................................................11 Table 3 Audit Gas Standard...........................................................................................................13 Table 4 Particulate Sampler Audit Results ....................................................................................14 Table 5 ARB Audit Results ...........................................................................................................15

Quality Assurance Audit Report Fresno Supersite November 7, 2002
Page 1 of 15
1.0 INTRODUCTION
This report contains the results of a quality assurance audit of selected components of the Fresno Supersite, a research ambient air monitoring station operated jointly by the Desert Research Institute (DRI) and the California Air Resources Board (ARB). The station is operated per the Quality Assurance Project Plan for the Fresno Supersite – Phase II, Revision 1, dated April 2001 (QAPP). The main purpose of the Supersite is to operate research-grade air monitoring instruments to improve understanding of measurement technologies, source contributions and control strategies, with a special emphasis on the effects of suspended particulates on health. Detailed goals and objectives of the Supersite are presented in the QAPP. The Fresno Supersite is one of seven such facilities within the continental United States, all funded by the U.S. Environmental Protection Agency (EPA). The Supersite research instruments are installed at the same monitoring location as the equipment for a compliance monitoring station operated by the ARB.
Mr. David Gemmill of the University of California at Riverside College of Engineering
Center for Environmental Research and Technology (CE-CERT) performed the audit during the period of September 17-19, 2002. Performance audits were conducted in the following areas:
1. Continuous analyzers for monitoring oxides of nitrogen (NOx), nitric oxide (NO), nitric acid (HNO3), total reactive nitrogen compounds (NOy), and nitrogen dioxide (NO2).
2. The fine particle count system was audited by collocation with a UCR SEMS. The results
of this collocation will be presented in a separate report. 3. Flow rates of filter-based and continuous particulate and light scattering samplers for the
monitoring of PM2.5 (mass and chemical species), PM10, particle counts (within specific aerodynamic size ranges), elemental carbon and organic carbon.
4. General system evaluation.
ARB QA personnel conduct routine performance audits of the station’s meteorological instruments and criteria pollutant measurements. The latest such audit was performed on July 15 and 17, 2002. The results from this audit were all satisfactory and are summarized in this report.
Present for the audit was Mr. Scott Scheller of ARB, principal operator of the Fresno Supersite, and Mr. Pat Seames, principal operator of the Fresno SLAMS site. Their cooperation and assistance are gratefully acknowledged. 2.0 DESCRIPTION OF MONITORING EQUIPMENT 2.1 Continuous Analyzers

Quality Assurance Audit Report Fresno Supersite November 7, 2002
Page 2 of 15
At the time of the audit the Supersite contained the continuous analyzers listed in Table 1 below. Where applicable, the analyzers are reference or equivalent methods for the monitoring of their respective pollutants according to the criteria specified in 40CFR53.
Table 1. Supersite Continuous Analyzers
Make and Model Serial Number Pollutant(s) TEI 42 NO-NO2-NOx TEI 42C 42CY 64629-345 NO-NOz-NOy TEI 42C 42CY 66906-354 NO-HNO3 TEI 55C CH4-NMHC API 400 180 O3 API 100A 461 SO2 UC Riverside GC NO2/PAN Xontec 910A NMOC Xontec 925 Carbonyl Dasibi 3008 CO
2.2 Sampling Technique
Ambient air is drawn by means of a separate sample line for each analyzer. The inlet of each sample line is set up to preclude rain from entering the sampling system. Each inlet is approximately 11 meters above ground level, and one meter above the shelter roof, which satisfies the appropriate EPA probe siting criteria described in 40CFR58, Appendix E. Each analyzer draws its own sample through its own Teflon sample line and pump. Each sample line contains a particulate filter in order to keep the internal analyzer pneumatics clean. 2.3 Calibration Equipment for Continuous Analyzers
The calibration system consists of an Environics 9100 calibrator (dilutor), a zero air generation system, standard gas cylinders, and a certified ozone transfer standard. The calibrator is equipped with mass flow controllers and an ozone generator, and is configured with the zero air system and cylinders in order to perform zero, span, and multipoint calibrations of the continuous analyzers. Where applicable, the cylinder certifications are performed by the supplier in accordance with the procedures in the EPA Traceability Protocol for Assay and Certification of Gaseous Calibration Standards (September 1997). The calibrations of the O3 analyzer are performed using the certified ozone transfer standard, which is maintained according to EPA's Technical Assistance Documents: Transfer Standards for the Calibration of Air Monitoring Analyzers for Ozone (EPA-600/4-79-056), September 1979, and Technical Assistance Document for the Calibration of Ambient Ozone Monitors (EPA-600/4-79-057), September 1979. 2.4 Data Acquisition Systems

Quality Assurance Audit Report Fresno Supersite November 7, 2002
Page 3 of 15
The analyzers are interfaced to a computer configured with LabView® data acquisition software, which updates the signal from each device at the preset averaging periods listed in Table 1-1 of the QAPP. The averaging period for most continuous gas analyzers and particulate samplers is five minutes. The data are telemetered at least daily to the DRI data processing center in Reno. 2.5 Particulate and Light Scattering Samplers
The Supersite contains the samplers listed in Table 1-1 of the QAPP. Nearly all of these samplers received audits of their indicated flow rates and integrity checks. 3.0 CALIBRATION PROCEDURES
The calibration procedures for the Fresno Supersite instrumentation are generally described in Section 2.7 and Table 2-6 of the QAPP. Detailed calibration procedures are described in the Standard Operating Procedures (SOPs) for each individual instrument.
The calibration gases for the continuous gas analyzers are generated by dilution of standard gas cylinders using the Environics 9100 calibrator. The dilution air and span gas mass flow controllers in the system’s calibrator are periodically calibrated using an authoritative flow rate reference device.
Span concentrations for the UCR NO2 analyzer are generated using the calibration system
to perform gas phase titration of NO with O3 while the TEI 42C concurrently samples the same test atmosphere. This procedure consists of first performing a multipoint calibration of the TEI NO and NOx channels using NO only. The calibrator is then set to generate an NO concentration of about 80% of full scale to the TEI 42C analyzer, and the ozone generator is turned on to convert a portion of the NO to NO2. The resulting drop in the NO channel is corrected to true NO concentration and (according to the GPT method) is equal to the input NO2 concentration. Several different ozone lamp settings are used to achieve the desired NO2 concentrations.
During all calibrations the calibrator flow rate and ozone lamp settings are recorded,
along with the resulting analyzer responses. Converter efficiency checks of the NOy analyzer are performed daily using an n-propyl
nitrate (NPN) cylinder.
4.0 AUDIT PROCEDURES, EQUIPMENT AND STANDARDS 4.1 Continuous Analyzers
The procedures used for the NO/NOx, NO2, NOy, HNO3, and O3 analyzer audits met or exceeded the guidelines and requirements in the Quality Assurance Handbook for Air Pollution Measurement Systems (EPA-600-R-94/038b), Section 2.0.12; and 40CFR58, Appendix A. The

Quality Assurance Audit Report Fresno Supersite November 7, 2002
Page 4 of 15
audit consists of delivering to each analyzer at least five different concentrations of pollutant, including zero ppm, using a portable audit calibration system. The audit system consists of a standard NO cylinder, a zero air cylinder, a calibrator (diluter), and a certified ozone transfer standard.
The NO audit concentrations are generated by dilution of a standard cylinder using the audit calibrator, and the NO2 concentrations are generated using the gas phase titration procedure. The audit gas concentrations enter each analyzer through the same sample line and in-line particulate filters normally encountered by ambient air. After the analyzer response has equilibrated, the analyzer output is read from the data logger and, if necessary, is corrected to reported concentrations. The audit is thus a multipoint comparison between the audit concentrations and the corresponding corrected system analyzer responses. The audit concentrations are generated within the ranges required in the references cited above, with special emphasis on expected ambient concentrations. 4.1.1 Evaluation of Audit Results
The percent difference at each concentration is calculated using the following equation:
%Dif. = [(C2 - C1)/C1] Η 100
In this equation and the equation to follow, C1 is the audit concentration and C2 is the corresponding reported (corrected) analyzer concentration. The multipoint comparison data for each channel audited is used to generate a linear regression equation in the following form:
C2 = Slope (C1) + Intercept
The slope, intercept, and correlation coefficient (r) are used to evaluate the audit results. The following evaluation guidelines are from the Quality Assurance Handbook for Air Pollution Measurement Systems (EPA-600-R-94/038b), Section 2.0.12: The audit results are satisfactory if the slope is within a 0.850 to 1.150 range, the intercept is within ±3% of the analyzer range, and the correlation coefficient is ∃ 0.9950. The criterion specified in Table 2-6 the QAPP is ±10% for the measurements made with the oxides of nitrogen and ozone analyzers, and ±20% for the measurements performed with the UCR NO2/PAN GC. 4.1.2 Audit Equipment for Continuous Analyzers
The calibrator used for the audit is a CSI Model 1700. The calibrator contains two mass flow controllers, which provide known flow rates of dilution air from a zero air cylinder and span gas from a standard gas cylinder. Therefore the calibrator is capable of delivering the desired gas concentrations by adjusting each mass flow controller to provide previously determined flow rates. The span gas flow controller has a nominal range of 10-100 standard cubic centimeters per minute (sccm), and the dilution air flow controller has a nominal range of 1000-10,000 sccm. Repeated checks of these mass flow controllers have shown that the

Quality Assurance Audit Report Fresno Supersite November 7, 2002
Page 5 of 15
calibrations are usually accurate to within ∀1%, and nearly always accurate to within ∀2%. These mass flow controllers were calibrated using a Bios meter on 09/15/02.
The calibrator contains an ozone generator, which is used to conduct O3 and NO2 audits. The ozone stream can be directed into the dilution air stream, enabling an O3 audit. The ozone stream may also be directed into a NO span gas stream, enabling NO2 audits by means of the gas phase titration (GPT) procedure. The calibrator has a reaction chamber and a mixing chamber of appropriate dimensions, which when taken together with the flow rates used, comply with the EPA requirements for the dynamic reaction parameter specifications for NO2 generation by means of the gas phase titration procedure, as described in the EPA Technical Assistance Document for the Chemiluminescence Measurement of NO2 (EPA-600/4-75-003), December 1975.
As required by EPA, high concentration span gases come in contact with only stainless steel, Teflon, and glass. Diluted gases come in contact with only glass or Teflon, and are sampled from the calibrator at ambient pressure. 4.1.3 Audit NO Standard
A NIST-traceable gas cylinder containing a nominal concentration 50 ppm NO was used to audit the TEI 42C and UCR Luminol analyzers. Analysis of this cylinder was performed in accordance with the procedures in the EPA Traceability Protocol for Assay and Certification of Gaseous Calibration Standards (Revised September 1997). Documentation of NIST traceability of the standard used for this audit is presented in Table 3 of this report. 4.1.4 Audit NO2 Standard and NO2 Converter Efficiency
The audit NO2 concentrations are generated using the gas phase titration (GPT) procedure, which consists of adding O3 to excess NO. Each NO2 concentration is determined using the calibrated NO channel to measure the decrease in the NO concentration after O3 is added to the known NO concentration. All NO2 concentrations are generated in such a way that the remaining NO concentration is within the required 0.080 to 0.120 ppm range. This procedure is described in detail in the Quality Assurance Handbook for Air Pollution Measurement Systems, (EPA-600-R-94/038b), Sections 2.3.2, and Section 2.0.12.
The audit of the TEI 42C NO/NOx analyzer effectively calibrated each audit calibrator span gas flow rate and ozone lamp setting with respect to a known NO2 concentration. These same calibrator settings were then used to perform the audit of the NO2 component of the UCR NO2/PAN GC.
The NO2 converter efficiency of the TEI 42C NO/NOx analyzer was tested during the gas phase titration procedure. The converter efficiency (CE) is calculated by the equation below:
CE = 100 x [1 - (ΔNOx/ΔNO)]

Quality Assurance Audit Report Fresno Supersite November 7, 2002
Page 6 of 15
In this equation ΔNOx and ΔNO are the decreases in the NOx and NO concentrations as
indicated by the respective analyzer channels when changing from the NO-only test atmosphere to those containing NO and NO2. The CE values for each upscale NO2 concentration are averaged, and the resulting value must be 96% or higher for the converter to pass the test. 4.2 Particulate and Light Scattering Samplers
The samplers are audited using the procedures described in the Quality Assurance Handbook for Air Pollution Measurement Systems (EPA-600-R-94/038b), Sections 2.10.7, 2.11.7, and 2.12.10.2. Generally, the audit consists of a test of the accuracy of the sampler's indicated flow rate and a comparison of the sampler's measured flow rates to its design flow rate. In addition, the sampler is inspected for proper operation, leaks, cleanliness, and structural integrity. All gaskets and fittings are inspected, and the sample filter holders are inspected for integrity. 4.2.1 Medium and Low-Volume Samplers
The standard used to provide the audit flow rates is a Bios DC-Lite Primary Flow Meter, S/N 5828. The Bios Meter is an authoritative volume standard which meets all applicable NIST specifications.
The sampler is turned on and allowed to warm up for at least five minutes. Next, the sampler's inlet head is removed, and an adaptor is attached to the downtube to which the audit flow rate measurement standard is connected. The following are then recorded:
1. Ambient temperature in ΕK, and barometric pressure in mm Hg. 2. The flow rates as read by the sampler’s measurement/recording system. 3. The flow rate as read by the audit standard in actual liters per minute (ALM).
If the sampler flow rates differ significantly from the target set points, all audit data are
recorded without adjustments being made to the sampler flow rates. At that time, with the permission of the operator, the sampler flow rate is adjusted to the correct set point, and the audit is then repeated. If this adjustment to the sampler flow rate is necessary, both sets of audit results (before and after adjustment) are presented in the audit report.
If necessary, the indicated sampler flow rates are corrected to ALM, using the latest calibration equations and the ambient temperature and pressure. These corrections to the sampler flow rates are done in the same manner as a routine sample. The corrected sampler flow rate is compared to the corresponding audit flow rate in percent difference, using the following equation: %Dif. = [(S-A)/A] × 100

Quality Assurance Audit Report Fresno Supersite November 7, 2002
Page 7 of 15
In this equation, S is the indicated sampler flow rate in actual ALM, and A is the measured audit flow rate in ALM. The ranges for satisfactory results for this test depend on the device under audit, and are presented in Table 2-6 of the QAPP. Generally, however, the satisfactory criterion is ±5%. 4.2.2 High-Volume Sampler The PM10 sampler is audited using the procedures described in the Quality Assurance Handbook for Air Pollution Measurement Systems (EPA-600/4-44-027a), Section 2.2.8.1 (January 1983), Section 2.0.12.11 (June 1984), and Section 2.11.7 (January 1990). The audit consists of two parts: (A) A test of the accuracy of the sampler's indicated flow rate, and (B) A test of the sampler's flow rate to its design flow of 40 actual cubic feet per minute (ACFM). The sampler is also inspected for proper operation, cleanliness and structural integrity. All gaskets are inspected, and the sample filter holders are inspected for integrity. An audit orifice plate is placed on the sampler inlet with a sample filter in place. The sampler is then turned on and allowed to warm up for at least five minutes, when the following data are recorded: 1. Audit orifice pressure drop in inches of water. 2. Ambient temperature in degrees K and barometric pressure in mm Hg. 3. Indicated sampler flow rate with the audit orifice attached. 4. Indicated sampler flow rate with the audit orifice removed. The audit orifice plate, manufactured by General Metal Works, was certified on 8/21/02 using a Dresser Roots Meter, S/N 7659995, according to the method described in the Quality Assurance Handbook for Air Pollution Measurement Systems (EPA-600/4-44-027a), Section 2.11.2 (January 1990). The certification information for the orifice plate used for the audit is documented in the audit report. The Roots meter is an "authoritative volume" standard, which meets all applicable NIST specifications. 4.2.1.1 Accuracy Test The audit flow rate is calculated in actual conditions, and is compared to the corresponding indicated sampler flow rate in percent difference, according to the following equation: %Dif. = [(Sw-A)/A] x 100 In this equation, Sw is the indicated sampler flow rate in ACFM with the audit orifice attached, and A is the measured audit flow rate in ACFM. The range for satisfactory results for this test is a difference of ±7% or less. 4.2.1.2 Design Flow Rate Test

Quality Assurance Audit Report Fresno Supersite November 7, 2002
Page 8 of 15
The indicated sampler flow rate without the audit orifice is corrected to true flow rate, using the result of the accuracy test described above. This true flow rate is then compared to 40.0 ACFM, which is the flow at which the sampler was designed to operate. This is done using the following equation: %Dif. = {{[1-(%Dif./100)][Sw/o] –40.0}/40.0} x 100 In this equation, %Dif. is obtained from the equation in Section 4.3.1, and Sw/o is the indicated sampler flow rate without the audit orifice plate attached. The range for satisfactory results for the design flow test is a difference of ±10% or less. 4.3 System Evaluation
The system evaluation consists of an inspection and evaluation of critical on-site air monitoring equipment components. This includes a review of the fabrication, assembly and operation of the test systems in their operational mode. The major items reviewed are general system condition, documentation and operations, and the sample intake systems. During this evaluation the auditor looked for anything that could have an adverse effect on the air monitoring system's ability to produce accurate, precise, and reliable data. 5.0 AUDIT RESULTS 5.1 Continuous Analyzers
The continuous analyzer audit results presented in Table 2 contain the following information:
1. Each audit concentration (C1) and its resulting reported analyzer concentration (C2) as
read by the data logger for each channel audited. Also shown is the percent difference between each audit and analyzer concentration, which is calculated using the following equation:
%Dif. = [(C2-C1)/C1] Η 100
2. Slope, intercept, and correlation coefficient, r, based on a linear regression between C1
and C2 for each channel audited. These constants are calculated by comparing the audit concentrations (C1) to the corresponding analyzer concentrations (C2) according to the following equation:
C2 = slope (C1) + intercept
C2 is the concentration as would be routinely reported as validated data.
It should be noted that the audit standards for all three TEI analyzers and UCR analyzer
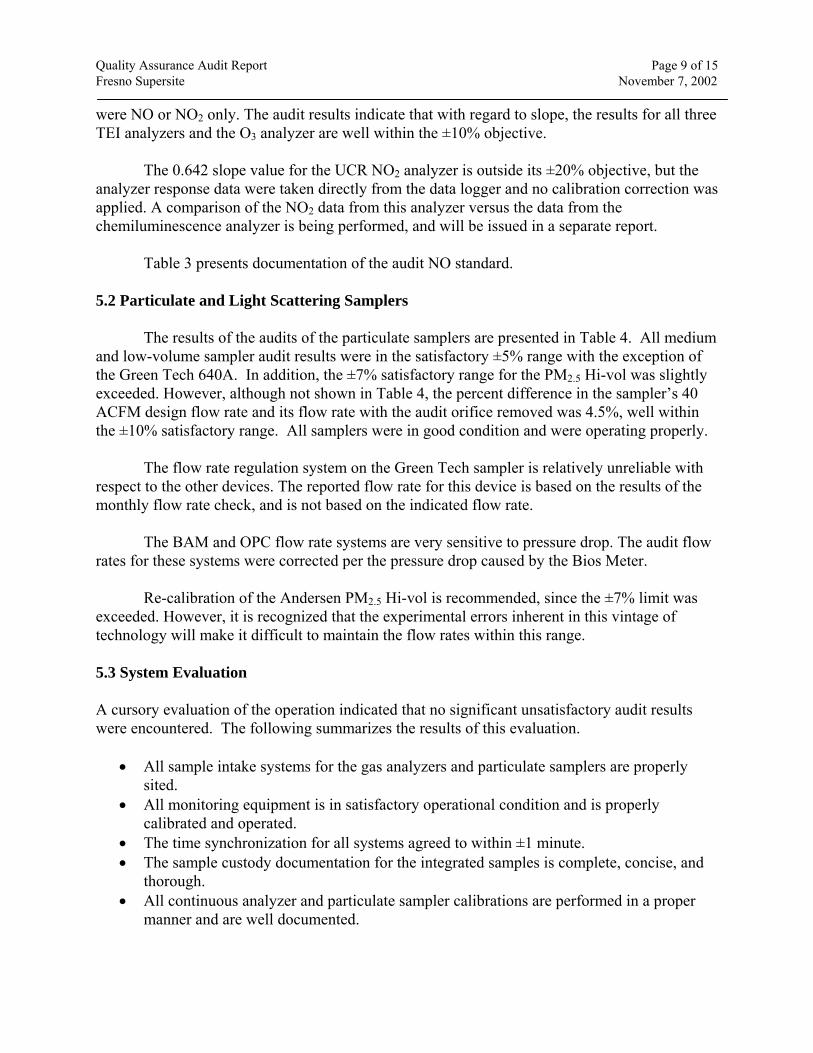
Quality Assurance Audit Report Fresno Supersite November 7, 2002
Page 9 of 15
were NO or NO2 only. The audit results indicate that with regard to slope, the results for all three TEI analyzers and the O3 analyzer are well within the ±10% objective.
The 0.642 slope value for the UCR NO2 analyzer is outside its ±20% objective, but the analyzer response data were taken directly from the data logger and no calibration correction was applied. A comparison of the NO2 data from this analyzer versus the data from the chemiluminescence analyzer is being performed, and will be issued in a separate report.
Table 3 presents documentation of the audit NO standard. 5.2 Particulate and Light Scattering Samplers
The results of the audits of the particulate samplers are presented in Table 4. All medium and low-volume sampler audit results were in the satisfactory ±5% range with the exception of the Green Tech 640A. In addition, the ±7% satisfactory range for the PM2.5 Hi-vol was slightly exceeded. However, although not shown in Table 4, the percent difference in the sampler’s 40 ACFM design flow rate and its flow rate with the audit orifice removed was 4.5%, well within the ±10% satisfactory range. All samplers were in good condition and were operating properly.
The flow rate regulation system on the Green Tech sampler is relatively unreliable with
respect to the other devices. The reported flow rate for this device is based on the results of the monthly flow rate check, and is not based on the indicated flow rate.
The BAM and OPC flow rate systems are very sensitive to pressure drop. The audit flow
rates for these systems were corrected per the pressure drop caused by the Bios Meter. Re-calibration of the Andersen PM2.5 Hi-vol is recommended, since the ±7% limit was
exceeded. However, it is recognized that the experimental errors inherent in this vintage of technology will make it difficult to maintain the flow rates within this range. 5.3 System Evaluation A cursory evaluation of the operation indicated that no significant unsatisfactory audit results were encountered. The following summarizes the results of this evaluation.
• All sample intake systems for the gas analyzers and particulate samplers are properly sited.
• All monitoring equipment is in satisfactory operational condition and is properly calibrated and operated.
• The time synchronization for all systems agreed to within ±1 minute. • The sample custody documentation for the integrated samples is complete, concise, and
thorough. • All continuous analyzer and particulate sampler calibrations are performed in a proper
manner and are well documented.

Quality Assurance Audit Report Fresno Supersite November 7, 2002
Page 10 of 15
• A calibration of the particle sizing instruments using PSL beads in five different sizes was observed. The calibration methodology is sound and its documentation is concise and complete.
5.4 ARB Audit Results Table 5 presents a summary of the results of an audit of the Fresno Supersite performed by ARB QA personnel on July 15 and 17, 2002. As indicated in the table, all audit results were satisfactory.
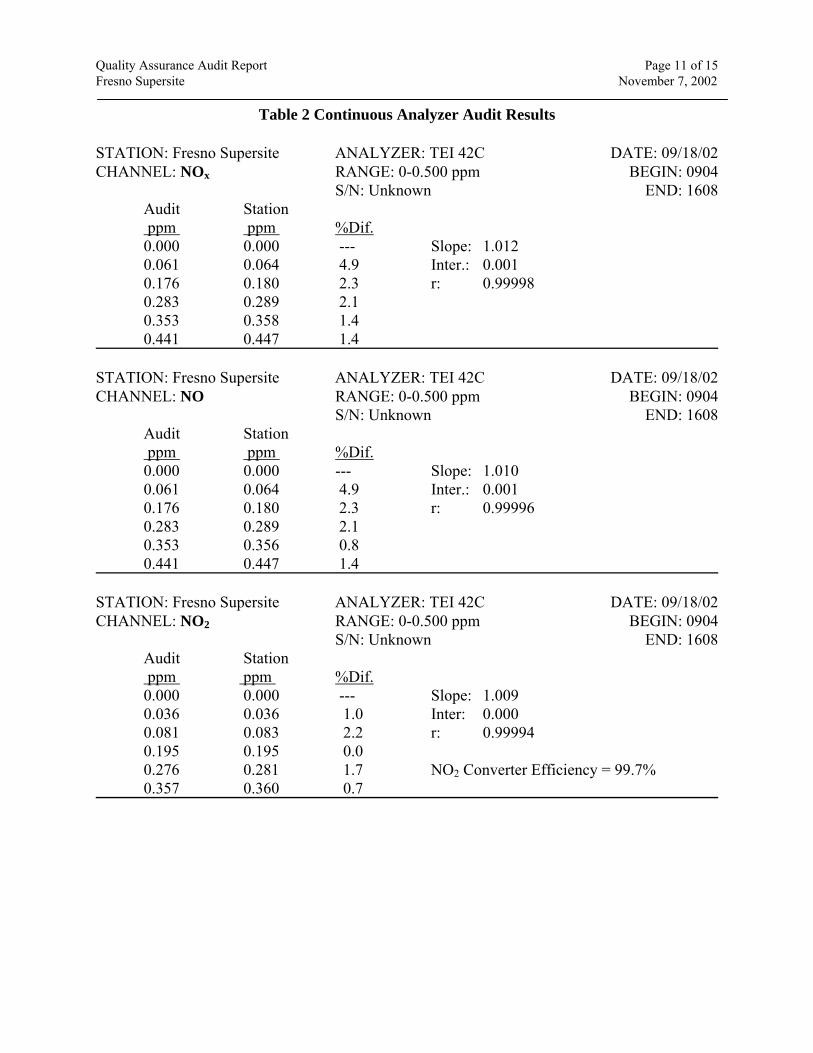
Quality Assurance Audit Report Fresno Supersite November 7, 2002
Page 11 of 15
Table 2 Continuous Analyzer Audit Results STATION: Fresno Supersite ANALYZER: TEI 42C DATE: 09/18/02 CHANNEL: NOx RANGE: 0-0.500 ppm BEGIN: 0904
S/N: Unknown END: 1608 Audit Station ppm ppm %Dif. 0.000 0.000 --- Slope: 1.012 0.061 0.064 4.9 Inter.: 0.001 0.176 0.180 2.3 r: 0.99998 0.283 0.289 2.1 0.353 0.358 1.4 0.441 0.447 1.4
STATION: Fresno Supersite ANALYZER: TEI 42C DATE: 09/18/02 CHANNEL: NO RANGE: 0-0.500 ppm BEGIN: 0904
S/N: Unknown END: 1608 Audit Station ppm ppm %Dif. 0.000 0.000 --- Slope: 1.010 0.061 0.064 4.9 Inter.: 0.001 0.176 0.180 2.3 r: 0.99996 0.283 0.289 2.1 0.353 0.356 0.8 0.441 0.447 1.4
STATION: Fresno Supersite ANALYZER: TEI 42C DATE: 09/18/02 CHANNEL: NO2 RANGE: 0-0.500 ppm BEGIN: 0904
S/N: Unknown END: 1608 Audit Station ppm ppm %Dif. 0.000 0.000 --- Slope: 1.009 0.036 0.036 1.0 Inter: 0.000 0.081 0.083 2.2 r: 0.99994 0.195 0.195 0.0 0.276 0.281 1.7 NO2 Converter Efficiency = 99.7% 0.357 0.360 0.7

Quality Assurance Audit Report Fresno Supersite November 7, 2002
Page 12 of 15
Table 2 Continuous Analyzer Audit Results STATION: Fresno Supersite ANALYZER: UCR PAN/NO2 GC DATE: 09/18/02 CHANNEL: NO2 RANGE: 0-0.500 ppm BEGIN: 0904
S/N: Unknown END: 1608 Audit Station ppm ppm %Dif. 0.000 0.000 --- Slope: 0.642 0.036 0.032 -10.2 Inter: 0.009 0.081 0.067 -17.5 r: 0.99668 0.195 0.143 -26.7 0.276 0.190 -31.2 0.357 0.230 -35.6
STATION: Fresno Supersite ANALYZER: TEI 42C DATE: 09/18/02 CHANNEL: NOy RANGE: 0-0.500 ppm BEGIN: 0904
S/N: 42CY-66906-354 END: 1608 Audit Station ppm ppm %Dif. 0.000 0.001 --- Slope: 1.028 0.061 0.065 6.6 Inter.: 0.002 0.176 0.184 4.5 r: 0.99993 0.283 0.297 4.9 0.353 0.363 2.8 Converter Efficiency: 98.5% 0.441 0.455 3.2
STATION: Fresno Supersite ANALYZER: TEI 42 DATE: 09/18/02 CHANNEL: HNO3 RANGE: 0-0.500 ppm BEGIN: 0904
S/N: 42CY-66906-354 END: 1608 Audit Station ppm ppm %Dif. 0.000 0.000 --- Slope: 1.027 0.061 0.063 2.7 Inter.: 0.001 0.176 0.181 2.3 r: 0.99994 0.283 0.295 4.2 0.353 0.361 2.3 Converter Efficiency: 98.7% 0.441 0.453 2.7

Quality Assurance Audit Report Fresno Supersite November 7, 2002
Page 13 of 15
Table 2 Continuous Analyzer Audit Results STATION: Fresno Supersite ANALYZER: TEI 42C DATE: 09/18/02 CHANNEL: NOy RANGE: 0-0.500 ppm BEGIN: 0904
S/N: 42CY-64629-345 END: 1608 Audit Station ppm ppm %Dif. 0.000 0.002 --- Slope: 1.050 0.061 0.068 11.5 Inter.: 0.003 0.176 0.191 8.5 r: 0.9996 0.283 0.302 6.7 0.353 0.365 3.4 Converter Efficiency: 99.4% 0.441 0.471 6.8
STATION: Fresno Supersite ANALYZER: TEI 42 DATE: 09/18/02 CHANNEL: NO RANGE: 0-0.500 ppm BEGIN: 0904
S/N: 42CY-64629-345 END: 1608 Audit Station ppm ppm %Dif. 0.000 0.000 --- Slope: 1.040 0.061 0.065 6.6 Inter.: 0.001 0.176 0.186 5.7 r: 0.9998 0.283 0.297 4.9 0.353 0.363 2.8 0.441 0.462 4.8
STATION: Fresno Supersite ANALYZER: API 400 DATE: 09/19/02 CHANNEL: O3 RANGE: 0-0.500 ppm BEGIN: 0717
S/N: 180 END: 0849 Audit Station ppm ppm %Dif. 0.000 0.003 --- Slope: 1.003 0.081 0.084 3.7 Inter: 0.003 0.192 0.196 2.1 r: 0.9998 0.281 0.280 -0.5 0.356 0.363 2.0
Table 3 Audit Gas Standard
Cylinder S/N Certified Concentration
Certification Date
CC 40132
49.3 ppm NO
02/15/01

Quality Assurance Audit Report Fresno Supersite November 7, 2002
Page 14 of 15
Table 4 Particulate Sampler Audit Results
Sampler
Channel or S/N
Indicated,
ALM
Audit, ALM
% Dif R&P 5400 Carbon 15.20 15.55 -2.3
BAM PM2.5 16.3 16.2 0.6 BAM PM10 15.9 16.2 -1.8
TEOM PM10 Total 16.66 16.69 -0.2 TEOM PM2.5 Total 16.60 17.21 -3.5 TEOM PM10 Main 2.99 2.94 1.7 TEOM PM2.5 Main 3.10 2.99 3.7
Andersen RAAS 100 PM2.5 00079 16.62 16.82 -1.2 Andersen RAAS 100 PM2.5 00083 16.65 16.48 1.0
Minivol 1315 5.013 5.033 -0.4 Minivol 1259 5.030 5.095 -1.3 Minivol 1325 5.100 5.161 -1.2 Minivol 1183 5.025 5.017 -0.2 Minivol 1177 5.205 5.281 -1.4
Green Tech GT-640A 5.33 4.61 15.6 OPC System 16.4 15.7 4.5 Aethelometer Single wave 6.9 7.1 -2.8 Aethelometer Seven wave 7.0 6.9 1.4
Andersen 321A Hi-vol with PM2.5 inlet
38.9 CFM 41.9 CFM -7.2
Standards used for audits:
a. Bios DC-Lite Primary Flow Meter, S/N 58282. b. Graseby Hi-Vol Orifice Plate, certified 9/1/02 using a Roots Meter

Quality Assurance Audit Report Fresno Supersite November 7, 2002
Page 15 of 15
Table 5 ARB Audit Results Gas Analyzers
Measurement Audit Value, ppm Station Response, ppm % Dif. O3 0.364 0.350 -3.8
0.158 0.150 -5.1 0.062 0.058 -6.5
NMHC 0.600 0.610 1.7 1.17 1.16 -0.9 1.77 1.75 -1.1
CO 7.16 7.20 0.6 18.3 18.1 -1.0 37.3 37.9 1.7
SO2 0.071 0.073 2.8 0.182 0.184 1.1 0.370 0.370 0.0
NO2 0.063 0.065 3.2 0.180 0.181 0.6 0.376 0.377 0.3
Particulate Samplers
Measurement Audit Value Station Response %Dif. PM10 41.3 ACFM 40.9 ACFM -1.0 BAM 17.20 L/M 16.7 L/M -2.9 PM2.5 16.78 L/M 16.68 L/M -0.6
Meteorological Instruments
Measurement Audit Value Station Response Dif. Barometric Pressure 750 mm Hg 750 mm Hg 0 mm Hg
Wind Direction 090° 091° 1° 180° 182° 2° 270° 272° 2° 355° 359° 4°
Horizontal Wind Speed 0.27 mph 0.23 mph -0.04 mph 5.60 mph 5.58 mph -0.36 mph 10.93 mph 10.91 mph -0.18 mph 16.26 mph 16.23 mph -0.18 mph 32.25 mph 32.20 mph -0.16 mph
Temperature 44.1°C 44.1°C 0.0°C 26.5°C 26.4°C -0.1°C 0.4°C 0.4°C 0.0°C
Relative Humidity 91.5% 89.9% -1.6% 62.4% 65.0% 2.6% 32.1% 37.0% 4.9%