quality assurance project plan - tacomacms.cityoftacoma.org/surfacewater/npdes0311/c4.pdf ·...
TRANSCRIPT

Section S8 Monitoring Program
Quality Assurance Project Plan Phase I Municipal Stormwater NPDES Permit Permit No.: WAR04-4003
Revision: S8-004 Final Revision Date: 03/31/2011
Prepared by: City of Tacoma Tacoma, Washington

S8 Program – Phase I Municipal Stormwater NPDES Permit Page i Quality Assurance Project Plan
This page intentionally left blank.


S8 Program – Phase I Municipal Stormwater NPDES Permit Page iii Quality Assurance Project Plan
This page intentionally left blank.

S8 Program – Phase I Municipal Stormwater NPDES Permit Page iv Quality Assurance Project Plan
2 DISTRIBUTION LIST
Title: Name (Affiliation):
Telephone No./email address:
Regional Contact
No. of copies:
Vincent McGowan (Ecology)
360.407.7320 [email protected]
2 (paper) 1 (electronic)
QA Coordinator Chris Burke (ESSE EC)
253.502.2247 [email protected]
1
Laboratory QAO Chris Getchell (Tacoma Laboratory)
253.502.2130 [email protected]
1
Program Manager Dana de Leon, P.E. (ESSE SW)
253.502.2109 [email protected]
1
Laboratory QAO Mary Ann Rempel-Hester (Nautilus Environmental)
253. 922.4296 [email protected]
1
Field Supervisor Rick Fuller (ESSE EC)
253.502.2129 [email protected]
1

S8 Program – Phase I Municipal Stormwater NPDES Permit Page v Quality Assurance Project Plan
ACRONYMS BMP Best Management Practice CAR Corrective Action Report COC Chain of Custody CV Coefficient of Variation DQI Data Quality Indicator DQO Data Quality Objective EPA Environmental Protection Agency GIS Geographic Information System MDL Method Detection Limit MDRD Minimum Detectable Relative Difference MQO Measurement Quality Objective MS4 Municipal Separate Storm Sewer Systems NCR Nonconformance Report NELAP National Environmental Laboratory Accreditation Program NPDES National Pollutant Discharge Elimination System PM Program Manager QA/QC Quality Assurance/Quality Control QAC Quality Assurance Coordinator QAPP Quality Assurance Project Plan RPD Relative Percent Difference SIC Science Information Catalog SIMS Science Information Management System SLOC Station Location Form
SM American Public Health Association, Standard Methods for the Analysis of Water and Wastewater
SOP Standard Operating Procedure SQO Sediment Quality Objective TAPE Technology Assessment Protocol

S8 Program – Phase I Municipal Stormwater NPDES Permit Page vi Quality Assurance Project Plan
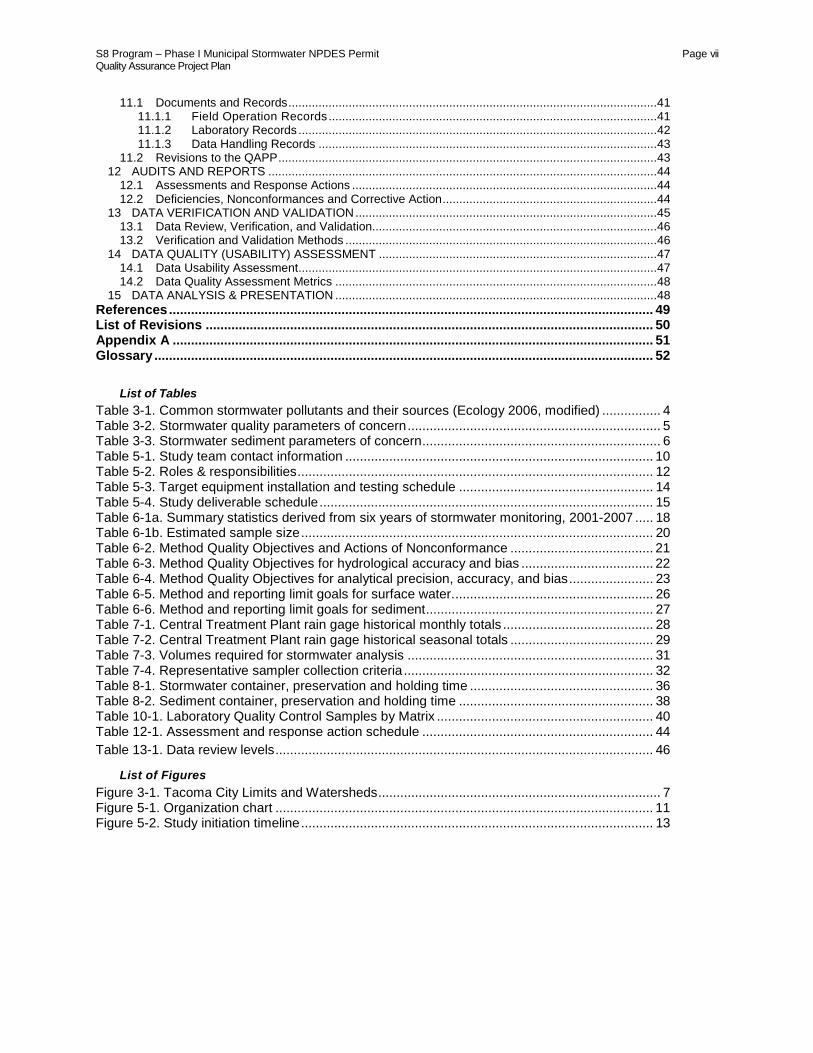
1 TABLE OF CONTENTS QAPP Element: Page No.
1 Title and Approval Sheet ....................................................................................................................... ii2 Distribution List ..................................................................................................................................... ivAcronyms .................................................................................................................................................... v1 TABLE OF CONTENTS ....................................................................................................................... vi3 BACKGROUND .....................................................................................................................................2
3.1 The Problem ...................................................................................................................................33.2 Study Area .....................................................................................................................................33.3 Parameters of Concern ..................................................................................................................4
4 PROJECT DESCRIPTION ....................................................................................................................94.1 Practical Constraints ......................................................................................................................9
5 ORGANIZATION AND SCHEDULE .................................................................................................... 105.1 Roles & Responsibilities ............................................................................................................... 105.2 Special Training Needs/Certification ............................................................................................ 125.3 Timeline/Study Schedule .............................................................................................................. 13
5.3.1 Study Deliverables ............................................................................................................. 146 QUALITY OBJECTIVES ...................................................................................................................... 16
6.1 Data Quality Objectives ................................................................................................................ 166.1.1 Step 1: State the Problem ................................................................................................. 166.1.2 Step 2: Identify the Decisions ............................................................................................ 166.1.3 Step 3: Identify Inputs to the Decision ............................................................................... 176.1.4 Step 4: Define the Boundaries of the Study ....................................................................... 186.1.5 Step 5: Develop Decision Rules ........................................................................................ 186.1.6 Step 6: Specify Limits on Decision Errors .......................................................................... 196.1.7 Step 7: Optimize the Design .............................................................................................. 19
6.2 Measurement Quality Objectives ................................................................................................. 216.2.1 Bias, Precision and Accuracy ............................................................................................ 226.2.2 Representativeness ........................................................................................................... 24
6.2.2.1 Stormwater Quality ................................................................................................. 24 6.2.2.2 Stormwater Sediment Quality ................................................................................. 24
6.2.3 Completeness and Comparability ...................................................................................... 246.2.4 Sensitivity (Reporting Limits) ............................................................................................. 25
7 SAMPLING PROCESS DESIGN (EXPERIMENTAL DESIGN) ........................................................... 287.1 Summary of Long-Term Rainfall Data .......................................................................................... 287.2 Stormwater Monitoring Strategy ................................................................................................... 30
7.2.1 Parameters and Analytical Methods .................................................................................. 307.2.2 Sampling Techniques and Types ...................................................................................... 317.2.3 Representative Sample Criteria ......................................................................................... 32
7.2.3.1 Representative Composite Sampling Criteria ......................................................... 32 7.3 Equipment Monitoring Strategy .................................................................................................... 32
8 SAMPLING (FIELD) PROCEDURES .................................................................................................. 348.1 Sample Collection Procedures ..................................................................................................... 34
8.1.1 Decontamination Procedures ............................................................................................ 34 8.1.1.1 Sample Bottles ........................................................................................................ 34 8.1.1.2 Automated Sampling Equipment ............................................................................ 35
8.2 Sample Handling & Custody ........................................................................................................ 358.2.1 Sample Identification ......................................................................................................... 388.2.2 Sample Transportation ...................................................................................................... 388.2.3 Sample Preservation ......................................................................................................... 388.2.4 Sample Processing ............................................................................................................ 398.2.5 Holding Times .................................................................................................................... 398.2.6 Chain of Custody Forms .................................................................................................... 39
8.3 Non-Direct Measurements ........................................................................................................... 409 MEASUREMENT PROCEDURES ...................................................................................................... 4010 QUALITY CONTROL ........................................................................................................................... 40
10.1 Analytical Quality Control ............................................................................................................. 4010.2 Field Quality Control ..................................................................................................................... 40
11 DATA MANAGEMENT & DOCUMENTATION PROCEDURES .......................................................... 41
S8 Program – Phase I Municipal Stormwater NPDES Permit Page vii Quality Assurance Project Plan
11.1 Documents and Records .............................................................................................................. 4111.1.1 Field Operation Records .................................................................................................. 4111.1.2 Laboratory Records ........................................................................................................... 4211.1.3 Data Handling Records ..................................................................................................... 43
11.2 Revisions to the QAPP ................................................................................................................. 4312 AUDITS AND REPORTS .................................................................................................................... 44
12.1 Assessments and Response Actions ........................................................................................... 4412.2 Deficiencies, Nonconformances and Corrective Action ................................................................ 44
13 DATA VERIFICATION AND VALIDATION .......................................................................................... 4513.1 Data Review, Verification, and Validation ..................................................................................... 4613.2 Verification and Validation Methods ............................................................................................. 46
14 DATA QUALITY (USABILITY) ASSESSMENT ................................................................................... 4714.1 Data Usability Assessment ........................................................................................................... 4714.2 Data Quality Assessment Metrics ................................................................................................ 48
15 DATA ANALYSIS & PRESENTATION ................................................................................................ 48References .................................................................................................................................... 49List of Revisions .......................................................................................................................... 50Appendix A ................................................................................................................................... 51Glossary ........................................................................................................................................ 52
List of Tables Table 3-1. Common stormwater pollutants and their sources (Ecology 2006, modified) ................ 4 Table 3-2. Stormwater quality parameters of concern ..................................................................... 5 Table 3-3. Stormwater sediment parameters of concern ................................................................. 6 Table 5-1. Study team contact information .................................................................................... 10 Table 5-2. Roles & responsibilities ................................................................................................. 12 Table 5-3. Target equipment installation and testing schedule ..................................................... 14 Table 5-4. Study deliverable schedule ........................................................................................... 15 Table 6-1a. Summary statistics derived from six years of stormwater monitoring, 2001-2007 ..... 18 Table 6-1b. Estimated sample size ................................................................................................ 20 Table 6-2. Method Quality Objectives and Actions of Nonconformance ....................................... 21 Table 6-3. Method Quality Objectives for hydrological accuracy and bias .................................... 22 Table 6-4. Method Quality Objectives for analytical precision, accuracy, and bias ....................... 23 Table 6-5. Method and reporting limit goals for surface water. ...................................................... 26 Table 6-6. Method and reporting limit goals for sediment .............................................................. 27 Table 7-1. Central Treatment Plant rain gage historical monthly totals ......................................... 28 Table 7-2. Central Treatment Plant rain gage historical seasonal totals ....................................... 29 Table 7-3. Volumes required for stormwater analysis ................................................................... 31 Table 7-4. Representative sampler collection criteria .................................................................... 32 Table 8-1. Stormwater container, preservation and holding time .................................................. 36 Table 8-2. Sediment container, preservation and holding time ..................................................... 38 Table 10-1. Laboratory Quality Control Samples by Matrix ........................................................... 40 Table 12-1. Assessment and response action schedule ............................................................... 44 Table 13-1. Data review levels ....................................................................................................... 46
List of Figures Figure 3-1. Tacoma City Limits and Watersheds ............................................................................. 7 Figure 5-1. Organization chart ....................................................................................................... 11 Figure 5-2. Study initiation timeline ................................................................................................ 13
S8 Program - Phase I Municipal Stormwater NPDES Permit Page 1 of 56 Quality Assurance Project Plan
Revision: S8-004 (Final) Revision Date: 03/31/2010
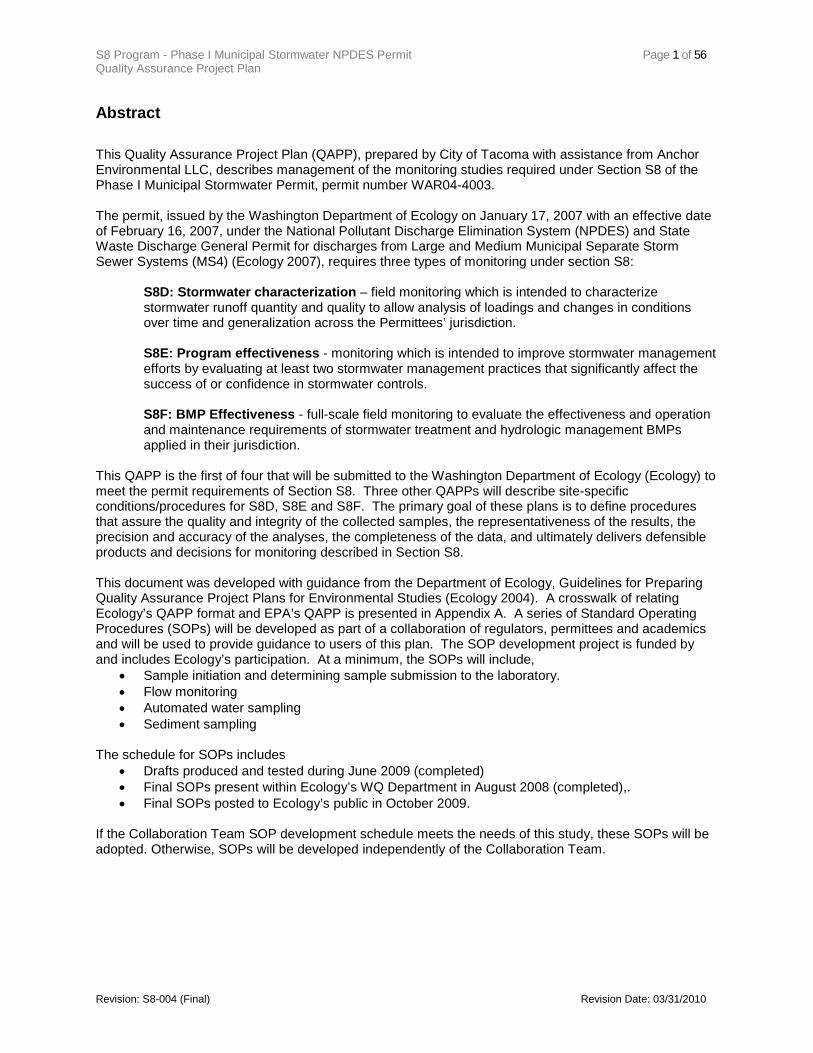
Abstract This Quality Assurance Project Plan (QAPP), prepared by City of Tacoma with assistance from Anchor Environmental LLC, describes management of the monitoring studies required under Section S8 of the Phase I Municipal Stormwater Permit, permit number WAR04-4003. The permit, issued by the Washington Department of Ecology on January 17, 2007 with an effective date of February 16, 2007, under the National Pollutant Discharge Elimination System (NPDES) and State Waste Discharge General Permit for discharges from Large and Medium Municipal Separate Storm Sewer Systems (MS4) (Ecology 2007), requires three types of monitoring under section S8:
S8D: Stormwater characterization – field monitoring which is intended to characterize stormwater runoff quantity and quality to allow analysis of loadings and changes in conditions over time and generalization across the Permittees’ jurisdiction. S8E: Program effectiveness - monitoring which is intended to improve stormwater management efforts by evaluating at least two stormwater management practices that significantly affect the success of or confidence in stormwater controls. S8F: BMP Effectiveness - full-scale field monitoring to evaluate the effectiveness and operation and maintenance requirements of stormwater treatment and hydrologic management BMPs applied in their jurisdiction.
This QAPP is the first of four that will be submitted to the Washington Department of Ecology (Ecology) to meet the permit requirements of Section S8. Three other QAPPs will describe site-specific conditions/procedures for S8D, S8E and S8F. The primary goal of these plans is to define procedures that assure the quality and integrity of the collected samples, the representativeness of the results, the precision and accuracy of the analyses, the completeness of the data, and ultimately delivers defensible products and decisions for monitoring described in Section S8. This document was developed with guidance from the Department of Ecology, Guidelines for Preparing Quality Assurance Project Plans for Environmental Studies (Ecology 2004). A crosswalk of relating Ecology’s QAPP format and EPA’s QAPP is presented in Appendix A. A series of Standard Operating Procedures (SOPs) will be developed as part of a collaboration of regulators, permittees and academics and will be used to provide guidance to users of this plan. The SOP development project is funded by and includes Ecology’s participation. At a minimum, the SOPs will include,
• Sample initiation and determining sample submission to the laboratory. • Flow monitoring • Automated water sampling • Sediment sampling
The schedule for SOPs includes
• Drafts produced and tested during June 2009 (completed) • Final SOPs present within Ecology’s WQ Department in August 2008 (completed),. • Final SOPs posted to Ecology’s public in October 2009.
If the Collaboration Team SOP development schedule meets the needs of this study, these SOPs will be adopted. Otherwise, SOPs will be developed independently of the Collaboration Team.

S8 Program - Phase I Municipal Stormwater NPDES Permit Page 2 of 56 Quality Assurance Project Plan
Revision: S8-004 (Final) Revision Date: 03/31/2010
3 BACKGROUND In July 1995, Ecology issued three NPDES wastewater discharge general permits to regulate municipal stormwater discharges. These permits required development and implementation of stormwater management programs to reduce the discharge of pollutants to the maximum extent practicable. The permits expired on July 5, 2000. The Washington Department of Ecology (Ecology) administratively extended permit coverage until they issued the revised permit in January 2007. Ecology combined the three current general permits for the Island/Snohomish, Cedar/Green, and South Puget Sound Water Quality Management Areas (WQMA) into a single statewide general permit. The general permit applies to all entities required to have permit coverage under current (Phase I) U.S. Environmental Protection Agency (EPA) stormwater regulations. This includes cities and unincorporated portions of counties whose populations exceed 100,000. The 1995 Phase I permittees include:
• King County • Pierce County • Snohomish County • Clark County • City of Seattle • City of Tacoma
Phase I Secondary Permittees include:
• Port of Seattle • Port of Tacoma
Ecology intends for the combination of intensive monitoring from all Phase 1 Permittees throughout the state to provide them with a sufficient data set from which to draw conclusions about the effectiveness of programs and BMPs on a region-wide basis. In addition to the Section S8 intensive monitoring, the City of Tacoma currently conducts stormwater monitoring and source control effectiveness studies. Under EPA’s Superfund program, contaminated bottom sediments were remediated in Thea Foss and Wheeler-Osgood Waterways in Tacoma, WA, at a cost of approximately $88M (Tacoma 2008a). Since 2001, seven outfalls discharging into Thea Foss waterway have been and are sampled to assess stormwater, baseflow, and stormwater suspended particulate matter (SSPM) (stormwater sediments) quality. The purpose of the monitoring program is:
• To measure effectiveness of Tacoma’s stormwater management programs • To identify trends in stormwater quality • To provide early warning of new sources • To trace source(s) using sediment traps.
In addition, the City of Tacoma is implementing source control program for the municipal storm drains entering the Thea Foss and Wheeler-Osgood Waterways to help provide long-term protection of sediment quality in the waterways (Unilateral Administrative Order dated September 30, 2002, and a Consent Decree with EPA dated May 9, 2003). The City’s program is called the Thea Foss Post-Remediation Source Control Strategy. The Strategy was approved by EPA and

S8 Program - Phase I Municipal Stormwater NPDES Permit Page 3 of 56 Quality Assurance Project Plan
Revision: S8-004 (Final) Revision Date: 03/31/2010
includes the City’s existing programs, studies and a decision matrix to identify the need for additional source controls for each of the seven outfalls and its contributing basin.
Source control evaluations are completed annually for the seven major outfalls discharging to the waterways. The evaluations include a drain-by-drain assessment and incorporate the review of ongoing studies, source control investigations, and stormwater and stormwater suspended particulate matter data for that outfall/basin. The need for additional source controls is driven by the need to protect post-remediation sediment quality in the waterways from urban contaminants conveyed in municipal stormwater. This is evaluated using a “weight of evidence” approach with several lines of investigation, including: the long-term outfall monitoring, computer model predictions, and post-construction sediment quality monitoring. That is:
• Is stormwater quality improving over time? • Is Thea Foss sediment quality in compliance with Superfund sediment quality
objectives (SQOs)? • Is Thea Foss sediment quality better or worse than computer model predictions? • Are additional source controls required?
This intensive data collection and evaluation effort has an approximate cost of $500,000 a year. Additional source control measures that have been completed include cleaning of the entire stormwater system in four basins.
3.1 The Problem Stormwater quality is difficult to manage because discharges are not continuous, and storm events can be unpredictable. Rather, discharges are intermittent and weather-dependent (i.e., rainfall and snowmelt). There is a wide range of pollutants in stormwater, and concentrations vary depending on storm events. Further difficulty in controlling municipal stormwater discharges comes from the large number of outfalls where stormwater is being discharged. These features of stormwater runoff make it difficult to apply conventional end-of-pipe treatment options to existing discharges. Stormwater management is expensive. Knowledge of pollutant loads and of average event mean concentrations from representative areas drained by the municipal storm sewer systems may help Ecology gauge whether the comprehensive stormwater management programs are making cost-effective progress towards the goal of reducing the amount of pollutants discharged and protecting water quality in the most cost-effective manner. Knowledge of BMP effectiveness is needed to provide a feedback loop to Ecology to improve their knowledge and understanding of the performance of treatment BMPs.
3.2 Study Area The first components of Tacoma’s storm drainage system were constructed in the 1880’s. Between 1928 and 1946, “combined” sewer systems were constructed to carry storm drainage and sanitary sewage. Between 1958 and 1970, Tacoma’s Public Works Sewer Utility embarked on a sewer separation program to eliminate the “combined” sewer systems. As the City grew so did the separated drainage system. In 1977, a storm drain utility was formed (Tacoma 1979). Today, City of Tacoma Public Works Department operates and maintains the drainage systems, which includes over 440 miles of storm pipe, 10,000 manholes, 18,300 catch basins, and 21 stormwater ponds (Tacoma 2008b).

S8 Program - Phase I Municipal Stormwater NPDES Permit Page 4 of 56 Quality Assurance Project Plan
Revision: S8-004 (Final) Revision Date: 03/31/2010
The City of Tacoma boundary and its watersheds are shown in Figure 3-1. The three types of monitoring required under section S8 of the permit will be conducted within the City of Tacoma boundary.
3.3 Parameters of Concern Impacts from stormwater are highly site-specific and vary geographically due to differences in local land use conditions, hydrologic conditions, and the type of receiving water. There are many pollution sources that may contaminate stormwater, including land use activities, operation and maintenance activities, illicit discharges and spills, atmospheric deposition, and vehicular traffic conditions. Many of these sources are not under the direct control of the municipalities that own or operate the storm sewers. Table 3-1 lists common stormwater pollutants with related potential sources.
Table 3-1. Common stormwater pollutants and their sources (Ecology 2006, modified). Pollutant Potential Sources Arsenic Atmospheric deposition (ASARCO Smelter, fossil fuel combustion) Cadmium Tire wear, metal plating, batteries
Chromium Metal Plating, rocker arms, crank shafts, brake linings, yellow lane strip paint Copper Vehicles (brake pads, thrust bearings, bushings), copper pesticides, atmospheric
deposition from fuel combustion and industrial processes Lead Motor Oil, transmission bearings, gasoline Zinc Vehicles (motor oil, tire wear), galvanized materials (roofing – flashing, down
spouts, uncoated galvanized roofs, pipes, fencing) Bacterial/Viral Agents Domestic animals, septic systems, animal & manure transport Nutrients Sediments, fertilizers, domestic animals, septic systems, vegetative matter
Oil & Grease Motor vehicles, illegal disposal of used oil Organic Toxins Pesticides, combustion products, petroleum products, paints & preservatives,
plasticizers, solvents Oxygen Demanding Organics Vegetative matter, petroleum products Sediments Construction sites, stream channel erosion, poorly vegetated lands, slope failure,
vehicular deposition Temperature Pavement runoff, loss of shading along streams
The stormwater quality analytes identified as parameters of concern under S8 by Ecology are those that have a history of association with stormwater discharges and are found in urban environments (Table 3-2). Through the permit, Ecology has provided prioritization for analysis given limited sample volumes.

S8 Program - Phase I Municipal Stormwater NPDES Permit Page 5 of 56 Quality Assurance Project Plan
Revision: S8-004 (Final) Revision Date: 03/31/2010
Table 3-2. Stormwater quality parameters of concern.
Analyte Group Parameter
Order of priority All Land Uses
Industrial/ Commercial Residential
Total Petroleum Hydrocarbons (TPH) Diesel Range Organics (DRO) 1 (grab)
Gas Range Organics (GRO)
Bacteria Fecal coliform bacteria 1 (grab)
Conventional
Biological Oxygen Demand (BOD5) 8 8
Chloride 9 9
Conductivity 2
Hardness 4
Methylene Blue Activating Substances (MBAS) 3
Total Suspended Solids (TSS) 1
Turbidity 10 10
Metals (dissolved & total)
Cadmium
4
Copper
Lead Mercury
Zinc
Nutrients
Nitrate-nitrite
7
5
Orthophosphate
Total kjeldahl nitrogen (TKN)
Total phosphorus
Semi-Volatile Organic Compounds (SVOCs)
Pentachlorophenol (fungicide, wood preservative) 6 6
Phthalates 5
7
Polycyclic aromatic hydrocarbons (PAHs)
Pesticides, Chlorinated
2,4-D (herbicide)
6
6
Dichlobenil (herbicide)
MCPP (herbicide)
Triclopyr (herbicide)
Pesticides, Nitrogen Prometon (herbicide)
Pesticides, Organophosphorus
Diazinon (insecticide)
Malathion (insecticide)
Chloropyrifos (insecticide)
The sediment analytes identified as parameters of concern by Ecology are those that have a history of association with stormwater discharges, are found in urban environments, have a marine sediment quality standard, or that provide necessary support information (e.g., total organic carbon) (Table 3-3).

S8 Program - Phase I Municipal Stormwater NPDES Permit Page 6 of 56 Quality Assurance Project Plan
Revision: S8-004 (Final) Revision Date: 03/31/2010
Table 3-3. Stormwater sediment p
Analyte Group
arameters of concern.
Parameter
Order of priority
All Land Uses
Industrial/ Commercial Residential
Conventional Total solids Grain size 1 Total organic carbon 2
Metals
Cadmium
3
Copper Lead Mercury
Zinc
Semi-volatile Organic Compounds
Polycyclic aromatic hydrocarbons (PAHs) 4 5 Phthalates Pentachlorophenol (herbicide) 7 4 Phenolics 5 6
Pesticides, Organophosphorus Diazinon (insecticide)
7 4 Malathion (insecticide) Chloropyrifos (insecticide)
Persistent Organic Compounds Polychlorinated biphenyls (PCBs) 6


S8 Program - Phase I Municipal Stormwater NPDES Permit Page 8 of 56 Quality Assurance Project Plan
Revision: S8-004 (Final) Revision Date: 03/31/2010

S8 Program - Phase I Municipal Stormwater NPDES Permit Page 9 of 56 Quality Assurance Project Plan
Revision: S8-004 (Final) Revision Date: 03/31/2010
4 PROJECT DESCRIPTION In each QAPP, this section will present the goals and objectives of each project; describes project boundaries, target populations and practical constraints of the study; and specifies the information and data required to meet that study’s objectives. The following paragraphs present general information related to stormwater sampling.
4.1 Practical Constraints The two primary practical constraints to successful study are discussed below and include:
1) Sampling design assumptions and requirements; and
2) Typical logistical challenges associated with the difficult task of monitoring stormwater.
Sampling design – The sampling design permit requirements are very ambitious and assume a high success rate. Local experience with flow-weighted composite stormwater sampling indicates that the ability to successfully track and sample storm events is low. Logistical challenges - The unpredictable nature of storm events poses the greatest logistical challenge for this study. Only storms of particular depths and intensities will result in qualifying storm events and successful sample collection. However, the location, timing, duration, magnitude, and intensity of storm events cannot be forecast with certainty. It is inevitable that during this long duration and intense monitoring study, sampler programming based on the forecast will result in unsuccessful sample collection of qualifying storm events when storm intensities and depths are very different from the forecast for which the sampler was programmed.
Since long-term forecasts have greater uncertainty, mobilization of field staff and equipment setup for a potential storm-sampling event cannot happen more than two days ahead of a forecasted storm. During an event, staff must be mobilized to collect grab samples on very short notice and must visit a set of sites in a relatively short period (2-to-3 hours) in order to collect samples as early in the event as possible. Although Standard Operating Procedures (SOPs) will be followed, it is inevitable that during these intense monitoring studies equipment malfunction and human error will result in unsuccessful sample collection of qualifying storm events. Although sites are selected to minimize safety concerns, traffic control may be necessary to access the monitoring stations safely. Access may be necessary during high traffic periods, at night, and/ or during severe weather. These access conditions pose additional logistical challenges for sample collection.

S8 Program - Phase I Municipal Stormwater NPDES Permit Page 10 of 56 Quality Assurance Project Plan
Revision: S8-004 (Final) Revision Date: 03/31/2010
5 ORGANIZATION AND SCHEDULE This section describes the roles & responsibilities of the study team, the study timeline and schedule.
5.1 Roles & Responsibilities The team consists of representatives from key groups with a role in data collection or use, and often those with a critical interest or stake in the problem. This section includes the names, duties, and responsibilities of all key team participants. This includes internal and external team members. The organizational structure is designed to provide project control and proper quality assurance/quality control (QA/QC) for the field investigation.
The roles of key individuals involved in the study are provided in Table 5-1. A detailed description of the lines of authority and reporting between these individuals and organizations is presented in Figure 5-1 and the responsibility associated with each role is outlined in Table 5-2.
Table 5-1. Study Team contact information. Role Name Organization Telephone
No. NPDES Permit Manager Lorna Mauren ESSE SW 253.502.2192 S8 Program Manager Dana de Leon ESSE SW 253.502.2109 QA Coordinator Chris Burke ESSE EC 253.502.2247 Field Supervisor Rick Fuller ESSE EC 253.502.2129 Contract Laboratory PM Chris Getchell ES OPS Laboratory 253.502.2130 Contract Laboratory PM Mary Ann Rempel-Hester
Nautilus Environmental 253. 922.4296
ESSE SW – Environmental Services/Science & Engineering Surface Water ESSE EC – Environmental Services/Science & Engineering Environmental Compliance ES OPS Lab – Environmental Services/Wastewater & Surface Water Maintenance/Operations
In general, the S8 Program Manager is assigned to manage the S8 monitoring program. In this role, he/she provides technical expertise; coordinates sampling activities with the laboratory and the field team; and reports the status and results of the study to the NPDES Permit Manager and with the Ecology Regional Representative.

S8 Program - Phase I Municipal Stormwater NPDES Permit Page 11 of 56 Quality Assurance Project Plan
Revision: S8-004 (Final) Revision Date: 03/31/2010
Ecology Regional Contact(Kurt Fremont)
NPDES Permit Manager(Lorna Mauren)
NPDES S8 Monitoring Manager(Dana de Leon)
Advisory PanelNPDES Phase I
(Coordinated Monitoring Group)
Quality Assurance Coordinator
(Chris Burke)
Field Installation/Procedures Review
(Dana de Leon and Chris Burke)
Assistant Division Manager(Lorna Mauren and Mike Kennedy)
Sampling Design Field Activities
Laboratory Activities
Data Management Reporting
Dana de Leon and Chris Burke
Field Supervisor(Rick Fuller)
Analytical Laboratory PM (Chris Getchell)
Document Preparation
(Dana de Leon)
Technical Consultant (Anchor
Environmental)
Field QC(Chris Burke)
Weather Forecaster(City of Tacoma Sampling Crew)
Sampling Team(City of Tacoma Sampling Crew)
Lab QC(Lori
Zboralski)
Toxicity Laboratory PM(MaryAnn Rempel-
Hester)
Lab QC(Nautilus
Environmental)
Data Validation(Dana de Leon)
Data Usability (Dana de Leon and Chris
Burke)
Data Interpretation(Dana de Leon and Chris
Burke
Data Presentation(Dana de Leon and
Chris Burke)
Technical Contractor(Anchor Environmental)
Figure 5-1. Organization chart illustrating study organization & lines of communication.

S8 Program - Phase I Municipal Stormwater NPDES Permit Page 12 of 56 Quality Assurance Project Plan
Revision: S8-004 (Final) Revision Date: 03/31/2010
A description of the detailed responsibility of each role is outline below in Table 5-2.
Table 5-2. Roles & responsibilities Roles & responsibilities NPDES Coordinated Monitoring Group The Group attends intermittent meetings for development and review of standard operating procedures for stormwater sampling, QA/QC and data management/evaluation. Assistant Division Manager Responsible for fiscal resources and personnel. Supervises the assigned study personnel (scientists, technicians, and support staff) in providing for their efficient utilization by directing their efforts either directly or indirectly on study tasks. In general, other specific responsibilities include: coordinate study assignments in establishing priorities and scheduling, Approves QAPP. NPDES Permit Manager Coordinates with Ecology representative. Provides study/program direction. Approves QAPP. Program Manager – Co-Responsible for the development, approval, implementation, and maintenance of the QAPP. Responsible for: maintaining records of QAPP distribution, including appendices and amendments; maintaining written records of sub-tier commitment to requirements specified in this QAPP; identifying, receiving, and maintaining study quality assurance records; coordinating with the QAC to resolve QA- related issues. Responsible for verifying the QAPP is followed and the study is producing data of known and acceptable quality. Identifies particular circumstances, which may adversely affect the quality of data derived from the collection and analysis of samples. Responsible for ensuring tasks and other requirements in the contract for field implementation are executed on time and are of acceptable quality. Monitors and assesses the quality of work. Coordinates attendance at conference calls, training, meetings, and related study activities. Complies with corrective action requirements. Reviews the work products from assigned study personnel (scientists, technicians, and support staff) to ensure the completion of high-quality studies within established budgets and time schedules, provide guidance and technical advice to those assigned to studies by evaluating performance, and provide professional development to staff. Interact with technical reviewers to assure technical quality requirements are met in accordance with contract specifications. Co-Responsible for validation and verification of data collected. Prepare and/or review preparation of study deliverables. Responsible for on-schedule completion of assigned writing, editing, and data interpretation work. Directs all reporting activities, including in-house and outside review, editing, printing, copying, and distributing or journal submission. Quality Assurance Coordinator – Co-Responsible for the development, approval, implementation, and maintenance of the QAPP. Independent of the field and laboratory staff. Major responsibilities include monitoring QC activities to determine conformance, distributing quality related information, training personnel on QC requirements and procedures, reviewing QA/QC plans for completeness and noting inconsistencies, and signing-off on the QA plan and reports. Co-Responsible for validation and verification of data collected. Prepare and/or review preparation of study deliverables. Field Supervisor Responsible for: supervising all aspects of the sampling and measurement in the field; the acquisition of samples and field data measurements in a timely manner that meet the quality objectives; field scheduling, staffing, and ensuring that staff are appropriately trained. Laboratory Manager Responsible for supervision of laboratory personnel involved in generating analytical data for this study. Responsible for ensuring that laboratory personnel involved in generating analytical data have adequate training and a thorough knowledge of the QAPP and all SOPs specific to the analyses or task performed and/or supervised. Responsible for oversight of all operations, ensuring that all QA/QC requirements are met, and documentation related to the analysis is completely and accurately reported. Enforces corrective action, as required. Develops and facilitates monitoring systems audits. Laboratory QC Monitors the implementation of the QAPP within the laboratory to ensure complete compliance with QA objectives as defined by the contract and in the QAPP. Conducts internal audits to identify potential problems and ensure compliance with written SOPs. Responsible for supervising and verifying all aspects of the QA/QC in the laboratory. Performs validation and verification of data before the report is sent to the PM. Ensures that all QA reviews are conducted in a timely manner from real-time review at the bench during analysis to final pass-off of data to the QAC.
5.2 Special Training Needs/Certification This section identifies and describes any specialized training or certifications needed by personnel in order to complete the monitoring program or task successfully.
S8 Program - Phase I Municipal Stormwater NPDES Permit Page 13 of 56 Quality Assurance Project Plan
Revision: S8-004 (Final) Revision Date: 03/31/2010
Field staff that collect positional data shall undergo a training program to ensure that he or she has the knowledge and skills required to collect data in accordance with SOPs for GIS. Field personnel will receive training in proper sampling and field analysis for each Standard Operating Procedure they will be using. They will demonstrate to the Program Manager or Quality Assurance Coordinator (in the field), their ability to properly operate the automatic samplers and retrieve the samples. The Program Manager or Quality Assurance Coordinator will sign off each field staff in their field logbooks.
In addition to technical training, field personnel will receive training that addresses stormwater monitoring activities that have the potential to adversely affect their health and safety. Stormwater monitoring field crews often work in wet, cold, and poor visibility conditions. Sampling sites may be located in high traffic areas or remote, poorly lit areas that need to be accessed on a 24-hour basis. Monitoring personnel and workers installing or maintaining equipment may be exposed to traffic hazards, confined spaces, biological hazards (e.g., medical waste and fecal matter), vectors (e.g., snakes and rats), fall hazards, hazardous materials, fast moving stormwater, and slippery conditions.
The selected laboratory will be accredited under the National Environmental Laboratory Accreditation Program (NELAP) and/or the Washington Department of Ecology Laboratory Accreditation Program for the parameters to be analyzed.
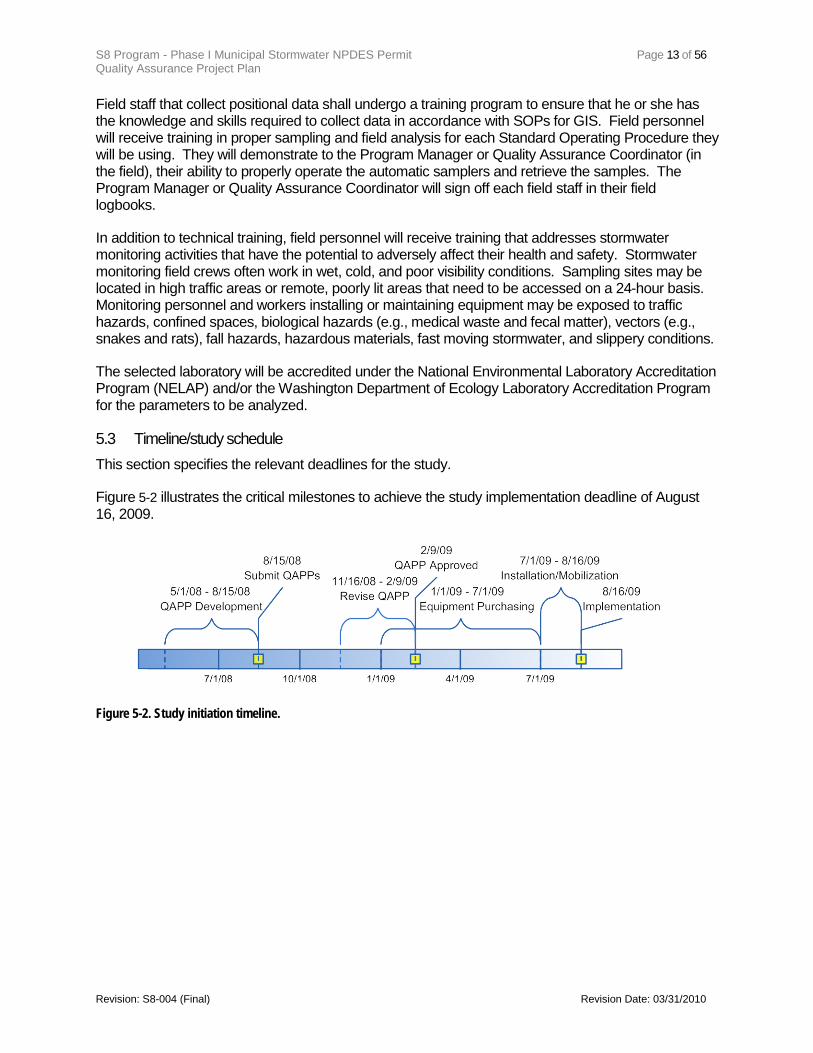
5.3 Timeline/study schedule This section specifies the relevant deadlines for the study.
Figure 5-2 illustrates the critical milestones to achieve the study implementation deadline of August 16, 2009.
Figure 5-2. Study initiation timeline.

S8 Program - Phase I Municipal Stormwater NPDES Permit Page 14 of 56 Quality Assurance Project Plan
Revision: S8-004 (Final) Revision Date: 03/31/2010
Key dates include: August 15, 2008 Summary description of the monitoring program and Quality Assurance Project
Plan (QAPP) submitted to Ecology.
November 16, 2008 Ecology completes review of the QAPP and responds with comments to the City.
February 16, 2009 Ecology approves the QAPP. This deadline may be extended by the number of days that Ecology exceeds the 90-day review period.
August 16, 2009 Full implementation of the monitoring program begins.
March 31, 2010 First annual report due covering the period from August 16, 2009 through September 30, 2009.
March 31, 2011 Second annual report due covering first complete water year, from October 1, 2009 through September 30, 2010.
Each project will require the use of stormwater monitoring equipment. Table 5-3 outlines the target equipment installation and testing schedule needed to meet the monitoring initiation date of August 16, 2009. This schedule is dependent on receiving review comments from Ecology by November 16, 2008 so equipment can be ordered with some confidence that the specifications will be correct for the final monitoring configuration. This schedule is dependent on receiving review comments from Ecology by November 16, 2008.
Table 5-3. Target equipment installation and testing schedule.
Activity Date
Finalize Equipment List December 2008
Order Equipment January/February 2009
Install Equipment July/August 2009
Water sampling equipment testing August/September 2009
During WY2010, the City of Tacoma Laboratory and Environmental Services moved from the Central Treatment Plant (CTP) to our new location at The Center for Urban Waters (CUW), Due to this move, the City of Tacoma ceased S8.D and S8.F stormwater characterization and BMP effectiveness monitoring from April 16, 2010 through May 18, 2010 due to several logistical issues. All laboratory analytical instruments were dismantled, reassembled and recalibrated and the field sampling staff moved all equipment and supplies, making deployments difficult during this process. As soon as all laboratory instruments were moved and calibrated sampling resumed.
5.3.1 Study Deliverables
This section describes the project deliverables. Section 14.2 provides additional details describing the procedure and method for developing the deliverables. Refer to Section 11 for documentation and records supporting development of the deliverables and Section 15 for a discussion of the content.
Each annual report for S8D, S8E and S8F, will include all monitoring data collected during the preceding water year (October 1 – September 30). As shown in Table 5-4, the first annual monitoring reports submitted will include data from a partial water year, August 16, 2009 through September 30, 2009. Each report shall also integrate data from earlier years into the analysis of results, as appropriate. Reports shall be submitted in both paper and electronic form.

S8 Program - Phase I Municipal Stormwater NPDES Permit Page 15 of 56 Quality Assurance Project Plan
Revision: S8-004 (Final) Revision Date: 03/31/2010
Table 5-4. Study deliverable schedule.
Performance Monitoring Period
Anticipated Date of Initiation
Anticipated Date of Annual Completion
Deliverable and Due Date
Partial Water Year One (2009)
08/16/2009 09/30/2009 Stormwater Monitoring Report1
Water Year Two (2010)
March 31, 2010
10/01/2009 09/30/2010 Stormwater Monitoring Report March 31, 2011
Water Year Three (2011)
10/01/2010 09/30/2011 Stormwater Monitoring Report March 31, 2012
Partial Water Year Four (2012)
10/01/2011 08/15/2012 Study Monitoring Report February 15, 2013
1Submitted with Annual Report

S8 Program - Phase I Municipal Stormwater NPDES Permit Page 16 of 56 Quality Assurance Project Plan
Revision: S8-004 (Final) Revision Date: 03/31/2010
6 QUALITY OBJECTIVES This section describes the data quality objectives (DQOs) and measurement quality objectives (MQOs) for the stormwater monitoring program, i.e., the type and quality of data needed to meet the program goals and objectives. DQOs are qualitative and quantitative statements that define the objectives of the project, identify the most appropriate types of data and data collection procedures, and specify acceptable error limits for decision making.
Once established, the DQOs become the basis for the MQOs that are used to assess analytical performance. MQOs are quantitative measures of performance using data quality indicators such as precision, bias, representativeness, completeness, comparability, and sensitivity. Data that meets the QAPP-specified MQOs is considered acceptable for use in project decision making.
6.1 Data Quality Objectives The DQOs for this project were developed in general accordance with USEPA Guidance for Data Quality Objectives Process, EPA QA/G-4 (USEPA, 2000). The DQO Process for Tacoma’s stormwater monitoring program is presented below.
6.1.1 Step 1: State the Problem The overall objective of the stormwater monitoring program is to characterize spatial and temporal trends in stormwater quality and mass loadings in municipal outfalls 237B (high-density residential), 235 (commercial) and 245 (industrial). Spatial trends may be related to the distribution of prevailing land uses as well as the hydrologic characteristics of the drainage basins. Time trends may be affected by the conflicting influences of Tacoma’s source control efforts (potentially contributing to improving trends) versus ongoing urban development/expansion in the drainage basins (potentially contributing to degrading trends). The objectives of the stormwater monitoring program are described in more detail in Section 4 of the individual QAPPs.
6.1.2 Step 2: Identify the Decisions In accordance with MS4 Permit requirements, Tacoma’s stormwater monitoring program is designed to answer the following questions:
• To what extent does land use in the municipal drainage basins affect stormwater quality? To answer this question, the effects of land use must be separated to the extent possible from the effects of drainage basin hydrology. In particular, the contribution of base flow in each basin, which is largely derived from groundwater and subsurface flow and is therefore less directly affected by surficial land use activities, must be analyzed separately from stormwater.
• Are stormwater and/or storm sediment concentrations declining in response to Tacoma’s source control program? Are stormwater and/or storm sediment concentrations increasing in response to urban growth and increasing traffic in the drainage basins? It should be noted that stormwater quality will be used to evaluate time trends rather than stormwater mass loads, because stormwater mass loads are confounded by random, year-to-year changes in weather and runoff patterns, which are beyond Tacoma’s control.
These questions are developed into the following testable statistical hypotheses: • Null Hypothesis S8C-1. Stormwater quality is not significantly different in drainage basins
characterized by residential, commercial, and industrial land uses.
• Alternative Hypothesis S8C-1. Land use patterns in the municipal drainage basins have a significant effect on stormwater quality.

S8 Program - Phase I Municipal Stormwater NPDES Permit Page 17 of 56 Quality Assurance Project Plan
Revision: S8-004 (Final) Revision Date: 03/31/2010
and • Null Hypothesis S8C-2. Stormwater quality in the municipal drainage basins is static and
unchanging over time.
• Alternative Hypothesis S8C-2. Stormwater quality in the municipal drainage basins is either (a) improving as a result of Tacoma’s source control efforts, or (b) degrading as a result of increased urban expansion and development.
Sufficient data will be collected in the stormwater monitoring program to be able to test these hypotheses with an appropriate level of statistical confidence and power. 6.1.3 Step 3: Identify Inputs to the Decision Tacoma has been monitoring stormwater quality under its previous NPDES permit in seven of the largest municipal drainages in the Thea Foss watershed since August 2001. Because these monitoring data were collected using methods comparable to those proposed herein, they will be used to characterize the variability of Tacoma’s stormwater quality to support the design of a statistically based sampling program, and to evaluate the statistical confidence and power afforded by the Permit-required sample sizes. These data will also be used to expand the monitoring period and improve the statistical confidence of time trend analyses. Existing data on stormwater and storm sediment quality is compiled and summarized in Tacoma’s annual stormwater monitoring reports (see Tacoma 2008c). From 2001 to the present, Tacoma has been monitoring municipal stormwater for the following target constituents:
• Conventional parameters (TSS, pH, conductivity, and hardness) • Metals (lead, mercury, and zinc) • Semivolatile organic compounds (PAHs and phthalates).
These analytical parameters were selected because they are considered the most critical monitoring parameters for protecting sediment quality in the recently remediated Thea Foss Waterway. Additional analytical parameters are required under the current Permit that were not included in the previous monitoring program. The following parameters will be added to Tacoma’s monitoring program with the implementation of this QAPP (according to the priorities outlined in the Permit if sample sizes are limited):
• Conventional parameters (turbidity, chloride, BOD, MBAS) • Metals (copper and cadmium) • Nutrients (total phosphorus, orthophosphate, total nitrogen, nitrate-nitrite) • Modern pesticides (various) • Total Petroleum Hydrocarbons (TPH) • Fecal coliform bacteria
Summary statistics for representative monitoring parameters in municipal outfalls 237B, 235, and 245 are presented in Table 6-1a. This table includes the arithmetic mean concentration and coefficient of variation (CV) over the six-year monitoring period. The CV is a measure of sampling and analytical variability and will be used to evaluate the relationship between sample size and statistical power (see Section 6.1.7 below). The CVs for TSS and metals appear to be somewhat lower overall than those for organic contaminants such as phthalates and PAHs. It is assumed that the new analytical parameters that will be added to the monitoring program as part of the new Permit requirements will be characterized by CVs similar to those listed in Table 6-1a, but this assumption will need to be confirmed with a few initial rounds of monitoring data.

S8 Program - Phase I Municipal Stormwater NPDES Permit Page 18 of 56 Quality Assurance Project Plan
Revision: S8-004 (Final) Revision Date: 03/31/2010
Table 6-1a. Summary statistics derived from six years of stormwater monitoring, 2001-2007.
Analyte
Outfall 237B Outfall 235 Outfall 245
Arithmetic Mean
Coefficient of Variation
(%) Arithmetic
Mean
Coefficient of
Variation (%)
Arithmetic Mean
Coefficient of
Variation (%)
Conventionals in mg/L TSS 76 0.72 101 0.77 84 0.60
Metals in mg/L
Copper NM NM NM NM NM NM Cadmium NM NM NM NM NM NM Lead (Total) 18 0.73 95 0.60 15 0.59 Mercury (Total) NC NC NC NC NC NC Zinc (Total) 91 0.58 164 0.58 183 0.62 Lead (Diss.) 0.8 0.56 7.9 0.76 1.0 0.87 Mercury (Diss.) NC NC NC NC NC NC Zinc (Diss.) 34 0.66 54 0.68 79 0.75
Organics in µg/L
DEHP 4.2 0.64 9.7 1.37 [1] 5.2 1.12 [2] Phenanthrene 0.11 1.08 0.18 0.75 0.13 1.74 [3] Pyrene 0.26 0.92 0.35 0.68 0.17 1.09
Notes:
Data from City of Tacoma 2008; Annual Stormwater Monitoring Report, 2001-2007, Appendix F NM = Not measured NC = Not calculated due to predominance of undetected results DEHP: Di-ethylhexyl phthalate or Bis-(2-ethylhexyl)phthalate [1] High CV for DEHP in Outfall 235 caused by one extreme outlier in Monitoring Year 2 [2] High CV for DEHP in Outfall 245 caused by two extreme outliers in Monitoring Year 2 [3] High CV for Phenanthrene in Outfall 245 caused by extreme outliers in Monitoring Years 3 and 4
6.1.4 Step 4: Define the Boundaries of the Study The geographic boundaries of the stormwater monitoring program include municipal drainage basins 237B, 235, and 245.
The temporal boundaries of the program extend from August 16, 2009 through August 15, 2012. To improve the statistical confidence of time trend analysis, monitoring data collected under the previous permit will also be used, as available, dating back to October 1, 2001. These earlier data will be organized to be consistent with the current definitions of water year, and wet and dry seasons.
6.1.5 Step 5: Develop Decision Rules The stormwater monitoring data will be evaluated in accordance with the following decision rules:
1. If it can be shown with statistical significance that Null Hypothesis S8C-1 is false, after removing local contributions from base flow (see Section 6.1.2), then a difference in stormwater quality between municipal drainage basins will have been demonstrated. It is assumed that any such

S8 Program - Phase I Municipal Stormwater NPDES Permit Page 19 of 56 Quality Assurance Project Plan
Revision: S8-004 (Final) Revision Date: 03/31/2010
differences are largely the result of differing land use characteristics unless an unusually large and discrete source(s) is identified in the drainage basin(s) during the monitoring program. Tacoma’s source control efforts will be better focused on those land uses that have a greater impact on stormwater quality.
2. If it can be shown with statistical significance that Null Hypothesis S8C-2 is false, then a non-static trend in stormwater quality (i.e., improving or degrading conditions) will have been demonstrated. It is assumed that an improving trend is largely the result of Tacoma’s stormwater source control efforts, as well as other state and federal institutional controls (e.g. air or vehicle emission standards), whereas a degrading trend is likely caused by increased urban development and traffic. If confirmed over multiple and successive monitoring years, degrading trends would trigger more focused source control studies for the affected drainages and constituents to identify and characterize the source of the impacts.
6.1.6 Step 6: Specify Limits on Decision Errors The stormwater monitoring program is designed to meet the following levels of statistical sensitivity, confidence, and power:
Minimum Detectable Relative Difference (MDRD). A MDRD in mean stormwater concentrations is specified at 50 percent for both spatial and temporal analyses. The monitoring program should be able to detect with statistical significance a 50 percent difference in stormwater concentrations between municipal drainages, and a 50 percent reduction (or increase) in stormwater concentrations over time. A MDRD of 50 percent is consistent with the differences in stormwater quality that are typically evaluated using Ecology’s Technology Assessment Protocol (TAPE) guidance (Ecology 2008).
Statistical Confidence and Power.
6.1.7 Step 7: Optimize the Design
As part of the BMP effectiveness monitoring program, the MS4 Permit provides goals of 90 to 95 percent statistical confidence and 75 to 80 percent statistical power [S8F(4)]. These same goals will be adopted in the stormwater monitoring program for use in determining spatial and temporal trends. The associated alpha levels (0.05 to 0.10) and beta levels (0.20 to 0.25) are the complements of statistical confidence and power, respectively.
This section provides an estimate of the number of stormwater samples that should be collected to achieve the data quality objectives specified for the stormwater monitoring program. The number of samples required for each monitoring round may be estimated based on the desired MDRD, the acceptable levels of statistical confidence and power (see Section 6.1.6), and an estimate of the variability of the data as measured by the coefficient of variation, or CV (see Section 6.1.3 and Table 6-1a).
The sample size analysis follows EPA (1992, section 9.3.3):
N = (Zα + Z2β)2 (CV/MDRD)2
where [N] = number of samples, [Zα and Z2β
The estimated sample size to detect a 50 percent difference in stormwater concentrations as a function of CV is provided in Table 6-1b. A range of acceptable confidence levels (alpha = 0.05 to 0.10) and power levels (beta = 0.20 to 0.25) is presented. The Permit specifies 11 to 14 samples will be collected in each of the drainage basins during each monitoring year. At this rate of data collection, Table 6-1b indicates the specified levels of statistical confidence and power will be achieved within one to two monitoring years, depending on the CV of the data.
] are Z statistics at the specified alpha and beta levels, [CV] is the coefficient of variation of stormwater data, and [MDRD] is defined in Section 6.1.6.

S8 Program - Phase I Municipal Stormwater NPDES Permit Page 20 of 56 Quality Assurance Project Plan
Revision: S8-004 (Final) Revision Date: 03/31/2010
It should be noted that the sample sizes estimated in Table 6-1b are based on an assumed normal distribution, whereas much of Tacoma’s existing stormwater data is better described by a lognormal distribution. The statistical power will be reduced if the data is log-transformed. For example, a 50 percent reduction in arithmetic concentrations is similar to a 30 percent reduction in log-transformed concentrations. For log-transformed data, the specified levels of statistical confidence and power are expected to be achieved within one to three monitoring years for most constituents. In general, statistical confidence and trend discrimination (i.e., ability to detect smaller MDRDs) should increase with each successive monitoring round due to the increasing sample size and longer monitoring period.
Table 6-1b. Estimated sample size to detect a 50% difference in stormwater concentrations as a function of the coefficient of variation.
Minimum Detectable Difference: 50%
Confidence (alpha)
Power (beta)
Stormwater Coefficient of Variation
0.3 0.4 0.5 0.6 0.7 0.8 0.9 1.0
0.10 0.25 1 2 3 5 6 8 11 13
0.10 0.20 2 3 5 7 9 12 15 19
0.05 0.20 3 5 7 10 14 18 23 29
LEGEND: Sample sizes achieved after 1 monitoring year (11 to 14 samples/year) Sample sizes achieved after 2 monitoring years (11 to 14 samples/year)

S8 Program - Phase I Municipal Stormwater NPDES Permit Page 21 of 56 Quality Assurance Project Plan
Revision: S8-004 (Final) Revision Date: 03/31/2010
6.2 Measurement Quality Objectives Measurement quality objectives (MQOs) specify how good the data must be in order to meet the objectives of the study. MQOs are the performance or acceptance thresholds or goals for the study’s data, based primarily on the data quality indicators. MQOs are used to select procedures for sampling, analysis, and quality control (QC).
Data quality indicators used in this study include quantitative measures of bias, precision and accuracy; qualitative measures of representativeness and comparability, and a combined measure of completeness. Table 6-2 summarizes MQOs for each DQI.
Table 6-2. Method Quality Objectives and Actions of Nonconformance.
Data Quality Indicator
Evaluation MQO
Action (criterion)
Bias
Field and Method Blanks
< RL; Tables 6-5 and 6-6
If [Field blank] >2x RL or [Method blank]>RL; Apply “J” to all affected samples if the [sample] < 5x RL.
Apply “B” to all affected samples if the [sample] ≥5x RL.
Laboratory Cont ro l Sample (%R)
Table 6-4
Apply “R” to all affected samples if the %R ≥ 2x high MQO or < 2x low MQO. Apply “J” to all affected samples if R% falls outside the MQO, but does not reach the rejection region.
Repeatability Field Duplicate (RPD) Table 6-4
Apply “R” to all affected samples if the RPD ≥ 2x MQO. Apply “J” to all affected samples if RPD > MQO.
Precision Laboratory Dupl i ca te (RPD) Table 6-4 Apply “R” to all affected samples if the RPD ≥ 2x MQO.
Apply “J” to all affected samples if RPD > MQO
Accuracy
Mat r i x Sp ike and Mat r i x Sp ike Dupl i ca te Recove ry (%R)
Table 6-4
Apply “Censor” to all affected samples if RPD > 2x high MQO or < 2x low MQO. Apply “J” to all affected samples if %R > high MQO or < low MQO (spike recovery limits do not apply when sample concentration exceeds the spike concentration by a factor of 4 or greater).
Discharge Table 6-3 Apply “J” to all affected storm events.
Water Level Table 6-3 Apply “J” to all affected storm events
Precipitation Table 6-3 Apply “J” to all affected storm events
Sensitivity Reporting Limits (RL)
Tables 6-5 and 6-6
Apply “J” to all affected samples (reported as <RL) if the reported RL≤ 2 times specified RL. Apply “R” to all affected samples if the reported RL is >5x the specified RL and the parameter was not detected.
Consistency, technical Total/Dissolved Table 6-4 Apply “J” if dissolved fraction is > total
Apply “R” if dissolved fraction is > 120% of total, and one detection of the pair is > 5x the target reporting level
Completeness
Analytical data 90%
Estimate of the amount of successfully collected data versus the amount intended (based on MQOs) in the experimental design. If percent of useable data collected over a year period (the water-year) < criterion the MQO was not met.
Hydrologic data 90% of the data record is present
Completeness will be assessed on the basis of the occurrence of gaps in the data record for all monitoring equipment.

S8 Program - Phase I Municipal Stormwater NPDES Permit Page 22 of 56 Quality Assurance Project Plan
Revision: S8-004 (Final) Revision Date: 03/31/2010
Table 6-2 cont. Method Quality Objectives and Actions of Nonconformance.
Data Quality Indicator
Evaluation MQO (criterion) Action
Representativeness
Qual i t a t i ve Assessment o f methodo logy
Analytical Methods in
Tables 6-5 and 6-6. Field methods
(Section 8).
Representativeness is maintained by following procedures such as complying with a statistically-based field sampling design and proper sample homogenization. If sampling and analytical methods did not conform to established plans and methods, the MQO for representativeness may not have been met.
Any deviations from these methodologies must be approved in writing by the QAC in accordance with the procedures outlined in Sections 11.2. Deviations that are deemed unacceptable will result in rejected values (R).
Qual i t a t i ve Assessment o f Ho ld ing t ime & Preservat i on
Tables 8-1 and 8-2
Apply “J” to all samples that exceeded the holding time by <48 hours. Apply “R” to all samples that exceeded the holding time by ≥48 hours
Qua l i t a t i ve Assessment o f s torm event sampled
S8D QAPP: Tables 7-10 and
7-11 Did the sampling event meet the established storm criteria?
Qual i t a t i ve Assessment o f sampler per f ormance
S8D QAPP Section 8
Did the sampler collect a valid flow-paced sample and capture the appropriate storm volume?
Qual i t a t i ve Assessment o f spec i f ied s torm event c r i te r ia
S8D QAPP Section 8
Does the storm event criteria specified represent typical site conditions? See Smoley (1993). Is the monitoring conducted over a sufficient period to represent climatic conditions for the site?
Comparability Qual i t a t i ve Assessment Adequate
Expected level of confidence with which data sets from different sources (e.g., related projects, different analytical methods, different sampling locations, or sampling teams) can be compared to one another. If sampling and analytical methods did not conform to collaboratively standardized field, and established laboratory methods, the MQO for comparability may not have been met.
6.2.1 Bias, precision and accuracy
Bias, precision and accuracy objectives are presented in Table 6-3 and 6-4.
Table 6-3. MQOs for hydrological accuracy and bias.
Measurement Type Operational Range Sensitivity Accuracy measured as %Bias Discharge 0.05 to 45 cfs 0.05 cfs 20% when 10% < Q < 90% of operational range
35% when 90% < Q < 10% of operational range
Water Level 0.01 to 0.01 feet 10%
Precipitation Depth 0.02 to 12 inches 0.02 in 10% tipping bucket volume

S8 Program - Phase I Municipal Stormwater NPDES Permit Page 23 of 56 Quality Assurance Project Plan
Revision: S8-004 (Final) Revision Date: 03/31/2010
Table 6-4. MQOs for analytical precision, accuracy, and bia
Parameter
s
Bias Precision Accuracy Field Testing
Conductivity + 5% + 5% NA pH by meter + 0.5 units + 0.5 NA Depth + 0.2 meters not necessary NA
Laboratory Analyses - Water
Conventional Constituents in Water, including nutrients
Standard Reference Materials (SRM, CRM, PT) within 80% CI stated by provider of material. If not available then with 80% to 120% of true value
Laboratory duplicate 20% RPD, field duplicate and MS/MSD 40% RPD
Matrix spike and duplicate recovery 75% - 125%
Synthetic Organic Analytes (including PCBs, PAHs, pesticides)
Standard Reference Materials (SRM, CRM, PT) within 70% CI stated by provider of material. If not available then with 50% to 150% of true
Lab duplicate 25% RPD, field duplicate and MS/MSD 50% RPD
Matrix spike and duplicate recovery 50% - 150%
Trace metals in water, including mercury
Standard Reference Materials (SRM, CRM, PT) within 75% CI stated by provider of material. If not available then with 75% to 125% of true value
Laboratory duplicate 20% RPD, field duplicate and MS/MSD 40% RPD.
Matrix spike and duplicate recovery 75% - 125%
Bacteria/ Pathogens Laboratory positive and negative cultures – proper positive or negative response. Bacterial PT sample -– within the stated acceptance criteria.
Laboratory or field duplicate 50% RPD
NA
Laboratory Analyses –Sediment
Organic compounds (PCBs) and semi-volatiles ( PAHs, pesticides) & volatiles
Standard Reference Materials (SRM, CRM, PT) within 70% CI stated by provider of material. If not available then with 50% to 150% of true value
Lab duplicate 25% RPD, field duplicate and MS/MSD 50% RPD
Matrix spike and duplicate recovery 50% - 150%
Trace metals (including mercury)
Standard Reference Materials (SRM, CRM, PT) within 75% CI stated by provider of material. If not available then with 75% to 125% of true
Laboratory duplicate 20% RPD, field duplicate and MS/MSD 40% RPD.
Matrix spike and duplicate recovery 75% - 125%
Tota l organic carbon in sediment and sediment grain size
Standard Reference Materials (SRM, CRM, PT) within 75% CI stated by provider of material. If not available then with 75% to 125% of true
Replicates within 20% RPD Matrix spike and duplicate recovery 75% - 125%
Toxicity testing
Laboratory Analyses - Other
Meet all performance criteria in method relative to reference toxicant.
Meet all performance criteria in method re la t ive to sample
NA

S8 Program - Phase I Municipal Stormwater NPDES Permit Page 24 of 56 Quality Assurance Project Plan
Revision: S8-004 (Final) Revision Date: 03/31/2010
6.2.2 Representativeness
The representativeness of the data is dependent on 1) the sampling locations, 2) the flow regime during sample collection 3) the number of years sampling is performed, and 4) the sampling procedures. The City of Tacoma is able to illustrate representativeness of sample sites through comparison to historical monitoring data and combining efforts of multiple monitoring regimes (NPDES and Superfund).
6.2.2.1 Stormwater Quality Stormwater representativeness is achieved by selecting sample locations, methods and times so that the data describes the characteristics of stormwater runoff from the area of interest, the varying hydrologic conditions within an individual storm event (i.e., rising and falling portions of the hydrograph), and a representative cross-section of storm types. Additional details regarding representativeness of sample location, collection of storm flows, and the criteria used for sampling are presented in each QAPP.
Representativeness of characteristics of stormwater runoff at each monitoring site will be discussed in each QAPP.
Representativeness of individual storm events – Stormwater (both whole-water and filtered) samples will be flow-weighted composite samples representing 75 percent of the hydrograph for storms less than 24 hours. For storms greater than 24 hours, the flow-weighted composite sample will represent 75 percent of the hydrograph from the first 24-hours of the storm.
Representativeness of storm types – Storm event criteria have been selected to consider the variation in storm event runoff volume, flow rate, antecedent rainfall conditions, and season. In addition, monitoring will be conducted over a sufficient length of time to ensure that data are collected during representative climatic conditions for the region.
Representativeness of toxicity results – Toxicity analyses will be performed on stormwater samples collected from the conveyance system. This does not necessarily represent conditions to which aquatic life may be exposed.
6.2.2.2 Stormwater Sediment Quality Sediment traps are useful monitoring tools to help identify chemical concentrations in suspended sediments in stormwater. There are several issues relevant to the representativeness of sediment trap samples. It is difficult to predict potential sampling biases that may occur during sediment trapping, but considering the perturbations in the flow field that the bottle creates, certain grain size fractions in the suspended load could be preferentially trapped. In addition, the physical characteristics of each sediment trap sampling location vary such that a different range and/or type of flows, and therefore, storm conditions may be sampled. Because there is a minimum height at which the sediment trap is over topped and starts to collect sample, some sediment traps may not be collecting sample during smaller storms, and the frequency of such occurrence will vary from location to location.
6.2.3 Completeness and Comparability
The completeness of the data will be maximized by using proven sampling techniques, packaging samples for transport to avoid breakage, and timely processing at the laboratory. The analytical requirements will be met to assure acceptable data. Where possible, excess sample will be archived

S8 Program - Phase I Municipal Stormwater NPDES Permit Page 25 of 56 Quality Assurance Project Plan
Revision: S8-004 (Final) Revision Date: 03/31/2010
until the laboratory results can be reviewed by the project manager. A completeness target of 90 percent for the successfully sampled storms has been set for this study. Stormwater sampling is difficult. Through past experience, the City expects 33% of qualifying storms will require rejection of the sample prior to submission to the laboratory. A record of sampling attempts, success, failures and reasoning will be maintained for inclusion in the yearly report. Comparability is encouraged by strict adherence to collaboratively standardized field methods, approved/accredited laboratory procedures and improved over time through laboratory intercalibration. Data processing, including use of common units, rounding and statistical procedures will increase comparability.
6.2.4 Sensitivity (Reporting Limits)
Reporting limits targets (goals) were listed in Appendix 10 of the permit. The methods, reporting limit goals and accredited laboratory to be used by the City are presented in Table 6-5 for surface water and Table 6-6 in sediment. The City is accredited for the majority of NPDES parameters (Accreditation M682-10) and will use the following laboratories for non-accredited analyses;
• Water Management Laboratories (WML). Accreditation C546-11, Chris Muller. 253-531-3121
o Fecal coliforms • Nautilus Environmental, Accreditation C587-11, Mary Ann Rempel-Hester, 253-922-4296
o Acute toxicity • Analytical Resources Incorporated (ARI), Accred C558-10a, Dave Mitchell (206) 695-6205
o Grain size o Particle size distribution

S8 Program - Phase I Municipal Stormwater NPDES Permit Page 26 of 56 Quality Assurance Project Plan
Revision: S8-004 (Final) Revision Date: 03/31/2010
Table 6-5. Method and reporting limit goals for surface water.
Parameter Method Reporting Limit
Target Accredited Laboratory
Conventionals Biochemical oxygen demand SM5210B 2.0 mg/l COT Chloride SM 4500Cl-E 0.2 mg/l COT Conductivity, specific SM2510B 1 µS/cm COT Hardness EPA200.8 0.05 mg/l COT
Particulate size distribution ASTM D3977/ Beckman CC 1 µm ARI
pH SM 4500-H 0.1 units COT Surfactants (MBAS) SM5540C 0.025 mg/l COT Total suspended solids SM2540D 1.0 mg/l COT Turbidity EPA180.1 ±0.2 NTU COT
Bacteria Fecal Coliform SM9221E 2 min, 2E6 max WML
Nutrients Phosphorous, total EPA365.4 0.01 mg/l COT Orthophosphate EPA365.1 0.01 mg/l COT Total Kjeldahl Nitrogen SM4500NOrgB 0.5 mg/l COT Nitrate-nitrite EPA353.2 0.01 mg/l COT
Metals Mercury, total and dissolved EPA7470 0.1 ug/l COT Cadmium EPA200.8 0.2µg/l COT Cadmium, dissolved EPA200.8 0.1 µg/l COT Copper, total and dissolved EPA200.8 0.1 µg/l COT Lead, total and dissolved EPA200.8 0.1 µg/l COT Zinc EPA200.8 5 µg/l COT Zinc, dissolved EPA200.8 1 µg/l COT
Organics PAHs EPA8270D 0.1 ug/l COT Phthalate esters EPA8270D 1.0 ug/l COT Pesticides EPA8270D 0.01-1.0 ug/l COT TPH, NWTPH-Dx Ecology97-602 0.5 mg/l COT TPH, NWTPH-Gx Ecology97-602 0.25 mg/l COT
Toxicity
Toxicity, acute EPS/1/RM/28 1998
(Env Canada) Nautilus

S8 Program - Phase I Municipal Stormwater NPDES Permit Page 27 of 56 Quality Assurance Project Plan
Revision: S8-004 (Final) Revision Date: 03/31/2010
Table 6-6. Method and reporting limit goals for sediment.
Parameter Method Reporting Limit
Target Accredited Laboratory
Total solids SM2540B 1% COT Total volatile solids EPA 160.4 0.1% COT Grain size D422 NA ARI Total organic carbon SM5310B 0.05% COT Total phosphorus EPA 365.4 0.01 mg/kg COT Total recoverable cadmium, copper and lead EPA200.8 0.1mg/kg
COT
Total recoverable mercury EPA7471 0.02mg/kg COT Total recoverable zinc EPA 200.8 0.5 mg/kg COT PAH EPA8270D 70 µg/kg dry COT Phthalates EPA8270D 70 µg/kg dry COT Phenolics EPA8270D 70 µg/kg dry COT PCBs EPA8082 80 µg/kg dry COT Chlorpyrifos and malathion EPA8270D SIM 25 µg/kg COT Diazinon EPA8270D SIM 25 µg/kg COT Pentachlorophenol EPA8270D SIM 170 µg/kg COT NWTPH-Dx NWTPH-Dx 25 mg/kg COT

S8 Program - Phase I Municipal Stormwater NPDES Permit Page 28 of 56 Quality Assurance Project Plan
Revision: S8-004 (Final) Revision Date: 03/31/2010
7 SAMPLING PROCESS DESIGN (EXPERIMENTAL DESIGN) In each QAPP, this section will describes general sampling design elements for S8D, S8E and S8F to support the program objectives identified in each QAPP. In general, three steps are specified prior to the initiation of any stormwater field collection activities. They include:
Selection of the monitoring locations, Development of the stormwater sampling strategy, and Selection of the equipment to meet the study objectives and the site specific
needs of the selected locations.
Site-specific information is discussed in each QAPP.
7.1 Summary of Long-term Rainfall Data This section summarizes the collected and in-progress statistical evaluations for long-term rainfall data for NOAA Tacoma No. 1 rain gage CTP01, which is located at 2201 Portland Avenue, City’s Central Wastewater Treatment Plant (CTP) (Building E). 15 minute data is also collected using an ISCO Model 675 rain gage (tipping bucket), STP01, which is also located on the STP-1 Digester at the CTP. These rain gauges are located roughly 1 mile east of the Thea Foss monitoring stations. Figure 3-1 shows the location of the rain gages. The total monthly, annual and seasonal precipitation for September 2001: August 2007 Thea Foss monitoring program and historical statistics are shown in Tables 7-1 and 7-2 (Tacoma 2008c).
Table 7-1. CTP rain gage historical monthly totals.
Month
Tacoma 1 Mar 82-Dec 99
Average Monthly Rainfall (inches)
Tacoma City Hall June 48-Dec 81 Average Monthly Rainfall (inches)
Tacoma 1 Average
Sept 2001-Aug 2007
(inches)
September 1.16 2.02 1.07 October 3.61 3.32 3.42 November 6.88 5.34 7.35 December 5.45 6.09 6.07 January 5.82 5.46 7.59 February 4.12 4.02 2.55 March 4.22 3.43 3.76 April 3.13 2.4 2.73 May 2.05 1.46 1.74 June 1.64 1.35 1.22 July 0.87 0.82 0.52
August 0.78 1.21 0.67
TOTAL 39.73 36.92 38.69 Rainfall data from Tacoma 1 - NOAA Station at Central Wastewater Treatment Plant, Tacoma, WA
50.00 above historical monthly average 20.00 below historical monthly average

S8 Program - Phase I Municipal Stormwater NPDES Permit Page 29 of 56 Quality Assurance Project Plan
Revision: S8-004 (Final) Revision Date: 03/31/2010
Table 7-2. CTP rain gage historical seasonal totals. Water Year Totals Wet Dry 10/1 - 4/30 5/1 - 9/30 Composite - June 1948-Dec 1999 31.34 6.81
Tacoma No. 1 - March 1982-Dec 1999 33.39 5.59 Tacoma City Hall - June 1948-Dec 1981 30.25 6.93
Tacoma No. 1 Aug 27, 2001 to Aug 26, 2007 33.47 5.23 Thea Foss Program Seasonal Precipitation Totals
Dry-Wet
Transition Wet Wet-Dry
Transition Dry 8/27-10/15 10/16-1/31 2/1-4/30 5/1 -8/26 Composite - June 1948-Dec 1999 3.35 19.42 10.46 4.85
Tacoma No. 1 - March 1982-Dec 1999 2.60 20.59 11.50 5.17 Tacoma City Hall - June 1948-Dec 1981 3.75 18.80 9.91 4.68
Tacoma No. 1 Aug 27, 2001 to Aug 26, 2007 2.06 23.21 8.94 4.20 Rainfall data from Tacoma 1 - NOAA Station at Central Wastewater Treatment Plant, Tacoma, WA
50.00 above historical monthly average 20.00 below historical monthly average
Based on a 52 year rainfall record, the Thea Foss 2001 Sampling and Analysis Plan defines a region specific stormwater monitoring year from August 27 to August 26 of the following year (Tacoma 2001). This analysis was presented in the 2001 SAP, Appendix G. These annual rainfall patterns for Tacoma were subdivided into four seasons:
1. Dry-to-Wet Transition. One and one half months dry to wet transitional period from August 27 to October 15.
2. Wet. Three and one-half months wet period from October 16 through January. 3. Wet-to-Dry Transition. Three months wet to dry transitional period from February
through April. 4. Dry. Four months dry period from May to August 26.
The four seasons were selected based on periods where consistent trends were observed. The transitional periods consist of a steady decline (wet to dry transition) or increase (dry to wet transition) in daily precipitation. The dry and wet periods show little change in monthly average or 21-day average precipitation data. Historically several significant rainfall events occurred on or after August 27th such that this date was selected as a marked change from dry to transitional rainfall pattern. October 16th
was also selected as a marked change from transitional to consistent 21-day average pattern.
For this project, water year will be reported as October-September, with wet season as October –April and dry season as May – September.

S8 Program - Phase I Municipal Stormwater NPDES Permit Page 30 of 56 Quality Assurance Project Plan
Revision: S8-004 (Final) Revision Date: 03/31/2010
7.2 Stormwater Monitoring Strategy This section provides a general discussion of common stormwater monitoring strategies for S8 and includes:
• parameters and analytical methods,
• sampling techniques and types, and
• sampling frequency and criteria to ensure representative samples.
7.2.1 Parameters and Analytical Methods
Ecology selected pollutants to be monitored based upon their known presence in stormwater, their potential for adverse impacts, or their value in providing necessary supporting information (see Section 3.3 for additional information). A significant sampling design concern is the ability to obtain adequate sample volume to complete the selected analyses. In each QAPP, this section will discuss the selected parameters, the volumes required to analyze those parameters, and the priority order in which analyses will be conducted. The estimated volumes needed for stormwater analytical chemistry, toxicity samples and sediments are listed in Table 7-3.
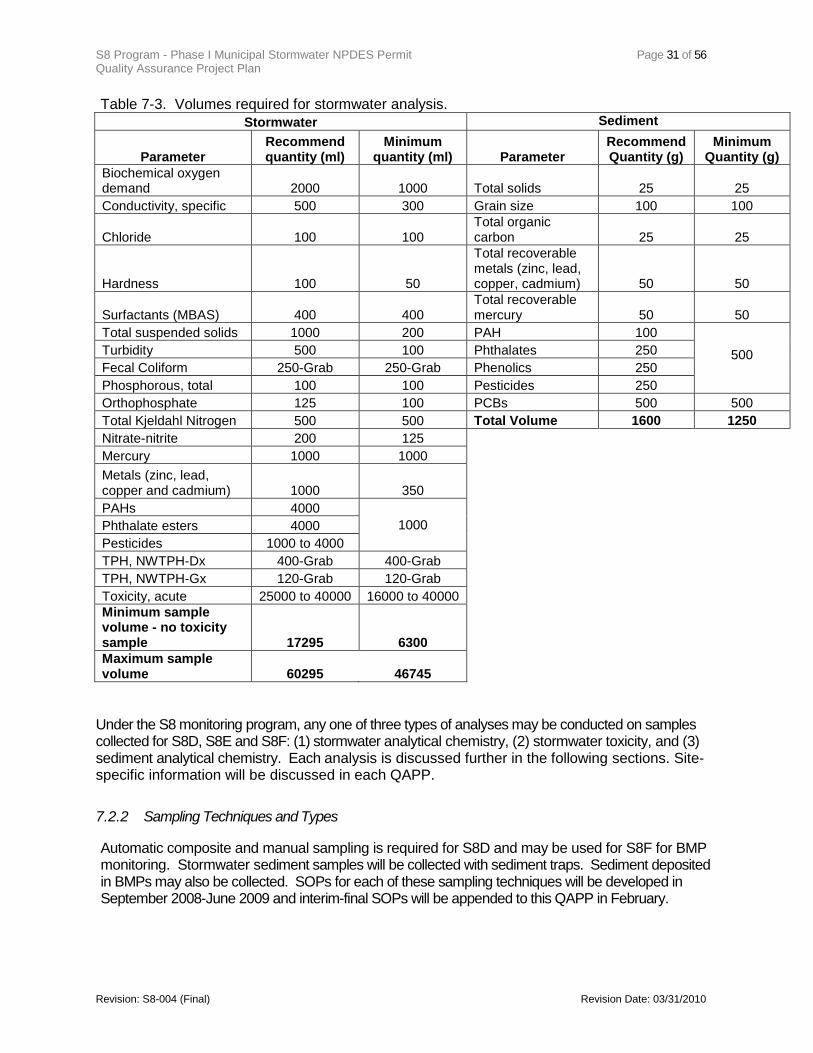
S8 Program - Phase I Municipal Stormwater NPDES Permit Page 31 of 56 Quality Assurance Project Plan
Revision: S8-004 (Final) Revision Date: 03/31/2010
Table 7-3. Volumes required for stormwater analysis. Stormwater Sediment
Parameter Recommend quantity (ml)
Minimum quantity (ml) Parameter
Recommend Quantity (g)
Minimum Quantity (g)
Biochemical oxygen demand 2000 1000 Total solids 25 25 Conductivity, specific 500 300 Grain size 100 100
Chloride 100 100 Total organic carbon 25 25
Hardness 100 50
Total recoverable metals (zinc, lead, copper, cadmium) 50 50
Surfactants (MBAS) 400 400 Total recoverable mercury 50 50
Total suspended solids 1000 200 PAH 100 500
Turbidity 500 100 Phthalates 250 Fecal Coliform 250-Grab 250-Grab Phenolics 250 Phosphorous, total 100 100 Pesticides 250 Orthophosphate 125 100 PCBs 500 500 Total Kjeldahl Nitrogen 500 500 Total Volume 1600 1250 Nitrate-nitrite 200 125 Mercury 1000 1000 Metals (zinc, lead, copper and cadmium) 1000 350 PAHs 4000
1000
Phthalate esters 4000 Pesticides 1000 to 4000 TPH, NWTPH-Dx 400-Grab 400-Grab TPH, NWTPH-Gx 120-Grab 120-Grab Toxicity, acute 25000 to 40000 16000 to 40000 Minimum sample volume - no toxicity sample 17295 6300
Maximum sample volume 60295 46745
Under the S8 monitoring program, any one of three types of analyses may be conducted on samples collected for S8D, S8E and S8F: (1) stormwater analytical chemistry, (2) stormwater toxicity, and (3) sediment analytical chemistry. Each analysis is discussed further in the following sections. Site-specific information will be discussed in each QAPP.
7.2.2 Sampling Techniques and Types
Automatic composite and manual sampling is required for S8D and may be used for S8F for BMP monitoring. Stormwater sediment samples will be collected with sediment traps. Sediment deposited in BMPs may also be collected. SOPs for each of these sampling techniques will be developed in September 2008-June 2009 and interim-final SOPs will be appended to this QAPP in February.
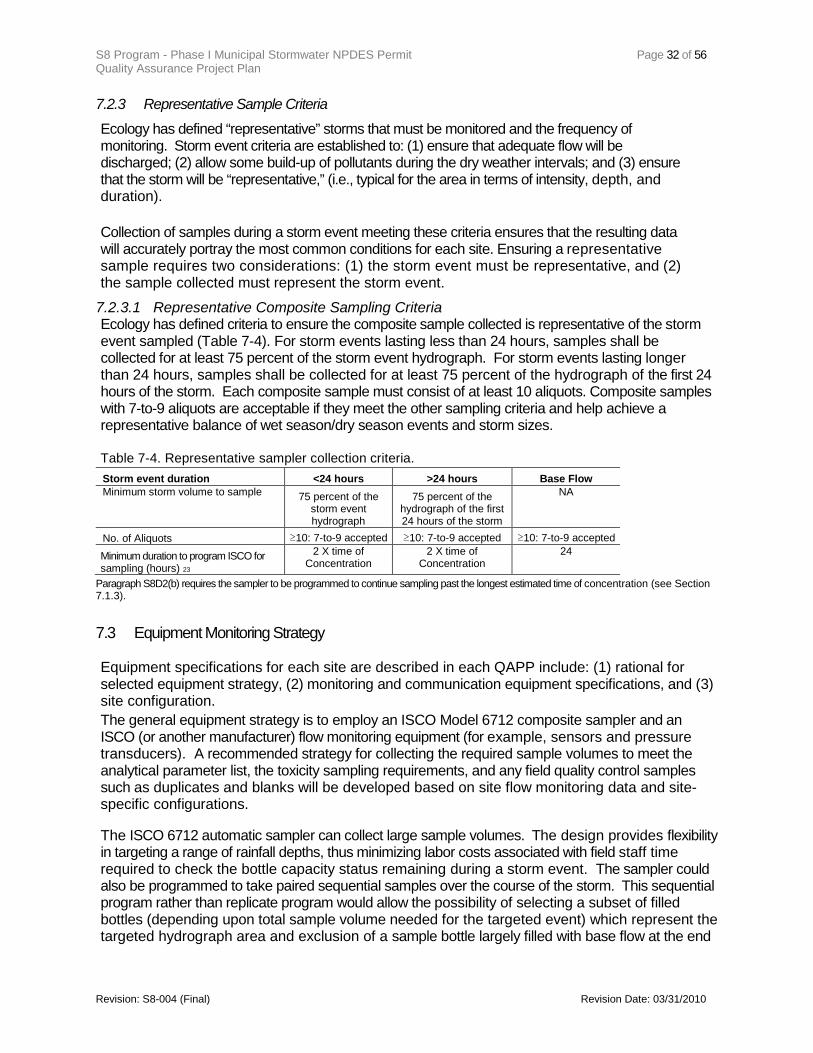
S8 Program - Phase I Municipal Stormwater NPDES Permit Page 32 of 56 Quality Assurance Project Plan
Revision: S8-004 (Final) Revision Date: 03/31/2010
7.2.3 Representative Sample Criteria
Ecology has defined “representative” storms that must be monitored and the frequency of monitoring. Storm event criteria are established to: (1) ensure that adequate flow will be discharged; (2) allow some build-up of pollutants during the dry weather intervals; and (3) ensure that the storm will be “representative,” (i.e., typical for the area in terms of intensity, depth, and duration).
Collection of samples during a storm event meeting these criteria ensures that the resulting data will accurately portray the most common conditions for each site. Ensuring a representative sample requires two considerations: (1) the storm event must be representative, and (2) the sample collected must represent the storm event.
7.2.3.1 Representative Composite Sampling Criteria Ecology has defined criteria to ensure the composite sample collected is representative of the storm event sampled (Table 7-4). For storm events lasting less than 24 hours, samples shall be collected for at least 75 percent of the storm event hydrograph. For storm events lasting longer than 24 hours, samples shall be collected for at least 75 percent of the hydrograph of the first 24 hours of the storm. Each composite sample must consist of at least 10 aliquots. Composite samples with 7-to-9 aliquots are acceptable if they meet the other sampling criteria and help achieve a representative balance of wet season/dry season events and storm sizes.
Table 7-4. Representative sampler collection criteria. Storm event duration <24 hours >24 hours Base Flow Minimum storm volume to sample 75 percent of the
storm event hydrograph
75 percent of the hydrograph of the first 24 hours of the storm
NA
No. of Aliquots ≥10: 7-to-9 accepted ≥10: 7-to-9 accepted ≥10: 7-to-9 accepted
Minimum duration to program ISCO for sampling (hours) 23
2 X time of Concentration
2 X time of Concentration
24
Paragraph S8D2(b) requires the sampler to be programmed to continue sampling past the longest estimated time of concentration (see Section 7.1.3).
7.3 Equipment Monitoring Strategy
Equipment specifications for each site are described in each QAPP include: (1) rational for selected equipment strategy, (2) monitoring and communication equipment specifications, and (3) site configuration. The general equipment strategy is to employ an ISCO Model 6712 composite sampler and an ISCO (or another manufacturer) flow monitoring equipment (for example, sensors and pressure transducers). A recommended strategy for collecting the required sample volumes to meet the analytical parameter list, the toxicity sampling requirements, and any field quality control samples such as duplicates and blanks will be developed based on site flow monitoring data and site-specific configurations.
The ISCO 6712 automatic sampler can collect large sample volumes. The design provides flexibility in targeting a range of rainfall depths, thus minimizing labor costs associated with field staff time required to check the bottle capacity status remaining during a storm event. The sampler could also be programmed to take paired sequential samples over the course of the storm. This sequential program rather than replicate program would allow the possibility of selecting a subset of filled bottles (depending upon total sample volume needed for the targeted event) which represent the targeted hydrograph area and exclusion of a sample bottle largely filled with base flow at the end

S8 Program - Phase I Municipal Stormwater NPDES Permit Page 33 of 56 Quality Assurance Project Plan
Revision: S8-004 (Final) Revision Date: 03/31/2010
of an event. Additionally, samples excessively impacted by tides/saltwater will be eliminated. Depending upon the compositing approach chosen, additional sample handling may be required to composite the sequential samples. The best programming approach will be fined tuned once actual site flow data is available.

S8 Program - Phase I Municipal Stormwater NPDES Permit Page 34 of 56 Quality Assurance Project Plan
Revision: S8-004 (Final) Revision Date: 03/31/2010
8 SAMPLING (FIELD) PROCEDURES This section describes field procedures that will be utilized to ensure that samples are collected in a consistent manner and are representative of the matrix being sampled, and the data will be comparable to data collected by other existing and future monitoring programs.
The quality of data collected in an environmental study is critically dependent upon the quality and thoroughness of field sampling activities. General field operations, practices, and specific sample collection will be well planned and carefully implemented and follow specific Standard Operating Procedures (SOPs) that support the following field activities:
• Monitoring Equipment Installation and Setup • Storm Tracking and Forecasting • Flow monitoring • Automatic flow-weighted composite sampling • Grab Sampling • Sediment Sampling • Equipment Decontamination • Equipment Maintenance and Calibration
These SOPs will include requirements for training and documentation of activities, collection of field quality control samples, and description of “Clean Handling Techniques” where appropriate. A general description of field activities is provided below. Specific details will be provided in each QAPP.
8.1 Sample Collection Procedures A general discussion of sample collections procedures is described below. Specific details will be provided in the SOPs.
8.1.1 Decontamination Procedures
8.1.1.1 Sample Bottles The City laboratory will provide glass containers for collecting stormwater samples. Glass containers and jars (ISCO 1000ml glass containers) will be pre-cleaned according to COT laboratory SOP entitled, ‘Glassware Cleaning Following EPA Protocols’ (attached). Essentially, the cleaning process includes:
• Wash by hand with soap and scrub brush using Liqui-Nox or equivalent non-phosphorus and ‘rinse free’ detergent.
• Every cleaning step is followed by rinsing with reagent grade water. Reagent grade water produced by the City of Tacoma laboratory meets the ASTM Type I, 18 MOhm, standard.
• The bottles are placed in laboratory dishwater and alternately washed with alkaline, acid and sequestering solutions (Neodisher FLA, Z and TR3 – Fact Sheets attached). All solutions are phosphate free and do not contain surfactants. The sequestering stage is conducted last to remove metal salts.
• Rinse with reagent grade water • Heat and dry • Bottles will be sealed with Teflon caps and labeled Level B, Appropriate for NPDES and
Foss stormwater sampling.

S8 Program - Phase I Municipal Stormwater NPDES Permit Page 35 of 56 Quality Assurance Project Plan
Revision: S8-004 (Final) Revision Date: 03/31/2010
• Field and laboratory blanks, conducted at a rate of 10% of the sample load, will be used to assess glassware cleaning performance.
Certification information is kept in the glassware certification file and is available for review at any time. The containers will be certified to the detection limits of the project. Teflon sediment sample bottles will be cleaned using the same process. Stainless steel materials used for sediment sampling will be cleaned with phosphate and rinse free detergent (hot soapy water), rinsed with reagent grade water, rinsed with acetone and allowed to air dry. 8.1.1.2 Automated Sampling Equipment Prior to installation, all automatic sampling equipment (ISCO sampler head, Teflon suction tubing, strainers, silicone tubing and all other sampling equipment except glass sampling jars), will be cleaned by running the pump on continuous suction for two minutes with each of the following solutions
• Hot soapy water (Liqui-Nox or equivalent). • Hot water • 5% nitric acid • Reagent grade water
After decontamination, the Teflon suction tubing, strainers and silicone tubing will be wrapped with tinfoil until placed in the field. The ends of the tubing will also be capped with tinfoil. After the equipment has been installed and used, the ISCO sampler head (silicon tubing only) and ISCO base will be decontaminated at the lab using the same steps, but the Teflon tubing will be left in place at the sample station and rinsed with 1 gallon of laboratory pure water between each sample event or during routine maintenance. The ISCO sampling program will also rinse and purge the entire sample line with stormwater prior to sampling (obtaining aliquot). Teflon tubing is inspected following each sample event, and will be replaced with pre-cleaned tubing if integrity is compromised. Equipment rinsate blanks will be performed by running enough reagent grade water through a decontaminated Teflon sampler hose, strainer and silicone pump tube installed in the sampler, into a pre-cleaned container until sufficient volume is collected to run the analytes of interest. Equipment rinsate blanks will be run at 10% of the sample load.
8.2 Sample Handling & Custody Sample handling and custody procedures ensure that uniquely identifiable samples are transported to the analytical laboratory with appropriate preservation within prescribed holding times and with proper documentation. Written documentation of sample custody from the time of sample collection through the generation of data by analysis of that sample is recognized as a vital aspect of an environmental study. The chain-of-custody of the physical sample and its corresponding documentation will be maintained throughout the handling of the sample by following the procedures outlined below.
Table 8-1 presents stormwater and Table 8-2 presents sediment sample container type, holding time, preservative and reference for each required parameter. Orthophosphorus and dissolved metals have a 15-minute holding time prior to filtration. The City will not be able to meet this limit and will attempt to define an alternative procedure with Ecology and through the collaborative standard operating procedure project.

S8 Program - Phase I Municipal Stormwater NPDES Permit Page 36 of 56 Quality Assurance Project Plan
Revision: S8-004 (Final) Revision Date: 03/31/2010
Table 8-1. Stormwater container, preservation and holding time.
Parameter Container Preservation1 Maximum holding time2 Reference3,4
Conventionals
5
Biochemical oxygen demand P, FP, G Cool, ≤6 °C 48 hours. 6 40 CFR 136
Conductivity, specific P, FP, G Cool, ≤6 °C 28 days. 6 40 CFR 136 Chloride P, FP, G None required 28 days. 40 CFR 136
Hardness P, FP, G HNO3 or H2SO4 to pH<2 6 months. 40 CFR 136
Surfactants (MBAS) P, FP, G Cool, ≤6 °C 48 hours. 6 40 CFR 136
Total suspended solids P, FP, G Cool, ≤6 °C 7 days. 6 40 CFR 136
Turbidity P, FP, G Cool, ≤6 °C 48 hours. 6 40 CFR 136 Bacteria
Fecal Coliform PA, G Cool, <10 °C 6 hours. 40 CFR 136 7 Nutrients
Phosphorous, total P, FP, G Cool, ≤6 °C6
28 days. , H2SO4
to pH<2 40 CFR 136
Orthophosphate P, FP, G Cool, ≤6 °CFilter within 15 minutes
6 8
40 CFR 136 ;
Analyze within 48 hours.
Total Kjeldahl Nitrogen P, FP, G Cool, ≤6 °C6
28 days. , H2SO4
to pH<2 40 CFR 136
Nitrate-nitrite P, FP, G Cool, ≤6 °C6
28 days. , H2SO4
to pH<2 40 CFR 136 Metals
Mercury P, FP, G 8 HNO3 to pH<2 28 days. 9 40 CFR 136
Metals (zinc, lead, copper and cadmium) P, FP, G 8
HNO3 to pH<2, or at least 24 hours prior to analysis 6 months. 9 40 CFR 136
Organics
PAHsG, FP-lined cap 10
Cool, ≤6 °C6 7 days until extraction, 40 days after extraction.
, store in dark 40 CFR 136
Phthalate estersG, FP-lined cap 10 Cool, ≤6 °C
7 days until extraction, 40 days after extraction. 6 40 CFR 136
PesticidesG, FP-lined cap 10 Cool, ≤6 °C
7 days until extraction, 40 days after extraction. 6 40 CFR 136
TPH, NWTPH-Dx G, FP-lined cap
HCl to pH < 2, Cool to 4o 7 days C Ecology 97-602
TPH, NWTPH-Gx G, septum HCl to pH < 2, Cool to 4o 7 days C
Toxicity Toxicity, acute P, FP, G Cool, ≤6 °C 36 hours. 11 40 CFR 136
Notes for Table 8-1:
1“P” is polyethylene; “FP” is fluoropolymer (polytetrafluoroethylene (PTFE; Teflon&supreg;), or other fluoropolymer, unless stated otherwise in this Table II; “G” is glass; “PA” is any plastic that is made of a sterlizable material (polypropylene or other autoclavable plastic); “LDPE” is low density polyethylene. 2Except where noted in this Table II and the method for the parameter, preserve each grab sample within 15 minutes of collection. For a composite sample collected with an automated sampler (e.g., using a 24-hour composite sampler; see 40 CFR 122.21(g)(7)(i) or 40 CFR Part 403, Appendix E), refrigerate the sample at ≤6 °C during collection unless specified otherwise in this Table II or in the method(s). For a composite sample to be split into separate aliquots for preservation and/or analysis, maintain the sample at ≤6 °C, unless specified otherwise in this Table II or in the method(s), until collection, splitting, and preservation is completed. Add the preservative to the sample container prior to sample collection when the preservative will not compromise the integrity of a grab sample, a composite sample, or an aliquot split from a composite sample; otherwise, preserve the grab sample, composite sample, or aliquot split from a composite sample within 15 minutes of collection. If a composite measurement is required but a composite sample would compromise sample integrity, individual grab samples must be collected at prescribed time intervals (e.g., 4 samples over the course of a day, at 6-hour intervals). Grab samples must be analyzed separately and the concentrations averaged. Alternatively, grab samples may be collected in the field and composited in the laboratory if the compositing procedure produces results equivalent to results produced by arithmetic averaging of the results of analysis of individual grab samples. For examples of laboratory compositing procedures, see EPA Method 1664A (oil and grease) and the procedures at 40 CFR 141.34(f)(14)(iv) and (v) (volatile organics).

S8 Program - Phase I Municipal Stormwater NPDES Permit Page 37 of 56 Quality Assurance Project Plan
Revision: S8-004 (Final) Revision Date: 03/31/2010
3Samples should be analyzed as soon as possible after collection. The times listed are the maximum times that samples may be held before the start of analysis and still be considered valid (e.g., samples analyzed for fecal coliforms may be held up to 6 hours prior to commencing analysis). Samples may be held for longer periods only if the permittee or monitoring laboratory has data on file to show that, for the specific types of samples under study, the analytes are stable for the longer time, and has received a variance from the Regional Administrator under §136.3(e). For a grab sample, the holding time begins at the time of collection. For a composite sample collected with an automated sampler (e.g., using a 24-hour composite sampler; see 40 CFR 122.21(g)(7)(i) or 40 CFR Part 403, Appendix E), the holding time begins at the time of the end of collection of the composite sample. For a set of grab samples composited in the field or laboratory, the holding time begins at the time of collection of the last grab sample in the set. Some samples may not be stable for the maximum time period given in the table. A permittee or monitoring laboratory is obligated to hold the sample for a shorter time if it knows that a shorter time is necessary to maintain sample stability. See §136.3(e) for details. The date and time of collection of an individual grab sample is the date and time at which the sample is collected. For a set of grab samples to be composited, and that are all collected on the same calendar date, the date of collection is the date on which the samples are collected. For a set of grab samples to be composited, and that are collected across two calendar dates, the date of collection is the dates of the two days; e.g., November 14–15. For a composite sample collected automatically on a given date, the date of collection is the date on which the sample is collected. For a composite sample collected automatically, and that is collected across two calendar dates, the date of collection is the dates of the two days; e.g., November 14–15. 4Holding time is calculated from time of sample collection to elution for samples shipped to the laboratory in bulk and calculated from the time of sample filtration to elution for samples filtered in the field. 5References: 40 CFR Part 136 Table II - Accessed August 13, 2008; Ecology 97-602 – Analytical methods for petroleum hydrocarbons. 6Aqueous samples must be preserved at ≤6 °C, and should not be frozen unless data demonstrating that sample freezing does not adversely impact sample integrity is maintained on file and accepted as valid by the regulatory authority. Also, for purposes of NPDES monitoring, the specification of “ ≤ °C” is used in place of the “4 °C” and “< 4 °C” sample temperature requirements listed in some methods. It is not necessary to measure the sample temperature to three significant figures ( 1/100th of 1 degree); rather, three significant figures are specified so that rounding down to 6 °C may not be used to meet the ≤6 °C requirement. The preservation temperature does not apply to samples that are analyzed immediately (less than 15 minutes). 7Samples analysis should begin immediately, preferably within 2 hours of collection. The maximum transport time to the laboratory is 6 hours, and samples should be processed within 2 hours of receipt at the laboratory. 8Orthophosphorus and dissolved metals have a 15-minute holding time prior to filtration. The City will not be able to meet this limit and will attempt to define an alternative procedure with Ecology and through the collaborative monitoring group. 9An aqueous sample may be collected and shipped without acid preservation (for total metals). However, acid must be added at least 24 hours before analysis to dissolve any metals that adsorb to the container walls. If the sample must be analyzed within 24 hours of collection, add the acid immediately (see footnote 2). Soil and sediment samples do not need to be preserved with acid. The allowances in this footnote supersede the preservation and holding time requirements in the approved metals methods. 10When the extractable analytes of concern fall within a single chemical category, the specified preservative and maximum holding times should be observed for optimum safeguard of sample integrity ( i.e. , use all necessary preservatives and hold for the shortest time listed). When the analytes of concern fall within two or more chemical categories, the sample may be preserved by cooling to ≤6 °C, reducing residual chlorine with 0.008% sodium thiosulfate, storing in the dark, and adjusting the pH to 6–9; samples preserved in this manner may be held for seven days before extraction and for forty days after extraction. 11
Sufficient ice should be placed with the samples in the shipping container to ensure that ice is still present when the samples arrive at the laboratory. However, even if ice is present when the samples arrive, it is necessary to immediately measure the temperature of the samples and confirm that the preservation temperature maximum has not been exceeded. In the isolated cases where it can be documented that this holding temperature cannot be met, the permittee can be given the option of on-site testing or can request a variance. The request for a variance should include supportive data, which show that the toxicity of the effluent samples is not reduced because of the increased holding temperature.

S8 Program - Phase I Municipal Stormwater NPDES Permit Page 38 of 56 Quality Assurance Project Plan
Revision: S8-004 (Final) Revision Date: 03/31/2010
Table 8-2. Sediment container, preservation and holding times.
Parameter Container Preservation 1 Maximum holding time ReferenceTotal solids
2 P, FP, G Cool, ≤6 °C 7 days. 40 CFR 136
Grain size P, FP, G Cool to 4°C 6 months PSEP 1997
Total organic carbon P, FP, G Cool to 4°C 14 days, 12 mos if frozen to -18o PSEP 1997 C
Total recoverable metals (zinc, lead, copper, cadmium) P, FP, G Cool to 4°C 6 months EPA200.8 Total recoverable mercury P, FP, G Cool to 4°C 28 days EPA7471
PAH G, FP-lined cap Cool to 4°C
14 days, 12 mos if frozen to -18o PSEP 1997 C
Phthalates G, FP-lined cap Cool to 4°C
14 days, 12 mos if frozen to -18o EPA8270D C
Phenolics G, FP-lined cap Cool to 4°C
14 days, 12 mos if frozen to -18o PSEP 1997 C
PCBs G, FP-lined cap Cool to 4°C
14 days, 12 mos if frozen to -18o PSEP 1997 C
Pesticides FP, G Cool to 4°C 14 days, 12 mos if frozen to -18o EPA8270D C
1Containers presented in Table 8-1. 2
40CFR136 Accessed August 13, 2008; Puget Sound Estuary Protocols 1997, EPA Method 8270D – revision 4 (2007).
8.2.1 Sample Identification All samples will be clearly labeled in the field with indelible ink. Each sample will be uniquely identified by its sample location identifier combined with the sample method (type and technique, i.e. manual grab, automatic flow-weighted composite), the event date and time stamp, and the sample matrix. For composite samples, the date and time stamp will reflect the last aliquot collected. 8.2.2 Sample Transportation The sample teams will collect the stormwater from the automated samplers or collect grab samples, place the samples on ice, and transport them as soon as possible to the selected analytical laboratory. 8.2.3 Sample Preservation Other than ice, sample preservation will not be required in the field. Sequential and Composite samples will be chilled with ice as they are collected. Grab samples must be chilled immediately following collection. Chemical preservatives are added to the samples for certain analyses to prolong the stability of the parameters during transport and storage. Tables 8-2 and 8-3 list the required sample preservatives for the analytical parameters. If sequential or composite sampling procedures are used, no preservatives are added to the composite container because no single chemical preservative is suitable for all of the parameters to be analyzed. The laboratory must first divide the composite sample into the appropriate bottle for each analysis, and then add chemical preservatives as appropriate for each

S8 Program - Phase I Municipal Stormwater NPDES Permit Page 39 of 56 Quality Assurance Project Plan
Revision: S8-004 (Final) Revision Date: 03/31/2010
analysis. If manual grab sampling procedures are used (i.e., monitoring personnel directly fill the containers required for each analysis), the monitoring personnel will add the appropriate preservative to each sample container immediately. 8.2.4 Sample Processing In general, all samples will be minimally processed in the field to prevent potential contamination from trace pollutants in the atmosphere. Samples will be transported to the analytical laboratory as soon as possible after sample collection. Sample filtration is required when collecting samples for dissolved metals determinations. Filtration for metals will be conducted by the analytical laboratory to reduce the potential for contamination in the field, especially during storm conditions. If sequential sampling procedures are used, field staff will mark on the chain-of-custody, which subsample containers, will be added to the storm composite sample. Laboratory staff will composite those subsamples. During this process, the subsample bottle will be vigorously agitated to ensure that all liquid and solid will be transferred. Once the composite samples have been delivered to or composited by the laboratory, the laboratory staff will transfer the composite sample to the appropriate bottles for the required analytical procedures (see Tables 8-2 and 8-3). During this process, the composite sample bottle will be vigorously agitated to ensure that a representative sample will be transferred to each bottle. In order to minimize exposure of the samples to human, atmospheric, and other potential sources of contamination, laboratory staff will process the samples using “clean” techniques pursuant to protocols developed by the U.S. EPA (1996) for the low-level detection of metals. IIf samples are delivered to the laboratory outside of normal operating hours (6:30 am to 4:30 pm), they will immediately be split, filtered into the appropriate containers and preserved by field personnel. 8.2.5 Holding Times Holding times (Tables 8-2 and 8-3) are short for some parameters, particularly fecal coliform bacteria, nutrients, and BOD (24-to-48 hours). For composite samples, the "sample collection time" used to evaluate holding time limits, is the time that the final sample aliquot is collected. To minimize the risk of exceeding holding times, the Study Manager will coordinate with the analytical laboratory prior to each event to ensure that the laboratory is prepared to begin processing samples as soon as samples are received. In addition, samples will be delivered to the laboratory immediately after retrieval from field samplers. 8.2.6 Chain of Custody Forms A chain-of custody form will accompany each sample batch that is delivered to the laboratory. The purpose of chain-of-custody (COC) forms is to keep a record of the sample submittal information and to document the transfer of sample custody. Standard COC forms will be prepared for the study that will include sample location identifier, analyses to be requested, and any special considerations, such as analyses priority order and sample filtration needs. At the time of sample collection, the field team will record the sample date and time, sample location, matrix, and analyses requested. Any special instructions for the laboratory will also be noted on the COC form such as specifications of quality control requirements (e.g., duplicate samples). The COC form must be signed by both the person relinquishing the samples and the person receiving the samples every time the samples change hands, thus documenting the chain of custody.

S8 Program - Phase I Municipal Stormwater NPDES Permit Page 40 of 56 Quality Assurance Project Plan
Revision: S8-004 (Final) Revision Date: 03/31/2010
8.3 Non-direct Measurements Precipitation data will be collected following Standard Operating Procedures for data collection, validation, and management to ensure it is of known and documented quality.
9 MEASUREMENT PROCEDURES The analytical methods specified for this study were specified have performance characteristics that meet the MQOs for precision, bias, and sensitivity described in Section 6-2.
10 QUALITY CONTROL This section discusses the quality control samples needed (i.e. field splits, trip blanks, field blanks, temperature checks, etc.) to be collected in the field and the laboratory. Detailed laboratory QC requirements are contained within the laboratory Quality Assurance Manual, which will be reviewed by the Study Manager. The MQOs or criterion specified for each QC sample result is summarized in Table 6-2. Sections 10.1 and 10.2 specify the frequency of quality control samples and the Glossary provides definitions and explanations of analytical and field quality control samples.
10.1 Analytical Quality Control Laboratory analytical quality control (QC) procedures involve the use of four basic types of QC samples. QC samples are analyzed within a batch of client samples to provide an indication of the performance of the entire analytical system. Therefore, QC samples go through all sample preparation, clean up, measurement, and data reduction steps in the procedure. In some cases, the laboratory may perform additional tests that check only one part of the analytical system. Please refer to the Glossary for a definition of each laboratory QC sample.
Table 10-1. Laboratory Quality Control Samples by Matrix. QC Sample Matrix Frequency of Analysis Matrix Spike (MS) Water One of each per batch of 20 or fewer samples
of similar matrix. Laboratory (or Matrix) Duplicate (MSD) W a te r
Sediment One of each per batch of 20 or fewer samples of similar matrix.
Method or Preparation Blank (MB) W a te r
Sediment One of each per batch of 20 or fewer samples of similar matrix.
Laboratory Control Samples (LCS) Sediment One of each per batch of 20 or fewer samples of similar matrix.
10.2 Field Quality Control Field quality control (QC) procedures involve the use of two basic types of QC samples: duplicates (or field replicates) and blanks. Please refer to the Glossary for a definition of each. Schedule
• A duplicate will be taken from the composite at a rate of 10% for each sample container and analysis (surface water and sediment). Due to difficulties of sampling within pipes, only one complete field duplicate (replicate automated sampler) will be executed per year.
• A trip blank will accompany sample events for Total Petroleum Hydrocarbons and will be submitted from successfully sampled storms.
• Equipment will not be cleaned in the field. Each piece of equipment, which is not certified pre-cleaned by the manufacturer, will be subjected to two equipment blanks per year.
• Two field blanks will be conducted by field crews to estimate atmospheric/operations contributions of contaminants, including dissolved metals, bacteria and nutrients.
• Each bottle and container will be subjected to two blanks per year.
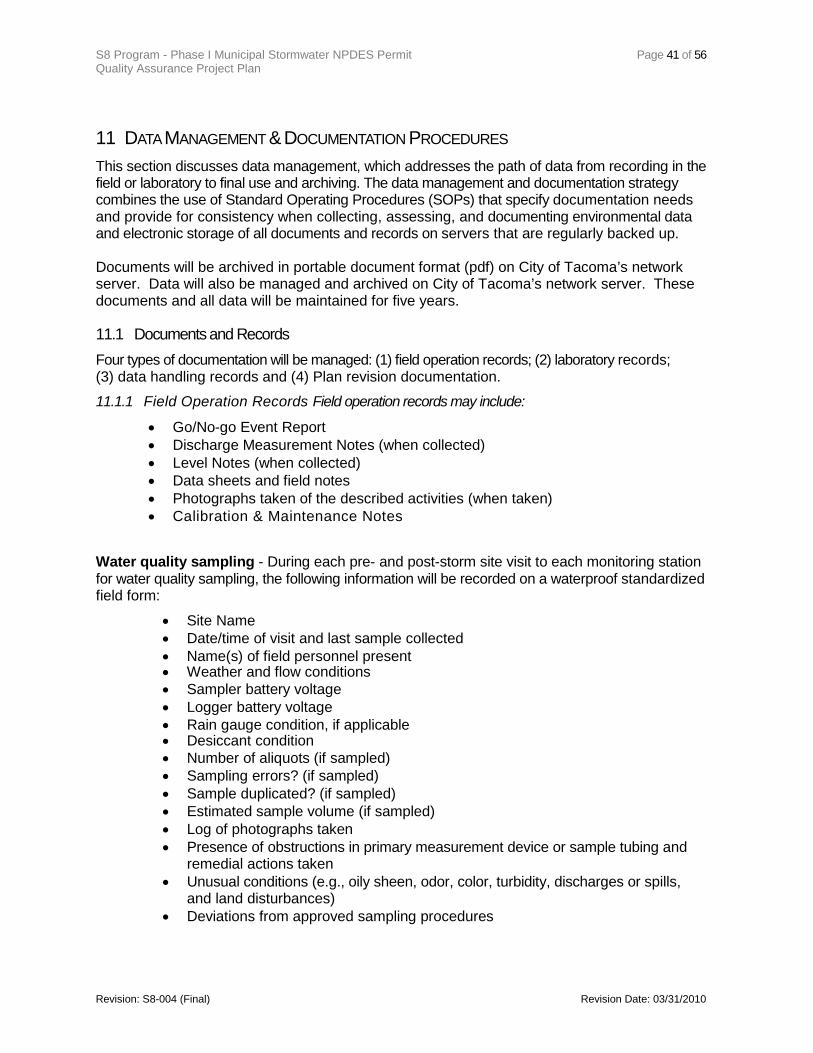
S8 Program - Phase I Municipal Stormwater NPDES Permit Page 41 of 56 Quality Assurance Project Plan
Revision: S8-004 (Final) Revision Date: 03/31/2010
11 DATA MANAGEMENT & DOCUMENTATION PROCEDURES This section discusses data management, which addresses the path of data from recording in the field or laboratory to final use and archiving. The data management and documentation strategy combines the use of Standard Operating Procedures (SOPs) that specify documentation needs and provide for consistency when collecting, assessing, and documenting environmental data and electronic storage of all documents and records on servers that are regularly backed up. Documents will be archived in portable document format (pdf) on City of Tacoma’s network server. Data will also be managed and archived on City of Tacoma’s network server. These documents and all data will be maintained for five years.
11.1 Documents and Records Four types of documentation will be managed: (1) field operation records; (2) laboratory records; (3) data handling records and (4) Plan revision documentation.
11.1.1 Field Operation Records Field operation records may include:
• Go/No-go Event Report • Discharge Measurement Notes (when collected) • Level Notes (when collected) • Data sheets and field notes • Photographs taken of the described activities (when taken) • Calibration & Maintenance Notes
Water quality sampling - During each pre- and post-storm site visit to each monitoring station for water quality sampling, the following information will be recorded on a waterproof standardized field form:
• Site Name • Date/time of visit and last sample collected • Name(s) of field personnel present • Weather and flow conditions • Sampler battery voltage • Logger battery voltage • Rain gauge condition, if applicable • Desiccant condition • Number of aliquots (if sampled) • Sampling errors? (if sampled) • Sample duplicated? (if sampled) • Estimated sample volume (if sampled) • Log of photographs taken • Presence of obstructions in primary measurement device or sample tubing and
remedial actions taken • Unusual conditions (e.g., oily sheen, odor, color, turbidity, discharges or spills,
and land disturbances) • Deviations from approved sampling procedures

S8 Program - Phase I Municipal Stormwater NPDES Permit Page 42 of 56 Quality Assurance Project Plan
Revision: S8-004 (Final) Revision Date: 03/31/2010
Storm Report - The following information will be compiled for each storm sampled:
• Storm precipitation depth • Storm duration • Storm average intensity • Storm peak intensity • Storm antecedent dry period • Peak discharge rate at each station • Runoff volume at each station • Flow duration at each station. • Inter-event dry period, if applicable
Sediment Trap or Sediment monitoring - During site visits made for sediment sampling related to this study, field personnel will record the following information on a waterproof standardized field form:
• Date and time of sample collection or visit • Name(s) of sampling personnel • Weather conditions • Number and type of samples collected • Location of each sample • Sediment depth at each sample location • Color, odor, and grain size characteristics of each sample • Log of photographs taken • Unusual conditions (e.g., water color or turbidity, presence of oil sheen,
odors, and land disturbances). • Deviations from approved sampling procedures
11.1.2 Laboratory Records
Internal and contract laboratories will be required to provide a Tier IV Data Package as defined by the Environmental Protection Agency, Contract Laboratory Program. The data package will be provided to the QA Coordinator and will be available to Ecology.
A hardcopy and electronic (pdf format) report for each analysis suite to include;
• what analyses were performed and what results were obtained, • that the data had acceptable properties (such as accuracy, precision, method reporting
limits), • where, when, and by whom the analyses were performed, • that the analyses were done under acceptable conditions (such as calibration,
control, custody, using approved procedures, and following generally approved good practices), and
• that the SOW was otherwise followed.
The data package will report the test results clearly and accurately. The test report will include the information necessary for interpretation and validation of data and will include the following:
• Report title, • Name and address of laboratory, • Name and address of client and study name,

S8 Program - Phase I Municipal Stormwater NPDES Permit Page 43 of 56 Quality Assurance Project Plan
Revision: S8-004 (Final) Revision Date: 03/31/2010
• Subcontractor results clearly identified, • Description and unambiguous name of tested sample, • Date and time of sample collection, date of sample receipt, and date and time of
analysis, • Preservation at time of sample acceptance (temperature, pH, etc.), • Identification of test method, • QC results for method blank, MS/MS duplicates, LCS, calibration and other as
appropriate, • An explanation of failed QC and any non-standard conditions that may have affected
quality, including corrective actions and plan to prevent loss of quality • A signature and title of laboratory director or designee, and. • Chain of Custody and sample receipt forms.
Internal laboratories will allow direct access of the Quality Assurance Coordinator (QAC) to the Laboratory Information Management System, including all QA/QC results. The QAC will not
Contract laboratories will provide the Tier IV data package in hardcopy and as an Excel or database uploadable file.
have author rights to alter data in the LIMS system but may further censure data beyond laboratory recommendation, in compliance with standard operating procedures and following consultation with the Laboratory and Program managers.
11.1.3 Data Handling Records
This section describes the approach for record control and storage of each sampling event. All documents associated with a sampling event will be stored electronically and as paper copies for a period of five years. Each sampling event will be documented with the following records:
• Field Datasheet, • Chain of Custody (COC), • Field QA Report, • Data Package, • Data Validation Memo, • Electronic Data Deliverable with Quality & Usability Flags.
All documents will be provided in portable document format (pdf) with the exception of the flow data and the Electronic Data Deliverable, which will be in Excel format. Continuous flow data will be retained electronically on Tacoma’s network server for a period of five years.
11.2 Revisions to the QAPP In the event that significant changes to this QAPP are required prior to the completion of the study, a revised version of the document shall be prepared and submitted to the Program Manager for review. The approved version of the QAPP shall remain in effect until the revised version has been approved.
Expedited Changes to the QAPP should be approved before implementation to reflect changes in study organization, tasks, schedules, objectives, and methods, address deficiencies and non-conformance, improve operational efficiency and accommodate unique or unanticipated circumstances. They are effective immediately upon approval by the Program Manager and Quality Assurance Coordinator, or their designees, and any regulatory authority if needed.

S8 Program - Phase I Municipal Stormwater NPDES Permit Page 44 of 56 Quality Assurance Project Plan
Revision: S8-004 (Final) Revision Date: 03/31/2010
Justifications, summaries, and details of expedited changes to the QAPP will be documented and distributed to all persons on the QAPP distribution list by the Program Manager. Expedited changes will be reviewed, approved, and incorporated into a revised QAPP during the annual revision process or within 120 days of the initial approval in cases of significant changes.
12 AUDITS AND REPORTS This section discusses assessment, response actions, and corrective actions to ensure all data is being collected as described in this Plan.
12.1 Assessments and Response Actions Field, analytical, and data management activities are evaluated based on the schedule below.
Table 12-1. Assessment and response action schedule. Assessment Activity
Approximate Schedule
Responsible Party
Scope Response Requirements
Laboratory Inspections
December 2009 QA Coordinator Analytical and quality control procedures employed at the laboratory and the contract laboratory
30 days to respond in writing to address corrective actions.
Monitoring Systems Audit
November 2009 QA Coordinator The assessment will be tailored in accordance with objectives needed to assure compliance with the QAPP and may include: field sampling; handling and measurement; facility review; and data management as they relate to the study.
30 days to respond in writing to address corrective actions.
Site Visit January 2009 Study Manager Status of activities. Overall compliance with work plan and QAPP
As needed.
12.2 Deficiencies, Nonconformances and Corrective Action The Study Manager is responsible for implementing and tracking corrective action procedures because of audit findings. Records of audit findings and corrective actions are maintained by both the QA Coordinator and Program Manager.
If audit findings and corrective actions cannot be resolved, then the authority and responsibility for terminating work is specified in the laboratory’s Quality Assurance Manual and in agreements or contracts between participating organizations.
Deficiencies are defined as unauthorized deviation from procedures documented in the QAPP. Nonconformances are deficiencies that affect quality and render the data unacceptable or indeterminate.
Deficiencies related to sampling methods requirements include, but are not limited to, such things as sample container, volume, and preservation variations, improper/inadequate storage temperature, holding-time exceedances, and sample site adjustments.
Deficiencies related to chain-of-custody include but are not limited to delays in transfer, resulting in holding time violations; incomplete documentation, including signatures; possible tampering of samples; broken or spilled samples, etc.

S8 Program - Phase I Municipal Stormwater NPDES Permit Page 45 of 56 Quality Assurance Project Plan
Revision: S8-004 (Final) Revision Date: 03/31/2010
Deficiencies related to field and laboratory measurement systems include but are not limited to instrument malfunctions, blank contamination, quality control sample failures, etc.
Deficiencies related to Quality Control include but are not limited to quality control sample failures.
Deficiencies are documented in logbooks, field data sheets, etc. by field or laboratory staff and reported to the cognizant field or laboratory supervisor who will notify the Program Manager. The Program Manager will notify the QA Coordinator of the potential nonconformance within 24 hours, who will then initiate a Nonconformance Report (NCR) to document the deficiency.
The Program Manager, in consultation with QA Coordinator (and other affected individuals/organizations), will determine if the deficiency constitutes a nonconformance. If it is determined that the activity or item in question does not affect data quality and therefore is not a valid nonconformance, the NCR will be completed accordingly, and the NCR closed. If it is determined a nonconformance does exist, the Study Manager in consultation with QA Coordinator will determine the disposition of the nonconforming activity or item and necessary corrective action(s); results will be documented by the contractor QA Coordinator by completion of a Corrective Action Report.
Corrective Action Reports (CARs) document: root cause(s); programmatic impact(s); specific corrective action(s) to address the deficiency; action(s) prevent recurrence; individual(s) responsible for each action; the timetable for completion of each action; and, the means by which completion of each corrective action will be documented. CARs will be included with quarterly progress reports. In addition, significant conditions (i.e., situations that, if uncorrected, could have a serious effect on safety or on the validity or integrity of data) will be reported to the Program Manager immediately both verbally and in writing.
13 DATA VERIFICATION AND VALIDATION This element describes the procedures used to determine if the MQOs established in Section 6.2 for the six data quality indicators have been met. The result is data of known and documented quality, we answer the question; are the data of sufficient quality and quantity to meet the use for which they are intended.
The quality of the data is indicated by data qualifier codes, notations used by laboratories and data reviewers to briefly describe, or qualify, data and the systems producing data. Laboratory data qualification will follow EPA’s Superfund Methods of Organic and Inorganic Data Review (http://www.epa.gov/oerrpage/superfund/programs/clp/guidance.htm).
During data review, verification, and validation, results are either accepted or reported with data qualifiers or flags. Data that meet all QC acceptance limits are potentially usable and are not qualified. Data that fail one or more QC criteria are qualified as estimated (with the J flag), tentatively rejected (with the S flag), or rejected (with the R flag). The distinction between estimated, tentatively rejected, and rejected data resides in the degree of the QC failure and is highly dependent upon the reviewer’s understanding of the objectives of the study.
This section discusses data review, verification, and validation. Data will be reviewed, verified, and validated using a Tier II data review level (Table 13-1).

S8 Program - Phase I Municipal Stormwater NPDES Permit Page 46 of 56 Quality Assurance Project Plan
Revision: S8-004 (Final) Revision Date: 03/31/2010
Table 13-1. Data review levels. Tier Description Tier I – Compliance Screening
Includes evaluation of package completeness; sample chain-of-custody; sample preservation and analytical holding times; blank contamination; precision (replicate analyses); accuracy (compound recovery); target analyte list, and detection limits.
Tier II – Summary Validation
Includes evaluation of all QC elements from Compliance Screening plus instrument performance (initial calibration, continuing calibration, tuning, sensitivity and degradation.
Tier III – Full Validation Includes evaluation of all QC elements from Summary Validation plus evaluation of compound identification and quantitation (transcription and calculation checks).
13.1 Data Review, Verification, and Validation This section discusses how data are reviewed and decisions made regarding accepting, rejecting, or qualifying data.
For the purposes of this document, data verification is a systematic process for evaluating performance and compliance of a set of data to ascertain its completeness, correctness, and consistency using the methods and criteria defined in the QAPP. Validation means those processes taken independently of the data-generation processes to evaluate the technical usability of the verified data with respect to the planned objectives or intention of the study. Additionally, validation can provide a level of overall confidence in the reporting of the data based on the methods used.
All data obtained from field and laboratory measurements will be reviewed and verified for conformance to study requirements, and then validated against the measurement quality objectives, which are listed in Section 6. Only those data that are supported by appropriate quality control data and meet the measurement performance specification defined for this study will be considered acceptable and used in the study.
The procedures for verification and validation of data are described in Section 13.2, below.
13.2 Verification and Validation Methods Procedures used to validate and verify data will be described in a SOP, which will also include roles, responsibilities, and documentation. All data will be verified to ensure they are representative of the samples analyzed and locations where measurements were made, and that the data and associated quality control data conform to study specifications. The data verification procedures will generally include:
• Storm event verification (i.e., did the sampling event meet the established storm criteria); • Sampler verification (i.e., did the sampler collect a valid flow-paced sample and capture
the appropriate storm volume); • Field QC (did we collect at appropriate frequency and did they meet the established
control limits); and • Laboratory QA/QC (did lab meet established control limits).

S8 Program - Phase I Municipal Stormwater NPDES Permit Page 47 of 56 Quality Assurance Project Plan
Revision: S8-004 (Final) Revision Date: 03/31/2010
14 DATA QUALITY (USABILITY) ASSESSMENT This element describes the procedures used to determine if the MQOs established in Section 6.2 have been met. The result is data of known and documented quality, we answer the question; are the data of sufficient quality and quantity to meet the use for which they are intended. During the data usability assessment, data that are believed to be completely unusable with a high degree of confidence (e.g., because of the gross failure of QC criteria) are qualified as rejected and would not normally be used to support decisions for an environmental study.
This section describes the process for determining the data usability, the method for data reduction, and the process for assessing the data quality. The methods and procedures that will be used to determine if the DQO’s established in Section 6.1 have been met and to prepare presentation of the study results are discussed. The purpose of this process is to determine: if the decision (or estimate) can be made with the desired confidence, given the quality of the data set?
Usability is defined as a qualitative decision process whereby the decision-makers evaluate the achievement of measurement quality objectives and determine whether the data may be used for the intended purpose.
Data reduction is the process of converting raw data to results. Study-specific data reduction methods are designed to ensure that data are accurately and systematically reduced into a usable form.
Data Quality Assessment (DQA) is the scientific and statistical evaluation of data to determine if data obtained from environmental data operations are of the right type, quality, and quantity to support their intended use.
14.1 Data Usability Assessment Usability is defined as a qualitative decision process whereby the decision-makers evaluate the achievement of measurement quality objectives and determine whether the data may be used for the intended purpose. Three levels or classes of data quality are used:
• Accepted Data conform to all requirements, all quality control criteria are met, methods were followed, and documentation is complete.
• Qualified Data conform to most, but not all, requirements, critical QC criteria are met,
methods were followed or had only minor deviations, and critical documentation is complete.
• Rejected Data do not conform to some or all requirements, critical QC criteria are not
met, methods were not followed nor had significant deviations, or critical documentation is missing or incomplete. The results are unusable.
Data usability assessment is a more complex and comprehensive activity than data review or validation and is usually performed by the end user (rather than by the data reviewer) because the data user typically possesses a greater understanding of the study’s DQOs (e.g., because of a more extensive knowledge of the study’s history). Therefore, the end user must ultimately determine the acceptability of the data. However, this does not imply that the end user may apply qualified data in an indiscriminate fashion.

S8 Program - Phase I Municipal Stormwater NPDES Permit Page 48 of 56 Quality Assurance Project Plan
Revision: S8-004 (Final) Revision Date: 03/31/2010
Tentatively rejected data must not be used to support study decisions unless the data user presents (i.e., documents) some technical rationale for doing so. In other words, tentatively rejected data must ultimately be rejected (e.g., using the R flag) in the absence of a scientifically defensible rationale to do otherwise. Furthermore, when data qualified as tentatively rejected are used to support decisions for a study, the data reviewer should be consulted for a consensus unless it is clear that the reviewer did not possess a complete understanding of the objectives of the investigation (e.g., new DQOs were established after the data review was performed).
Ideally, estimated (i.e., J-qualified) data, though presumed to be usable by the data reviewer, should be accepted by the end user only after the reasons for the data qualifications and their impact on the achievement of study DQOs have been examined.
The usability assessment includes assessment of potential outliers, confirmation that the data is comparable and representative, and calculation of the completeness:
• Identification of outliers from the previous quarter’s data collection efforts, • Confirmation of outliers from previous data collection efforts when sufficient data is
available to complete the outlier test, • Confirmation of the comparability of the data, • Confirmation of the representativeness of the data, and • Calculation of the completeness for each dry and wet season for the water year to date. • Definitions for each DQI can be found in the Glossary as well as the equation for
calculating completeness.
14.2 Data Quality Assessment Metrics
Data Quality Assessment (DQA) will be described in detail in each QAPP.
15 DATA ANALYSIS & PRESENTATION This section discusses the content of the study report. Data analysis and presentation will be described in detail in each QAPP.

S8 Program - Phase I Municipal Stormwater NPDES Permit Page 49 of 56 Quality Assurance Project Plan
Revision: S8-004 (Final) Revision Date: 03/31/2010
References Ecology (2004). Guidelines for Preparing Quality Assurance Project Plans for Environmental Studies.
Publication No. 04-03-030 Revision of Publication No. 01-03-003. http://www.ecy.wa.gov/pubs/0403030.pdf. July 2004.
Ecology (2006). Fact Sheet for National Pollutant Discharge Elimination System (NPDES) and State Waste Discharge General Permit for Discharges from Large and Medium Municipal Separate Storm Sewers. State of Washington Department of Ecology. March 22, 2006.
Ecology (2007). Phase I Municipal Stormwater Permit: National Pollutant Discharge Elimination System and State Waste Discharge General Permit for Discharges from Large and Medium Municipal Separate Storm Sewer Systems. Washington State Department of Ecology, Olympia, Washington. January 17, 2007.
Puget Sound Estuary Program (1996). Recommended Protocols for Measuring Selected Environmental Variables in Puget Sound. Prepared for the U. S. Environmental Protection Agency, Seattle, Washington.
Smoley, C.K.(1993), NPDES Storm Water Sampling Guidance Manual, CRC. Press, Boca Raton, FL.
Tacoma (1979). City of Tacoma Storm Drain Utility Formation and Rate Report. Sewer Utility Division Department of Public Works. February 1979.
Tacoma (2001). Thea Foss and Wheeler-Osgood Waterways, Stormwater Monitoring, Sampling and Analysis Plan, City of Tacoma, September 2001.
Tacoma (2003). Surface Water Management Manual, City of Tacoma. 2003.
Tacoma (2007). Growth Strategy & Development Concept Element. City of Tacoma Comprehensive Plan Amended Ordinance #27664, December 2007.
Tacoma (2008a). 2007 Stormwater Source Control Report. Thea Foss and Wheeler-Osgood Waterways. City of Tacoma. April 2008.
Tacoma (2008b). Stormwater Management Program. City of Tacoma Public Works/Environmental Services. March 2008.
Tacoma (2008c). August 2001-2007 Report, Stormwater Monitoring. Thea Foss and Wheeler-Osgood Waterways. City of Tacoma. February 2008.
USEPA (1992). NPDES Stormwater Sampling Guidance Manual. EPA 833-B-92-001. U.S. Environmental Protection Agency, Office of Water, Washington, D.C.
USEPA (2000). Guidance for Data Quality Assessment. Practical Methods for Data Analysis. EPA QA/G-9. QA00 Update. EPA/600R96084. http://www.epa.gov/quality/qs-docs/g9- final.pdf. July 2000.
USEPA. (2002a). Method 1631, Revision E: Mercury in Water by Oxidation, and Cold Vapor Atomic Fluorescence Spectrometry. EPA-821-R-02-019. U.S. Environmental Protection Agency, Office of Water, Washington D.C. August 2002
USEPA (2006). Guidance on Systematic Planning Using the Data Quality Objectives Process EPA QA/G-4. United States Environmental Protection Agency, Office of Environmental Information Washington, DC 20460. EPA/240/B-06/001 http://www.epa.gov/quality/qsdocs/g4-final.pdf. February 2006
USFHA (2001). Guidance Manual for Monitoring Highway Runoff Water Quality. Report No. FHWA-EP-01 -022. Appendix A. Data Evaluation and Statistical Hypothesis Testing. http://www.fhwa.dot.gov/environment/h2o_runoff/h2oroapa.htm March 2001.
U.S. Geological Survey (2002). Techniques of Water-Resources Investigations of the United States Geological Survey. Book 4, Hydrological Analysis and Interpretation, Chapter A3, Statistical Methods in Water Resources. http://pubs.usgs.gov/twri/twri4a3/ September 2002.
Wilson, C. and D. Norton (1996). Stormwater sediment traps pilot study. No. 96-347. Washington Department of Ecology, Olympia, WA 1996.

S8 Program - Phase I Municipal Stormwater NPDES Permit Page 50 of 56 Quality Assurance Project Plan
Revision: S8-004 (Final) Revision Date: 03/31/2010
List of Revisions The current list of revisions for this QAPP follows.
Revision Number
Revision Date
Revised by Revision Summary
S8-001 08/11/2008 Dana de Leon, Chris Burke and Todd Thornburg
Initial Draft.
S8-002 01/15/2009 Dana de Leon, Chris Burke and Todd Thornburg
Redline Draft.
S8-003 08/16/2009 Dana de Leon and Chris Burke
Final
S8-004 03/31/2011 Chris Burke , Laura Nokes and Dana de Leon
Section 5.4 – Logistical Problems
Tables 3-2, 6-2, 6-4, 6-5, 6-6. Section 6.2.4

S8 Program - Phase I Municipal Stormwater NPDES Permit Page 51 of 56 Quality Assurance Project Plan
Revision: S8-004 (Final) Revision Date: 03/31/2010
Appendix A Table A-1. Quality assurance planning document crosswalk.
Washington Department of Ecology Environmental Protection Agency
1. Title Page with Approvals A1 Title and Approval Sheet 2. Table of Contents and Distribution List A2 Table of Contents A3 Distribution List
I. Goals and objectives of the study
3. Background A5 Problem Definition/Background 4. Project Description A6 Project/Task Description 5. Organization and Schedule A4 Project/Task Organization
II. Type, quality, and quantity of data needed 6. Quality Objectives A7 Quality Objectives and Criteria for Measurement Data
7. Sampling Process Design (Experimental Design) B1 Sampling Process Design (Experimental Design)
III. Sampling and measurement procedures to acquire those data 8. Sampling Procedures B2 Sampling Methods B3 Sample Handling and Custody 9. Measurement Procedures B4 Analytical Methods
IV. Study implementation QA/ QC procedures to ensure Plan is followed 10. Quality Control B5 Quality Control
B6 Instrument/Equipment Testing, Inspection, and Maintenance B7 Instrument/Equipment Calibration and Frequency B8 Inspection/Acceptance of Supplies and Consumables
11. Data Management Procedures B10 Data Management 12. Audits and Reports C1 Assessments and Response Actions C2 Reports to Management
IV. Assessment procedures to ensure that study objectives are met 13. Data Verification and Validation D1 Data Review, Verification, and Validation
D2 Verification and Validation Methods
14. Data Quality (Usability) Assessment D3 Reconciliation with User Requirements
15. Data Analysis and Presentation

S8 Program - Phase I Municipal Stormwater NPDES Permit Page 52 of 56 Quality Assurance Project Plan
Revision: S8-004 (Final) Revision Date: 03/31/2010
Glossary Accuracy - Accuracy is defined as the degree of agreement of a measurement to an accepted reference or true
value. Analytical accuracy will be measured as the percent recovery (percent R) of an analyte in a reference standard or spiked sample. Accuracy (percent R) criteria for matrix spike recoveries and surrogate recoveries will be within limits specified in the QAPP. Accuracy shall be calculated as percent recovery of matrix spikes as follows:
where:
% Ri = percent recovery for compound i Yi = measured spike concentration in sample i (measured -
original sample concentration) Xi =
known spike concentration in sample i
The resultant percent recoveries will be compared to the criteria specified in the QAPP and deviations from specified limits reported. If the objective criteria are not met, the laboratory will supply a justification of why the acceptability limits were exceeded and implement the appropriate actions. Percent recoveries will be reviewed during data validation, and deviations from the specified limits will be noted and the effect on reported data commented upon by the data reviewer.
Hydrologic data have no “true” results for comparison. For hydrologic data, accuracy will be assessed by comparison of results to repeat measurements using another instrument, engineering calculations, or to manufacturer specifications and expressed as bias:
%100I
I-M = % ×Bias
where: M = measured value T = Independent (true value).
Discharge data – The independently measured value may be determined by measuring the cross-sectional area of flow at a particular station and the average flow velocity using a portable meter (e.g., Marsh-McBirney Flo-Mate). These data will then be processed in accordance with standard procedures (PSEP 1997) to estimate discharge. Alternatively, the independently measured value may be determined by routing the flow from a particular station to a container with a known volume (e.g. graduated cylinder, bucket, or jerrycan) and measuring the time required to fill this container.
Water level data - The independently measured value will be derived by measuring the water depth in the primary measuring device at a particular station using a staff gauge or ruler.
Precipitation depth
%100(%) xXYR
i
iI =
- The independently measured value is the theoretical accuracy as specified by the manufacturer. The rain gauge’s actual readings will be determined by measuring the volume of water required to initiate one tip of the associated bucket by adding incremental drops of water with a pipette.

S8 Program - Phase I Municipal Stormwater NPDES Permit Page 53 of 56 Quality Assurance Project Plan
Revision: S8-004 (Final) Revision Date: 03/31/2010
Comparability - Comparability is the confidence with which one data set can be compared to another. Comparability can be related to accuracy and precision, as these quantities are measures of data reliability. Data are comparable if sample collection techniques, measurement procedures, analytical methods and reporting are equivalent for samples within a sample set. To assure analytical comparability the laboratory will:
o Use National Institute of Standards and Technology or USEPA - traceable standards o Use standard methodologies o Apply an appropriate level of quality control o Participate in interlaboratory studies to document laboratory performance
As with representativeness, quantitative criteria for data comparability are difficult to establish, hence, a qualitative assessment of data comparability will be made of applicable data sets.
Completeness – An element of the data verification process. Completeness ensures that a sufficient amount of data and information (relative to the prescribed DQOs) are present. A Measurement Quality Objective (MQO), completeness is defined as the percentage of valid analytical results (results not qualified as R, rejected) obtained compared with the total number of analytical results required by the study scope of work. Analytical completeness is defined as the percentage of valid analytical results obtained compared with the total number of analyses requested. Completeness will be calculated as follows:
%100(%) xIAC =
where:
% C = Percent completeness (field / laboratory) A = Actual number of valid samples collected / analyses obtained I = Intended number of samples / analyses requested
Compliance - An element of the data verification process. The extent that adherence to SOPs, QAPP, and/or
contractual requirements were followed, achieved, and/or completed successfully, and that conditions under which the data were recorded also met the requirements. Compliance ensures that the data pass numerical quality control tests, including criteria on precision and accuracy, based on parameters or specified limits specified in relevant SOPs and or QAPP.
Composite samples – A composite sample is a mixed or combined sample that is formed by combining a series of individual and discrete samples of specific volumes at specified intervals. Although these intervals can be time-weighted or flow-weighted, the stormwater regulations require the collection of flow-weighted composite samples. This means that discrete aliquots, or samples, are collected and combined in proportion to flow rather than time. Composite samples characterize the quality of a stormwater discharge over a longer period of time, such as the duration of a storm event.
Consistency - An element of the data verification process. The extent to which data collection procedures were done in a similar manner across different sites (if applicable) and data reporting was done in a similar manner in multiple places. Consistency (also known as comparability) ensures that the reported values are the same when used throughout the study.
Correctness - An element of the data verification process. A mechanical, objective check that data collection plans and protocols have been followed and that basic operations and calculations were performed using properly documented and properly applied algorithms. Correctness ensures that the reported values are based on properly documented algorithms.
Field Blanks - Field blanks are also commonly called field rinsate blanks, decontamination blanks and equipment blanks. A field blank evaluates the effectiveness of decontamination procedures when equipment is not dedicated to a site or disposed of after one use. If decontamination procedures are effective, there should be no contamination in the field blanks. Field blanks are not required if dedicated sampling equipment or disposable sampling equipment is used. A field blank consists of a sample of

S8 Program - Phase I Municipal Stormwater NPDES Permit Page 54 of 56 Quality Assurance Project Plan
Revision: S8-004 (Final) Revision Date: 03/31/2010
the reagent grade water supplied by the laboratory and used in the final rinse step of the equipment decontamination procedure. Process the field blank water through the equipment the same way you process any other final rinse water.
Field Replicates - A field replicate (duplicate) sample is collected to determine the variability of analytical results caused by the sampling equipment and procedures used. Field replicates are samples collected simultaneously or sequentially from the same sampling location using identical sampling methods. The samples equally represent as nearly as possible the medium being sampled, and may provide information of the variance of chemicals at a sampling location and the consistency of sampling techniques.
Replicate samples will be collected at the time of sample collection. Replicate samples will be sent to the laboratory. The final number of replicate samples collected and submitted for analysis to each laboratory will equal or exceed 10 percent of the total number of primary samples for each analytical method.
Grab Sample - A grab sample is a discrete, individual sample taken within a short period of time (usually less than 15 minutes). Analysis of grab samples characterizes the quality of a storm water discharge at a given time of the discharge.
Interquartile Range (IQR) - The interquartile range (IQR) is the most commonly used resistant measure of spread. It measures the range of the central 50 percent of the data, and is not influenced at all by the 25 percent on either end. The IQR is defined as the 75th percentile minus the 25th percentile. The 75th, 50th (median) and 25th percentiles split the data into four equal-sized quarters. The 75th percentile (P.75), also called the upper quartile, is a value which exceeds no more than 75 percent of the data and is exceeded by no more than 25 percent of the data. The 25th percentile (P.25) or lower quartile is a value, which exceeds no more than 25 percent of the data and is exceeded by no more than 75 percent.
Interim Minimum Level - The interim minimum level is calculated when a method specified ML does not exist. It is equal to 3.18 times the method specified MDL.
Laboratory Control Samples - Laboratory control samples (LCS) are well-characterized, laboratory-generated samples used to monitor the laboratory's day-to-day performance of routine analytical methods. Certain LCS are used to monitor the precision and accuracy of the analytical process, independent of matrix effects. Other LCS are used to identify any background interference or contamination of the analytical system, which may lead to the reporting of elevated concentration levels or false positive measurements. The results of the LCS are compared to well-defined laboratory acceptance criteria to determine whether the laboratory system is "in control." Controlling lab operations with LCS (as opposed to MS/MSD samples) offers the advantage of being able to differentiate low recoveries due to procedural errors from those due to matrix effects. One LCS should be analyzed for every set of 20 or fewer samples or with each sample preparation lot.
Percent recovery for laboratory controls will be calculated using the following equation:
%100TM
= R% ×
where: %R = percent recovery M = measured value T = true value.
Laboratory (or Matrix) Duplicate - A laboratory duplicate is a split of an environmental sample, which is prepared and analyzed in a manner identical to that of the original sample. The results are utilized to evaluate the precision of the laboratory analyses. Results are expressed in Relative Percent Difference (percent RPD) between analytical results for the split and the original sample.

S8 Program - Phase I Municipal Stormwater NPDES Permit Page 55 of 56 Quality Assurance Project Plan
Revision: S8-004 (Final) Revision Date: 03/31/2010
If more than five but less than 20 samples are submitted, at least one laboratory duplicate should be analyzed. A general rule is one laboratory duplicate for every batch of up to 20 samples analyzed together.
Matrix Spike - A matrix spike (MS) is an environmental sample to which known concentrations of analytes have been added. The matrix spike is taken through the entire analytical procedure and the recovery of the analytes is calculated. Results are expressed as percent recovery of the known amount spiked. The matrix spike is used to evaluate the effect of the sample matrix on the accuracy of the analysis. One matrix spike sample should be analyzed for every set of 20 or fewer samples or with each sample preparation lot. The spike solution is added to samples prior to digestion. The sample that is chosen for spiking should be the same sample used for laboratory duplicate analysis. The amount of spike added to the sample should be 2-to-5 times the expected sample concentration or the IDL, which ever is greater. Matrix spike recovery is calculated using the formula:
%100saC
U)- (S = R% ×
where: %R = percent recovery S = measured concentration in spike sample U = measured concentration in unspiked sample Csa
= actual concentration of spike added.
Method Detection Limit (MDL) – The minimum concentration of an analyte that can be measured and reported with 99 percent confidence that the analyte concentration is greater than zero as determined by a specific laboratory method (40 CFR 136).
Method or Preparation Blank - A method blank consists of analyte-free deionized water. The method blank is carried through each step of the analytical method. The method blank data will be used to detect any laboratory contamination during analysis. A method blank is required for each batch of samples prepared for analysis, except in the case of volatile organic analyses, which should be analyzed at least once every 12 hours.
Method Reporting Limit (MRL) – The concentration at which confidence in the reported value requires no qualifying remarks. The MRL should be 3-5 times the MDL. A standard is run at the MRL to verify acceptable data quality. The MRL may be affected by sample size, sample dilution, and matrix interference.
Minimum Level (ML) - the concentration at which the entire analytical system must give a recognizable signal and acceptable calibration point. The ML is the concentration in a sample that is equivalent to the concentration of the lowest calibration standard analyzed by a specific analytical procedure, assuming that all the method specified sample weights, volumes and processing steps have been followed.
Outlier - Outliers are measurements that are extremely large or small relative to the rest of the data and, therefore, are suspected of misrepresenting the population from which they were collected.
Precision Objectives - Precision is the degree of agreement between a set of replicate measurements. Precision will be measured as the relative percent difference (RPD) between duplicate analyses for matrix spike duplicates, laboratory duplicates, and field duplicates. Precision RPD for matrix spike duplicates and laboratory duplicates will be within limits specified in
the QAPP. Precision will be calculated as the relative percent difference (RPD) as follows:
where:
%1002
(%) xDODO
RPDii
iii +
−=

S8 Program - Phase I Municipal Stormwater NPDES Permit Page 56 of 56 Quality Assurance Project Plan
Revision: S8-004 (Final) Revision Date: 03/31/2010
% RPDi Relative percent difference for compound i = Oi Value of compound i in original sample = Di Value of compound i in duplicate sample =
The resultant %RPDs will be compared to the criteria specified in the QAPP and deviations from specified limits reported. If the objective criteria are not met, the laboratory will supply a justification of why the acceptability limits were exceeded and implement the appropriate actions. The percent RPDs will be reviewed during data validation, and deviations from the specified limits will be noted and the effect on reported data commented upon by the data reviewer.
Quality control objectives for field replicate precision have not been established by the USEPA. These analyses measure both field and lab precision; therefore, the results may also have more variability than lab duplicates which measure only lab performance. It is also expected that fish tissue replicate results will have a greater variance than water matrices due to the inherent variability in the fish.
Quartile skew coefficient, qs. A resistant measure of skewness. The difference in distances of the upper and lower quartiles from the median, divided by the IQR. A right-skewed distribution again has positive qs; a left-skewed distribution has negative qs. Similar to the IQR, qs uses the central 50 percent of the data.
Representativeness - Representativeness is the degree to which data accurately and precisely represents a characteristic of a population, parameter concentrations at a sampling point, or an environmental condition of a site. Representativeness is a function of sample site selection, sampling methods, and analytical techniques. The rationale for sample site selection and sampling methodology is provided in Section 7. Representativeness will be maintained by performing all sampling, sample handling, and analyses in compliance with the procedures described in this QAPP and the referenced analytical methods. It is difficult to establish quantitative representativeness criteria. Representativeness of the analytical data may be determined by a comparison of the quality control data for the samples to established criteria, and by affirming that sampling and analytical methods conformed to established plans and methods.
Sample Type – Sample type refers to the king of sample that must be collected – either a grab or composite. Sample Technique – Sample technique refers to the method by which a grab or composite sample is
actually collected – either manually or by automatic sampler. Standard Reference Material – Standard Reference Materials (SRM’s) general are considered the most useful
QC samples for assessing the accuracy of a give analysis (i.e., the closeness of a measurement to he “true” value). SRM’s can be used to assess accuracy because the have “certified” concentrations of the analytes of interest, as determined through replicate analyses by a reportable certifying agency using two independent measurement techniques for verification. In addition, the certifying agency may provide “non-certified” or “informational” values for other analytes of interest. Such values are determined using a single measurement technique, which may introduce unrecognized bias. Therefore, non-certified values must be used with caution in evaluating the performance of a laboratory using a method which differs from the one used by the certifying agency.