quality assurance project plan - access washington home · quality assurance project plan ... 502...
TRANSCRIPT

Quality Assurance Project Plan
Norfolk CSO Sediment Cap Recontamination Phase I Investigation
by
Nigel Blakley
Washington State Department of Ecology Environmental Assessment Program Olympia, Washington 98504-7710
June 2002
This report is available on the Department of Ecology home page on the World Wide Web at http://www.ecy.wa.gov/biblio/0203073.html.

2
Quality Assurance Project Plan
Norfolk CSO Sediment Cap Recontamination
Phase I Investigation
June 2002
303(d) listings addressed in this study: Duwamish Waterway (WA-09-1010) – Total PCBs (Sediments)
Ecology EIM Number: NBLA0001
Approvals: Approved by: July 2, 2002 Rick Thomas, NWRO TCP Client Date
Approved by: July 2, 2002 Steven Alexander, NWRO TCP Section Manager Date
Approved by: July 9, 2002 Nigel Blakely, Project Manager, Watershed Ecology Section Date
Approved by: July 17, 2002 Dale Norton, Unit Supervisor, Contaminant Studies Unit Date
Approved by: July 10, 2002 Will Kendra, Section Manager, Watershed Ecology Section Date
Approved by: July 10, 2002 Stuart Magoon, Director, Manchester Environmental Laboratory Date
Approved by: July 9, 2002 Cliff Kirchmer, Ecology Quality Assurance Officer Date

3
Abstract Sampling of sediments for PCB contamination will be conducted near two adjacent outfalls on the Duwamish River in King County. The outfall area is adjacent to the Norfolk CSO sediment remediation site, where post-remedial monitoring has raised concerns regarding PCB recontamination. It has been suggested that sediments near the outfalls that were not included in the remedial work may be contaminated with PCBs and eroding, leading to recontamination of the clean cap installed in the remedial area. This project will establish whether there is PCB contamination near one or both of these outfalls, and the spatial distribution of any PCB contamination. Sediment will also be collected at each sampling point and archived for potential future use in fingerprinting investigations of the two potential source outfalls. Whether there is a need for a Phase II investigation involving fingerprinting or any other studies will be determined later.

4
Background/Problem Statement Post-remedial monitoring at the Norfolk CSO sediment remediation site has raised concerns regarding PCB recontamination (King County, 2001). This site in the Duwamish River was dredged and then backfilled with clean sediment in 1999. Chemicals of concern at the site prior to cleanup included mercury, 1,4-dichlorobenzene, bis(2-ethylhexyl)phthalate, and polychlorinated biphenyls (PCBs). Following the completion of site remediation, a five-year sampling program was initiated to monitor the clean cap for metals and organics recontamination. Data from the 2001 sampling showed an increase in PCB concentrations from all four monitoring stations, although there was no evidence of recontamination by any other chemicals of concern (King County, 2001). Of the four sampling locations included in the monitoring program, the highest increase in PCBs was at a station located in a channel below a Boeing storm drain outfall (Figure 1). At this station (NFK503), the PCB (total) concentration was 1,880 Φg/kg dry weight in the 2001 sample, compared with 306 and 271 Φg/kg in 1999 and 2000, respectively. No such increase was found below the adjacent outfall for the Norfolk CSO (Table 1). Table 1. Total PCB Concentrations from Norfolk CSO Remediation Project Five-Year
Monitoring Programa (0-2 cm Depth Stratum). Basis for PCB concentration
Year Norfolk CSO Channel
(NFK 501)
Boeing Storm Drain Channel
(NFK 503)
Combined Channel Delta
(NFK 502)
Upriver Reference (NFK 504)
Φg/kg dry weight
1999 45.9 306 61.8 25
2000 6.8 271 70.6 6.6 2001 60.9 1,880 161 42.2 2002 168 260 Not detected 38.9 mg/kg OC 2001 7.4 677b 24.8b 2.7 2002 7.3 10 Not detected 3.6 a Source: King County, 2001. (Table 9) and S. Mickelson, personal communication (2002 data). b Exceeds sediment quality standard (12 mg/kg OC). More recent data from sampling in April, 2002, do not indicate an upward trend at stations NFK.
502 or NFK 503 although the value for NFK 501 is consistent with an upward trend.

Figure 1. Site map showing monitoring locations and outfalls (Norfolk CSO and Boeing storm drain).
Boeing storm drain
Norfolk CSO/storm
drain
NFK 502
NFK 504
NFK 503
Flow
80 ft.
NFK 501
Channels in backfill visible
at low tide
Approx. cap boundary

6
Sampling for PCBs from catch basins and manholes upstream of the Boeing storm drain outfall (Boeing, 2001) produced highly variable results, with Arochlor 1254 concentrations ranging from 190 Φg/kg to 1,100,000 Φg/kg at a single sampling location (Table 2). Overall, eight of the twelve samples exceeded 1,000 Φg/kg Arochlor 1254. The highly variable results were attributed to PCB “nuggets”:
“In discussions with analytical laboratory staff, chemists indicated that it is common for PCBs in environmental solids to exhibit a distinct heterogeneous nugget effect because of the strong partitioning of PCBs to organic matter and the common use of PCBs at high concentrations in a variety of materials (caulking, paint, oils, etc.).” (Boeing, 2001 p. 16).
Table 2. Aroclor 1254 Concentrations (Φg/kg) from Catch Basin and Manhole Sampling
Locations in the Boeing Development Center Storm Drain. Sampling Point Locations are Shown Below.
Catch Basin
1 (CB-1)
Manhole 2 (MH-2)
Manhole 3 (MH-3)
Catch Basin 4
(CB-4)
Manhole 5 (MH-5
July, 2000 510,000 760,000 190 1,200 44,000 Field duplicate 0.64 August, 2000 300 870,000 1,100,000 1,500 39,000 Field duplicate <300 a Source: Boeing, 2001. Table 3.
CB-1
MH-2
CB-4 MH-3
MH-5

7
The Boeing storm drain investigation report concluded that erosion and transport of inshore sediments are the most likely explanation for the PCB recontamination:
“The dredging and capping completed by King County did not extend to the Norfolk outfall or to the inshore edges of the waterway. Sampling by the County has shown that elevated PCB levels are present near the Boeing outfall. These locations (inshore edges of the waterway) are downstream of the Norfolk outfall and outside of the area dredged and capped by King County. Samples from other locations inshore of the remediation area have not been collected, including the area below the Norfolk outfall. Based on the extent of contamination found during the County’s remediation effort, it is likely that elevated PCB levels are present throughout the adjacent inshore area at locations downstream from the Norfolk outfall. Observations at low tide conditions indicate that the inshore sediments are being eroded and transported downward onto the cap. Based on this observation, and because a source could not be identified in the Boeing storm drain, the most likely source of increased PCB levels reported on the cap is from erosion of inshore sediments from the cap. ...The remaining PCB contamination present on the inshore edges of the waterway (i.e., outside of the areas dredged and capped as part of partial remediation associated with the Norfolk outfall) is believed to be associated with the original source of PCBs released to the area from the Norfolk CSO.” (Boeing, 2001 pp. iii-iv).
King County also reported that results from sampling conducted in 2000 “...revealed an area of high PCB concentrations (4,900 to 8,400 Φg/Kg DW) in sediment in front of the Boeing storm drain outfall. This suggests the most likely source of PCB recontamination to the storm drain channel is the erosion of PCB-contaminated sediments adjacent to the Boeing storm drain outfall...” (King County, 2001). The suggestion in both reports that eroding sediments are the source of PCBs recontaminating the cap assumes that these sediments contain PCBs. At present, however, PCB concentrations in sediments inshore of the clean cap and near the Boeing storm drain and Norfolk CSO outfalls have not been extensively characterized.

8
Project Description Phase I of this project will evaluate PCB concentrations in sediments and soil in the vicinity of the Boeing storm drain and Norfolk CSO outfalls. The objectives are:
• Verify previous sampling results in the vicinity of the Boeing outfall (King County, 2001) and characterize a wider area of the sediments and bank soil with respect to PCB concentrations.
• Evaluate the spatial PCB concentration pattern between the two outfalls, and
downstream of the Boeing outfall.
• Compare PCB concentrations with regulatory criteria (Washington Sediment Management Standards).
• Collect and archive sediment samples for potential future use in source identification
through fingerprinting. The investigation will use discrete sediment samples to characterize potential source areas and materials. The discrete samples will also help define any contaminant gradients around the Boeing stormwater outfall and between this outfall and the Norfolk CSO outfall. Other areas and media may be investigated in a Phase II project, if one is necessary.

9
Responsibilities Project Manager Nigel Blakley (360) 407-6770 Project management,
coordination with King County staff, direct field operations, QA Project Plan and report preparation.
Project Assistant Richard Jack (360) 407-6139 Assists in field operations.
Client (TCP-NWRO) Rick Thomas (425) 649-7208 Project review, site selection, conclusions regarding sources of sediment cap recontamination, need for and focus of a potential Phase II investigation.
TSU Supervisor Dale Norton (360) 407-6765 Project review.
WES Section Manager Will Kendra (360) 407-6698 Project review.
Manchester Laboratory Stuart Magoon (360) 871-8801 Coordinate laboratory
analysis.
EIM Data Entry Carolyn Lee (360) 407-6430 Data entry.
Schedule Field Sample Collection Tuesday, July 9, 2002 (Low tide -2.1 ft at 11:11 am) Backup date: July 11, 2002 (Low tide -2.7 ft at 12:30 pm). Laboratory Analysis Complete October 2002. Draft Report Phase I November 2002. Final Report Phase I February 2003.

10
Data Quality Objectives Measurement Quality Objectives Measurement quality objectives (MQOs) for accuracy (i.e., precision and bias) and required reporting limits for this investigation are shown in Table 3. The MQOs for accuracy, precision, and bias are in terms of maximum acceptable error. Table 3. Measurement Quality Objectives for PCB Aroclor Analysis for the Norfolk CSO Investigation. Parameter Accuracy (%
deviation from true value)
Bias Precision (RSD) Required Reporting Limit
PCB Aroclors 60-65% 20-25% 20% 50 ug/kg, dry weight
TOC N/Aa N/Aa 20% 1% Grain Size (for each size range)
25% 5% 10% 1%
% solids 25% 5% 10% 1% aAccuracy and bias cannot be quantified. Representativeness The sampling depth (0-10 cm) and locations have been selected so that samples will be representative of sediment material that could be eroded and transported to the clean cap. If it appears that a proposed sampling point is not representative of this material, an adjustment may be made to the sampling location. Comparability The parameters and analytical methods selected for this project are expected to yield results that are comparable to a subset of the results from the Norfolk CSO Sediment Remediation Project Five-Year Monitoring Program.
A sample will be collected from the 0 to 10 centimeter depth stratum at each station, as for the Monitoring Program. Discrete samples will be collected to attempt to determine contaminant source areas and relatively small-scale contamination gradients. Composite samples will not be collected, which departs from the Monitoring Program procedure of compositing three separate grab samples. Spatial heterogeneity in PCB concentrations is of interest for this investigation and would be partially obscured by compositing samples. Another data subset in the Monitoring Program is obtained by sampling from the 0-2 cm stratum at each station. However, this depth range will not be separately sampled in this investigation.
11
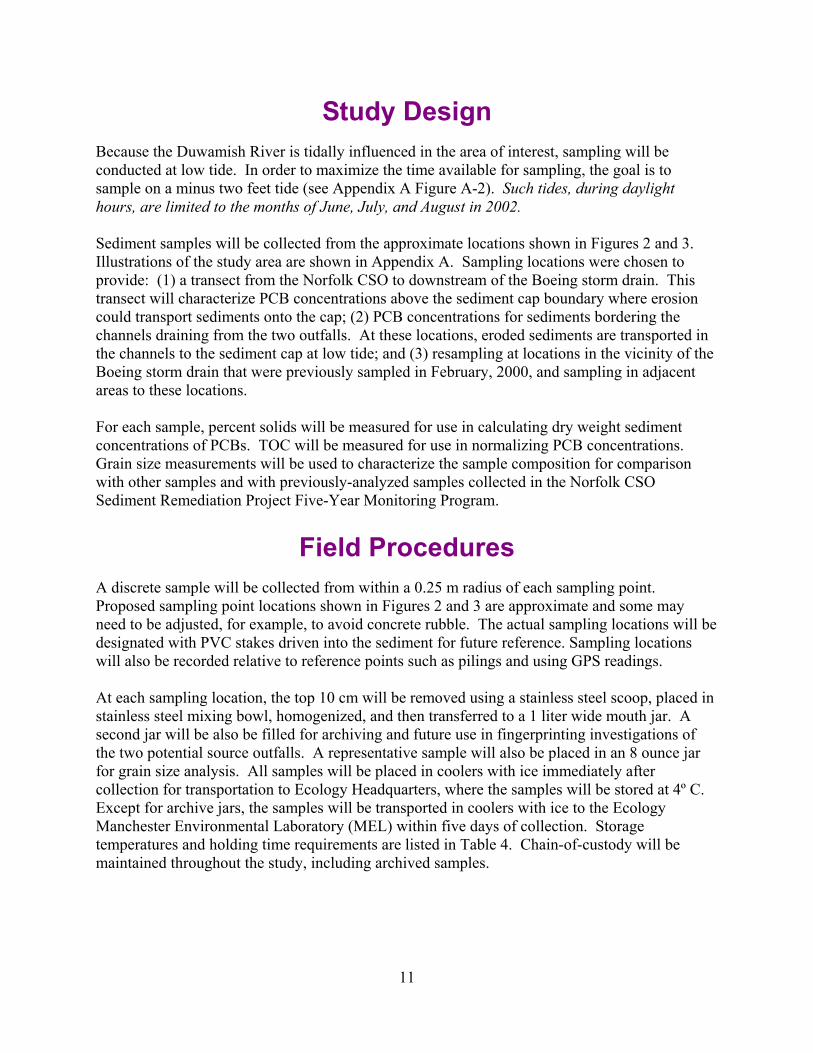
Study Design Because the Duwamish River is tidally influenced in the area of interest, sampling will be conducted at low tide. In order to maximize the time available for sampling, the goal is to sample on a minus two feet tide (see Appendix A Figure A-2). Such tides, during daylight hours, are limited to the months of June, July, and August in 2002. Sediment samples will be collected from the approximate locations shown in Figures 2 and 3. Illustrations of the study area are shown in Appendix A. Sampling locations were chosen to provide: (1) a transect from the Norfolk CSO to downstream of the Boeing storm drain. This transect will characterize PCB concentrations above the sediment cap boundary where erosion could transport sediments onto the cap; (2) PCB concentrations for sediments bordering the channels draining from the two outfalls. At these locations, eroded sediments are transported in the channels to the sediment cap at low tide; and (3) resampling at locations in the vicinity of the Boeing storm drain that were previously sampled in February, 2000, and sampling in adjacent areas to these locations. For each sample, percent solids will be measured for use in calculating dry weight sediment concentrations of PCBs. TOC will be measured for use in normalizing PCB concentrations. Grain size measurements will be used to characterize the sample composition for comparison with other samples and with previously-analyzed samples collected in the Norfolk CSO Sediment Remediation Project Five-Year Monitoring Program.
Field Procedures A discrete sample will be collected from within a 0.25 m radius of each sampling point. Proposed sampling point locations shown in Figures 2 and 3 are approximate and some may need to be adjusted, for example, to avoid concrete rubble. The actual sampling locations will be designated with PVC stakes driven into the sediment for future reference. Sampling locations will also be recorded relative to reference points such as pilings and using GPS readings. At each sampling location, the top 10 cm will be removed using a stainless steel scoop, placed in stainless steel mixing bowl, homogenized, and then transferred to a 1 liter wide mouth jar. A second jar will be also be filled for archiving and future use in fingerprinting investigations of the two potential source outfalls. A representative sample will also be placed in an 8 ounce jar for grain size analysis. All samples will be placed in coolers with ice immediately after collection for transportation to Ecology Headquarters, where the samples will be stored at 4º C. Except for archive jars, the samples will be transported in coolers with ice to the Ecology Manchester Environmental Laboratory (MEL) within five days of collection. Storage temperatures and holding time requirements are listed in Table 4. Chain-of-custody will be maintained throughout the study, including archived samples.

Figure 2. Approximate proposed sampling locations (large circles). Additional reference area sampling locations are shown in Figure 3. Small circles show locations of pilings (see Figures A-1 and A-2).
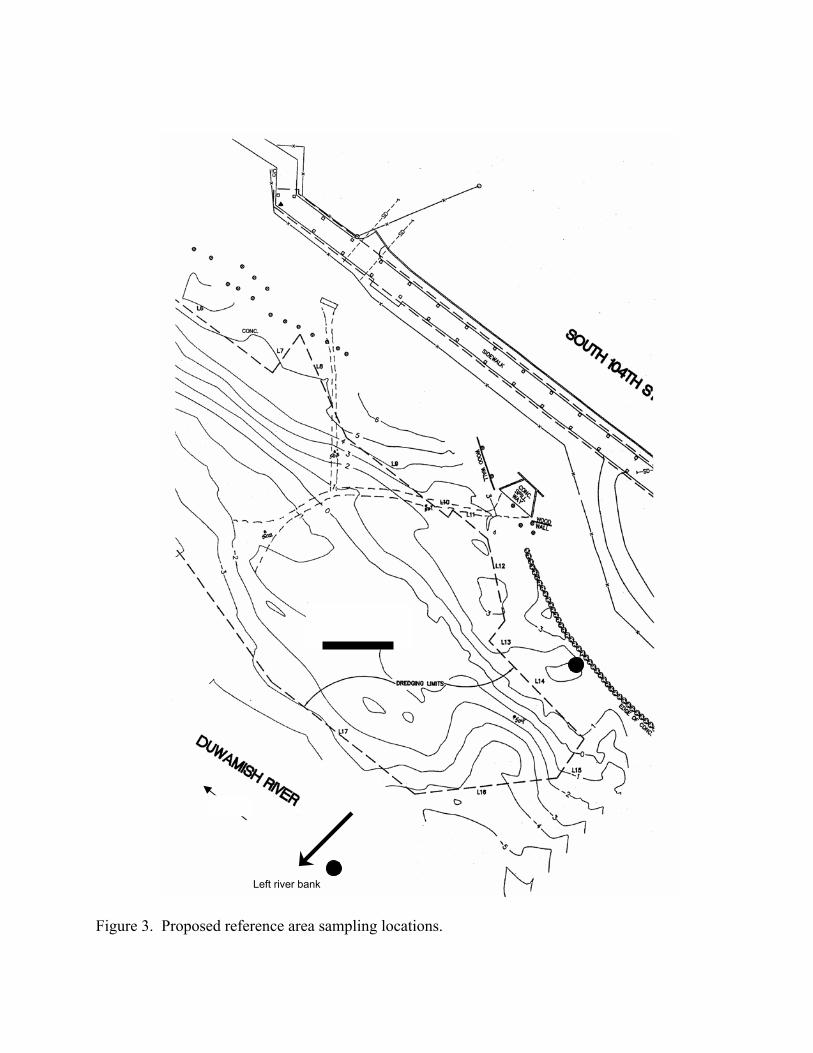
Figure 3. Proposed reference area sampling locations.
Left river bank

14
Table 4. Recommended Containers, Preservatives, and Holding Times for Sediment Samples (PSEP, 1996). Analyte
Container
Preservation Technique
Holding Time
Percent Solids Glass or Polyethylene
Freeze, -18°C Refrigerate, 4°C
6 months 14 days
TOC Glass or Polyethylene
Freeze, -18°C Refrigerate, 4°C
6 months 14 days
Grain Size Glass or Polyethylene
Refrigerate, 4°C 6 months
PCBs Glass Freeze, -18°C Refrigerate, 4°C
1 year 14 days
Stainless steel scoops and mixing bowls will be precleaned with Liquinox detergent, rinsed with deionized water, 10% nitric acid, and then methanol. After cleaning, the scoops will then be wrapped in aluminum foil.
Laboratory Procedures Analytical methods and laboratory reporting limits for analysis of samples from this project are shown in Table 5. All analyses will be conducted at the Manchester Environmental Laboratory (MEL), with the exception of grain size, which will be analyzed at a contract laboratory selected by MEL. Estimated analytical costs for Phase I of this investigation are shown in Table 6 below.

15
Table 5. Analytical Methods and Lab Reporting Limits for this Study. Analyte
Method
Reference
Lab Reporting Limit
Laboratory
Percent Solids Gravimetric (160.3)
PSEP, 1996 0.1% MEL
Total Organic Carbon Combustion/CO2 Measurement @ 70°C (9060)
PSEP, 1996 0.1% MEL
Grain Size Sieve and Pipet PSEP, 1996 0.1% Contractor PCBs (as Aroclors) EPA 3540
(Soxhlet extraction) EPA 8082 GC-ECD
EPA SW-
846*
2-5ug/kg, dry weight
MEL
* Available on-line at http://www.epa.gov/epaoswer/hazwaste/test/main.htm Table 6. Analytical Costs for the Norfolk CSO Investigation – Phase I. Analysis Cost per
sample Number of
samples Duplicate samples
MS+MSD &
Blanks
Total analyses
Cost Subtotals
Percent Solids
$10 20 1 21 $210
TOC $33 20 1 21 $693 Grain Size $100 20 1 21 $2,100 PCBs (as Aroclors)
$108 20 1 2 23 $2,484
TOTAL $251 $5,487
Quality Control Procedures The standard QA/QC procedures used by MEL will be satisfactory for this project. Specific recommendations for QC samples, control limits, and corrective actions are documented in MEL's Quality Assurance Manual (Feddersen, 2001). At a minimum, laboratory quality control samples for PCBs will include analysis of surrogate spikes, method blanks, and duplicate matrix spikes. Surrogate recoveries will provide an estimate of accuracy for the entire analytical procedure. Method blanks can indicate contamination from the sampling and analytical procedures. Matrix spikes may provide an indication of bias due to interference from the sample matrix.

16
Precision will be estimated from the results of blind field and laboratory duplicates, and duplicate matrix spikes. Field QC samples will include one blind duplicate for all parameters. These samples will be submitted to the laboratory as a separate station. Routine QA/QC samples for chemical analysis to be run for this project are summarized in Table 7. Table 7. Summary of Necessary QC Samples for the Norfolk CSO PCB Study. Analyte
Method Blanks
Lab
Duplicate
Blind Field
Duplicate
Matrix Spike
Matrix Spike
Duplicate
Surrogates Percent Solids NA 2 per
batch 1 NA NA NA
TOC NA 2 per batch
1 NA NA NA
Grain Size NA 2 per batch
1 NA NA NA
PCBs 2 per batch
2 per batch
1 2 per batch
2 per batch
All Samples
NA= Not applicable
Data Review, Verification, and Validation Data verification will be performed by using MEL’s data review process that includes a Data Review Checklist. All facets of the data are reviewed, including initial, continuing calibrations as well as all QC data. The Project Manager will review the verified data from MEL to validate its usefulness for this project.
Data Quality Assessment The quality of all laboratory and field data will be determined by review of: laboratory case narratives for analyses, sampling and laboratory methods, results from QA procedures, and any other information pertaining to the quality needed to meet project objectives. Quality control limits described in Appendix B will also be used in assessing data quality.

17
Report A draft report will be completed on or before November 2002. The report will include the following:
• Site map showing sampling locations and locations of past samples.
• Description of field and laboratory methods.
• Sample information (dates, times, depths, coordinates, etc.).
• Discussion of data quality and the significance of any problems encountered in the sampling or analysis.
• Summary tables of all sampling data, together with relevant data provided by King
County from the Norfolk CSO Sediment Remediation Project Five-Year Monitoring Program. For PCBs, this information will also be summarized graphically on a site map.
• Analysis from comparisons with Sediment Quality Standards for PCBs.
• Discussion of spatial patterns and comparisons with previous data.
A final report will be prepared on or before February 2003. Upon completion of the project, all project data will be entered into Ecology’s Environmental Information Management System (EIM). Public access to electronic versions of the data and reports generated from this project will be available via Ecology’s internet homepage (http:\\www.ecy.wa.gov). The decision on whether there is a need for a Phase II investigation will be at the discretion of the project client. A separate QA Project Plan will be prepared if it is determined that a Phase II investigation is needed.

18
References Boeing, 2001. Data Summary of PCB Sampling from Accumulated Solids and Construction Materials In and Around Storm Sewer Lines at the Development Center. The Boeing Company Energy and Environmental Affairs. Seattle, Washington. Prepared by Project Performance Corporation. Bellevue, Washington. Feddersen, K. 2001. The Quality Assurance Manual for the Washington State Department of Ecology, Manchester Environmental Laboratory. Washington State Department of Ecology. King County, 2001. Norfolk CSO Sediment Remediation Project, Five-Year Monitoring Program, Annual Monitoring Report – Year Two, April 2001. King County Department of Natural Resources, Water and Land Resources Division. Seattle, Washington. PSEP, 1996. Recommended Protocols and Guidelines for Measuring Selected Environmental Variables in Puget Sound. Prepared by Tetra Tech, Inc. for EPA Region 10. Seattle, Washington. Selected Sections Updated.

19
Appendices

20
Appendix A Views of the Study Area from the Duwamish River (Figure A-1) and from the River Bank (Figure A-2). Upper Photo was Taken at Approximately Minus 2 Feet Tidal Level. Flow from Boeing Storm Drain (Boeing #1) and Norfolk CSO Outfalls Converges into the Drainage Channel.
Figure A-1
Figure A-2

21
Figure A-3 Boeing Storm Drain.

22
Appendix B Selected PSEP Quality Control Limits Used by Ecology’s Sediment Management Unit for Conducting QA1 Reviews of Sediment Data Packages. Sample Type Conventionals Metals Semivolatiles
Holding Times Grain Size- 6 months @ 4°C
S, NH3- 7 days @ 4°C TS,TVS,TOC- 14 days @ 4°C; 6 months @ -18°C
Metals except Hg- 6 months @ 4°C; 2 years @
-18°C Mercury- 28 days @ 4°C
or –18°C
14 days @4°C1
1 year @-18°C1
Method Blanks Metals- (1 per 20 or 1 for <20) Organics- (1 per extraction batch)
≤ Detection Limit ≤ Detection Limit
If ≥ DL, lowest conc. Must be 10x MB value
≤ Detection Limit
CRM Metals- (1 per 20 or 1 for <20) Organics- (1 per 50 or 1 for <50)
When analyzed for conventional such as TOC,
organics control limits may be applied
Supplier specified limits for CRMs (usually 95% CI, but may include lab
estab. Limits for RMs used as internal controls
Blind CRM unavailable Supplier specified limits for CRMs (usually 95% CI, but may include lab
estab. Limits for RMs used as internal controls
Analytical Replicates Conventionals- (1 triplicate per 20 or for <20) Metals, Organics- (1 duplicate per 20 or for <20)
≤ 35% RPD for duplicates ≤ 35% for COV for
triplicates
≤ 20% RPD ≤ 50% RPD
Matrix Spikes Metals- (1 per 20 or 1 for <20) Organics- (≤20, 2 per set and >20, add MS/MSD for 10% spikes)
NH3, TOC- 75-125% recovery
Sulfides- 65-135% recovery
75-125% recovery 50-150% recovery
Surrogate Spikes Organics- (add to each sample)
NA NA 50% recovery
1= Until extraction; extracts must be processed within 40 days. MS/MSD= Matrix Spike/Matrix Spike Duplicate COV= Coefficient of Variation RPD= Relative Percent Difference CRM= Certified Reference Material DL= Detection Limit MB= Method Blank CI= Confidence Interval