quality assurance project plan for the data collection
TRANSCRIPT
Appendix 1. QUALITY ASSURANCE PROJECT PLANFOR THE DATA COLLECTION ACTIVITIESOF THE SACRAMENTO RIVER METALS
TRANSPORT STUDY
Editors’ Note:
The Quality Assurance Project Plan (QAPP) given in Appendix 1 has been edited slightly from its original version. The Plan has been verified against the main report with clarification of some notation. Other areas remain unchanged, though they may differ in the main report; for example, “REC” in the original version of the QAPP remains unchanged but has been changed to “RECSPIKE” and “RECSRM” in the main report. Tables and figures have been reformatted for clarity, typographical errors have been corrected, and references cited in the text but inadvertently left off the references list have been added. No major revisions have been made.
Appendix 1 109
110 Me
QUALITY ASSURANCE PROJECT PLANFOR THE DATA COLLECTION ACTIVITIES
OF THE SACRAMENTO RIVER METALSTRANSPORT STUDY
November 1996
Prepared by the U. S. Geological Survey for theSacramento Regional County Sanitation District
The use of firm, trade, and brand names in this report is for identification purposes only and does not constitute endorsement by the U.S. Geological Survey
tals Transport in the Sacramento River, California, 1996–97: Part 1. Methods and Data

Table of Contents
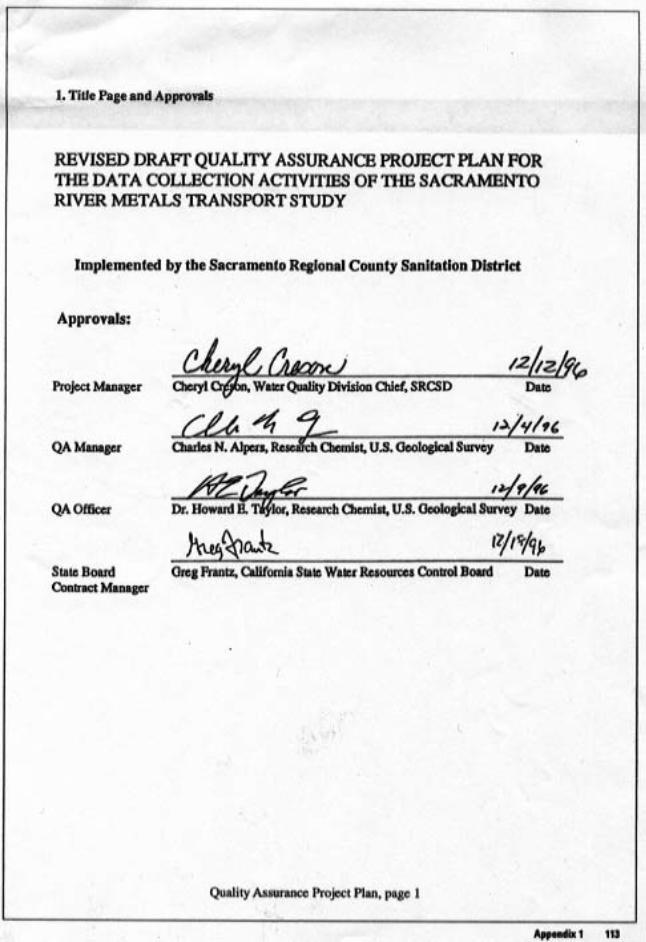
1. Title Page and Approvals . . . . . . . . . . . . . . . . . . . . . . . . . . . . . . . . . . . . . . . . . . . . . . . . . . 1
2. Distribution List . . . . . . . . . . . . . . . . . . . . . . . . . . . . . . . . . . . . . . . . . . . . . . . . . . . . . . . . . 2
3. Project Organization and Responsibility . . . . . . . . . . . . . . . . . . . . . . . . . . . . . . . . . . . . . . 3
4. Project Description . . . . . . . . . . . . . . . . . . . . . . . . . . . . . . . . . . . . . . . . . . . . . . . . . . . . . . . 4
4.1 Problem Definition . . . . . . . . . . . . . . . . . . . . . . . . . . . . . . . . . . . . . . . . . . . . . . . . 44.2 Project Objectives and Approach . . . . . . . . . . . . . . . . . . . . . . . . . . . . . . . . . . . . . . 54.3 Sampling Site Location . . . . . . . . . . . . . . . . . . . . . . . . . . . . . . . . . . . . . . . . . . . . . 74.4 Sampling Schedule . . . . . . . . . . . . . . . . . . . . . . . . . . . . . . . . . . . . . . . . . . . . . . . . 11
5. Quality Assurance Objectives for Field and Laboratory Measurements . . . . . . . . . . . . . 12
6. Specific Routing Procedures Used to Assess Data . . . . . . . . . . . . . . . . . . . . . . . . . . . . . . 16
7. Sample Collection ... . . . . . . . . . . . . . . . . . . . . . . . . . . . . . . . . . . . . . . . . . . . . . . . . . . . . . 17
7.1 Surface Water Sampling Procedures . . . . . . . . . . . . . . . . . . . . . . . . . . . . . . . . . . . 20
7.1.1 Subsample requirements . . . . . . . . . . . . . . . . . . . . . . . . . . . . . . . . . . . 207.1.2 Sample processing and preservation . . . . . . . . . . . . . . . . . . . . . . . . . . 22
7.1.2.1 Splitting . . . . . . . . . . . . . . . . . . . . . . . . . . . . . . . . . . . . . . 227.1.2.2 Filtration–0.45 µm filter, organic carbon . . . . . . . . . . . . . 247.1.2.3 Filtration–0.45 µm filter, inorganic constituents . . . . . . . 257.1.2.4 Filtration–10,000 NMWU (0.005 µm equivalent) . . . . . . 257.1.2.5 Preservation . . . . . . . . . . . . . . . . . . . . . . . . . . . . . . . . . . . 26
7.2 Bed Sediment Sampling Procedures . . . . . . . . . . . . . . . . . . . . . . . . . . . . . . . . . . . . 26
7.2.1 Subsample requirements . . . . . . . . . . . . . . . . . . . . . . . . . . . . . . . . . . . . 277.2.2 Sample processing and preservation . . . . . . . . . . . . . . . . . . . . . . . . . . . 28
7.3 Equipment cleaning . . . . . . . . . . . . . . . . . . . . . . . . . . . . . . . . . . . . . . . . . . . . . . . . 28
8. Sample Custody . . . . . . . . . . . . . . . . . . . . . . . . . . . . . . . . . . . . . . . . . . . . . . . . . . . . . . . . . 29
9. Field Measurements . . . . . . . . . . . . . . . . . . . . . . . . . . . . . . . . . . . . . . . . . . . . . . . . . . . . . . 30
10. Calibration Procedures and Frequency . . . . . . . . . . . . . . . . . . . . . . . . . . . . . . . . . . . . . . . 30
11. Analytical Procedures . . . . . . . . . . . . . . . . . . . . . . . . . . . . . . . . . . . . . . . . . . . . . . . . . . . 32
11.1 Concentration of dissolved major and trace elements . . . . . . . . . . . . . . . . . . . . . 3211.2 Redox speciation of iron . . . . . . . . . . . . . . . . . . . . . . . . . . . . . . . . . . . . . . . . . . . . 3211.3 Sequential extractions of bed sediment and colloidal material . . . . . . . . . . . . . . . 3311.4 Analysis of sulfur speciation and mineralogy in colloid concentrates and
bed sediment . . . . . . . . . . . . . . . . . . . . . . . . . . . . . . . . . . . . . . . . . . . . . . . . . . . . . 3311.5 Mineralogy of colloidal material and bed sediment using X-ray diffraction .. . . . 3411.6 Mineralogy using MÖssbauer spectroscopy . . . . . . . . . . . . . . . . . . . . . . . . . . . . . . 34
Quality Assurance Project Plan, page ii
Appendix 1 111
1
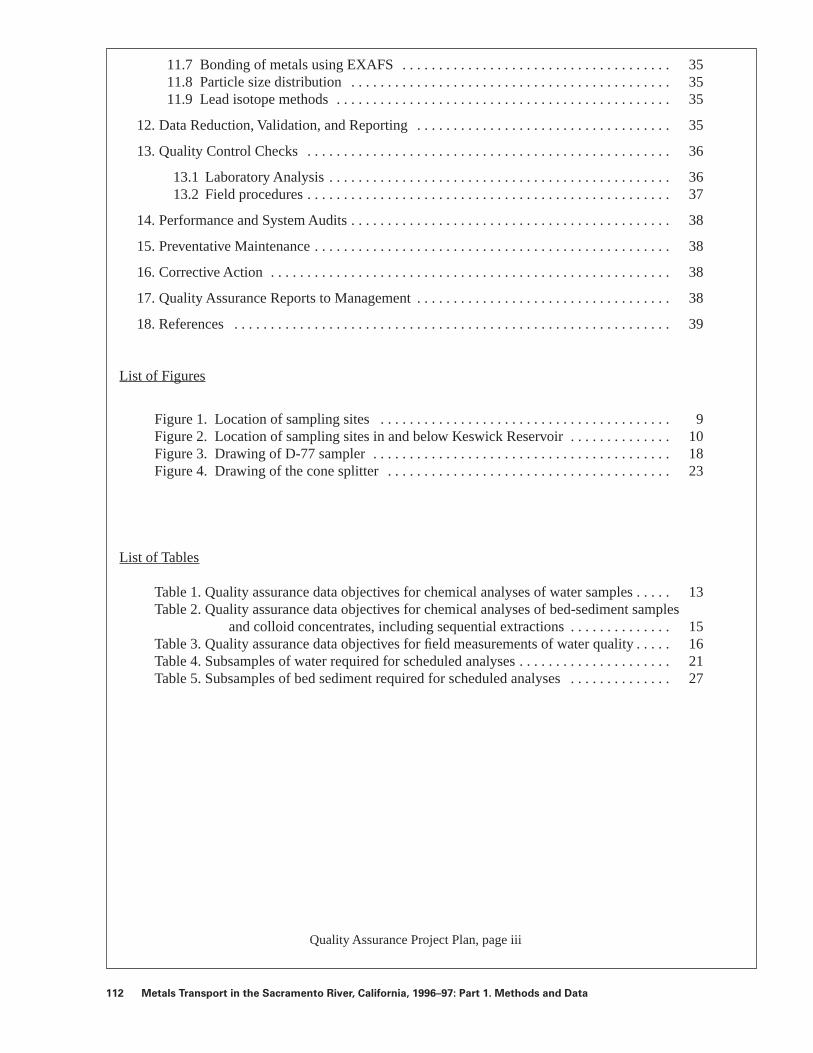
11.7 Bonding of metals using EXAFS . . . . . . . . . . . . . . . . . . . . . . . . . . . . . . . . . . . . . 3511.8 Particle size distribution . . . . . . . . . . . . . . . . . . . . . . . . . . . . . . . . . . . . . . . . . . . . 3511.9 Lead isotope methods . . . . . . . . . . . . . . . . . . . . . . . . . . . . . . . . . . . . . . . . . . . . . . 35
12. Data Reduction, Validation, and Reporting . . . . . . . . . . . . . . . . . . . . . . . . . . . . . . . . . . . 35
13. Quality Control Checks . . . . . . . . . . . . . . . . . . . . . . . . . . . . . . . . . . . . . . . . . . . . . . . . . . 36
13.1 Laboratory Analysis . . . . . . . . . . . . . . . . . . . . . . . . . . . . . . . . . . . . . . . . . . . . . . . 3613.2 Field procedures . . . . . . . . . . . . . . . . . . . . . . . . . . . . . . . . . . . . . . . . . . . . . . . . . . 37
14. Performance and System Audits . . . . . . . . . . . . . . . . . . . . . . . . . . . . . . . . . . . . . . . . . . . . 38
15. Preventative Maintenance . . . . . . . . . . . . . . . . . . . . . . . . . . . . . . . . . . . . . . . . . . . . . . . . . 38
16. Corrective Action . . . . . . . . . . . . . . . . . . . . . . . . . . . . . . . . . . . . . . . . . . . . . . . . . . . . . . . 38
17. Quality Assurance Reports to Management . . . . . . . . . . . . . . . . . . . . . . . . . . . . . . . . . . . 38
18. References . . . . . . . . . . . . . . . . . . . . . . . . . . . . . . . . . . . . . . . . . . . . . . . . . . . . . . . . . . . . 39
List of Figures
Figure 1. Location of sampling sites . . . . . . . . . . . . . . . . . . . . . . . . . . . . . . . . . . . . . . . . 9Figure 2. Location of sampling sites in and below Keswick Reservoir . . . . . . . . . . . . . . 10Figure 3. Drawing of D-77 sampler . . . . . . . . . . . . . . . . . . . . . . . . . . . . . . . . . . . . . . . . . 18Figure 4. Drawing of the cone splitter . . . . . . . . . . . . . . . . . . . . . . . . . . . . . . . . . . . . . . . 23
List of Tables
Table 1. Quality assurance data objectives for chemical analyses of water samples . . . . . 13Table 2. Quality assurance data objectives for chemical analyses of bed-sediment samples
and colloid concentrates, including sequential extractions . . . . . . . . . . . . . . 15Table 3. Quality assurance data objectives for field measurements of water quality . . . . . 16Table 4. Subsamples of water required for scheduled analyses . . . . . . . . . . . . . . . . . . . . . 21Table 5. Subsamples of bed sediment required for scheduled analyses . . . . . . . . . . . . . . 27
Quality Assurance Project Plan, page iii
12 Metals Transport in the Sacramento River, California, 1996–97: Part 1. Methods and Data

1
2. Distribution List
Cheryl Creson, Sacramento Regional County Sanitation DistrictRosemary Clark, Sacramento Regional County Sanitation District
Greg Frantz, State Water Resources Control Board
Technical Advisory Committee:
Jerry Boles, Department of Water Resources, State of CaliforniaJim Bybee, National Marine Fisheries ServiceRon Churchill, Department of Mines and Geology, State of CaliforniaVal Connor, Regional Water Quality Control Board–Central Valley RegionBill Croyle, Regional Water Quality Control Board–Central Valley RegionLee Erickson, Stauffer Management Co.John Fields, Bureau of ReclamationBrian Finlayson, Department of Fish and Game, State of CaliforniaRuss Flegal, University of California–Santa CruzDean Heckathorn, U.S. Fish and Wildlife ServiceDennis Heiman, Regional Water Quality Control Board–Central Valley RegionRick Humpreys, State Water Resources Control BoardNick Iadanza, National Marine Fisheries ServiceBill Jennings, Delta KeeperRay Krauss, Homestake Mining Co.Stefan Lorenzato, State Water Resources Control BoardPaul Meyer, Bureau of Land ManagementMichael Pickering, Brush Creek Mining and Development Co.Kerry Rae, Bureau of ReclamationMike Saiki, U.S. Geological Survey, Biological Resources DivisionDarell Slotton, University of California–DavisChris Stathos, Suction Dredgers Ad-Hoc CommitteeRick Sugarek, U.S. Environmental Protection AgencyClaus Suverkropp, Larry Walker AssociatesJane Vorpagel, Department of Fish and Game, State of CaliforniaDan Welsh, U.S. Fish and Wildlife ServiceRay Zimny, U.S. Army Corps of Engineers
Quality Assurance Project Plan, page 2
14 Metals Transport in the Sacramento River, California, 1996–97: Part 1. Methods and Data
3. Project Organization and Responsibility
This project will be managed by the Sacramento Regional County Sanitation District (SRCSD).
The project manager is Ms. Cheryl Creson, Chief of the Water Quality Division of the SRCSD.
The project quality assurance manager is Dr. Charles N. Alpers, Research Chemist with the U.S.
Geological Survey (USGS) in Sacramento. Sample collection and most data acquisition work will be
conducted by the USGS.
Analysis of water samples for trace and ultratrace elements (including mercury), and major
cations in water, in colloid concentrates, and in sediment extracts will be done by the USGS laboratory in
Boulder, Colorado, under the supervision of Dr. Howard E. Taylor, who is the Quality Assurance officer
for this work. Dr. Taylor will also assist in training USGS field personnel in sampling and equipment
cleaning procedures.
Analysis of nutrients, organic carbon, and major anions in water samples will be done by the
USGS National Water Quality Laboratory in Arvada, Colorado. The Quality Assurance officer for this
portion of the work is Dr. Peter Rogerson, who is Director of the USGS National Water Quality
Laboratory (NWQL).
Analysis of iron redox species in water samples will be done by the USGS in Sacramento, under
the direction of Dr. Charles N. Alpers. Grain size distribution of suspended sediment will be done by the
USGS laboratory in Vancouver, Washington. Grain size distribution in colloid concentrates will be done
at the USGS laboratory in Boulder, Colorado.
MÖssbauer spectroscopy will be done by the Technical University in Munich, Germany under the
direction of Dr. Udo Schwertmann. Flow measurements will be provided by the USGS, the California
Department of Water Resources, the Bureau of Reclamation, and other water agencies responsible for
recording stream flow in the study area.
Quality Assurance Project Plan, page 3
Appendix 1 115
116
A technical advisory committee (TAC) will serve as technical reviewers for the project. The TAC
consists of staff from the SRCSD, Larry Walker Associates (contractor to the SRCSD), the California
State Water Resources Control Board (SWRCB), the Regional Water Quality Control Board - Central
Valley Region, the California Department of Conservation (Division of Mines and Geology), the
California Dept. of Fish and Game, the U.S. Environmental Protection Agency (EPA) Region IX,
CH2M-Hill (contractor to the U.S. EPA), the U.S. Fish and Wildlife Service, the U.S. Geological
Survey, the Bureau of Reclamation, The Bureau of Land Management, the U.S. Forest Service, the U.S.
Army Corps of Engineers, the National Marine Fisheries Service, the University of California at Davis,
the University of California at Santa Cruz, and commercial and recreational mining interests.
4. Project Description
4.1 Project Definition
Metals from abandoned and inactive mines represent a major source of potentially toxic
contamination to fish populations of the Sacramento River in northern California. Concentrations of
copper (Cu), zinc (Zn), cadmium (Cd), lead (Pb), and mercury (Hg) are of concern regarding aquatic
life at several points in the Sacramento River. The winter-run Chinoook salmon, a federally listed
endangered species, has critical habitat in the Sacramento River, as do other threatened aquatic species.
In the lower part of the Sacramento Basin, agricultural activities may be an important source of
copper to the river because of the widespread application of compounds such as copper sulfate for
control of algae in rice fields. Urban runoff represents a third potential source of metals to the river.
Mercury contamination is a well documented problem in several streams tributary to the
Sacramento River. Mercury may be transported to the river from natural geological sources in
Quality Assurance Project Plan, page 4
Metals Transport in the Sacramento River, California, 1996–97: Part 1. Methods and Data
the Coast Ranges, from abandoned mercury mines, from base metal mines, and from mercury which
was transported into the Sierra Nevada and foothill regions for use in historical gold mining operations.
Non-point sources associated with urban land use may also contribute mercury to the river
environment.
4.2 Project Objectives and Approach
The overall objective of the study is to quantify the speciation and transport of copper, zinc, lead,
cadmium, and mercury in the Sacramento River below Shasta Dam and to identify sources of trace
metals to the Sacramento River, including mines, agriculture, and urban runoff. The geochemical
studies are designed to determine the processes affecting the transport mechanisms of dissolved metals
and metals associated with fine-grained sediments. Improved knowledge of these issues will provide an
understanding of how the river responds chemically to introduced metals. This understanding is critical
to determining the benefits throughout the watershed of ongoing and proposed remediation at the Iron
Mountain Mines Superfund site and at other mines in the vicinity of Shasta Lake and to determining the
likelihood that such remediation may or may not lead to the reduction of metal loadings in the
Sacramento River.
Three critical unanswered questions with regard to metals in the Sacramento River will be
addressed: (1) What is the distribution and speciation of metals in the dissolved, colloidal, and
suspended phases? (2) How do metal concentration and speciation change as a function of distance
down-river? and (3) What is the relative magnitude of metal sources, including mine drainage,
agricultural drainage, and urban runoff?
Water samples will be collected and analyzed at selected locations to characterize the grain size
of suspended particles having elevated concentrations of metals and to determine concentrations of
dissolved metals. Tangential-flow ultrafiltration using filter membranes rated at 10,000 Nominal
Molecular Weight Units (NMWU, or daltons), equivalent to 0.005 µm pore diameter, will be used to
process large volumes of river water so that suitable amounts of colloidal material can be concentrated
for analysis. Water samples also will be filtered with conventional 0.45 micrometer pore-diameter
membranes for comparison with data collected by
Quality Assurance Project Plan, page 5
Appendix 1 117
11
the National Water Quality Assessment Program (NAWQA) of the U.S. Geological Survey and other
agencies collecting water-quality data in the Sacramento River Basin. However, the tangential-flow
system is expected to provide a more reliable separation of solids because partial clogging of
membrane pores is avoided (e.g. Horowitz and others, 1994).
Filtrates from 0.005 equivalent and 0.45 micrometer pore-diameter membranes and colloids
concentrated during ultrafiltration will be analyzed chemically to determine the distribution of metals
and major elements in different suspended size fractions and in the operationally defined “dissolved”
phase. Trace elements and major cations will be determined by inductively coupled plasma/atomic
emission spectrometry (ICP–AES) initially, followed by inductively coupled plasma/mass
spectrometry (ICP–MS) for all elements with concentrations less than about 500 µg/L. The
methodology that will be used was developed by the USGS National Research Program (Garbarino
and Taylor, 1995) to achieve state-of-the-art detection limits for trace metals. Concentrations of
mercury will be determined by cold vapor atomic fluorescence spectrometry (CV–AFS). Major anions
will be determined by ion chromatography (IC). Ferrous and total iron will be determined by using
ultraviolet (UV) spectroscopy with ferrozine as the complexing agent (Stookey, 1970). Aqueous
speciation and ion-paring analysis will be carried out using the computer program WATEQ4F (Ball and
Nordstrom, 1991) or the equivalent update. Light-scattering spectrometry and X-ray sedimentation
analysis will be used to characterize the grain size distribution of the colloidal concentrates.
Mineralogy of suspended and colloidal material will be assessed using X-ray diffraction (XRD)
and low-temperature Mössbauer spectroscopy, techniques required to determine the crystallinity and
structure of poorly crystalline forms of hydrous iron and aluminum oxides and hydroxy-sulfates
(Murad and others, 1994). Extended X-ray Absorption Fine Structure (EXAFS) spectroscopy and
related methods will be investigated in an attempt to determine the nature of chemical bonds between
trace metals and hydrous iron and aluminum oxide particles, and in particular to distinguish between
metal adsorption and co-precipitation (e.g. Waychunas and others, 1993). This distinction is important
for determining geochemical mechanisms that could lead to bioavailability via release of trace metals
from suspended solids, for example: (a) desorption of metals from Fe-Al-hyroxy-sulfate mineral
surfaces in response to pH change, (b) release of metals associated with Fe-Al-hydroxy-sulfate
minerals by mineral dissolution driven by iron photoreduction of pH change, and (c) oxidative
dissolution of mono-sulfide minerals.
Quality Assurance Project Plan, page 6
8 Metals Transport in the Sacramento River, California, 1996–97: Part 1. Methods and Data
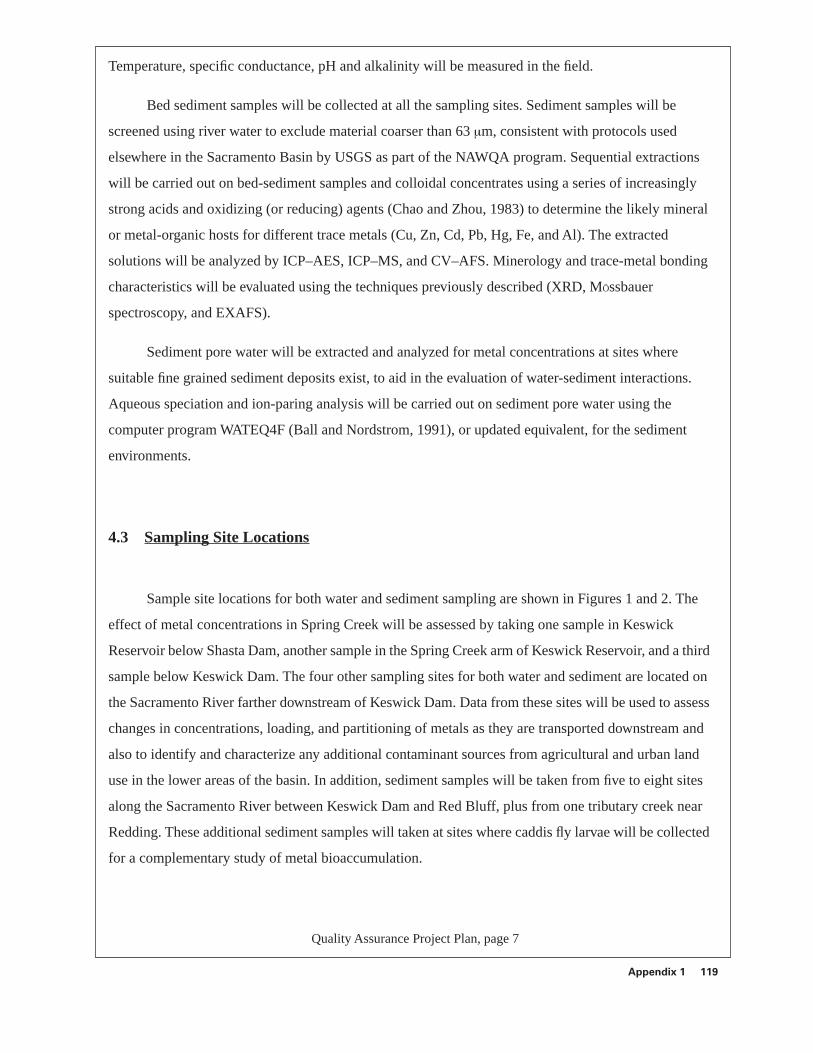
Temperature, specific conductance, pH and alkalinity will be measured in the field.
Bed sediment samples will be collected at all the sampling sites. Sediment samples will be
screened using river water to exclude material coarser than 63 µm, consistent with protocols used
elsewhere in the Sacramento Basin by USGS as part of the NAWQA program. Sequential extractions
will be carried out on bed-sediment samples and colloidal concentrates using a series of increasingly
strong acids and oxidizing (or reducing) agents (Chao and Zhou, 1983) to determine the likely mineral
or metal-organic hosts for different trace metals (Cu, Zn, Cd, Pb, Hg, Fe, and Al). The extracted
solutions will be analyzed by ICP–AES, ICP–MS, and CV–AFS. Minerology and trace-metal bonding
characteristics will be evaluated using the techniques previously described (XRD, MÖssbauer
spectroscopy, and EXAFS).
Sediment pore water will be extracted and analyzed for metal concentrations at sites where
suitable fine grained sediment deposits exist, to aid in the evaluation of water-sediment interactions.
Aqueous speciation and ion-paring analysis will be carried out on sediment pore water using the
computer program WATEQ4F (Ball and Nordstrom, 1991), or updated equivalent, for the sediment
environments.
4.3 Sampling Site Locations
Sample site locations for both water and sediment sampling are shown in Figures 1 and 2. The
effect of metal concentrations in Spring Creek will be assessed by taking one sample in Keswick
Reservoir below Shasta Dam, another sample in the Spring Creek arm of Keswick Reservoir, and a third
sample below Keswick Dam. The four other sampling sites for both water and sediment are located on
the Sacramento River farther downstream of Keswick Dam. Data from these sites will be used to assess
changes in concentrations, loading, and partitioning of metals as they are transported downstream and
also to identify and characterize any additional contaminant sources from agricultural and urban land
use in the lower areas of the basin. In addition, sediment samples will be taken from five to eight sites
along the Sacramento River between Keswick Dam and Red Bluff, plus from one tributary creek near
Redding. These additional sediment samples will taken at sites where caddis fly larvae will be collected
for a complementary study of metal bioaccumulation.
Quality Assurance Project Plan, page 7
Appendix 1 119
120
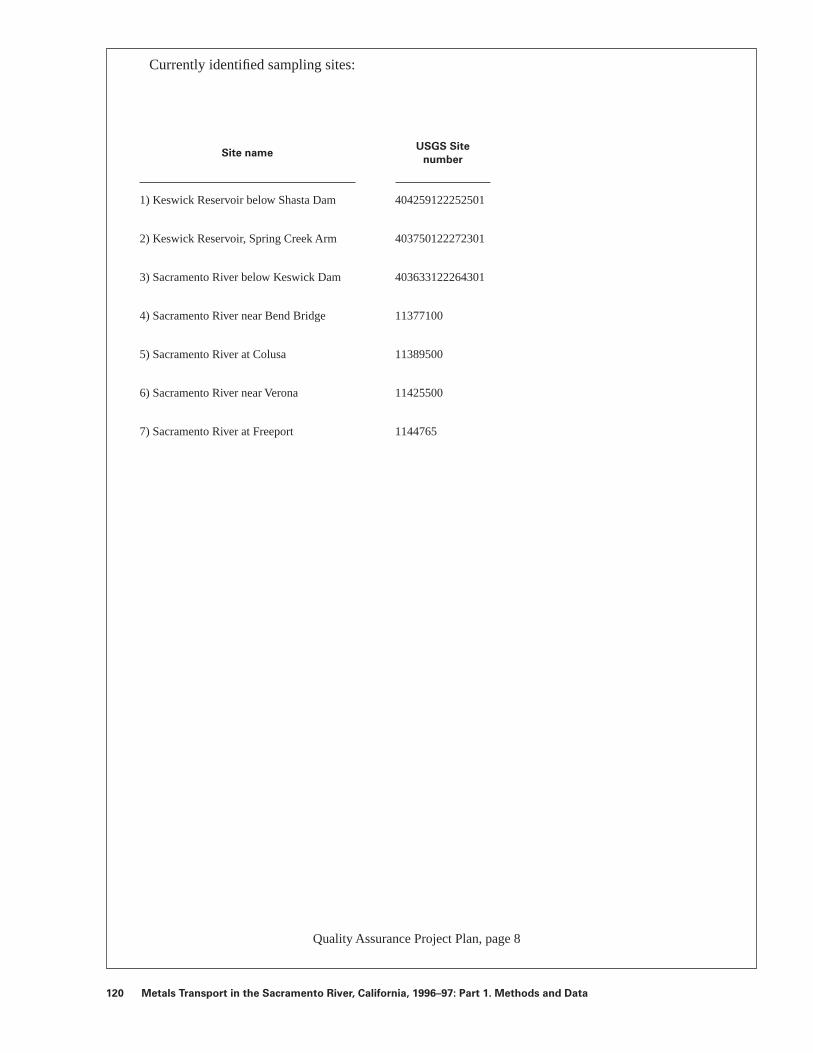
Currently identified sampling sites:
Site name USGS Site
number
1) Keswick Reservoir below Shasta Dam 404259122252501
2) Keswick Reservoir, Spring Creek Arm 403750122272301
3) Sacramento River below Keswick Dam 403633122264301
4) Sacramento River near Bend Bridge 11377100
5) Sacramento River at Colusa 11389500
6) Sacramento River near Verona 11425500
7) Sacramento River at Freeport 1144765
Quality Assurance Project Plan, page 8
Metals Transport in the Sacramento River, California, 1996–97: Part 1. Methods and Data
Appendix 1 121
Quality Assurance Project Plan, page 9
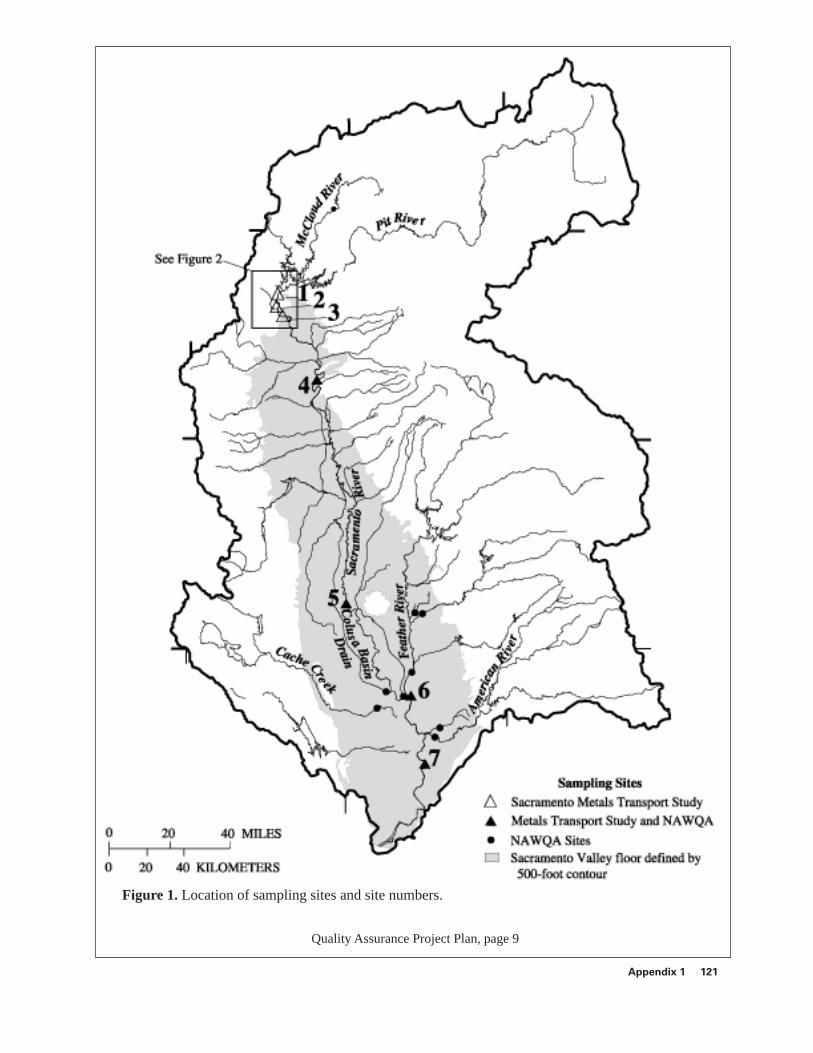
Figure 1.
Location of sampling sites and site numbers.
1
Quality Assurance Project Plan, page 10
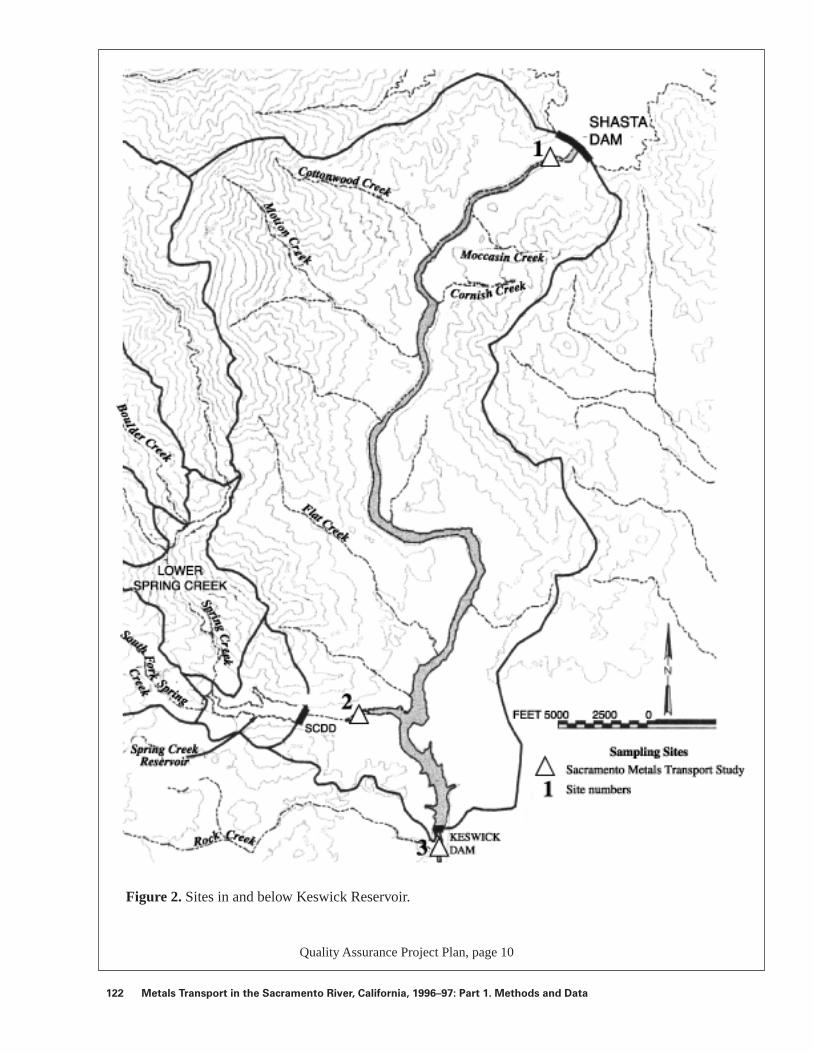
Figure 2. Sites in and below Keswick Reservoir.
22 Metals Transport in the Sacramento River, California, 1996–97: Part 1. Methods and Data

4.4 Sampling Schedule
Sample collection is expected to be done between July 1996 and June 1997. Samples will be
collected periodically throughout the year to assess effects of seasonal changes and also during high
flows associated with winter storms to assess the effect of these events on the loading and partitioning of
metals in the river. A minimum of six water samples and one bed sediment sample will be collected at
each site.
1996 July Water samples
Aug. Bottom sediment samples
Sept. Water samples
Nov. Water samples collected at predicted lowest flows of the year
1997 Dec./Jan. Water samples collected during storm events
Feb./Mar Water samples collected during storm events
May/June Water samples collected during the period of rice field drainage
July Water samples (if funding is sufficient)
Quality Assurance Project Plan, page 11
Appendix 1 123
1
5. Quality Assurance Objectives for Field and Laboratory Measurements
The objective of data collection in this project is to produce data that represent, as closely as
possible, in situ conditions of the sampled water body. This objective will be achieved by using accepted
methods to collect and analyze water and sediment samples and by evaluating field and laboratory
measurements in terms of detection limits, precision, accuracy, and completeness as summarized in Table 1
through 3. The detection limits in Tables 1 and 2 are based on previous work done by the analytical
laboratory (under the direction of Dr. Howard Taylor) that will conduct the analyses for this study. Actual
limits of detection and quantitation for this study will be determined using data analysis techniques
described by Garbarino and Taylor (1995).
Quality Assurance Project Plan, page 12
24 Metals Transport in the Sacramento River, California, 1996–97: Part 1. Methods and Data

Table 1. Quality assurance data objectives for chemical analyses of water samples
[concs., concentrations; CV–AFS, cold-vapor/atomic fluorescence spectrometry; IC, ion chromatography; ICP–AES,inductively coupled plasma/atomic emission spectrometry; ICP–MS, inductively coupled plasma/mass spectrometry; IRS,infrared spectrometry; REC, percentage recovery; ROE, residual on evaporation; RPD, relative percentage difference, SRM,Standard Reference Material; UV, ultraviolet spectroscopy, µg/L, microgram per liter; %, percent]
Constituent MethodDetection
LimitPrecision Accuracy
Complete-
ness
Copper ICP–MS 0.02 µg/L Duplicate RPD �25% or �50% at concs. <10 times the detection limit
SRM REC or Lab Spike = 100% �25% or �50% at concs. <10 times the detection limit
90%
Zinc ICP–MS 0.08 µg/L Duplicate RPD �25% or �50% at concs. <10 times the detection limit
SRM REC or Lab Spike = 100% �25% or �50% at concs. <10 times the detection limit
90%
Lead ICP–MS 0.06 µg/L Duplicate RPD �25% or �50% at concs. <10 times the detection limit
SRM REC or Lab Spike = 100% �25% or �50% at concs. <10 times the detection limit
90%
Cadmium ICP–MS 0.05 µg/L Duplicate RPD �25% or �50% at concs. <10 times the detection limit
SRM REC or Lab Spike = 100% �25% or �50% at concs. <10 times the detection limit
90%
Mercury CV–AFS 0.0004 µg/L Duplicate RPD �25% or �50% at concs. <10 times the detection limit
SRM REC or Lab Spike = 100% �25% or �50% at concs. <10 times the detection limit
90%
Iron ICP–AES 5 µg/L Duplicate RPD �25% or �50% at concs. <10 times the detection limit
SRM REC or Lab Spike = 100% �25% or �50% at concs. <10 times the detection limit
90%
Iron (II) and total (III by difference)
UV 10 µg/L Duplicate RPD �25% or �50% at concs. <10 times the detection limit
SRM REC or Lab Spike = 100% �25% or �50% at concs. <10 times the detection limit
90%
Aluminum ICP–MS 0.2 µg/L Duplicate RPD �25% or �50% at concs. <10 times the detection limit
SRM REC or Lab Spike = 100% �25% or �50% at concs. <10 times the detection limit
90%
Sulfate IC 0.1 mg/L Duplicate RPD �25% or �50% at concs. <10 times the detection limit
SRM REC or Lab Spike = 100% �25% or �50% at concs. <10 times the detection limit
90%
Chloride IC 0.1 mg/L Duplicate RPD �25% or �50% at concs. <10 times the detection limit
SRM REC or Lab Spike = 100% �25% or �50% at concs. <10 times the detection limit
90%
Quality Assurance Project Plan, page 13
Appendix 1 125
1
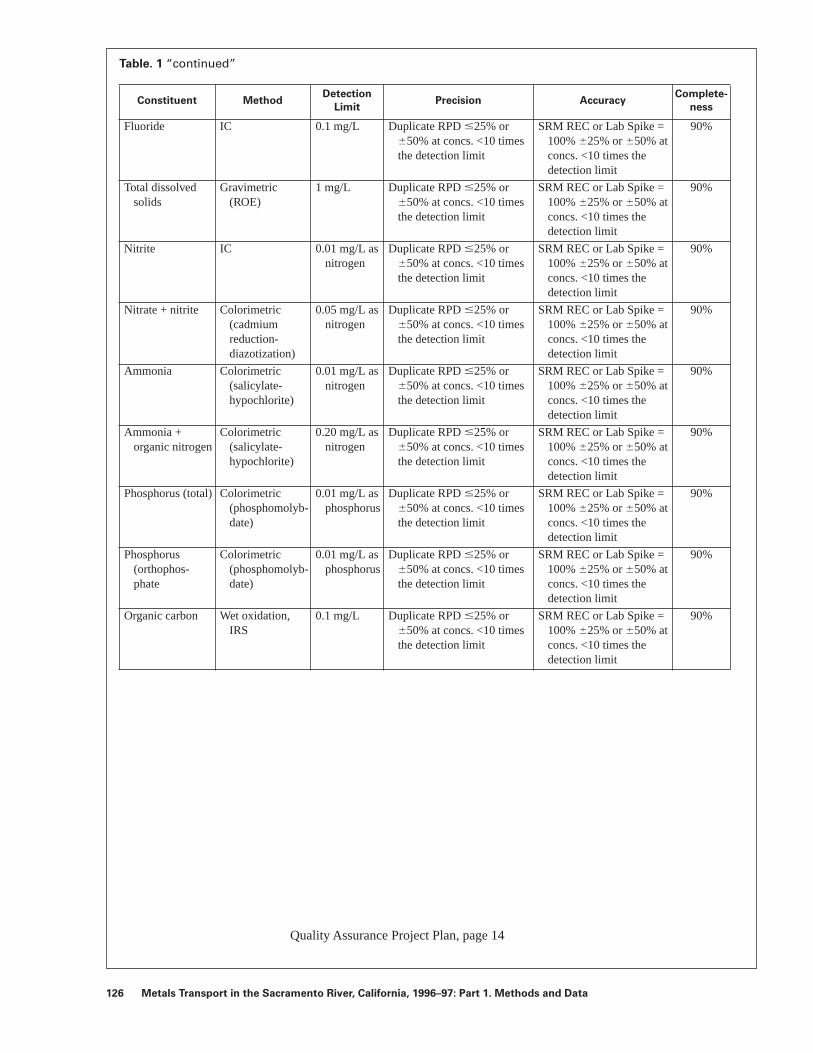
Table. 1 “continued”
Constituent MethodDetection
LimitPrecision Accuracy
Complete-
ness
Fluoride IC 0.1 mg/L Duplicate RPD �25% or �50% at concs. <10 times the detection limit
SRM REC or Lab Spike = 100% �25% or �50% at concs. <10 times the detection limit
90%
Total dissolved solids
Gravimetric (ROE)
1 mg/L Duplicate RPD �25% or �50% at concs. <10 times the detection limit
SRM REC or Lab Spike = 100% �25% or �50% at concs. <10 times the detection limit
90%
Nitrite IC 0.01 mg/L as nitrogen
Duplicate RPD �25% or �50% at concs. <10 times the detection limit
SRM REC or Lab Spike = 100% �25% or �50% at concs. <10 times the detection limit
90%
Nitrate + nitrite Colorimetric (cadmium reduction-diazotization)
0.05 mg/L as nitrogen
Duplicate RPD �25% or �50% at concs. <10 times the detection limit
SRM REC or Lab Spike = 100% �25% or �50% at concs. <10 times the detection limit
90%
Ammonia Colorimetric (salicylate-hypochlorite)
0.01 mg/L as nitrogen
Duplicate RPD �25% or �50% at concs. <10 times the detection limit
SRM REC or Lab Spike = 100% �25% or �50% at concs. <10 times the detection limit
90%
Ammonia + organic nitrogen
Colorimetric (salicylate-hypochlorite)
0.20 mg/L as nitrogen
Duplicate RPD �25% or �50% at concs. <10 times the detection limit
SRM REC or Lab Spike = 100% �25% or �50% at concs. <10 times the detection limit
90%
Phosphorus (total) Colorimetric (phosphomolyb-date)
0.01 mg/L as phosphorus
Duplicate RPD �25% or �50% at concs. <10 times the detection limit
SRM REC or Lab Spike = 100% �25% or �50% at concs. <10 times the detection limit
90%
Phosphorus (orthophos-phate
Colorimetric (phosphomolyb-date)
0.01 mg/L as phosphorus
Duplicate RPD �25% or �50% at concs. <10 times the detection limit
SRM REC or Lab Spike = 100% �25% or �50% at concs. <10 times the detection limit
90%
Organic carbon Wet oxidation, IRS
0.1 mg/L Duplicate RPD �25% or �50% at concs. <10 times the detection limit
SRM REC or Lab Spike = 100% �25% or �50% at concs. <10 times the detection limit
90%
Quality Assurance Project Plan, page 14
26 Metals Transport in the Sacramento River, California, 1996–97: Part 1. Methods and Data

Table 2. Quality assurance data objectives for chemical analyses of bed-sediment samples and colloid concentrates, including sequential extractions
[concs., concentrations; ICP–MS, inductively coupled plasma/mass spectrometry; CV–AFS, cold-vapor/atomicfluorescence spectrometry; ICP–AES, inductively coupled plasma/atomic emission spectrometry; REC, percent recovery;ROE, residual on evaporation; RPD, relative percentage difference, SRM, Standard Reference Material; %, percent; µg/g,microgram per gram]
Constituent MethodDetection
LimitPrecision Accuracy
Complete-
ness
Copper reductionoxidationresidual
ICP–MS0.30.42
Duplicate RPD �25% or �50% at concs. <10 times the detection limit
SRM REC or Lab Spike = 100% �25% or �50% at concs. <10 times the detection limit
90%
Zinc reductionoxidationresidual
ICP–MS0.145
Duplicate RPD �25% or �50% at concs. <10 times the detection limit
SRM REC or Lab Spike = 100% �25% or �50% at concs. <10 times the detection limit
90%
Lead reductionoxidationresidual
ICP–MS0.31.52
Duplicate RPD �25% or �50% at concs. <10 times the detection limit
SRM REC or Lab Spike = 100% �25% or �50% at concs. <10 times the detection limit
90%
Cadmiumreductionoxidationresidual
ICP–MS0.31.53
Duplicate RPD �25% or �50% at concs. <10 times the detection limit
SRM REC or Lab Spike = 100% �25% or �50% at concs. <10 times the detection limit
90%
Mercuryreductionoxidationresidual
CV–AFS0.0040.020.06
Duplicate RPD �25% or �50% at concs. <10 times the detection limit
SRM REC or Lab Spike = 100% �25% or �50% at concs. <10 times the detection limit
90%
Iron (total)reductionoxidationresidual
ICP–AES1510
Duplicate RPD �25% or �50% at concs. <10 times the detection limit
SRM REC or Lab Spike = 100% �25% or �50% at concs. <10 times the detection limit
90%
Aluminumreductionoxidationresidual
ICP–MS21020
Duplicate RPD �25% or �50% at concs. <10 times the detection limit
SRM REC or Lab Spike = 100% �25% or �50% at concs. <10 times the detection limit
90%
Quality Assurance Project Plan, page 15
Appendix 1 127
1
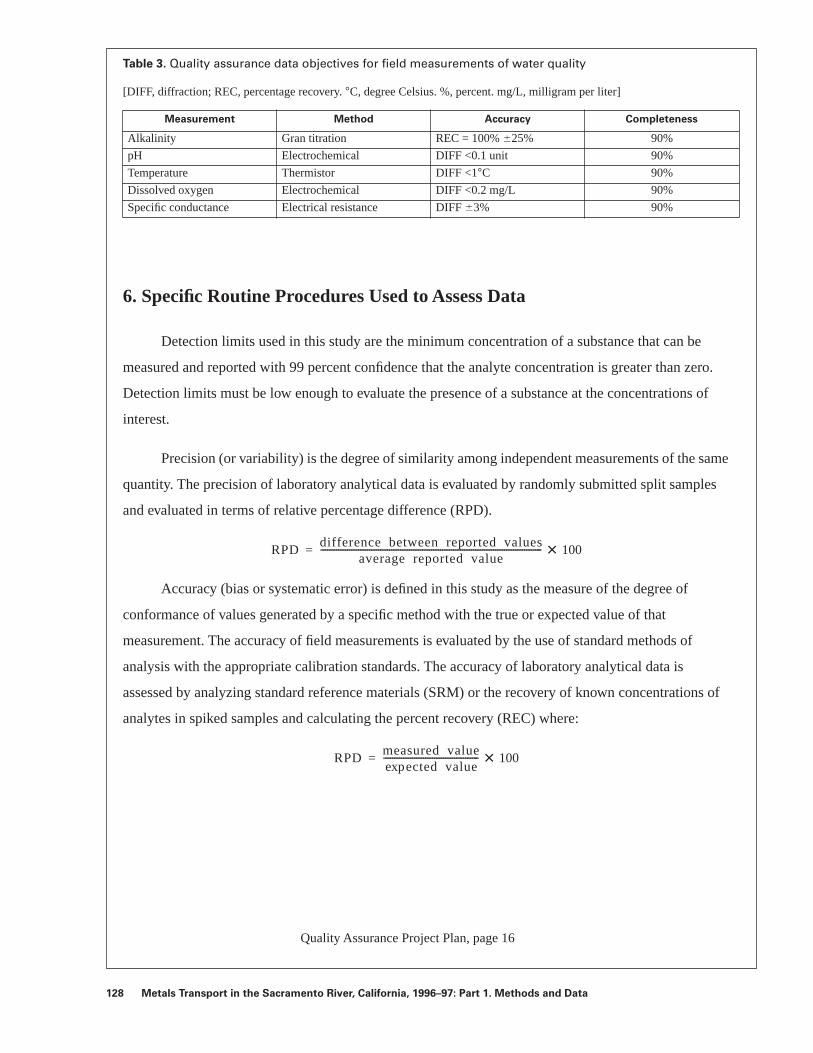
Table 3. Quality assurance data objectives for field measurements of water quality
[DIFF, diffraction; REC, percentage recovery. °C, degree Celsius. %, percent. mg/L, milligram per liter]
6. Specific Routine Procedures Used to Assess Data
Detection limits used in this study are the minimum concentration of a substance that can be
measured and reported with 99 percent confidence that the analyte concentration is greater than zero.
Detection limits must be low enough to evaluate the presence of a substance at the concentrations of
interest.
Precision (or variability) is the degree of similarity among independent measurements of the same
quantity. The precision of laboratory analytical data is evaluated by randomly submitted split samples
and evaluated in terms of relative percentage difference (RPD).
Accuracy (bias or systematic error) is defined in this study as the measure of the degree of
conformance of values generated by a specific method with the true or expected value of that
measurement. The accuracy of field measurements is evaluated by the use of standard methods of
analysis with the appropriate calibration standards. The accuracy of laboratory analytical data is
assessed by analyzing standard reference materials (SRM) or the recovery of known concentrations of
analytes in spiked samples and calculating the percent recovery (REC) where:
Measurement Method Accuracy Completeness
Alkalinity Gran titration REC = 100% �25% 90%
pH Electrochemical DIFF <0.1 unit 90%
Temperature Thermistor DIFF <1°C 90%
Dissolved oxygen Electrochemical DIFF <0.2 mg/L 90%
Specific conductance Electrical resistance DIFF �3% 90%
RPDdifference between reported values
average reported value---------------------------------------------------------------------------------------------------- 100×=
RPDmeasured value
ected valueexp------------------------------------------- 100×=
Quality Assurance Project Plan, page 16
28 Metals Transport in the Sacramento River, California, 1996–97: Part 1. Methods and Data
Both precision and accuracy will be enhanced by the use of standardized methods for sample
collection, handling and preservation and the analysis of field and laboratory blank samples.
Completeness is measured as the percent of valid analyses (those meeting the accuracy and
precision objectives). Water samples will be taken at seven sites on at least six occasions for a total of
at least 42 samples. Therefore, to achieve 90 percent completeness, 38 of 42 samples must meet the
quality assurance data objectives.
7. Sample Collection
Sampling procedures and many of the analytical methods used in this study are identical to those
used in the USGS NAWQA project currently underway in the Sacramento River Basin. Data produced
by the two studies will be directly comparable to one another.
Representative water samples for total and dissolved constituent analysis will be collected
concurrently with samples for colloidal analysis at each site.
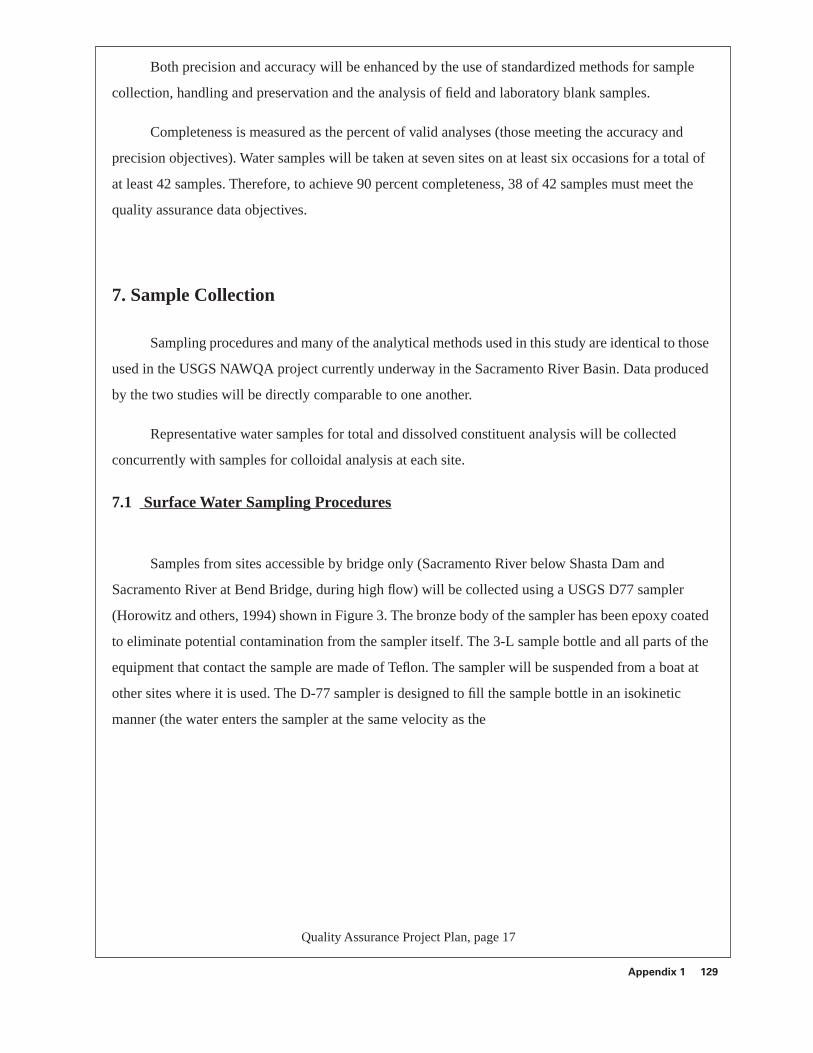
7.1 Surface Water Sampling Procedures
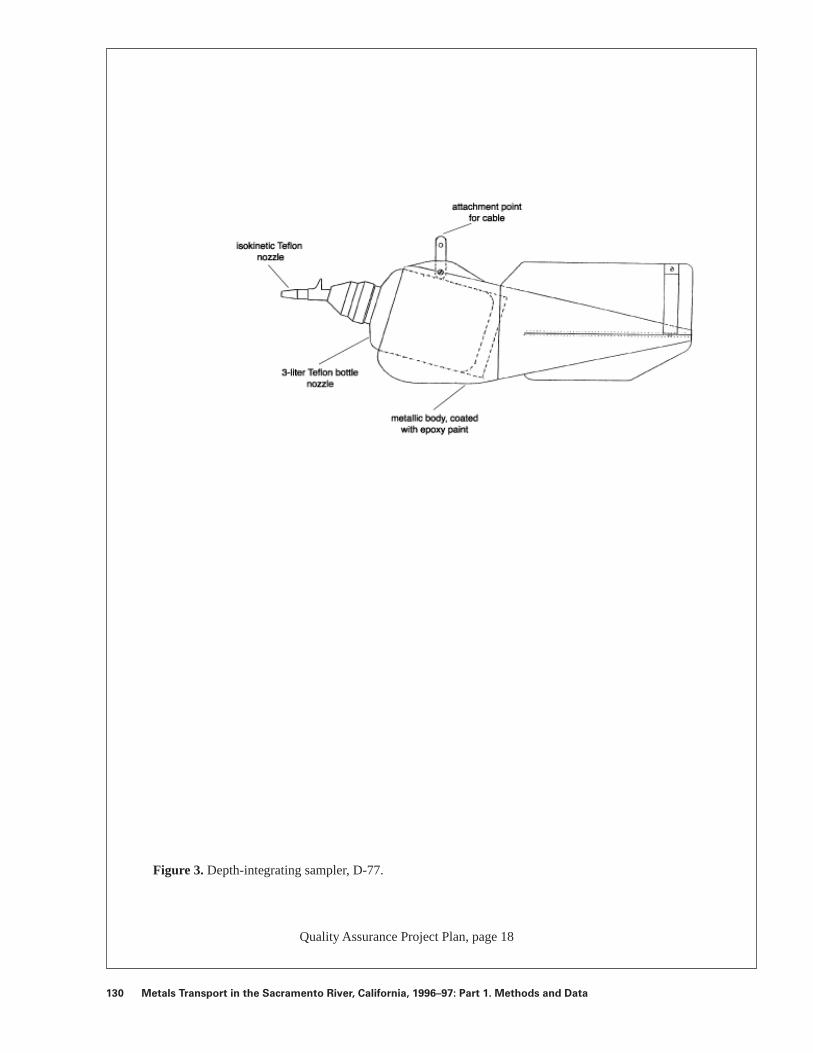
Samples from sites accessible by bridge only (Sacramento River below Shasta Dam and
Sacramento River at Bend Bridge, during high flow) will be collected using a USGS D77 sampler
(Horowitz and others, 1994) shown in Figure 3. The bronze body of the sampler has been epoxy coated
to eliminate potential contamination from the sampler itself. The 3-L sample bottle and all parts of the
equipment that contact the sample are made of Teflon. The sampler will be suspended from a boat at
other sites where it is used. The D-77 sampler is designed to fill the sample bottle in an isokinetic
manner (the water enters the sampler at the same velocity as the
Quality Assurance Project Plan, page 17
Appendix 1 129
1
Quality Assurance Project Plan, page 18
Figure 3. Depth-integrating sampler, D-77.
30 Metals Transport in the Sacramento River, California, 1996–97: Part 1. Methods and Data
water near the sampler) to ensure that concentrations of suspended sediment particles are
representative of concentrations in the water sampled. This equipment is capable of collecting an
isokinetic sample to a depth of about 15 feet. If this depth is exceeded at a sampling station, a
modification of the sampler will be made to extend its depth range. This modification consists of using
a perforated polyethylene bottle with a Teflon bag liner in place of a standard 3-L bottle. A set of Teflon
bags will be dedicated to each sampling site to minimize potential for contamination between sites.
Samples from the Sacramento River below Keswick Dam will be collected with Teflon tubing
using a peristaltic pump from near shore directly into Teflon bottles and polyethylene carboys. The
narrow and turbulent channel at this location appears very well mixed and boat access is not feasible.
The same approach will be used to sample the Sacramento River below Shasta Dam at low flows. The
sites accessible by boat (Spring Creek arm of Keswick Reservoir, and the Sacramento River at Colusa,
Verona, and Freeport) also will be sampled using Teflon tubing and a peristaltic pump. The tubing will
be secured in 10-feet of polyvinyl chloride (PVC) pipe and suspended into the water column from the
bow of the boat to minimize potential contamination. During sample collection, the depth of the tubing
intake will be varied between 1 and 9 feet below the river surface.
Mercury and lead will be sampled from a single vertical traverse near the middle of the river.
Composite samples for other trace metals, major ions, and other constituents will be collected using
equal-discharge-increment methods (Edwards and Glysson, 1988) which provide a cross-section
transect sample whose concentration is discharge weighted, both vertically and laterally. Between 5
and 15 lateral points will be sampled on each cross-section. Because of the size of the river and the
minimum fill rates of the D77 sampler, sample volume is expected to be between 6 to 20 L and will
require multiple sample bottles. Samples for total and dissolved constituents will remain in the 3-L
Teflon bottle in which they were collected until processing, or will be composited in a Teflon-lined
churn. Because a large volume of water is needed to recover an adequate mass of colloidal material,
samples collected for colloid analysis from the vertical stations on a cross-section transect will be
composited in one or more 25-L polyethylene carboys. Concentrations of metals in the colloidal
fractions are expected to be high enough that any slight
Quality Assurance Project Plan, page 19
Appendix 1 131

13
contamination or adsorption resulting from the use of polyethylene rather than Teflon containers
should not be significant. Each site will have a dedicated set of carboys that will be used only at that
site in order to minimize the potential for contamination between sites.
Samples for mercury and lead analyses will be collected from just one sampling point located at
the center of flow using a specially cleaned sample bottle and nozzle. While a width integrated sample
provides more confidence that the sample is truly representative of the river at the time of sampling, it
also exposes the sample to the atmosphere and potential contamination for a longer period of time.
Because concentrations of dissolved mercury and lead are expected to be low, it will be critical to
achieve minimal levels of contamination.
7.1.1 Subsample requirements
Once a representative sample of the river water has been collected, a variety of subsamples will
be split and processed before shipping to laboratories. Processing will take place in a mobile
laboratory that was built for use in the USGS NAWQA program. The mobile lab allows for efficient
sample preparation in a clean environment. Subsample requirements for the project are listed in Table
4.
Quality Assurance Project Plan, page 20
2 Metals Transport in the Sacramento River, California, 1996–97: Part 1. Methods and Data

Table 4. Subsamples of water required for scheduled analyses
[*, triple-distilled HNO3 for ultratrace element preservation; (a), a split sample will be held for archive purposes. conc., concentration; CA, California, CO, Colorado; EXAFS, extended X-ray absorption fine structure; NMWL, nominal molecular weight limit; Poly, polyethylene; USGS, U.S. Geological Survey; XRD, X-ray diffraction. µm, micrometer]
Matrix/filtration Analysis Preservation Bottle type, volume Laboratory
Whole water Mercury Oxidize (K2Cr2O7)Acidify (HNO3*)
Glass, 125 mL (a) USGS–Boulder, CO
Lead Acidify (HNO3*) Teflon, 250 mL USGS–Boulder, CO
Major/trace elements (cations) Acidify (HNO3*) Poly, 125 mL (a) USGS–Boulder, CO
Major elements (anions) None Poly, 125 mL (a) USGS–Arvada, CO
Suspended sediment conc. None Poly, 1,000 mL USGS–Salinas, CA
0.45 µm filtrate (silver filter)
Organic carbon, dissolved None Glass, baked, 125 mL USGS–Arvada, CO
Silver filter retentate
Organic carbon suspended None Petri dish USGS–Arvada, CO
0.45 µm filtrate (capsule filter)
Mercury Oxidize (K2Cr2O7)Acidify (HNO3*)
Glass, 125 mL (a) USGS–Boulder, CO
Lead Acidify (HNO3*) Teflon, 250 mL USGS–Boulder, CO
Major/trace elements (cations) Acidify Poly, 125 mL (a) USGS–Boulder, CO
Major elements (anions) None Poly, 125 mL USGS–Arvada, CO
Iron, redox speciation Acidify (HCl), chill Poly, amber, 125 mL USGS–Sacramento, CA
Nutrients Chill Poly, amber, 125 mL USGS–Arvada, CO
10,000 NMWL filtrate 0.005 µm equivalent
Mercury Oxidize (K2Cr2O7)Acidify (HNO3*)
Glass, 125 mL (a) USGS–Boulder, CO
Lead Acidify (HNO3*) Teflon, 250 mL USGS–Boulder, CO
Lead isotopes Acidify (HNO3*) Teflon, 1 L USGS–Denver, CO
Major/trace elements (cations) Acidify (HNO3*) Poly, 125 mL (a) USGS–Boulder, CO
Major elements (anions) None Poly, 125 mL (a) USGS–Arvada, CO
Iron, redox speciation Acidify (HCl), chill Poly, amber, 125 mL USGS–Sacramento, CA
Quality Assurance Project Plan, page 21
Appendix 1 133
1
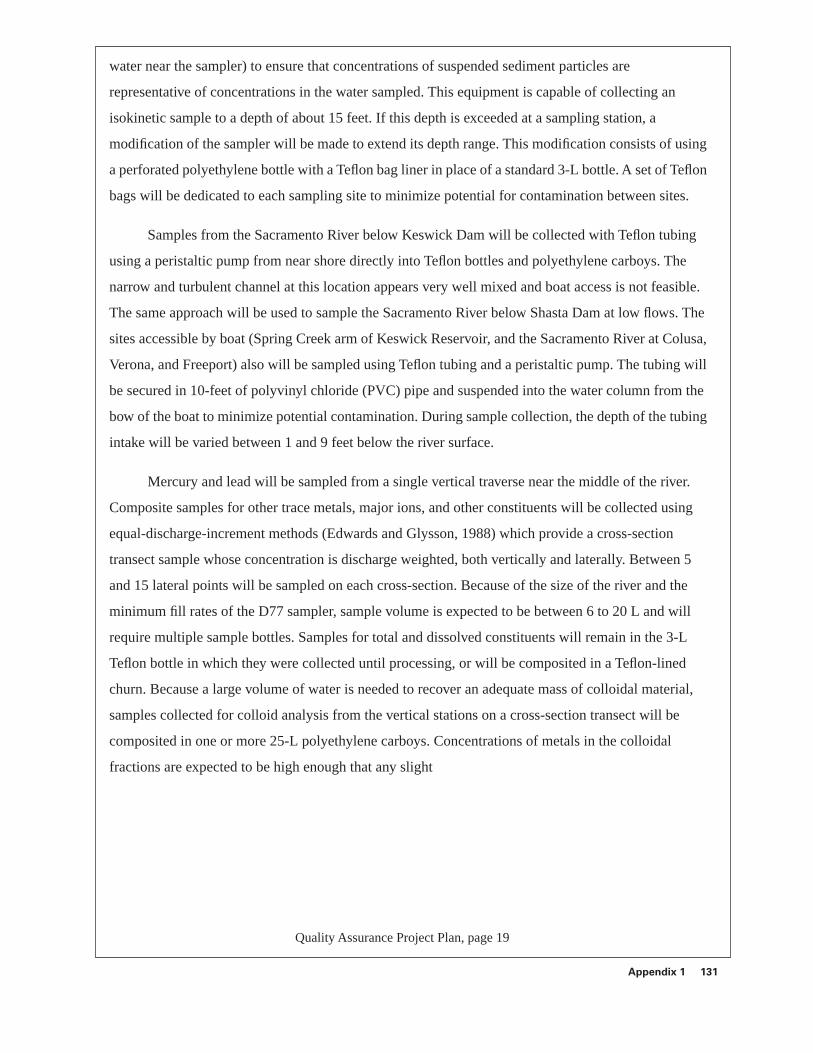
Table 4. “continued”
7.1.2 Sample processing and Preservation
7.1.2.1 Splitting
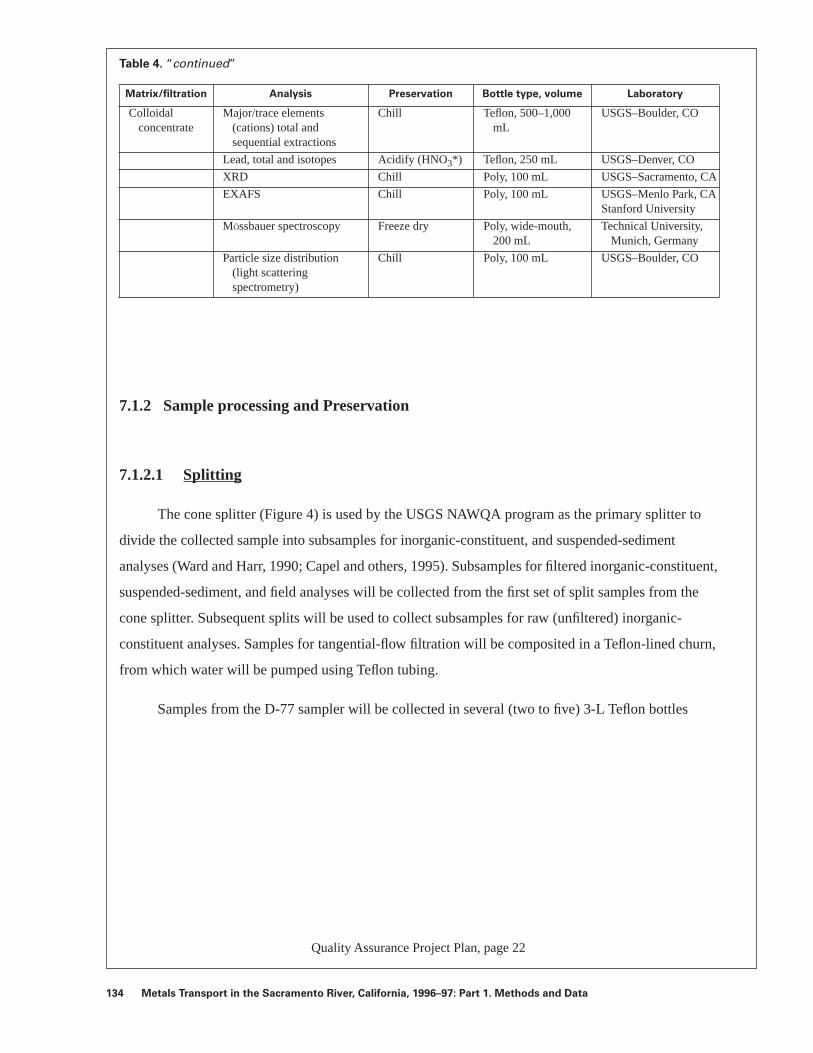
The cone splitter (Figure 4) is used by the USGS NAWQA program as the primary splitter to
divide the collected sample into subsamples for inorganic-constituent, and suspended-sediment
analyses (Ward and Harr, 1990; Capel and others, 1995). Subsamples for filtered inorganic-constituent,
suspended-sediment, and field analyses will be collected from the first set of split samples from the
cone splitter. Subsequent splits will be used to collect subsamples for raw (unfiltered) inorganic-
constituent analyses. Samples for tangential-flow filtration will be composited in a Teflon-lined churn,
from which water will be pumped using Teflon tubing.
Samples from the D-77 sampler will be collected in several (two to five) 3-L Teflon bottles
Matrix/filtration Analysis Preservation Bottle type, volume Laboratory
Colloidal concentrate
Major/trace elements (cations) total and sequential extractions
Chill Teflon, 500–1,000 mL
USGS–Boulder, CO
Lead, total and isotopes Acidify (HNO3*) Teflon, 250 mL USGS–Denver, CO
XRD Chill Poly, 100 mL USGS–Sacramento, CA
EXAFS Chill Poly, 100 mL USGS–Menlo Park, CAStanford University
MÖssbauer spectroscopy Freeze dry Poly, wide-mouth, 200 mL
Technical University, Munich, Germany
Particle size distribution (light scattering spectrometry)
Chill Poly, 100 mL USGS–Boulder, CO
Quality Assurance Project Plan, page 22
34 Metals Transport in the Sacramento River, California, 1996–97: Part 1. Methods and Data
Appendix 1 135
Quality Assurance Project Plan, page 23
Figure 4. The all-Teflon cone splitter and stand.
1
and later poured into the cone splitter. This method allows the cone splitter to function as both a splitter and
compositor.
The splitting process is as follows:
1. Set up the cone splitter on a flat, open area. A level splitter is critical to performance. All Teflon tubes should
be approximately the same length and the entire apparatus including subsample containers is tented in a
plastic bag. Water is poured directly into the splitter reservoir through a hole in the plastic tent, which is
covered between pours.
2. Field rinse all sample-collection and splitting equipment with native water. Collect the rinse water near the
shore to avoid heavy suspended sediments. Pour rinse water from the D-77 sample bottle through the Teflon
cap and nozzle and into the cone splitter. Three 1-L rinses are effective then one 3-L rinse.
3. Place subsample containers under each outlet tube. The tubes need only extend into the receiving containers
far enough to prevent spillage.
4. Agitate the sample (10 to 15 seconds) in the D-77 bottle to resuspend the sediments. Invert the bottle over
the cone splitter reservoir. Sample transfer should be rapid. Maintain a head of water above the standpipe to
prevent air from entering the splitting block.
5. Remove subsample containers from cone splitter and cap immediately.
6. An additional split is necessary to obtain the smaller volumes of some required subsamples. Reload splitter
ports with the required bottles and pour a subsample from the first set of split samples.
7. Disassemble the cone splitter after completing the sample processing and clean before reuse or storing.
7.1.2.2 Filtration–0.45 µm filter, organic carbon
The filtration procedure for dissolved and suspended organic carbon analyses uses a stainless-
steel or Teflon-pressure filter assembly fitted with a 47-mm diameter, silver, 0.45-µm
Quality Assurance Project Plan, page 24
36 Metals Transport in the Sacramento River, California, 1996–97: Part 1. Methods and Data
pore-size filter and a peristaltic pump that has been fitted with Tygon tubing to filter the sample. Filtering
and processing methods follow NAWQA protocol (Shelton, 1994).
7.1.2.3 Filtration–0.45 µm, inorganic constituents
A disposable 0.45 µm capsule filter (Gelman 12175) will be used to filter samples for major and
trace element analyses. This filter is currently being used by the NAWQA program in the Sacramento
Basin and the 0.45 µm pore size is used to define the dissolved phase in most water-quality studies. The
use of this filter will facilitate comparison of results obtained by this study with results from NAWQA
and other studies in the basin. Data obtained with the 0.45 µm filter will also be used to compare the
results from standard versus ultrafiltration methods.
A peristaltic pump head with Tygon tubing or a Teflon diaphragm pump head with corrugated
Teflon tubing will be used to create the pressure required to force samples through the filter units. The
detailed procedures follow NAWQA protocols (Shelton, 1994).
7.1.2.4 Filtration–10,000 NMWU (0.005 µm equivalent)
A Minitan tangential-flow filter apparatus will be used to obtain a filtered sample for analysis of
dissolved constituents defined by the less than 0.005 µm equivalent particle size. A Pellicon tangential-
flow filter apparatus will be used to obtain a concentrate of colloidal material. Cleaning procedures will
be the same as for other equipment that contacts the water sample. To further minimize contamination, a
dedicated set of filter membranes and tubing for both Minitan and Pellicon filters will be used at each
sampling site. The carboy(s) containing the sample collected for colloid processing will be allowed to sit
quietly for an hour before filtration to let the coarser grained suspended sediment settle to the bottom of
the container. Water will be pumped from a fixed distance above the sediment layer in order to eliminate
the larger size fractions from the colloidal concentrate.
Quality Assurance Project Plan, page 25
Appendix 1 137

1
7.1.2.5 PreservationSamples for trace metal analyses and major cations will be stabilized by acidifying to a pH of 2 or
less with ultrapure (distilled) concentrated nitric acid. In addition, potassium dichromate will be added to
samples for mercury analysis. Samples for redox speciation will be stabilized by acidifying to a pH of 2 or
less with ultrapure (distilled) hydrochloric acid, then chilled on ice. Samples collected for organic carbon
and nutrient analysis will be chilled on ice during storage and transportation to the lab. Preservation of all
samples to be collected is summarized in Table 4. Samples will be processed inside a plastic tent set up on
a counter of the mobile laboratory to minimize atmospheric contamination during handling.
7.2 Bed Sediment Sampling Procedures
Sediment samples will be collected using either a coring device for deep-water sites or large plastic
spoons for shallow-water sites. Sediment cores will be collected in pre-washed, acid-cleaned 10.2-cm
diameter, acrylic butyrate core liners placed in a gravity corer. The gravity corer will be slowly lowered into
the sediment to avoid disturbance of the sediment-water interface. The cores will be kept upright and
carefully transported to a field-based laboratory. Shallow-water sampling will be carried out according to
USGS NAWQA protocols (Shelton and Capel, 1994). For samples for which it is determined that
extraction of pore waters will not be needed, samples will be screened with a nylon screen and river water
to exclude material greater than 63 µm.
7.2.1 Subsample requirements
Once a sample of the bed sediment has been collected, a variety of subsamples will be split and
Quality Assurance Project Plan, page 26
38 Metals Transport in the Sacramento River, California, 1996–97: Part 1. Methods and Data

processed before shipping to laboratories. Subsample requirements are listed in Table 5.
Table 5. Subsamples of bed sediment required for scheduled analyses
[EXAFS, extended X-ray absorption fine structure; NMWL, nominal molecular weight limit; Poly, polyethylene; USGS, U.S. Geological Survey; XRD, X-ray diffraction. mL, milliliter]
Matrix Analysis Preservation Bottle type, volume
Pore water Major/trace elements (cations) Acidify Poly, 125 mL
Major elements (anions) None Poly, 125 mL
Bed sediment Tract elements, sequential extractions Chill Poly, wide-mouth 100 mL
Sulfur speciation Chill Poly, wide-mouth 100 mL
XRD Chill Poly, wide-mouth 100 mL
EXAFS Chill Poly, wide-mouth 100 mL
Mössbauer spectroscopy Freeze-dry Poly, wide-mouth 100 mL
Particle size distribution (sieve, sedigraph) Chill Poly, wide-mouth 100 mL
Quality Assurance Project Plan, page 27
Appendix 1 139
1
7.2.2 Sample Processing and Preservation
Cores selected for pore water extraction will be sectioned for sediment and associated porewater
within 8 to 24 hours of collection. The water overlying the sediment will first be siphoned off to within 1 to
10 cm of the interface using Tygon tubing. A sample of this overlying water will then be taken with a 10- to
30-mL plastic syringe. The cores will be extruded and sectioned into appropriate depth intervals in a
nitrogen-filled glove bag, to minimize oxidation of the pore water. The individual core sections will then be
placed in nitrogen-filled 50-mL centrifuge tubes. Subsamples of whole sediment will also be taken for
determination of water content and grain-size distribution. The centrifuge tubes will be removed from the
glove box and centrifuged at 1500 rpm for 20 minutes to separate porewater and sediment. The tubes will
then be returned to the glove box and the supernatant extracted with pre-cleaned 2-mL plastic syringes and
filtered through 0.2-µm cartridge filters. Filtered portions will be placed into acid-cleaned 30-mL
polyethylene bottles for metal determinations. If there is sufficient volume, portions of pore water will also
be taken for alkalinity and anion determinations. The pore water, samples for metal analysis will be
acidified to pH < 2 with ultrapure, concentrated nitric acid. Sediment samples will be placed in acid
washed containers and packed in ice for transport to the analytical laboratories.
7.3 Equipment cleaning
The sample collecting and processing equipment is soaked in dilute phosphate-free detergent
solution, rinsed with tap water, soaked in 5.0 percent hydrochloric acid (HCl), and rinsed extensively with
deionized water prior to each field trip and between sites. Detergents and acids will be used with care to
avoid possible contamination of the sample by their residue. A thorough native-water rinse is required at
each field site before sampling to remove any remaining cleaning agents and equilibrate the equipment to
the sampling conditions. Details on procedures are outlined below.
The sampler bottle, cap and nozzle, cone splitter, churn splitter, filter support, pumphead,
Quality Assurance Project Plan, page 28
40 Metals Transport in the Sacramento River, California, 1996–97: Part 1. Methods and Data
tubing, and any other equipment that will contact the sample are cleaned prior to each field trip and
between sites as follows:
1. Disassemble (if necessary) wearing vinyl gloves.
2. Soak for 30 minutes in a 0.2-percent solution of phosphate-free detergent and scrub with a nonmetallic
brush. Use a small bottle brush for the cone-splitter parts.
3. Change gloves and rinse thoroughly with warm tap water to remove all soap residue.
4. Soak for 30 minutes in a solution of 5.0-percent hydrochloric acid. Swirling the equipment in the acid
solution will adequately desorb any metals not removed during the washing process. The used acid/
water solution should be placed in a waste container for proper disposal.
5. Change gloves and rinse three times with deionized water.
6. Protect areas of the equipment that will contact the sample with Teflon tape and place in a sealable plastic
bag for storage and transport.
7. Rinse sampling and splitting equipment at the site with 2- to 3-L of native water before sampling.
8. Rinse sampling and splitting equipment with deionized water immediately after each use.
Equipment used for filtering the organic-carbon samples will be baked at 450°C for 2 hours or cleaned
using organic-free deionized water and aggressive scrubbing. Equipment will be isolated from any
procedure using methanol.
8. Sample Custody
All bottles will be clearly labeled with a waterproof marker or preprinted labels so the laboratories
can identify the samples. The minimum information required is the project name, site identification
number, date and time, and type of analysis requested.
An analytical services request form with the same information as the bottle labels will be included
with each sample. Copies of the forms will be retained by data management personnel.
Quality Assurance Project Plan, page 29
Appendix 1 141
1
Samples will be shipped to laboratories by Federal Express overnight service from Sacramento or Redding,
California, within 24 hours of collection and processing. Laboratories will notify data management
personnel by electronic mail or standard mail service upon the arrival of samples.
9. Field Measurements
Specific conductance, dissolved oxygen, temperature, and pH, will be determined using the detailed
procedures in the NAWQA field guide (Shelton, 1994). Alkalinity will be determined by Gran titration
(Stumm and Morgan, 1981) using 0.16 N hydrochloric acid with a Hach digital titrator. Specific
conductance, pH, and alkalinity will be determined from a split of the unfiltered water sample. Dissolved
oxygen and temperature will be measured instream at the center of flow when feasible, otherwise from near
shore. Stream discharge will be determined at all river sites. Sites 4 through 7 are located at USGS gaging
stations and discharge will be estimated using current stage-discharge ratings from measurements of stage
at the time of sampling (Rantz and others, 1982). Discharge at site 3 (below Keswick Dam) will be
determined from BOR flow release records at Keswick Dam. Flow into the Spring Creek arm of Keswick
Reservoir will be determined from Spring Creek Reservoir and power plant release records.
10. Calibration Procedures and Frequency
All laboratory apparatuses (analytical balances, volumetric equipment, deionized water systems, etc.
are calibrated on at least an annual basis. Laboratory instruments (ICP–AES, ICP–MS, etc.) are
recalibrated with each batch of samples that are analyzed. Calibration standards are rerun (as samples) at a
10 percent frequency (l out of 10 samples analyzed) to check for instrument drift. If drift exceeds
predetermined limits (variable for instrument, element, and concentration level), the instrument is
recalibrated prior to analysis of additional samples.
Usually five, and a minimum of three calibration standards (matrix matched), are used to establish
calibration curves, bracketing the concentration range expected for the samples.
Quality Assurance Project Plan, page 30
42 Metals Transport in the Sacramento River, California, 1996–97: Part 1. Methods and Data
Field instruments (electrical conductance, pH, and dissolved oxygen) are calibrated prior to each
measurement following standard USGS procedures (Ward and Harr, 1990; Shelton 1994). Certified and
dated conductance and pH standards are supplied by the USGS National Water Quality Laboratory.
Dissolved oxygen meters are calibrated from the theoretical oxygen saturation of a humid atmosphere at
a given temperature and pressure.
Quality Assurance Project Plan, page 31
Appendix 1 143
1
11. Analytical Procedures
11.1 Concentration of dissolved major and trace elements:
The analytes are determined sequentially according to mass, on a single aliquot utilizing argon
plasma ionization, mass spectrometric separation, and electron multiplier detection. Each analysis is based
on the mean of three replicate determinations. Trace metals and major cations are analyzed using a Perkin
Elmer-Sciex, Model 5000, modified inductively coupled plasma–mass spectrometer (ICP–MS). Major
cations are analyzed using a Jarrell-Ash, Model 975, inductively coupled plasma–atomic emission
spectrometer (ICP–AES). Calibration is performed using a reagent blank and three multi-element
calibration standards. Linear regression analysis, through zero and based on 3 points, is employed to
generate the calibration equation. All standards and samples are blank subtracted to insure correction for
contamination as well as background correction. The methodology has been previously described (Taylor
and others, 1990; Taylor and Garbarino, 1991; Garbarino and Taylor, 1995). Mercury is analyzed by cold
vapor–atomic fluorescence spectroscopy using methods described by Roth (1994). Major anions will be
analyzed using an ion chromatograph calibrated with at least 3 standards.
11.2 Redox speciation of iron:
Iron redox species will be determined with a colorimetric method using ferrozine as the color
producing reagent (Stookey, 1970). For the determination of Fe(II), the 562-nm absorbance of the acidified
and buffered sample will be measured with a Perkin Elmer Model Lambda 3b UV/VIS spectrophotometer
equipped with 1-cm cells for the 10–40 µg range and 5-cm cells for the 2–10 µg range. For the
determination of total Fe, a hydroxylamine hydrochloride reductant will be added. Ferric iron will be
calculated from the difference between total Fe and Fe(II).
11.3 Sequential extractions of bed sediment and colloidal material:
Quality Assurance Project Plan, page 32
44 Metals Transport in the Sacramento River, California, 1996–97: Part 1. Methods and Data

Three individual extractions will be done to each bed-sediment or colloidal concentrate sample,
following the methods described by Hayes (1993). Hydroxylamine-HCl (0.25 M) will be used to
dissolve the inorganic fraction of exchangeable metal ions in the sample. Potassium persulfate (0.17M)
in 2 percent (volume/volume) sulfuric acid will be used to oxidize organic material. Dissolution of the
silicates and other refractory material will be done in strong acids (hydrofluoric, nitric, and hydrochloric
acids).
Each extraction will be analyzed by ICP–MS, ICP–AES, CV–AFS, and IC using methods
described above for the analysis of major and trace elements in water samples.
11.4 Analysis of sulfur speciation and mineralogy in colloid concentrates and bed sediment:
The forms of sulfur in colloidal concentrates and bed sediment is determined from the chemical
analysis of a series of extractions (Rice and others, 1993). An initial extraction with acetone is done to
remove elemental sulfur. This extraction is followed by treatment with hot 6 N HC to dissolve acid-
volatile sulfides (AVS, assumed to be monosulfides). The sulfide is purged from the sample with nitrogen
gas and precipitated as silver sulfide. The hot-acid-treated sample is then filtered and soluble inorganic
sulfates are determined by analyzing barium sulfate precipitated from the filtrate following the addition
of barium chloride. The retentate is again extracted with acetone to recover AVS oxidized to sulfur during
the acid treatment. Disulfide remaining in the retentate are determined following Cr2+ reduction/
distillation and precipitation as silver sulfide. Organically bound sulfur is determined from the residue of
the disulfide sulfur determination by using an Eschka fusion to form SO42– followed by precipitation as
barium sulfate. Modifications to the above procedure, such as the addition of stannous chloride to the hot
acid treatment, will be done to evaluate the effect of ferric iron (especially diagenetic ferric oxides) on
the recovery of acid-volatile sulfides. To evaluate the significance of any recovery of pyritic sulfur as
AVS, the analyses will be followed by determination of sulfur isotopy (δ34S-values) and mass-balance
calculations.
Quality Assurance Project Plan, page 33
Appendix 1 145
1
11.5 Mineralogy of colloidal material and bed sediment using X-ray diffraction
X-ray Diffraction (XRD) can provide a qualitative determination of the mineral phases present in the
sediment and the suspended sediments. The data will be collected on a Scintag Pad V Automated
Diffractometer, which is equipped with a scitillation detector and a graphite monochromator. Computer
control of data collection and of data processing will enhance mineral identification and characterization.
When concentration in a sample is less than approximately 5 percent or if the mineral is poorly crystalline,
the phase in question often must be concentrated by physical differences (density, shape, size, or magnetic
susceptibility) or by chemical means (chemical etching of specific phases usually called selective
extractions). This equipment is available in the USGS California District laboratory. Emphasis will be
placed on characterizing those mineral phases involved with metal transport.
11.6 Mineralogy using MÖssbauer spectroscopy:
Information from 57Fe MÖssbauer spectroscopy will be combined with X-ray diffraction techniques
to evaluate poorly crystallized minerals produced by the oxidation of sulfides. This has proven useful for
identification of iron bearing minerals of small particle size and low concentration. A 57Co source of λ-ray
is used to generate the MÖssbauer spectra which are characteristic of specific iron minerals.
11.7 Bonding of metals using EXAFS:
Extended X-ray Absorption Fine Structure (EXAFS) spectroscopy will be used to determine the
local molecular structure about the average Fe ion in poorly crystallized ferrihydrite polymers. EXAFS
spectra will be recorded in both transmission and fluorescence modes at the Stanford Synchrotron
Radiation Laboratory using methods described by Waychunas and others (1993).
Quality Assurance Project Plan, page 34
46 Metals Transport in the Sacramento River, California, 1996–97: Part 1. Methods and Data
11.8 Particle size distribution:
Particle size distributions of suspended sediment samples wet sieve and sedigraph methods.
Particle size distributions of colloidal material will be determined using light scattering spectrometry.
11.9 Lead-isotope methods:
An appropriate weight of sediment sample or colloid material is digested in 2M HCl + H2O2 to
provide a minimum amount of Pb for isotopic analysis (generally 50 ng or more). Digestions are done in
FEP Teflon ware under laminar flow conditions using ultra-pure reagents, as described by Church and
others (1993). Lead is separated in the bromide medium on Dowex 1x8 anion exchange using micro-
columns. Analysis of the lead is performed on a multi-collector mass spectrometer; precision for the
isotopic ratios is better than 1/1000. Analyses of blind duplicates, standards, and SRM 981 are used to
monitor reproducibility and correct for isotopic fractionation, as described by Church and others (1993).
Blanks are generally less than 1 ng for samples of this size. All analytical procedures and done under
chain-of-custody protocol, under the direction of Dr. Stan Church, who is Quality Assurance officer for
the lead isotope analyses.
12. Data Reduction, Validation, and Reporting
Data from field measurements will be entered in the USGS National Water Information Database
(NWIS) after each field run. Laboratory data will be transmitted to the USGS project leader on
laboratory analysis sheets from each participating laboratory and will include laboratory QA/QC data.
Data from all laboratories will be entered into a single spreadsheet database maintained in the USGS
Sacramento District office. QA/QC data will be reviewed as it is received and compared to the project
Quality Assurance Objectives. Data not meeting objectives will be flagged and included in a report
summarizing the activities and results of each sampling run.
Quality Assurance Project Plan, page 35
Appendix 1 147

1
13. Quality Control Checks
The purposes of QC samples are to ensure that reported data represent actual values and that the data
are reproducible and precise. The QC samples described below are used to evaluate field techniques,
equipment, and laboratory methods.
13.1 Laboratory Analysis
Laboratory analysis of major and trace elements in water samples, colloid concentrates, and bed-
sediment extracts will be done by the USGS lab in Boulder, Colorado (under the direction of Dr. Howard
Taylor). All sample determinations will be performed in triplicate, with the mean value of the triplicate
analysis being reported as the most probable value of concentration. Outliers are evaluated and rejected
when statistically valid.
Standard Reference Materials (National Institute of Standards, USGS, and other sources) similar in
composition (both matrix and analyte concentration) to the samples being analyzed, are processed and
analyzed at a frequency of at least 10 percent of the samples determined. Control charts are maintained to
assure that interference corrections (where necessary) or calibration procedures are within predetermined
specifications.
Laboratory blanks are used to evaluate bias from deionized water and laboratory reagents used
during the sample analysis.
When necessary and where appropriate, spike additions are made to samples, prior to analysis, to
evaluate spike recovery. This is particularly important when preconcentration matrix separation, or
speciation considerations are implemented.
All samples in a given batch are analyzed in random order to minimize errors associated with sample
composition.
Quality Assurance Project Plan, page 36
48 Metals Transport in the Sacramento River, California, 1996–97: Part 1. Methods and Data
Split samples for metals other than mercury will be sent periodically to both Dr. Howard Taylor’s
lab and the USGS National Water Quality Laboratory (NWQL) to evaluate any differences in the analytic
results from the two labs. The NAWQA program uses the NWQL for its routine inorganic chemical
analysis (Stanley and others, 1992), and comparison of the two labs is necessary to ensure comparability
between data sets created by the two projects. Splits of mercury samples will be sent to the USGS lab in
Madison, Wisconsin (under the direction of Dr. David Krabbenhoft). The Madison lab is also analyzing
mercury for the Sacramento NAWQA project.
13.2 Field procedures
Equipment blanks will be done prior to or during the first field run to ensure that contaminants are
not being introduced by any apparatus or procedure. During the sample collection phase of the project,
field blanks will be processed through each stage of sample collection and processing to evaluate
potential field contamination problems. Field blanks will be collected between samples at least once
during each field run to check the efficacy of equipment cleaning procedures between sites. Additional
field blanks will be collected at sites deemed critical to the successful completion of the study objectives.
Triplicate field samples will be collected at all locations at least once during the study to establish
field sampling and processing variance. The triplicate samples will be treated as separate unknowns as
they are submitted to the laboratories.
14. Performance and Systems Audits
All field personnel participate in the annual USGS National Field Quality Program. Reference
samples for pH, specific conductance, and alkalinity are analyzed with the equipment used in field
determinations. Satisfactory determinations are based on deviation from the most probable value
Quality Assurance Project Plan, page 37
Appendix 1 149

1
for each coded reference sample: pH, � 0.1 unit; specific conductance, �4%, and alkalinity, �1.5 standard
deviations.
15. Preventative Maintenance
Field meters and other equipment are inspected and tested before field runs and worn or defective
parts replaced. New batteries are installed at least annually or when meters have been inactive for an
unknown length of time. Backup meters, spare parts (electrodes, membranes, filling solutions, etc.), and
batteries are taken into the field for unscheduled replacement or repair.
16. Corrective Action
Corrective action will be taken before completion of any further field work if instrument malfunction
is observed. Corrective action will also be taken whenever data are determined to be outside acceptable
limits, as defined by the Quality Assurance Objectives.
Corrective action shall include reanalysis of samples after problems have been remedied. The
method of standard additions may be used if spike recoveries are found to be outside acceptable limits. Any
data not meeting Quality Assurance Objectives, but judged of potential usefulness, will be flagged and its
deficiencies with regard to quality criteria described.
17. Quality Assurance Reports to Management
Following the review of field and laboratory results from each sampling run, the USGS project
leader will compile a Quality Assurance Report summarizing the work completed, results of performance
evaluations, results of data quality assessments, significant problems and recommended solutions.
Summaries of this information will be included in quarterly project status reports.
Quality Assurance Project Plan, page 38
50 Metals Transport in the Sacramento River, California, 1996–97: Part 1. Methods and Data
18. References
Ball, J.W., and Nordstrom, D.K., 1991, User’s Manual for WATEQ4F, with revised thermodynamic data base and test cases for calculating speciation of major, trace, and redox. elements in natural waters: U.S. Geological Survey, Open-File Report 91-183, 189 p.
Capel, P.D., Nacionales, F.C., Larson, S.J., 1995, Precision of a splitting device for water samples: U.S. Geological Survey, Open-File Report 95-293, 6 p.
Chao, T.T., and Zhou, L., 1983, Extraction techniques for selective dissolution of amorphous iron oxides from soils and sediments: Soil Sci. Soc. Am. J., v. 47, p. 225–232.
Church, S.E., and others, 1993, Geochemical and lead-isotope data from stream and lake sediments, and cores from the Upper Arkansas River drainage: Effects of mining at Leadville Colorado on heavy-metal concentrations in the Arkansas River: U.S. Geological Survey, Open-File Report 93-534, 61 p.
Edwards, T.K., and Glysson, G.D., 1988, Field methods for measurement of fluvial sediment: U.S. Geological Survey Techniques of Water-Resources Investigations, Book 3, Chapter C2, U.S. Geological Survey, Open-File Report 86-531, 118 p.
Garbarino, J.R., and Taylor, H.E., 1995, Inductively coupled plasma-mass spectrometric method for the determination of dissolved trace elements in natural water: U.S. Geological Survey, Open-File Report 94-358, 88 p.
Hayes, H.C., 1993, Metal associations in suspended sediments and bed sediments from the Mississippi River: Golden, Colorado School of Mines, Department of Chemistry and Geochemistry, M.S. Thesis, 131 p.
Horowitz, A.J., Demas, C.R., Fitzgerald, K.K., Miller, T.L., and Rickert, D.A., 1994, U.S. Geological Survey protocol for the collection and processing of surface-water samples for the subsequent determination of inorganic constituents in filtered water: U.S. Geological Survey, Open-File Report 94-539, 59 p.
Murad, E., Schwertmann, U., Bigham, J.M., and Carlson, L., 1994, Mineralogical characteristics of poorly crystallized precipitates formed by oxidation of Fe2+ in acid sulfate waters; in Alpers, C.N., and Blowes, D.W., editors, Environmental Geochemistry of Sulfide Oxidation, Washington, D.C., American Chem. Soc., Symposium Series v. 550, p. 190–200.
Rantz, S.E., and others, 1982, Measurement and computation of streamflow: Volume 1. Measurement of stage and discharge and volume 2. Computation of discharge: U.S. Geological Survey, Water-Supply Paper 2175, 631 p.
Rice, C.A., Tuttle, M.L., and Reynolds, R.L., 1993, The analysis of forms of sulfur in ancient sediments and sedimentary rocks: comments and cautions: Chemical Geology, v. 107, p. 83–95.
Quality Assurance Project Plan, page 39
Appendix 1 151
1
Roth, D.A., 1994, Ultratrace analysis of mercury and its distribution in some natural waters of the United States: Fort Collins, Colorado State University, Department of Chemistry, PhD. thesis, 309 p.
Shelton, L.R., 1994, Field guide for collecting and processing stream-water samples for the National Water Quality Assessment Program: U.S. Geological Survey, Open-File Report 94-455, 42 p.
Shelton, L.R., and Capel, P.D., 1994, Guidelines for collecting and processing samples of stream bed sediment for analysis of trace elements and organic constituents for the National Water Quality Assessment Program U.S. Geological Survey, Open-File Report 94-458, 20 p.
Stanley, D.L., Shampine, W.J., and Schroder, L.J., 1992, Summary of the U.S. Geological Survey National Field Water Quality Assurance Program from 1979 through 1989: U.S. Geological Survey, Open-File Report 92-163, 14 p.
Stookey, L.J., 1970, Ferrozine - A new spectrophotometric reagent for iron: Analytical Chemistry, v. 42, p. 779–781.
Stumm, W., and Morgan, J.J., 1981, Aquatic Chemistry: John Wiley & Sons, New York, 780 p.
Taylor, H.E., and Garbarino, J.R., 1991, The measurement of trace metals in water resource—monitoring samples by inductively coupled plasma-mass spectrometry: Spectrochimica Acta Rev., Vol. 14, Nos. 1-2, p. 33–43.
Taylor, H.E., Garbarino, J.R., and Brinton, T.I., 1990, The occurrence and distribution of trace metals in the Mississippi River and its tributaries: The Science of the Total Environment, Elsevier Science Publishers, p. 369–384.
Ward, J.R., Harr, C.A., editors, 1990, Methods for collection and processing of surface-water and bed-material samples for physical and chemical analyses: U.S. Geological Survey, Open-File Report 90-140, 71 p.
Waychunas, G.A., Rea, B.A., Fuller, C.C., and Davis, J.A., 1993, Surface chemistry of ferrihydrite: Part 1. EXAFS studies of the geometry of coprecipitated and adsorbed arsenate: Geochimica et Cosmochimica Acta, v. 57, p. 2251–2269.
Quality Assurance Project Plan, page 40
52 Metals Transport in the Sacramento River, California, 1996–97: Part 1. Methods and Data