quality, customized graph production using sas gtl€¦ · walter hufford, novartis phuse sde,...
TRANSCRIPT

Walter Hufford, Novartis PHUSE SDE, August 20, 2015
Quality, customized graph production using SAS GTL

Quality, customized graph production using SAS GTL
Quality, customized graph production | Walter Hufford | August 20, 2015 | PHUSE SDE 2
(Unfair) History of Graph Production
The Period Before GTL
Old SAS Graph
Technology
Presentation Quality Re-production

Quality, customized graph production using SAS GTL
Quality, customized graph production | Walter Hufford | August 20, 2015 | PHUSE SDE 3
(Unfair) History of Graph Production
The Dawn of a New Era - GTL
GTL Restoring our status

Quality, customized graph production using SAS GTL
Quality, customized graph production | Walter Hufford | August 20, 2015 | PHUSE SDE 4
Basic concepts – GTL Code
§ Statistical Graphics (SG) procedures such as SGPLOT and SGPANEL use GTL code • Easy to use and capable of producing presentation quality graphs
§ Use GTL code directly when customization beyond standard SG procedure layout is desired • GTL’s structured syntax facilitates an easy-to-use, building-block approach
to graphic design
GTL
SG Procedure GTL
Quality, customized graph production using SAS GTL
Quality, customized graph production | Walter Hufford | August 20, 2015 | PHUSE SDE 5
Basic concepts - Templates
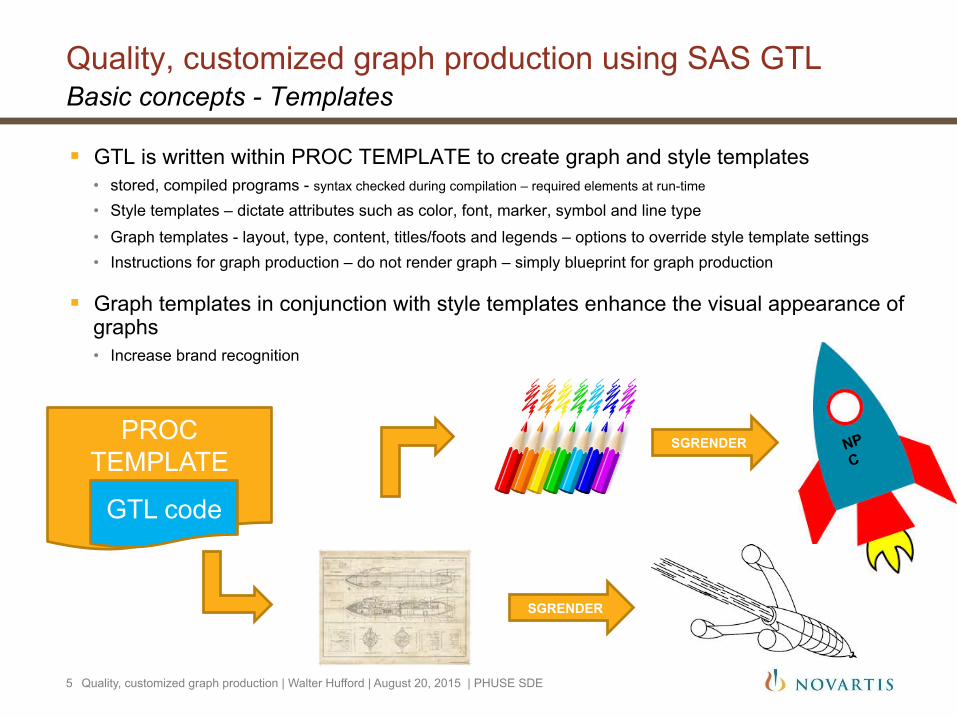
§ GTL is written within PROC TEMPLATE to create graph and style templates • stored, compiled programs - syntax checked during compilation – required elements at run-time
• Style templates – dictate attributes such as color, font, marker, symbol and line type
• Graph templates - layout, type, content, titles/foots and legends – options to override style template settings • Instructions for graph production – do not render graph – simply blueprint for graph production
§ Graph templates in conjunction with style templates enhance the visual appearance of graphs • Increase brand recognition
SGRENDER PROC TEMPLATE
GTL code
SGRENDER

Quality, customized graph production | Walter Hufford | August 20, 2015 | PHUSE SDE 6
Basic Concepts – Overview of the Style Template Quality, customized graph production using SAS GTL
SuperDrug 10 mg SuperDrug 20 mg SuperDrug 30 mg Placebo
trtseq
0
10
20
30
40
aval
Phuse Single-‐Day E vent E xample
call symputx(“fill_color_"||LEFT(_N_),put(trt,$colorhex.)) ;
...
proc template ;
define style linecolors ;
parent=rtf_temp ;
%do i = 1 %to 4 ;
style GraphData&i. from GraphData&i./ FILLpattern="&&fill_pattern_&i." color=#&&fill_color_&i. ;
%end ;
end;
run;
ods rtf style=linecolors file="/view/huffowa1_view/vob/report/pgm_saf/Phuse_intro_example.rtf" ;
SAS RTF style template Enhanced RTF style template with customized bar colors & fill patterns
Identifies an existing style template to modify
Used in conjunction with plot statement GROUP= and INDEX= options
Associates style template with newly created graph
Identifies new style template to create
§ TEMPLATE procedure - style & graph templates
§ Choose a parent that covers most attributes – modify only those needing updates
§ BARCHART example contains grouped data (4 treatment groups) - GraphDataN is used to assign consistent group-level attributes to all graphs using the style template • all 30 mg bars green
§ Class GraphDataDefault statement for global attributes • all markers starfilled
Produced with same graph template
4 treatment groups – GraphData1-GraphData4

Quality, customized graph production | Walter Hufford | August 20, 2015 | PHUSE SDE 7
Basic Concepts – Graph Template and Rendering the Graph Quality, customized graph production using SAS GTL
proc template ;
define statgraph graph.plot ;
begingraph ;
entrytitle 'Phuse Single-Day Event Example' ;
layout overlay ;
barchart x=trtseq y=aval /group=trtseq index=trtn ;
endlayout ;
endgraph ;
end ;
run ;
proc sgrender data=adeff template=graph.plot ;
where paramn=1 and byvar1=1 ;
run ;
data _null_ ;
set adeff ;
where paramn=1 and byvar1=1 ;
file print ods=(template='graph.plot') ;
put _ods_ ;
run ;
Identifies name of new graph template
Signals begin/end of graph block
Within graph block create layout blocks
2 ways to render a graph
Advantage: data step code
Single-cell, data driven (e.g., DATAPANEL/DATALATTICE) or really creative
Phuse Single-‐Day E vent E xample
0
200
400
600
Count
0.0
2.5
5.0
7.5
10.0
12.5
15.0
Percent
16 32 48 64 80 96 112 128 144 160 176 192 208 224
AVA L
PLOT statements within layout blocks

Quality, customized graph production using SAS GTL
Quality, customized graph production | Walter Hufford | August 20, 2015 | PHUSE SDE 8
Basic concepts - GTL Syntax
§ GTL has too many statements/options to cover in a single 20 minute presentation
§ Practical example graph • Develop code required to produce example • Adopt a building-block approach • Along the way describe most of the GTL code
concepts required to get you started • A basic reusable macro – good starting point
§ Example graph specifications • BARCHART • Display 3 key endpoint by gender • User option for DATALATTICE or DATAPANEL layout • Pre-defined compound-level attributes (e.g., bar colors
and patterns) • User option to display p-val significance indicator
above bar (star and same color as bar) • Display legend

Quality, customized graph production | Walter Hufford | August 20, 2015 | PHUSE SDE 9
Basic Concepts – Full Required Code Quality, customized graph production using SAS GTL
%macro BARCHART(tsize=, st=, p_val=,skin=) ; proc template ; define statgraph graph.plot ; dynamic tcolor ; mvar st skin ; nmvar tsize ; begingraph ; entrytitle "Phuse Single-Day Event" {SUP {unicode "03B1"x}} / TEXTattrs=(color=tcolor weight=bold size=TSIZE); entrytitle "Example #1" / textattrs=(color=tcolor weight=bold size=16 style=italic); layout &st. / headerlabeldisplay=value headerlabelattrs=(color=blue weight=bold) rows=2 columns=3 COLUMNgutter=5 ROWgutter=5 COLUMNaxisopts=(display=none type=discrete) ROWaxisopts=(griddisplay=on label="Mean Value" LABELattrs=(weight=bold size=12) display=(line ticks tickvalues label) TICKvalueattrs=(weight=bold)) ; layout prototype ; barchart x=trtseq y=aval /group=trtseq index=trtn name='bar' dataskin=skin display=(fill fillpattern outline) FILLpatternattrs=(color=black) ;
%if &p_val. = Y %then scatterplot x=trtseq y=pval / group=trtseq index=trtn MARKERattrs=(symbol=starfilled) ; ; endlayout ; sidebar / align=bottom ; discretelegend 'bar' / border=false across=2 title="Treatment Groups" TITLEattrs=GraphValueText(weight=bold size=14) VALUEattrs=(size=10) ; endsidebar ; endlayout ; entryfootnote halign=left{SUP{unicode "03B1"x}} "Novartis, East Hanover, N.J." halign=right "August 20, 2015" / TEXTattrs=(color=CX00008B size=10) ; endgraph ; end ; run ; ods rtf style=linecolors file="/view/huffowa1_view/vob/CAIN457F/pool/pool_003/report/pgm_saf/Phuse_example_%scan(&st.,1).rtf" ; proc sgrender data=adeff template=graph.plot ; dynamic tcolor='blue' ; run ; ods rtf close ; %mend ; %BARCHART(tsize=24, st=%str(datalattice columnvar=param rowvar=sex),p_val=Y,skin=sheen) ;
Surprisingly little code required
Break-down example graph into blocks and start from smallest building block
Where do we start ?
However, nothing like DATASTEP code syntax

Quality, customized graph production | Walter Hufford | August 20, 2015 | PHUSE SDE 10
Basic Concepts – Building-blocks Quality, customized graph production using SAS GTL
proc template ; define statgraph graph.plot ; begingraph ; entrytitle "Phuse Single-Day Event" {SUP {unicode "03B1"x}} / TEXTattrs=(color=blue weight=bold size=24); entrytitle "Example #1" / textattrs=(color=blue weight=bold size=16 style=italic); layout overlay ; barchart x=trtseq y=aval /group=trtseq index=trtn name='bar' dataskin=sheen display=(fill fillpattern outline) FILLpatternattrs=(color=black) ; endlayout ; entryfootnote halign=left{SUP{unicode "03B1"x}} "Novartis, East Hanover, N.J." halign=right "August 20, 2015" / TEXTattrs=(color=CX00008B size=10) ; endgraph ; end ; run ;
Step #1 - build the basic BARCHART
§ PROC TEMPLATE to produce the graph template • DEFINE statement to identify new graph template • BEGINGRAPH statement defines the graph code block
• TITLES/FOOTNOTES created with the ENTRYTITLE / ENTRYFOOTNOTE - May have more than one of each - TEXTATTRS option define text attributes such as color and boldness - May contain SAS functions - May specify colors in different ways – plain English and hexadecimal allowed
• LAYOUT OVERLAY defines the layout code block • BARCHART statement defines the graph type
- GROUP= identifies grouping variable to receive GraphDataN attributes from our style template – assignment based on sort order of data
- INDEX= identifies a numeric variable used to map groups to each GraphDataN – making data sort order irrelevant

Quality, customized graph production | Walter Hufford | August 20, 2015 | PHUSE SDE 11
Basic Concepts – Building-blocks Quality, customized graph production using SAS GTL
proc template ; define statgraph graph.plot ; begingraph ; entrytitle "Phuse Single-Day Event" {SUP {unicode "03B1"x}} / TEXTattrs=(color=blue weight=bold size=24); entrytitle "Example #1" / textattrs=(color=blue weight=bold size=16 style=italic); layout datalattice columnvar=param rowvar=sex / headerlabeldisplay=value headerlabelattrs=(color=blue weight=bold) rows=2 columns=3 COLUMNgutter=5 ROWgutter=5 COLUMNaxisopts=(display=none type=discrete) ROWaxisopts=(griddisplay=on label="Mean Value" LABELattrs=(weight=bold size=12) display=(line ticks tickvalues label) TICKvalueattrs=(weight=bold)) ; layout prototype ; barchart x=trtseq y=aval /group=trtseq index=trtn dataskin=sheen display=(fill fillpattern outline) FILLpatternattrs=(color=black) ; endlayout ; endlayout ; entryfootnote halign=left{SUP{unicode "03B1"x}} "Novartis, East Hanover, N.J." halign=right "August 20, 2015" / TEXTattrs=(color=CX00008B size=10) ; endgraph ; end ; run ;
Add a DATALATICE layout – 1 row and 1 column CLASS var
§ Replace LAYOUT OVERLAY with LAYOUT PROTOTYPE
§ Surround the LAYOUT PROTOTYPE containing the BARCHART with a LAYOUT DATTALICE code block • Define CLASS variables and # of row/column cells • Define gutter widths • Define row and column header label attributes • Define row and column axis attributes such as labels, grid
lines, tick options

Quality, customized graph production | Walter Hufford | August 20, 2015 | PHUSE SDE 12
Basic Concepts – Building-blocks Quality, customized graph production using SAS GTL
proc template ; define statgraph graph.plot ; begingraph ; entrytitle "Phuse Single-Day Event" {SUP {unicode "03B1"x}} / TEXTattrs=(color=blue weight=bold size=24); entrytitle "Example #1" / textattrs=(color=blue weight=bold size=16 style=italic); layout datalattice columnvar=param rowvar=sex / headerlabeldisplay=value headerlabelattrs=(color=blue weight=bold) rows=2 columns=3 COLUMNgutter=5 ROWgutter=5 COLUMNaxisopts=(display=none type=discrete) ROWaxisopts=(griddisplay=on label="Mean Value" LABELattrs=(weight=bold size=12) display=(line ticks tickvalues label) TICKvalueattrs=(weight=bold)) ; layout prototype ; barchart x=trtseq y=aval /group=trtseq index=trtn name='bar' dataskin=sheen display=(fill fillpattern outline) FILLpatternattrs=(color=black) ; endlayout ; sidebar / align=bottom ; discretelegend 'bar' / border=false across=2 title="Treatment Groups" TITLEattrs=GraphValueText(weight=bold size=14) VALUEattrs=(size=10) ; endsidebar ; endlayout ; entryfootnote halign=left{SUP{unicode "03B1"x}} "Novartis, East Hanover, N.J." halign=right "August 20, 2015" / TEXTattrs=(color=CX00008B size=10) ; endgraph ; end ; run ;
Add a LEGEND
§ SIDEBAR code block – closed with an ENDSIDEBAR • ALIGN option is used for LEGEND placement
§ DISCRETELEGEND statement • Type – discrete or continuous • Identifies PLOT to provide LEGEND for (e.g., name=‘bar’) • Across statement – display 2 legend items east-west
• Title and text attributes

Quality, customized graph production | Walter Hufford | August 20, 2015 | PHUSE SDE 13
Basic Concepts – Building-blocks Quality, customized graph production using SAS GTL
proc template ; define statgraph graph.plot ; begingraph ; entrytitle "Phuse Single-Day Event" {SUP {unicode "03B1"x}} / TEXTattrs=(color=blue weight=bold size=24); entrytitle "Example #1" / textattrs=(color=blue weight=bold size=16 style=italic); layout datalattice columnvar=param rowvar=sex / headerlabeldisplay=value headerlabelattrs=(color=blue weight=bold) rows=2 columns=3 COLUMNgutter=5 ROWgutter=5 COLUMNaxisopts=(display=none type=discrete) ROWaxisopts=(griddisplay=on label="Mean Value" LABELattrs=(weight=bold size=12) display=(line ticks tickvalues label) TICKvalueattrs=(weight=bold)) ; layout prototype ; barchart x=trtseq y=aval /group=trtseq index=trtn name='bar' dataskin=sheen display=(fill fillpattern outline) FILLpatternattrs=(color=black) ; scatterplot x=trtseq y=pval / group=trtseq index=trtn MARKERattrs=(symbol=starfilled) ; endlayout ; sidebar / align=bottom ; discretelegend 'bar' / border=false across=2 title="Treatment Groups" TITLEattrs=GraphValueText(weight=bold size=14) VALUEattrs=(size=10) ; endsidebar ; endlayout ; entryfootnote halign=left{SUP{unicode "03B1"x}} "Novartis, East Hanover, N.J." halign=right "August 20, 2015" / TEXTattrs=(color=CX00008B size=10) ; endgraph ; end ; run ;
Add p-vals
§ SCATTERPLOT statement following BARCHART in LAYOUT PROTOTYE code block - order does not matter • X and Y variables – checked for existence at run-time
• GROUP= and INDEX= options – use style template attribute assignments for each treatment group regardless of sort order
• MARKERATTRS option used to assign star to p-vals

Quality, customized graph production | Walter Hufford | August 20, 2015 | PHUSE SDE 14
Basic Concepts – Building-blocks Quality, customized graph production using SAS GTL
%macro BARCHART(tsize=, st=, p_val=,skin=) ; proc template ; define statgraph graph.plot ; dynamic tcolor ; mvar st skin ; nmvar tsize ; begingraph ; layout &st. / headerlabeldisplay=value headerlabelattrs=(color=tcolor weight=bold) rows=2 columns=3 COLUMNgutter=5 ROWgutter=5 COLUMNaxisopts=(display=none type=discrete) ROWaxisopts=(griddisplay=on label="Mean Value" LABELattrs=(weight=bold size=12) display=(line ticks tickvalues label) TICKvalueattrs=(weight=bold)) ; layout prototype ; barchart x=trtseq y=aval /group=trtseq index=trtn name='bar' dataskin=skin display=(fill fillpattern outline) FILLpatternattrs=(color=black) ; %if &p_val. = Y %then scatterplot x=trtseq y=pval / group=trtseq index=trtn MARKERattrs=(symbol=starfilled) ; ; endlayout ; endlayout ; endgraph ; end ; run ; ods rtf style=linecolors file="/view/huffowa1_view/vob/CAIN457F/pool/pool_003/report/pgm_saf/Phuse_main_Step_5_%scan(&st.,1).rtf" ; proc sgrender data=adeff template=graph.plot ; dynamic tcolor='blue' ; run ; ods rtf close ; %mend ; %BARCHART(tsize=24, st=%str(datalattice columnvar=param rowvar=sex),p_val=Y,skin=sheen) ; %BARCHART(tsize=24, st=%str(datapanel classvars=%(param sex%)),p_val=Y,skin=pressed) ;
Genericize TEMPLATE - DYNAMIC and MACRO variables
§ Initialization main difference (SGRENDER, FILE PRINT, %LET)
§ Macro var resolution - compile time (&) - run time (no &)
§ Conditional logic - GTL IF, ELSEIF, ELSE, ENDIF statements
Code note: ENTRYTITLE, ENTRYFOOT and SIDEBAR removed for space
Numeric values are not quoted
Identifies DYNAMIC variables Identifies text and numeric MACRO variables
Also %LET, CALL SYMPUT
IF (pvl=1) layout prototype ; barchart x=trtseq y=aval /group=trtseq index=trtn name='bar' dataskin=skin display=(fill fillpattern outline) FILLpatternattrs=(color=black) ; scatterplot x=trtseq y=pval / group=trtseq index=trtn MARKERattrs=(symbol=starfilled) ; endlayout ; ELSE layout prototype ; barchart x=trtseq y=aval /group=trtseq index=trtn name='bar' dataskin=skin display=(fill fillpattern outline) FILLpatternattrs=(color=black) ; endlayout ; ENDIF ;
Dynamic PVL variable

Quality, customized graph production | Walter Hufford | August 20, 2015 | PHUSE SDE 15
Building-block approach – more examples – same concept! Quality, customized graph production using SAS GTL
Phuse Single-‐Day E vent E xample
0
200
400
600
Count
0.0
2.5
5.0
7.5
10.0
12.5
15.0
Percent
16 32 48 64 80 96 112 128 144 160 176 192 208 224
AVA L
αNovartis, East Hanover, N.J. A ugust 20, 2015
Phuse Single-‐Day E ventα
0.590
0.464
0.394
0.328
0.096
0.201
0.076
3.634
1.074
2.055
OR L C L UC L
0.01 0.1 1 10 100
Favors T reatment Favors Placebo
Study Odds Ratio and 95% CL
SuperDrug 10 mg
SuperDrug 20 mg
SuperDrug 30 mg
Overall
Forest Plot • 3 layout overlays - 1 for each
column • High-low plot • High-low plot and scatterplot • 3 scatter plots
• All sandwiched within a 3 column lattice layout
Distribution Plot • 2 layout overlays – 1 for top cell and 1
for bottom cell • 2 histograms and 1 density plot • 1 boxplot
• All sandwiched within a two-row lattice layout

Quality, customized graph production | Walter Hufford | August 20, 2015 | PHUSE SDE 16
Annotate Facility Quality, customized graph production using SAS GTL
αNovartis, East Hanover, N.J. A ugust 20, 2015
Phuse Single-‐Day E ventα
0.590
0.464
0.394
0.328
0.096
0.201
0.076
3.634
1.074
2.055
OR L C L UC L
0.01 0.1 1 10 100
Favors T reatment Favors Placebo
Study Odds Ratio and 95% CL
SuperDrug 10 mg
SuperDrug 20 mg
SuperDrug 30 mg
Overall
αNovartis, East Hanover, N.J. A ugust 20, 2015
Phuse Single-‐Day E ventα
0.590
0.464
0.394
0.328
0.096
0.201
0.076
3.634
1.074
2.055
OR L C L UC L
0.01 0.1 1 10 100
Favors T reatment Favors Placebo
Study Odds Ratio and 95% CL
SuperDrug 10 mg
SuperDrug 20 mg
SuperDrug 30 mg
Overall
ANNOTATE facility is available in GTL
§ Create an ANNOTATE dataset • 2 observations – 1 for each arrow • ID variable used to identify annotations • Function=“arrow”
• Direction=“in/out”
§ Add ANNOTATE statement with ID= option to graph template
§ Add SGANNO=option to SGRENDER

§ GTL is a large, complex code base • many statements and options available – you don’t need to know them all –
start small – adopt building block approach • Most statements / options quite different from typical DATA step syntax • Most options are very similar across statements (e.g., TEXTAttrs, ...) • PLOT and LAYOUT statements have different syntax
§ Master a few simple concepts and set-up a basic code template you can easily produce presentation quality, custom graphs
Quality, customized graph production | Walter Hufford | August 20, 2015 | PHUSE SDE 17
Conclusion Quality, customized graph production using SAS GTL