quality improvement of a community- based childhood
TRANSCRIPT

Quality Improvement of a Community-Based Childhood Nutrition
Program in Rural GuatemalaThe Harvard community has made this
article openly available. Please share howthis access benefits you. Your story matters
Citation Goldberg, Vera J. 2017. Quality Improvement of a Community-Based Childhood Nutrition Program in Rural Guatemala. Doctoraldissertation, Harvard Medical School.
Citable link http://nrs.harvard.edu/urn-3:HUL.InstRepos:40621363
Terms of Use This article was downloaded from Harvard University’s DASHrepository, and is made available under the terms and conditionsapplicable to Other Posted Material, as set forth at http://nrs.harvard.edu/urn-3:HUL.InstRepos:dash.current.terms-of-use#LAA

1
Scholarly Report submitted in partial fulfillment of the MD Degree at Harvard Medical
School
Date: 20 April 2017
Student Name: Vera J. Goldberg, BA
Scholarly Report Title: Quality Improvement of a Community-based Childhood Nutrition
Program in Rural Guatemala
Mentor Name(s) and Affiliations: Peter J. Rohloff, MD, PhD, Division of Global Health
Equity, Brigham and Women’s Hospital, Wuqu’ Kawoq | Maya Health Alliance, Guatemala
Collaborators, with Affiliations: Andrea Guzman, Licensed Nutritionist, Wuqu’ Kawoq | Maya
Health Alliance, Guatemala

2
Abstract
TITLE: Quality Improvement of a Community-based Childhood Nutrition Program in Rural
Guatemala
Vera Goldberg, Andrea Guzman, Peter Rohloff.
Purpose: Various organizations have made efforts to reduce chronic malnutrition in children
under 5 years old in Guatemala but have had limited success. Quality improvement endeavors
have the potential to maximize a program’s impact in resource-limited settings. We describe our
experience implementing quality improvement (QI) of our childhood nutrition program in rural
Guatemala. Our principal aim was to reduce the prevalence of chronic malnutrition in children
under 5 years old by 15% each year in the communities served.
Methods: Direct observation of nutrition programming and meetings with key staff were used to
inform our QI efforts. We established, tracked, and presented to staff monthly quality metrics,
including the percent of children receiving growth monitoring, micronutrient supplementation,
and deworming medication. We measured average height-for-age Z (HAZ) score, a proxy of
chronic malnutrition, as well as the percentage of children with stunting in each community. We
used run chart analysis to assess for improvement.
Results: Our QI efforts addressed four key drivers for mitigating stunting in Guatemalan children
under 5 years old: (1) food security, (2) environmental health, (3) provision of health services, and
(4) empowerment and education of caregivers. Incorporating elements of standards-based
management and recognition as well as implementation science, our QI interventions included
re-training staff, continued nutrition education, hiring a full-time licensed nutritionist, revision of
educational instruments, checklists and algorithms to guide data interpretation and reinforce
nutrition protocols, and constructive individualized feedback. The percentage of children who
had growth monitoring per the protocol markedly improved. Administration of micronutrient
supplementation and deworming medication was poorly documented. There was minimal
improvement in average HAZ score and the stunting prevalence in children under 5 years old
from February 2016 to February 2017.
Conclusions: The process outcome of growth monitoring coverage improved, but we still need
to streamline our documentation system. Minimal improvement in average HAZ scores and
stunting prevalence could be secondary to confounding factors, such as the overrepresentation of

3
children enrolled in the recuperative program in our calculations, expansion of our program to
include more severely stunted children, climate change, and crop failure. More sophisticated
control chart analysis is warranted to further explore if our quality improvement interventions
impacted the severity and prevalence of stunting.

4
Table of Contents
Section 1: Introduction …………………………………………………………………...6-7
Section 2: Student role………………………………………………………………………7
Section 3: Methods……………………………………………………………………....8-13
Section 4: Results………………………………………………………………………13-25
Section 5: Discussion, Limitations, Conclusions, and Suggestions for Future Work …25-32
Section 6: Acknowledgements……………………………………………………….........33
References………………………………………………………………………………34-36
Appendices……………………………………………………………………………...37-47

5
Glossary of abbreviations
EBCD: experience-based co-design
EMRS: electronic medical record system
HAZ score: height-for-age Z score
IS: implementation science
MNP: micronutrient powder
NGO: non-governmental organization
PDSA: Plan-Do-Study-Act
QI: quality improvement
RUSF: ready-to-use supplementary food
SBM-R: standards-based management and recognition
WAZ: weight-for-age Z score
WHZ: weight-for-height Z score
WK: Wuqu’ Kawoq | Maya Health Alliance

6
Section 1: Introduction
Chronic malnutrition impacts 46.5 percent of children younger than five years of age in
Guatemala [1], which has the highest prevalence of chronic malnutrition of any country in the
Americas and the fourth highest in the world [2]. Guatemala ranks among countries with the
highest degree of inequality worldwide [3], and indigenous Guatemalan children
disproportionately face chronic malnutrition with a prevalence of almost 60 percent1 [1]. Chronic
malnutrition also disproportionately impacts children of mothers without education (67.0%) and
children from the lowest income quintile (65.9%) [1]. Despite multiple efforts by the government
and non-governmental organizations to reduce the prevalence of childhood chronic malnutrition
in Guatemala, it has only decreased 1.5% since 2009 [4]. Since 2007, Wuqu’ Kawoq | Maya
Health Alliance (WK), a nonprofit organization, has worked to prevent and treat acute and
chronic malnutrition in children from rural, indigenous communities in Guatemala. WK’s efforts
to combat malnutrition have been modified to include more intensive nutrition education and
food supplementation based on quantitative as well as ethnographic research in communities
served, and the organization has expanded to serve more communities. At the end of 2015, WK
initiated a formal quality improvement project.
Quality improvement (QI) in global health work is an emerging and important field with
the potential to maximize the impact of scarce resources, provide better outcomes, and promote
increased funding for healthcare in developing countries [5]. QI is now considered a competency
in the education of health professionals [6]. The standards-based management and recognition
(SBM-R) methodology of quality improvement, designed to address barriers in resource-limited
settings, starts with evidence-based standardization of care and establishing targets for
compliance, usually of 80% or better, with the standards of care. Once standards are
implemented, gaps are then identified and addressed [7]. SBM-R emphasizes creating a culture
of quality improvement rather than isolated interventions and incorporates evidence-based
methods such as checklists, auditing, and feedback to detect areas needing additional
improvement and support [7]. Implementation science (IS) can complement quality improvement
by providing a methodology for understanding and addressing challenges encountered when
1 58.0% when mother’s ethnicity self-identified, 61.2% when ethnicity by “traditional concept”

7
attempting to carry out QI interventions [8, 9]. Implementation outcome variables include
acceptability, adoption, appropriateness, feasibility, fidelity, cost, coverage, and sustainability
[9]. Fidelity refers to the extent to which an intervention is executed as planned and includes the
quality of delivery, adherence, dose, and participant responsiveness [10]. Implementation
strategies are tools used to promote adoption of interventions and can include audits, checklists,
and staff education [9]. We used elements of SBM-R and IS to establish standards as well as
implement, assess, and make iterative modifications to a QI initiative aiming to strengthen the
quality and impact of our nutrition program. Our primary aim was to reduce chronic malnutrition
in children younger than 5 years of age in the communities served. Specifically, we set the goal
to improve the average height for age Z score of children under 5 years old by 15% each year
and reduce the prevalence of children with chronic malnutrition by 15% each year.
Section 2: Student role
I actively worked on this quality improvement project on the ground in Guatemala from October
2015 to May 2016. After observing nutrition technicians in the field and obtaining input from
Wuqu’ Kawoq’s Chief Medical Officer and the project mentor (Dr. Peter Rohloff), the Executive
Director (Anne Kraemer Díaz), and the Medical Director (Dr. Waleska Lopez), I compiled a
comprehensive nutrition manual. I co-organized and co-lead the training to standardize and
improve nutrition programming and protocols in January 2016 as well as monthly meetings with
nutrition staff to review data, provide additional training, and improve programming. I
contributed to the determination of quality metrics as well as the design and implementation of
improvement efforts. I frequently solicited and gathered feedback from staff to improve nutrition
instruments. I prepared data for February and March 2016. April 2016 data was prepared jointly
with the Nutrition Director, licensed nutritionist Andrea Guzman, who I helped onboard in
March. Since May 2016, the Nutrition Director has prepared data, lead the monthly meetings,
and spearheaded all quality improvement efforts. I prepared the run charts and analysis in this
report.

8
Section 3: Methods
Context
The non-profit organization, Wuqu’ Kawoq | Maya Health Alliance, has provided free healthcare
services in rural indigenous areas of Guatemala since 2007. WK’s mixed-methods research has
informed its programmatic efforts. While most communities served by WK primarily rely on
agricultural production for income generation, food insecurity is paradoxically common [11]. As
nontraditional agricultural exports have replaced subsistence crops, access to nutritionally
diverse foods has declined [11]. Further, income varies with the season resulting in food
insecurity and the need to borrow money during the “off-season” [12]. Meanwhile, processed,
junk food is readily available in small local stores [11, 12]. Although wasting (acute child
malnutrition) is relatively uncommon and stunting (chronic malnutrition) is very common in
Guatemala, focus group discussions and key informant interviews suggest that caregivers,
community leaders, and NGO staff had awareness about acute malnutrition but poor awareness
and understanding of chronic malnutrition [12], which is so prevalent in some communities that
it has become normalized [13]. Dietary recalls conducted with 102 caregivers of children 6-36
months of age in two rural indigenous Maya communities showed inadequate dietary diversity
and meal frequency. Few children from 6 to 23 months of age (3% in one community and 22% in
the other community) meet the requirements for a minimum acceptable diet, defined as a
composite of minimum dietary diversity and minimum meal frequency. In one community, a
follow-up study of a random sample of 68 surveyed households showed that 100% of households
experienced food insecurity, with 51% reporting severe food insecurity, and seven-day dietary
recall of children 6 to 36 months of age suggested poor dietary diversity with deficiencies in
vitamin-A rich foods, eggs, flesh foods, and dairy [11]. In Guatemala, when an infant begins
complementary feeding, the caregiver often starts by giving the infant a gruel, which is usually
prepared too diluted and mixed with a lot of sugar, and thus will fill the child’s stomach but has
little nutritive value [12]. Structured surveys, focus group discussions, and key informant
interviews suggest that while mothers are primarily responsible for child feeding, fathers and
paternal grandmothers influence food-purchasing decisions, and secondary caregivers including
grandmothers and aunts influence child-feeding practices [12].

9
WK’s nutrition program involves prevention and treatment of malnutrition in children
under 5 years old. “Nutrition technicians,” receive nutrition training, and are assigned to a
community. Some nutrition technicians have completed training as nurse assistants and others
have vocational training in education and/or prior experience working with non-profit
organizations. WK partners with other non-governmental organizations as well as government
health centers and health posts in the communities served in order to augment existing services.
In a few communities, health promoters encourage caregivers to participate in growth monitoring
and help measure children. Universal preventative efforts for children under 5 years of age focus
on growth monitoring, nutrition education in groups, micronutrient supplementation, deworming
medication, and free primary care services. The interactive nutrition education curriculum
emphasizes empowerment of caregivers and has been constructed and revised based on findings
from WK’s mixed methods research to foster awareness of chronic malnutrition, dietary
diversity, and adequate complementary feeding. During nutrition classes, caregivers learn and
participate in healthy meal preparation. The proper consistency and density of food is
demonstrated and reinforced. Recognizing the role that diarrhea plays in chronic malnutrition
[14], WK has also provided water filters for some families, based on funding availability.
Treatment efforts focus on children:
• under 5 years old with acute malnutrition, defined as a weight-for-length or weight-for-
height Z score below -2 based on the 2008 WHO growth standards [15]
• under 25 months old with chronic malnutrition, defined as a length-for-age or height-for-
age Z score below -2 based on the 2008 WHO growth standards [15]
• under 5 years old with weight loss for 3 or more months
• under 12 months with a mother unable to produce breast milk
Children enrolled in the treatment program receive an individualized plan that includes
supplementation, clinical visits with a physician, group nutrition classes, and individualized
education based on 24-hour dietary recalls. Nutrition technicians also make home visits as
needed to reinforce nutrition education for children in the recuperative program. In analyses
pooled from 7 studies, provision of food supplements (with or without education) to food
insecure populations was associated with a weighted mean increase in height-for-age Z score of
0.41 compared with controls [16]. Given communities served by WK experience food insecurity
[11], children with chronic malnutrition receive a food basket every two weeks for a period of six

10
months. This food basket includes 20 eggs, 2 pounds of dried beans, and 2 bags of fortified corn
and soy-based protein powder for first three months and then 20 eggs and 2 pounds of beans for
the last three months. Children with acute malnutrition receive the same food basket every two
weeks for six months in addition to ready-to-use supplementary food (RUSF). If RUSF is
unavailable due to stock-out, then the caregiver is provided ingredients and instructions to make
therapeutic formula (F-75 if the child has moderate acute malnutrition and F-100 if the child has
severe acute malnutrition) [17]. The group nutrition classes consist of 4 classes, which cover
nutrition during pregnancy; breastfeeding; complementary feeding with an emphasis on dietary
diversity, meal frequency, and food consistency; and acute versus chronic malnutrition. The
nutrition education emphasizes diverting money spent on junk food or instant soups to buy more
nutritious foods. Over the past 2 years, WK has been rapidly expanding its services to additional
communities. At the time of initiating the quality improvement efforts, Wuqu’ Kawoq (WK) had
active nutrition programs in Guatemala in 8 locations, primarily rural areas populated by
indigenous people. With expansion, WK wanted to ensure high quality services are maintained
and thus initiated a formal quality improvement project.
Intervention
Before initiating quality improvement efforts, nutrition programming at each site was observed
and the existing protocol, training documents, and educational materials were reviewed. Input
was also sought from a staff physician, who at the time was the research coordinator of a
nutrition intervention study and had created observation checklists for auditing purposes. These
checklists (found in the appendix) were used to identify areas in need of improvement. Nutrition
technicians were also asked for their input to improve the program, especially regarding the
appropriateness of educational instruments and materials and the feasibility of making changes.
Meetings were held with the Chief Executive Officer, Medical Director, and Executive Director
to discuss ways to strengthen the program and incorporate their input. This information informed
the creation of a revised, comprehensive nutrition manual, which included pictures as well as key
messages. We drafted a model for improvement with the following key drivers seen as integral to
reducing the prevalence of chronic malnutrition in children under 5 years old: (1) food security,
(2) environmental health, (3) provision of health services, and (4) empowerment and education
of caregivers.
11
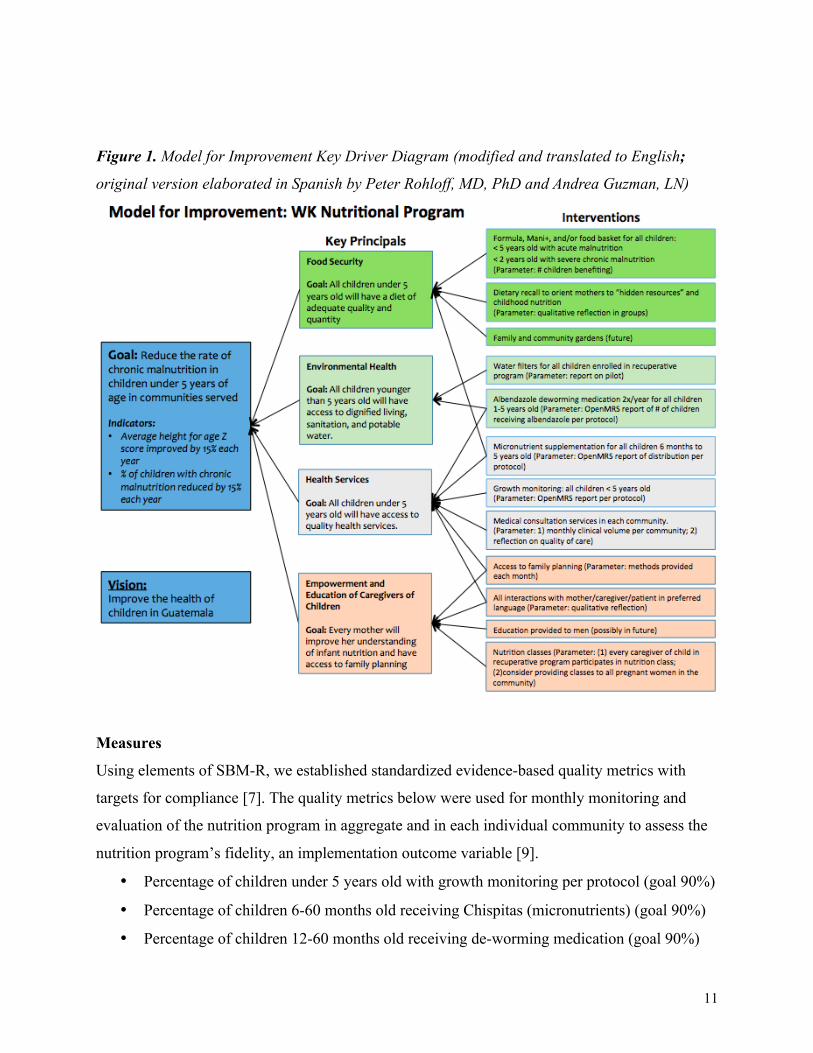
Figure 1. Model for Improvement Key Driver Diagram (modified and translated to English;
original version elaborated in Spanish by Peter Rohloff, MD, PhD and Andrea Guzman, LN)
Measures
Using elements of SBM-R, we established standardized evidence-based quality metrics with
targets for compliance [7]. The quality metrics below were used for monthly monitoring and
evaluation of the nutrition program in aggregate and in each individual community to assess the
nutrition program’s fidelity, an implementation outcome variable [9].
• Percentage of children under 5 years old with growth monitoring per protocol (goal 90%)
• Percentage of children 6-60 months old receiving Chispitas (micronutrients) (goal 90%)
• Percentage of children 12-60 months old receiving de-worming medication (goal 90%)

12
We tracked monthly information on the following outcome measures:
• Average height-for-age Z scores (a measure of stunting, which is a proxy of chronic
malnutrition) for each community
• Number and percentage of children with chronic malnutrition
“Community” 8 was excluded from outcome measure analysis since this site is solely composed
of malnourished children referred to our recuperative program by collaborating organizations
and the government health system. Site 8 includes children with complex medical care needs
from several small villages, and the average HAZ score and prevalence of stunting can vary from
month to month based on how many children are newly enrolled. The three communities added
to our program in October 2016 were also excluded from aggregate outcome measure analysis.
Data was extracted from OpenMRS, our electronic medical record system (EMRS). To
foster a culture of quality improvement, we presented aggregate, organization-wide data at
monthly meetings with the nutrition team followed by individual meetings with each nutrition
technician to confidentially review the data in their community from the previous month, provide
constructive feedback, as well as discuss and make plans to address challenges or obstacles to
carrying out nutrition programming in their respective communities. At monthly meetings, we
emphasized using the data to learn, reassess, and improve rather than to rebuke.
Method of Analysis
We used run chart analysis to assess for improvement. Run charts, also known as time series
charts, are considered a “universal tool” for improvement projects [18]. They provide visual and
temporal representation of process performance and help to determine if improvement occurred
with the introduction of efforts [18, 19]. Run charts enable more accurate conclusions about the
impact of improvement projects than summary statistics, which rely on the most recent data
point [19]. If a run chart has at least 10 points, it can be used to differentiate random variation
from non-random variation (also known as “signals of change”) through the application of run
chart rules and use of the median as the centerline [19, 20]. Non-random variation can provide
evidence of process improvement or degradation [18]. The Perla rules, as delineated below,
were applied to determine if a signal of change was non-random.
1. The shift rule refers to a minimum of six consecutive points all above or all below the median.
Values on the median do not count and are skipped [19].

13
2. The trend rule refers to a minimum of five consecutive points all increasing or all decreasing.
If the value of consecutive points is the same, the value is only counted once [19].
3. The run rule is met if there are too few or too many runs. A run is defined as a series of
consecutive points on one side of the median. We used Table 1 of Perla, Provost, & Murray’s
2010 article to assess if there were too few or too many runs [19].
4. The astronomical point rule is subjective and met if there is a data point that is obviously
different from all other data points [19].
The first three rules are probability-based, with an α error p<0.05 [19]. Analyzing run charts with
probability-based rules requires the median to be calculated from at least 10 data points [18].
Run charts were generated using the Microsoft Excel Run Chart Template version 2.0 developed
by Institute for Healthcare Improvement faculty member Richard Scoville, PhD and available for
download at http://www.ihi.org/resources/Pages/Tools/RunChart.aspx [21].
Section 4: Results
Using elements of the standards-based management and recognition (SBM-R) methodology of
quality improvement, our first step was compiling a comprehensive nutrition manual and
providing training to standardize the protocol across sites. Aiming to create a culture of quality
improvement, we also formally initiated monthly nutrition team meetings to review aggregate
organization-wide data, discuss difficult cases, obtain staff suggestions for ways to improve, and
provide continuing nutrition education. We frequently gathered feedback from staff to improve
nutrition instruments since the nutrition technicians are experts in working in the community and
see how mothers respond to program efforts. Continuing nutrition education is provided on areas
of noted confusion and topics requested by the nutrition technicians. In the first few months of
initiating QI efforts, we met with nutrition staff individually and confidentially, after the monthly
team meeting, to review data from their assigned community and to discuss how to support and
improve the work in their given community. A licensed nutritionist was hired as Nutrition
Director in March 2016 to provide oversight and expertise to staff and closely monitor children
in the recuperative program. Each nutrition technician now receives immediate constructive
feedback during site visits as well as increased support for managing children in the recuperative
program.

14
Areas for improvement and interventions by key principals
v Key principal: Food security
Enrollment of children in recuperative program and interpretation of growth monitoring data
While observing nutrition technicians in the field and reviewing monthly data, we noticed a
delay in identifying and enrolling children in the recuperative program. Through observation and
talking with nutrition technicians, we concluded that in some communities, the lag was due to
delayed calculation of Z scores and in other communities, secondary to incomplete
understanding of Z scores. Reasons for delayed calculation included trying to speed up workflow
during growth monitoring. While all nutrition technicians have a PC laptop with a Spanish
version of the World Health Organization Anthropometry Calculator [22], which allows for
calculation without Internet access of weight-for-age Z scores (WAZ), height-for-age Z scores
(HAZ), and weight-for-height Z scores (WHZ), nutrition technicians have reported that this
calculator is time consuming, cumbersome, and not completely user-friendly. Some nutrition
technicians were waiting until the end of the month to calculate and enter Z scores rather than
calculating and reviewing Z scores as the children were measured on growth monitoring days. In
community 2, which has a particularly large population of children under 5 years old (N=271 in
December 2016), our organization partners with the government health center to avoid
duplicating growth monitoring, and community health promoters working for the government
health center provide our organization with a list of names and growth measurements. There was
a time lag to receive the list, and then making all the calculations is time consuming. We
addressed this issue by meeting with the government workers and requesting that the community
health workers coordinate with our nutrition technician, so she can be present on growth
monitoring days to calculate Z scores promptly. Also, a volunteer created a Microsoft Excel file
with embedded macros, which enables automatic calculation of WAZ, HAZ, and WHZ with the
input of the child’s date of birth, gender, date of measurement, weight, and height. With
additional iterations, conditional formatting was added to the document to provide color-coding
of Z scores based on severity and thus facilitate data interpretation. At the retraining and
standardization meeting in January 2016 and subsequent monthly meetings, we reinforced that
the nutrition technicians are expected to calculate and interpret the Z scores as they measure each
child.

15
Difficulty with interpretation of growth monitoring data posed a significant barrier to
providing timely high quality services to the communities. Monthly review of the data revealed
that some acute malnutrition cases were not reported immediately. Some nutrition technicians
were confused about the difference between acute malnutrition (wasting, Z score weight-for-
height < -2.0) and chronic malnutrition (stunting, Z score height-for-age < -2.0). The nutritional
intervention, urgency, and frequency of follow-up differs for these two types of malnutrition, so
it is important for nutrition technicians to distinguish between the two types. After observing and
talking with nutrition technicians in the field, we concluded that the confusion was due to
confusing terminology surrounding Z scores, limited familiarity with the concept of standard
deviations and related statistical concepts, normalization of stunting in Guatemala, and
deficiencies in our paper and electronic growth charts. Specifically, our paper and electronic
growth charts included the weight-for-age and height-for-age growth charts but not the weight-
for-height growth chart, used for detecting acute malnutrition.
Incorporating feedback from nutrition technicians, we implemented several interventions
to improve interpretation of Z scores. The difference between acute and chronic malnutrition was
careful reviewed during the training in January and has been reinforced at monthly meetings and
while in the field with staff. We also modified our documentation to facilitate Z score
interpretation. Each nutrition technician received a laminated checklist (see appendix) with steps
for interpreting measurements, Z scores, and growth charts as well as instructions for what do if
there is a concerning measurement, Z score, or trend on the growth chart. A one-page “cheat”
sheet of the difference between acute and chronic malnutrition with pictures, Z scores, and color-
coded corresponding graphs was created and given to nutrition technicians (see appendix). The
paper growth charts were modified to include 1) color-coding of the type and severity of
malnutrition with a key, 2) columns on the back of the growth chart to record Z scores to make it
easier to see if a child is improving or worsening from measurement to measurement, and 3) a
key, modeled off Peru’s growth charts, to facilitate interpretation of the growth curve trajectory
[23]. We also made changes to the electronic documentation form, which now includes a free
text field with instructions to document the Z scores. Wuqu’ Kawoq recently hired a programmer
who will improve the electronic growth charts in OpenMRS in the future. The Director of
Nutrition now reviews all cases of acute malnutrition with staff on a weekly basis, and the
protocol for acute malnutrition cases has been reinforced at monthly meetings and individually.

16
Lactation insufficiency and failure
By observing nutrition technicians in the field and reviewing the charts of children receiving
milk-based formula, our nutritionist (the Director of Nutrition) noted that “lactation failure” was
being incorrectly diagnosed in some mothers who were producing milk but struggling with
breastfeeding technique, and some infants were unnecessarily started on formula. Also, in some
cases, the amount of formula was not properly adjusted based on the child’s weight. In response,
nutrition technicians received additional training on the proper breastfeeding technique, the low
prevalence of lactation failure, and differentiation between lactation insufficiency or failure and
inadequate breastfeeding technique. Additional pictures on proper breastfeeding technique were
added to the nutrition education booklet. Further, we established a more formal protocol for
assessing lactation failure and providing formula. All cases of lactation failure or insufficiency
are now reviewed with the nutritionist at least every 2 weeks to make adjustments in formula.
v Key principal: Environmental health
Deworming medication (albendazole)
We attempted to integrate documentation of deworming medication distribution into our
electronic medical record system (EMRS) by adding checkboxes to the electronic growth
monitoring form, with the intent to easily extract this data when running monthly reports.
Previously, the distribution of deworming medication to each child was documented on
individual prescription papers, the carbon copies of which were turned into our procurement and
logistics specialist who manages medication inventory. The Guatemalan Ministry of Health’s
standard of care is to provide deworming medication to children from 24 to 60 months of age
twice a year. In reality, the distribution by government health centers and post varies depending
on the availability of deworming medications and the frequency with which children visit a
government health facility. We do not give children albendazole if they have received it from a
government health facility in the past 6 months, unless they have symptoms of helminthic
infection. Each nutrition technician receives a list of the children at their respective site, who did
not have documentation of receiving albendazole in the last 6 months in our EMRS. According
to our EMRS reports, the percentage of children between 12 and 60 months old receiving
deworming medication within the last six months as delineated in the protocol was well below

17
the goal of 90%, ranging from 18% to 39% each month. However, there was poor agreement
between paper and electronic documentation, which suggested lack of electronic documentation
rather than lack of distribution.
v Key principal: Health services
Growing monitoring: Measurement technique
Measurement technique, evaluated using an observation list (see appendix), was one area in need
of improvement. The major pitfalls observed in the field included forgetting to zero the balance
between weight measurements of each child, leaving too much clothing on the child during
measurements (resulting in inaccurate measurements), and improper positioning of the child
during measurements of height or length. These issues were addressed and resolved by reviewing
proper technique at the re-training in January 2016 and by providing immediate feedback to
nutrition technicians and to health promoters from the communities who help with
anthropometric measurements. In community 2, WK collaborates with health promoters from the
government health center, who weigh and measure children under five years old and were
recording weight and height measurements to the nearest ½ kilogram and ½ centimeter,
respectively, rather than the nearest 0.1kilogram or 0.1 centimeter. This difference results in
inaccurate anthropometric Z scores. This problem was resolved after providing refresher training
to collaborating health promoters.
Micronutrient supplementation
Electronic documentation of a micronutrient powder (MNP) supplementation called Chispitas
was also poor. The government health system aims to provide children from 6 months to 5 years
old with a 60-day supply of MNP twice a year. WK’s goal is for these children to have MNP
every day and thus WK provides MNP when the child has finished their supply from the
governmental health system. It is challenging to track because different children are receiving
MNP from the government health facilities at different times. We added a checkbox for
Chispitas in the electronic growth monitoring form, which nutrition technicians were asked to
mark if the child had received MNP from either WK or the government. However, the amount of
Chispitas distributed at a given time varied from a 30-day supply to a 60-day supply depending

18
on the availability of MNP in our inventory, thus complicating documentation. According to
monthly reports generated from OpenMRS, the percentage of children between 6 and 60 months
old receiving MNP as delineated in the protocol ranged from 7.4-35.4% each month in 2016.
Based on observation and talking with nutrition technicians, we concluded that these low
percentages were secondary to 1) poor documentation in our EMRS given discrepancy between
the electronic documentation and the increased amount of MNP ordered and used each month
and 2) inadequate communication between nutrition technicians and our procurement and
logistic specialist about the amount of MNP needed for each community each month. In an effort
to improve documentation, we recently added a textbox in our EMRS to list the combined
amount of Chispitas received from Wuqu’ Kawoq and the government health care system.
Diarrhea management
Staff expressed interest in learning about diarrhea and dehydration management. A diarrhea and
dehydration protocol, training based on the World Health Organization’s diarrhea module for
integrated management of childhood illness [24], and standardized kits were made and
distributed. The standardized kit includes oral rehydration solution, zinc, a thermometer, and
pictorial handouts explaining how to make homemade oral rehydration solution.
v Key Principal: Empowerment and Education of Caregivers of Children
Dietary recall
We formalized the dietary recall based on feedback from nutrition technicians on what questions
do and do not work and added additional questions to address key elements of complementary
feeding. We modeled how to use the dietary recall to guide feedback given to caregivers. We
also observed nutrition technicians administering the dietary recall and giving caregivers advice,
and we provided technicians with immediate feedback. While observing, we noticed that advice
given to caregivers was sometimes disorganized or not directly related to the dietary recall
results. To address this issue, a table (see appendix) was constructed to facilitate providing
mothers with organized and relevant, individualized feedback based on dietary recall responses.
After administering a dietary recall, nutrition technicians now start by congratulating caregivers
to re-enforce positive feeding practices followed by advice for improving a child’s diet based on

19
their responses. Per their feedback, nutrition technicians also received standardized nutrition kits
to use when administering the dietary recall and when providing nutrition education to caregivers
about appropriate meal size for a child of a given age. Initially the standardized nutrition kit
included a 250cc cup that was marked, but the nutrition technicians reported that the cup caused
confusion with caregivers, who thought the cup referred to liquid consumption and had a
difficult time relating the quantity of food given to their child to a cup. As a result, the cup was
replaced with a small bowl typical of the dish size and type given to children by their caregivers.
Currently, the standardized nutrition kit includes teaspoons, tablespoons, and a small bowl. The
nutrition education booklet provided to caregivers who participate in our group nutrition classes
was revised to reduce the quantity of text and increase the quantity and quality of pictures since
some caregivers are illiterate or have limited literacy. A laminated 8.5 x 11 inch, 49-page
educational flipbook was created with input from nutrition technicians and provided to all
nutrition technicians to facilitate educating and empowering caregivers.
Figure 2. Timeline of our quality improvement efforts
Jan-16
§ Nutrition protocol standardization and re-training
§ Nutrition manual distribution § Metrics and goals defined
Feb-16
§ Protocol modification based on staff feedback
§ Dietary recall revision and tool for giving relevant advice
§ Nutrition kit distribution
§ Monthly data review § Iterative modifications to the
documentation system § Continuous feedback from staff § Immediate constructive feedback
for staff in the field (monthly)
Mar-16 § Nutritionist hired and on-boarded
Apr-16
§ Lactation failure training and protocol revision
§ ManíPlus rollout for stunted children 6-24 months
May-16
§ PlumpyNut protocol for acute malnutrition
§ Growth monitoring checklist and interpretation tool
§ Color-coded/labeled and revised growth charts
§ Revised and laminated flip chart § Diarrhea protocol and kit

20
Process Measures
Between March 2016 and December 2016, the number of children under 60 months of age
participating in the nutrition program increased by 36% from 761 to 1037 children, and the
number under 24 months of age increased by 66%, from 259 to 429 children. Part of this
increase was due to extending services in October 2016 to three additional communities with a
combined total of 157 children under 5 years old, 48 of whom are under 24 months old. By
November 2016, we achieved our goal of 90% compliance with growth monitoring coverage per
the protocol for children in the universal nutrition program. From March to December 2016, the
percentage of children under 2 years old, receiving growth monitoring per protocol, improved
from 76.1% to 92.5%. The run chart (figure 3) below shows the process in time order from
March 2016 to December 2016. We did not have a baseline for this chart since the frequency of
growth measurements was variable depending on the community in prior years, standardized in
January 2016 across communities, and then modified at the end of February based on feedback
from nutrition technicians and discussions with WK’s leadership. Thus, the median line of 78.5%
is the median percent of children less than 24 months old with growth monitoring per the
protocol (i.e. growth monitoring once a month) from March to December 2016. This run chart
does not satisfy any of the Perla rules; thus, the pattern is considered random.
Figure 3. Run chart of percentage of children 0-24 months in all communities with growing
monitoring per protocol by month
76.1% 69.0%
81.0% 79.0%
75.7% 78.2%
78.8%
77.6%
91.7% 92.5%
Median = 78.5%
Goal
60.0%
65.0%
70.0%
75.0%
80.0%
85.0%
90.0%
95.0%
100.0%
Mar
'16
Apr
'16
May
'16
Jun '16
Jul '16
Aug
'16
Sep
'16
Oct
'16
Nov
'16
Dec
'16
ALL Communities: Percent of children 0-24mo with growth monitoring per protocol by month %
21
Run charts displaying percentages or rates should be interpreted with caution. The denominator
for each data point should be about +/- 25% of the average denominator [18]. In figures 3, the
denominator (number of children 0-24 months of age) for October and November (442 children
and 429 children, respectively) exceeded +25% of the average denominator (343.9).
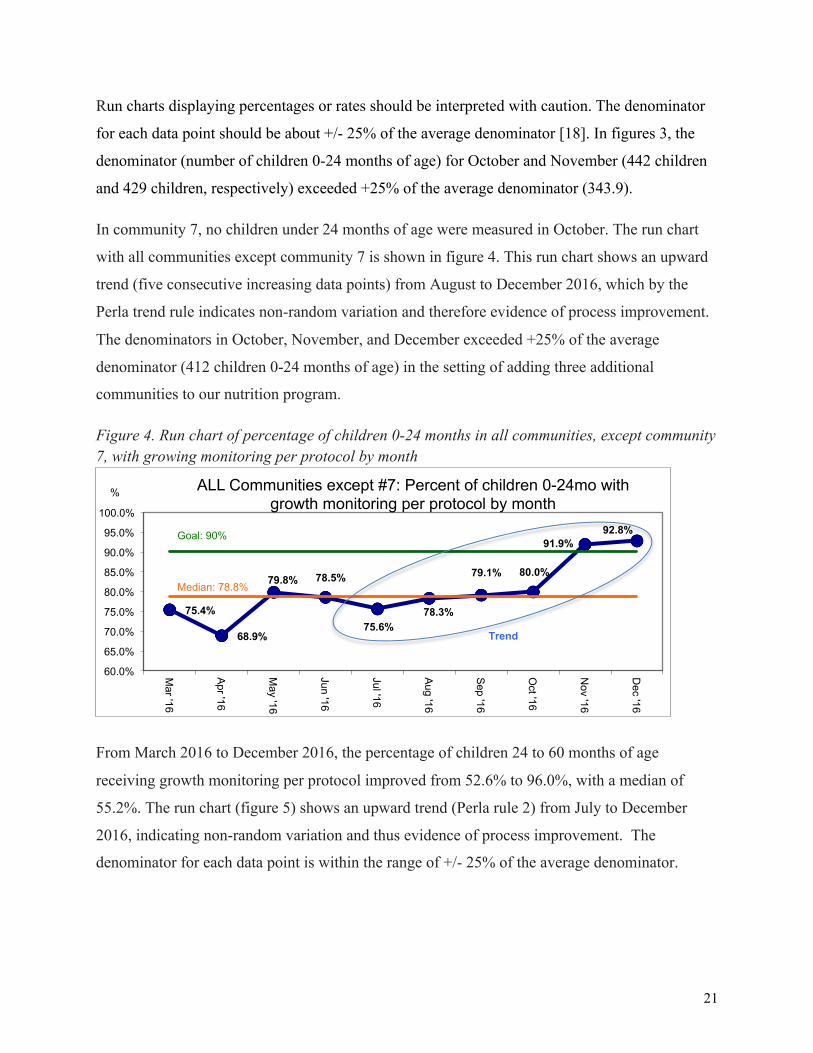
In community 7, no children under 24 months of age were measured in October. The run chart
with all communities except community 7 is shown in figure 4. This run chart shows an upward
trend (five consecutive increasing data points) from August to December 2016, which by the
Perla trend rule indicates non-random variation and therefore evidence of process improvement.
The denominators in October, November, and December exceeded +25% of the average
denominator (412 children 0-24 months of age) in the setting of adding three additional
communities to our nutrition program.
Figure 4. Run chart of percentage of children 0-24 months in all communities, except community 7, with growing monitoring per protocol by month
From March 2016 to December 2016, the percentage of children 24 to 60 months of age
receiving growth monitoring per protocol improved from 52.6% to 96.0%, with a median of
55.2%. The run chart (figure 5) shows an upward trend (Perla rule 2) from July to December
2016, indicating non-random variation and thus evidence of process improvement. The
denominator for each data point is within the range of +/- 25% of the average denominator.
75.4%
68.9%
79.8% 78.5%
75.6% 78.3%
79.1% 80.0%
91.9% 92.8%
60.0%
65.0%
70.0%
75.0%
80.0%
85.0%
90.0%
95.0%
100.0%
Mar '16
Apr '16
May '16
Jun '16
Jul '16
Aug '16
Sep '16
Oct '16
Nov '16
Dec '16
ALL Communities except #7: Percent of children 0-24mo with growth monitoring per protocol by month
%
Median: 78.8%
Goal: 90%
Trend

22
Figure 5. Run chart of percentage of children 24-60 months old in all communities with growing monitoring per protocol by month
Outcome measures
Average height-for-age Z score for children under 2 years old
The aggregate data from communities 1 through 7 shows a 6.8% improvement in the average
height-for-age Z (HAZ) score in children between 0 and 24 months old from February 2016
(average HAZ score -2.05) to February 2017 (average HAZ score -1.91). However, the run chart
below (figure 6) suggests random variation in average HAZ score.
Figure 6. Run chart average HAZ each month in children 0-24months old in communities 1-7
All disaggregated run charts for individual communities also showed random variation in the
average HAZ scores for children under 2 years old.
52.6%
61.1%
54.6% 44.6%
53.9% 54.6%
55.7% 59.2%
88.4%
96.0%
40.0%
50.0%
60.0%
70.0%
80.0%
90.0%
100.0%
Mar '16
Apr '16
May '16
Jun '16
Jul '16
Aug '16
Sep '16
Oct '16
Nov '16
Dec '16
All Communities: % of children 24-60mo with growth monitoring per protocol by month %
Goal: 90%
Median: 55.2%
-2.05
-1.92
-2.09
-2.10
-1.92
-2.04
-2.10 -2.23
-2.37
-2.17
-2.27
-2.08
-1.91
Median = -2.09
-2.40
-2.30
-2.20
-2.10
-2.00
-1.90
-1.80
-1.70 Feb '16
Mar '16
Apr '16
May '16
Jun '16
Jul '16
Aug '16
Sep '16
Oct '16
Nov '16
Dec '16
Jan '17
Feb '17
Communities 1-7, Children 0-24mo: Average HAZ each month Average HAZ

23
Average height-for-age Z score for children under 5 years old
The average HAZ score for children 0-60 months old improved by 5.7% between February 2016
(HAZ -2.11) and February 2017 (HAZ -1.99). However, the run chart of average HAZ scores for
children 0-60 months old (figure 7a) shows non-random variation with a shift of six consecutive
points below the median from July to December 2016, indicating worsening HAZ scores.
Figure 7a. Run chart of HAZ each month in children 0-60 months old in communities 1-7
Number of children under 5 years old measured each month: Range: 201-367, Average: 72.8, Average +/- 25%: 218.3-363.8
In community 2, there was non-random improvement in the average HAZ score of children
under 5 years old from September 2016 to January 2016 as indicated by the trend on the run
chart (figure 7b). Individual data for other communities showed random variation.
Figure 7b. Run chart of HAZ each month in children 0-60 months old in community 2
Number of children under 5 years old measured each month: Range: 53-109, Average: 78.2, Average +/- 25%: 58.7-97.8
-2.11
-2.05
-2.18 -2.14
-2.11
-2.19 -2.19
-2.24 -2.27 -2.22 -2.22
-2.03 -1.99
Median = -2.18
-2.30
-2.20
-2.10
-2.00
-1.90 Feb '16
Mar '16
Apr '16
May '16
Jun '16
Jul '16
Aug '16
Sep '16
Oct '16
Nov '16
Dec '16
Jan '17
Feb '17
Communities 1-7, Children 0-60mo: Average HAZ each month Average HAZ
Shift
-2.67 -2.60
-2.32 -2.34 -2.41 -2.52
-2.90
-2.68
-2.54 -2.50 -2.46
-2.30 -2.34
Median = -2.50
-3.00 -2.90 -2.80 -2.70 -2.60 -2.50 -2.40 -2.30 -2.20 -2.10 -2.00 Feb '16
Mar '16
Apr '16
May '16
Jun '16
Jul '16
Aug '16
Sep '16
Oct '16
Nov '16
Dec '16
Jan '17
Feb '17
Community 2, Children 0-60mo: Average HAZ each month Average HAZ
Trend

24
Percentage of stunted children (HAZ < -2.00) under 2 years old
From February 2016 to February 2017, the percentage of stunted children under 2 years old in
communities 1-7 decreased by 4.8% from 50.3% to 45.5%. However, the aggregate run chart
(figure 8) suggests variations in prevalence of stunting are random rather than due to process
improvement. The number of children measured each month was within +/-25% of the average.
Figure 8. Run chart of prevalence of stunted children (HAZ < -2.00) in communities 1-7, aged 0-24 months by month
In community 1, the prevalence of stunted children under 2 years old decreased from 50% in
February 2016 to 25.0% in February 2017. The run chart (figure 8b) shows non-random
improvement indicated by the downward trend from September 2016 to February 2017. Run
charts of the prevalence of stunting in children under 2 years old in other individual communities
showed random variation.
Figure 8b. Run chart of prevalence of stunted children (HAZ < -2.00) aged 0-24 months by month in community 1
Number of children under 24 months of age measured: Range: 21-55, Average: 41, Average +/- 25%: 30.7-51.3
50.3%
46.5%
55.4% 53.1%
55.4%
49.5%
57.4%
62.3% 59.6%
55.4%
60.3%
52.2%
45.5%
Median = 55.4%
Goal = 42.8% 40.0%
45.0%
50.0%
55.0%
60.0%
65.0%
Feb '16
Mar '16
Apr '16
May '16
Jun '16
Jul '16
Aug '16
Sep '16
Oct '16
Nov '16
Dec '16
Jan '17
Feb '17
Communities 1-7: % of stunted children (HAZ < -2.00) 0-24mo each month % w/ HAZ <2.00
50.0%
34.5% 42.9%
32.6% 35.4% 44.8%
52.1%
73.9%
53.2% 46.9%
40.8%
28.0% 25.0% Median = 42.9%
20.0%
30.0%
40.0%
50.0%
60.0%
70.0%
80.0%
Feb '16
Mar '16
Apr '16
May '16
Jun '16
Jul '16
Aug '16
Sep '16
Oct '16
Nov '16
Dec '16
Jan '17
Feb '17
Community 1: % of stunted children (HAZ < -2.00) 0-24mo each month % w/ HAZ <2.00
Trend

25
Percentage of stunted children (HAZ < -2.00) under 5 years old
From February 2016 to February 2017, the prevalence of stunted children under 5 years old in
communities 1-7 decreased from 53.7% to 49.4%. The run chart rules do not apply to the
corresponding run chart (figure 9); thus, the variations can be considered random rather than
secondary to process improvement or degradation. The number of children under 5 years old
measured in April 2016 was less than 75% of the average number of children under 5 years old
measured each month from February 2016 to February 2017. The run charts for individual
communities also showed random variation in the prevalence of stunting of children under 5
years old.
Figure 9. Run chart of prevalence of stunted children (HAZ < -2.00) under 5 years old in
communities 1-7 by month
Section 5: Discussion, Limitations, Conclusions, and Suggestions for Future Work
Discussion
Quality improvement work in global health is important for continually reassessing
interventions and for maximizing impact. Guided by our model for improvement and feedback
from staff, we worked on quality improvement efforts related to food security, environmental
health, health services, and empowerment and education of caregivers of children. We were able
to make changes to improve services and education provided.
Our process measure of growth monitoring coverage for children younger than 5 years
old markedly improved and by the end of 2016 was above our goal of 90% coverage. The run
53.7% 53.7%
59.7%
54.1%
56.0% 57.0% 58.6%
65.0% 63.7%
57.1%
60.8%
55.4%
49.4%
Median = 57.0%
Goal =45.6% 43.0%
48.0%
53.0%
58.0%
63.0%
68.0%
Feb '16
Mar '16
Apr '16
May '16
Jun '16
Jul '16
Aug '16
Sep '16
Oct '16
Nov '16
Dec '16
Jan '17
Feb '17
Communities 1-7: % of stunted children (HAZ <-2.00) 0-60mo each month
% w/ HAZ < -2.00

26
charts provide evidence of upward trends, indicating process improvement. Reviewing the
monthly growth monitoring coverage as a team and then in individual meetings each month
likely fostered improvement since staff could visualize the impact of their efforts. Also, our
programmer generated lists of the children who needed growth monitoring for a given month to
help nutrition technicians with their workflow, and this effort likely contributed to the
improvement in growth monitoring coverage. It is also important to note that if a child was
measured during a given period, but the data was not yet in our electronic medical record system
at the time of generating the report, then the child was not counted as measured. It is also worth
highlighting the difference in the aggregate run chart of the percent of children under 2 years
olds measured in all communities (figure 3) compared to the same run chart with all
communities except community 7 (figure 4). The run chart in figure 4 shows an upward trend,
indicating non-random variation and thus provides evidence of process improvement. This
difference highlights the fact that combining data from multiple communities in a run chart can
prevent a signal from being visualized [18]. Thus, it is also useful to look at the run charts for
individual communities since one or a few struggling communities can make the difference
between the presence versus the absence of a shift and/or trend. Also, looking at run charts for
individual communities enables versatile visual identification of which communities are
struggling and thus provides an opportunity for further discussion about obstacles and potential
solutions.
As a result of poor electronic documentation, we were unable to assess if our other
process measures, specifically the distribution of deworming medication and micronutrient
powder (MNP) supplementation, improved. We postulate that part of the poor documentation is
secondary to competing interests for time. We have made efforts to make sure the workload is
reasonable for staff. It would be useful to recollect staff input for streamlining their work. While
the electronic nutrition program documentation form in OpenMRS has checkboxes for
documenting distribution of albendazole and MNP, some nutrition technicians do data entry on
another day because OpenMRS requires Internet access to use. While most nutrition technicians
have a portable Internet modem, the connection is poor in some communities and varies based on
the weather.
Improvements in services and process measures do not necessarily translate to decreased
stunting, our outcome measure. When only looking at data for the first and last month included

27
in the run charts, the average HAZ scores appear to have improved for children under 2 years of
age and under 5 years of age. However, the aggregate run chart in children under 2 years old
suggests that our quality improvement efforts did not impact their average HAZ score, and the
aggregate run chart for children under 5 years old shows non-random worsening of HAZ scores
from July to December 2016. It is important to note that in figure 7a, the aggregate run chart for
children under 5 years of age, some data points included in the shift below the median (-2.19 in
July and August 2016 and -2.22 in November and December 2016) are very close to the value of
the median (-2.18). Per Perla run chart rules, values on the median do not count, and a difference
in Z score of 0.01 or 0.04 is probably not clinically significant. Around the time when average
HAZ scores start to decline in both run charts, there was an increase in enrollment of children
into the nutrition program in community 2, which is historically an agricultural community, with
high levels of food insecurity, where improvement has been challenging to effect [11]. Between
September 2016 and December 2016, in that community, the number of children under 24
months old who were measured nearly doubled and the number of children under 24 months old
in the recuperative program for chronic malnutrition tripled. Children in the recuperative
program are more likely to have growth monitoring than other children since they are seen at
least twice a month by a nutrition technician, and thus our HAZ scores may over-represent
stunted children. For other children in community 2, we rely on the collaboration of community
health promoters to help with measurements since there are so many children under five years
old in that community. In December 2016, the community had about 271 children under 5 years
old, which was 26% of the children in our nutrition program at that time. Community 2 usually
has the worst or second-to-worst average HAZ scores of all the communities. Paradoxically, the
only run chart for children under 5 years olds in an individual community that shows non-
random improvement in average HAZ scores is community 2 from September 2016 to January
2017. A closer look at the run chart (figure 7b) shows that this non-random improvement occurs
after a drastic decline in the average HAZ in community 2 to a nadir average HAZ of -2.90 in
August 2016. It is possible that part of the improvement in average HAZ scores in community 2
was related to the significant increase in children enrolled in the recuperative program, which
could mean earlier detection and more prompt intervention of chronic malnutrition at a less
severe stage when it is easier to halt and/or reverse. It would be informative to construct a run
chart looking at the HAZ scores of a cohort of chronically malnourished children enrolled in our

28
recuperative program before, during, and after the quality improvement interventions.
Guatemala ranks among the 10 countries “most susceptible to climate change,” and
agricultural production has been particularly hard hit during the past years in which prolonged
periods of drought have resulted in decreased crop yield as well as complete crop failure for
some [3]. Further, Guatemala has a period of “seasonal hunger” that usually extends from June to
September [25], which may have impacted our results. For example, the aggregate run chart
(figure 6) shows worsening HAZ scores from July to October 2016. Also, in one of the
communities, where most men work on a rubber plantation, many men were being laid off as a
result of the state of the rubber economy globally. Once we have additional data, it would be
helpful to assess for seasonal variation in stunting incidence and prevalence.
The prevalence of stunted children, measured as percentage of children under 5 years old
with a height-for-age Z score less than -2.00, decreased from February 2016 to February 2017,
but almost all aggregate and disaggregated run charts show random variation in stunting
prevalence. The only run chart showing a non-random decline in the prevalence of stunting is the
run chart of the prevalence of stunting in children under 2 years old in community 1 (figure 8b).
It would be helpful to explore potential reasons why the prevalence of stunting in children under
2 years old declined in community 1 and if there are certain things the nutrition technicians are
doing well there that can be emulated in other communities. A closer look at the run chart (figure
8b) shows that the prevalence of stunting in community 1 increased during the period of
“seasonal hunger” from June to September 2016, reaching 73.9% in September 2016 and then
decreased each month thereafter.
When interpreting these run charts, it is important to note that the prevalence of stunting
varies with age in months as seen in figure 10, which shows 2014-2015 data from the National
Maternal and Infant Health Survey in Guatemala [1]. Among Guatemalan children under 5 years
old, the prevalence of stunting was greatest in children between the age of 18 and 23 months old
[1]. The prevalence of stunting in children between 12 and 17 months old (47.2%) was nearly
10% higher than the prevalence children between 9 and 11 months old (37.5%) [1]. This means
that if more children between 12 and 17 months old are measured in a given month than children
at an age with less stunting, the HAZ scores will look better. It also means that if a certain
community suddenly has many newborns, the HAZ score may look better for a certain period of
time. In future analysis, it would be helpful to construct a cohort of children who are followed

29
over time, with the last data point carried forward as necessary for each child without growth
measurements in certain months.
Figure 10. Prevalence of Stunting by Age in Months in Guatemala Children under 5 years old. Data source: Ministerio de Salud Pública y Asistencia Social, MSPAS. Encuesta Nacional de Salud Materno Infantil, Guatemala, 2014-2015 [1]
Actively incorporating feedback from the nutrition technicians rather than simply doing
Plan-Do-Study-Act (PDSA) cycles with the organizational leadership was a strength of our
project. Flexibility and soliciting feedback from staff working in the communities about what is
realistic are strengths of quality improvement projects [26]. Another strength to our project was
creating a culture of quality improvement and sharing the monthly data with the nutrition
technicians, so they can visualize if process and outcome measures are improving and feel
empowered to effect change in their assigned community. We hope that our materials and
reporting on our quality improvement efforts will prove useful to other organizations doing
childhood nutrition work in developing countries but also recognize the importance of adapting
approaches and tools based on local context. To date, our nutrition materials have been shared
with a Peace Corps volunteer in Guatemala, a physician working in another area of Guatemala,
and a nurse from Boston interested in starting a nutrition program in a poor, rural area in
Honduras where she regularly volunteers. Meaningful components of our work include a
formalized process of using the dietary recall as a tool to provide individualized positive
reinforcement and advice as well as efforts to facilitate identification of stunting and
interpretation of Z scores and growth charts.
29.8% 32.3% 37.4%
47.2%
54.8% 51.5%
51.4% 45.8%
7.4% 8.6% 12.7% 19.5% 22.6% 19.8% 18.2% 14.9% 0.0%
20.0%
40.0%
60.0%
80.0%
100.0%
<6 6-8 9-11 12-17 18-23 24-35 36-47 48-59 Age in Months
Prevalence of stunting in children by age in months
%children with HAZ < -2.0 (stunting)
% children with HAZ < -3.0 (severe stunting)

30
Limitations
Our project had several limitations. While it is considered good technique to use an initial
median generated from the baseline and extended it into the future, we were unable to create a
baseline for the aggregate data of all sites due to missing baseline data from some communities.
Additionally, though Perla rules have high sensitivity (99%), they have relatively poor specificity
(53%) [27]. While run charts enable early detection of improvement or degradation, they do not
show whether a process is stable [19]. Once we have additional data points, it would be helpful
to use Shewhart control charts to assess for process stability and address the issue of
denominators outside the range of +/- 25% the average denominator in charts with percentages
[18]. Also, while we looked at process measures and outcome measures, we did not assess for
balancing measures, which evaluate whether new problems arise as a result of improvements in
some aspects of a program [28].
Another limitation is that children under 2 years old are measured every month whereas
children between 24 months and 60 months old are measured every 3 months. As a result, in the
charts for children under 5 years old, the degree of improvement or deterioration HAZ scores and
stunting for children younger than 2 years old is more heavily weighted during certain months
than for children between 2 and 5 years old. Finally, our data analysis was limited by poor
documentation of distribution of micronutrient supplements and deworming medication.
Conclusions
While we saw improvement in our process outcome of growth monitoring coverage and
increased our outreach efforts, we still need to streamline our documentation system. Despite
improvement in a process outcome, there was minimal improvement in average HAZ scores and
stunting prevalence. No or little improvement in communities is likely related to confounding
factors, such as the overrepresentation of children enrolled in the recuperative program in our
calculations, expansion of our program to include more severely stunted children, climate
change, and crop failure. Additional analysis, looking at cohorts of children before and after the
initiation of quality improvement efforts is warranted to fully explore if our quality improvement
effort have impacted the severity and prevalence of stunting in communities where we work.
31
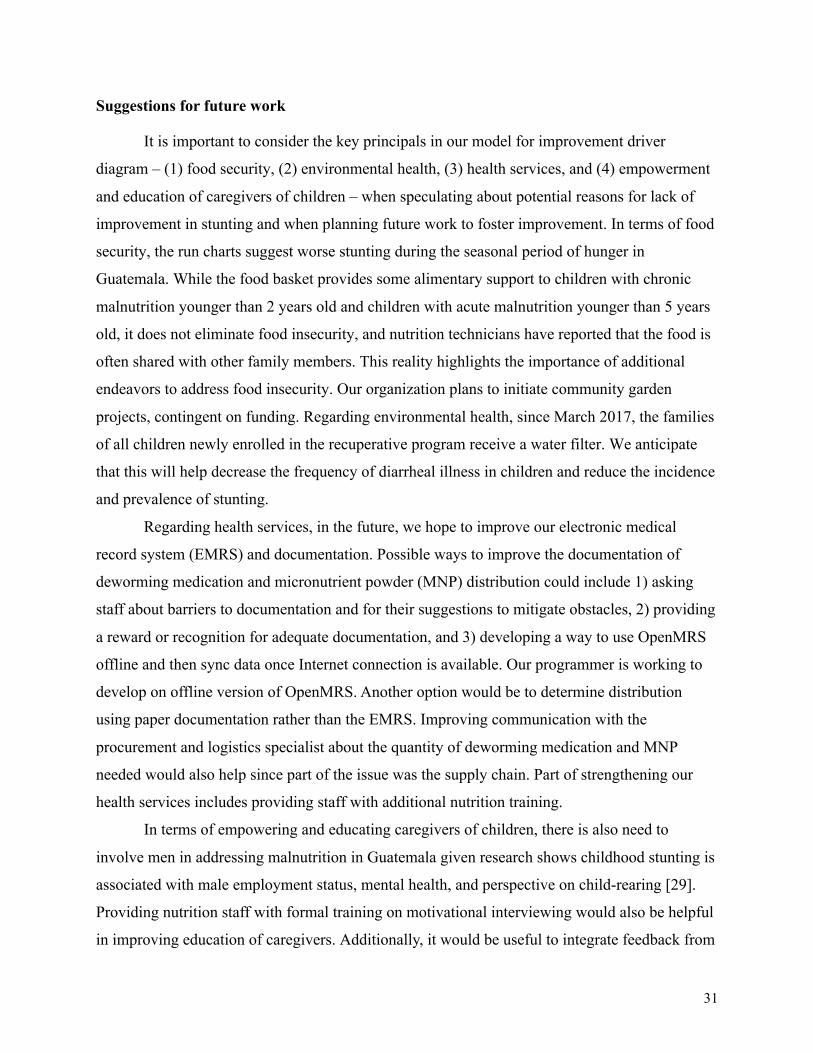
Suggestions for future work
It is important to consider the key principals in our model for improvement driver
diagram – (1) food security, (2) environmental health, (3) health services, and (4) empowerment
and education of caregivers of children – when speculating about potential reasons for lack of
improvement in stunting and when planning future work to foster improvement. In terms of food
security, the run charts suggest worse stunting during the seasonal period of hunger in
Guatemala. While the food basket provides some alimentary support to children with chronic
malnutrition younger than 2 years old and children with acute malnutrition younger than 5 years
old, it does not eliminate food insecurity, and nutrition technicians have reported that the food is
often shared with other family members. This reality highlights the importance of additional
endeavors to address food insecurity. Our organization plans to initiate community garden
projects, contingent on funding. Regarding environmental health, since March 2017, the families
of all children newly enrolled in the recuperative program receive a water filter. We anticipate
that this will help decrease the frequency of diarrheal illness in children and reduce the incidence
and prevalence of stunting.
Regarding health services, in the future, we hope to improve our electronic medical
record system (EMRS) and documentation. Possible ways to improve the documentation of
deworming medication and micronutrient powder (MNP) distribution could include 1) asking
staff about barriers to documentation and for their suggestions to mitigate obstacles, 2) providing
a reward or recognition for adequate documentation, and 3) developing a way to use OpenMRS
offline and then sync data once Internet connection is available. Our programmer is working to
develop on offline version of OpenMRS. Another option would be to determine distribution
using paper documentation rather than the EMRS. Improving communication with the
procurement and logistics specialist about the quantity of deworming medication and MNP
needed would also help since part of the issue was the supply chain. Part of strengthening our
health services includes providing staff with additional nutrition training.
In terms of empowering and educating caregivers of children, there is also need to
involve men in addressing malnutrition in Guatemala given research shows childhood stunting is
associated with male employment status, mental health, and perspective on child-rearing [29].
Providing nutrition staff with formal training on motivational interviewing would also be helpful
in improving education of caregivers. Additionally, it would be useful to integrate feedback from

32
parents and other caregivers. A quality improvement intervention in a South African hospital
employed experience-based co-design (EBCD) to improve the nutrition and health of children
[30]. In EBCD, staff and patients jointly create and implement quality improvement [30].
Involvement of caregivers in future quality improvement efforts would likely improve the
engagement of caregivers in the nutrition program and could be piloted in the future.

33
Section 6: Acknowledgements
We would like to acknowledge the following people:
§ The nutrition technicians, for their invaluable feedback, perseverance, and loving care
delivered to families and children day-in and day-out, and without whom the nutrition work
and quality improvement process would not be possible
§ Boris Martinez, MD for his invaluable feedback and for sharing materials (including
observation checklists) which were vital in creating the standardized nutrition manual
§ Anita Chary, PhD, Sarah Messmer, MD, and other volunteers who contributed to establishing
the groundwork of and/or continuing Wuqu’ Kawoq’s nutrition work in Guatemala
§ Sarah Nelson, MD who created the original group nutrition class curriculum and pamphlets
§ WK’s Executive Director Anne Kraemer Díaz and Medical Director Waleska López, MD for
their input and review of revised protocols and instruments
§ Neftali Sacuj for his help and patience with revising OpenMRS and facilitating data
extraction
§ Kate Douglas for her organizational prowess, involvement in improving the documentation
system, and feedback
§ Christopher Douglas for creating an Excel document with macros to calculate Z scores
§ Harvard Committee on General Scholarships for funding through the Fredrick Sheldon
Traveling Fellowship

34
References
1. Ministerio de Salud Pública y Asistencia Social (MSPAS), Instituto Nacional de Estadística (INE), ICF International. IV Encuesta Nacional de Salud Materno Infantil 2014-2015. Ciudad de Guatemala, Guatemala. 2015 Nov. 87 p.
2. World Food Programme. Guatemala: Current issues and what the World Food Programme is doing [Internet]. 2017 [cited 2017 Feb 18]. Available from: https://www.wfp.org/countries/guatemala
3. World Food Programme. WFP Guatemala: country brief [Internet]. 2017 Jan [cited 2017 Feb 18]. Available from: http://documents.wfp.org/stellent/groups/public/ documents/ep/wfp272220.pdf?_ga=1.82464095.896590275.1486163515
4. The World Bank, DataBank, World Development Indicators [Internet]. World Bank Group. 2016. Prevalence of stunting, height for age (% of children under 5) Guatemala 2000-2016. [Data last updated 2017 Feb 1, Data downloaded and cited 2017 Feb 3]. Available from: http://databank.worldbank.org/data/reports.aspx?source=2&series=SH. STA.STNT.ZS&country=# 5. Leatherman S, Ferris TG, Berwick D, Omaswa F, Crisp N. The role of quality improvement in strengthening health systems in developing countries. Int J Qual Health Care. 2010;22(4):237-243. doi: 10.1093/intqhc/mzq028
6. Ogrinc G, Davies L, Goodman L, Batalden P, Davidoff, Steven D. SQUIRE 2.0 (Standards for QUality Improvement Reporting Excellence): revised publication guidelines from a detailed consensus process. BMJ Qual Saf. 2016;25:986-992. doi:10.1136/bmjqs-2015-004411
7. Necochea E, Tripathi V, Kim Y, Akram N, Hyjazi Y, Vaz M, et al. Implementation of the standards-based management and recognition approach to quality improvement in maternal, newborn, and child health programs in low-resource countries. In J Gynaecol Obstet. 2015;130:S17–S24. doi:10.1016/j.ijgo.2015.04.003
8. Peters DH, Tran NT, Adam T. Implementation research in health: a practical guide. Alliance for Health Policy and Systems Research. Geneva (Switzerland): World Health Organization; 2013. 69 p.
9. Peters DH, Adam T, Alonge O, Agyepong IA, Tran N. Implementation research: what it is and how to do it. BMJ. 2013;347:f6753 doi: 10.1136/bmj.f6753
10. Allen JD, Linnan LA, Emmons KM. Dissemination and Implementation Research in Health: Translating Science to Practice [Internet]. Oxford University Press; c2012. Chapter 14: Fidelity and Its Relationship to Implementation Effectiveness, Adaptation, and Dissemination. [cited 2015 Apr 13]. Available from: www.oxfordscholarship.com

35
11. Farley Webb M, Chary AN, De Vries TT, Davis S, Dykstra M, Flood D, Haley Rhodes M, Rohloff P. Exploring mechanisms of food insecurity in indigenous agricultural communities in Guatemala: a mixed methods study. BMC Nutrition. 2016 Aug 23;2:55. DOI: 10.1186/s40795-016-0091-5.
12. Brown K, Henretty N, Chary A, Webb MF, Wehr H, Moore J, Baird C, Díaz AK, Rohloff P. Mixed-methods study identifies key strategies for improving infant and young child feeding practices in a highly stunted rural indigenous population in Guatemala. Matern Child Nutr. 2016;12:262–277. doi: 10.1111/mcn.12141.
13. Chary A, Messmer S, Sorenson E, Henretty N, Dasgupta S, & Rohloff P. The normalization of childhood disease: an ethnographic study of child malnutrition in rural Guatemala. Human Organization. 2013;72(2):87–97.
14. Black RE, Victora CG, Walker SP, Bhutta ZA, Christian P, de Onis M, et al. Maternal and child undernutrition and overweight in low-income and middle-income countries. Lancet. 2013;382(9890):427-451.
15. World Health Organization Multicentre Growth Reference Study Group. Child growth standards [Internet]. Geneva: World Health Organization. 2006 [cited 2017 Jan 7]. Available from: http://www.who.int/childgrowth/standards/technical_report/en/
16. Bhutta ZA, Ahmed T, Black RE, Cousens S, Dewey K, Giugliani E, Haider BA, Kirkwood B, Morris SS, Sachdev HPS, Shekar M. What works? Interventions for maternal and child undernutrition and survival. Lancet. 2008;371:417-40. DOI:10.1016/S0140- 6736(07)61693-6
17. Manary MJ & Sandige HL. Management of acute moderate and severe childhood malnutrition. BMJ. 2008;337:a2180. doi:10.1136/bmj.a2180
18. Provost LP, Murray SK. The health care data guide: Learning from data for improvement. San Francisco (CA): Jossey-Bass, c2011. Chapter 3: Understanding variation using run charts. in Part 1: Using data for improvement.
19. Perla RJ, Provost LP, Murray SK. The run chart: a simple analytical tool for learning from variation in healthcare processes. BMJ Qual Saf. 2011;20:46-51. Doi:10.1136/bmjqs.2009.037895
20. National Health Service (NHS) Scotland. “Run Chart.” Quality Improvement Hub. 2017 . [cited 2017 Feb 25]. Available from: http://www.qihub.scot.nhs.uk/knowledge-centre/quality-improvement-tools/run-chart.aspx
21. Scoville R. Run chart template v. 2.0. Microsoft Excel. May 30, 2016. Downloaded from ihi.org

36
22. World Health Organization. WHO Anthropometry calculator and macros version 3.2.2 January 2011. Available at http://www.who.int/childgrowth/software/en/
23. Cáritas del Perú y Ministerio de Salud. Carnet de Crecimiento y Desarrollo. [cited 2016 April]. Available from: http://www.caritas.org.pe/documentos/carnet_nino.pdf
24. World Health Organization. IMCI Integrated Management of Childhood Illness. Distance Learning Course: Module 4. Diarrea [Internet]. 2014 [cited 2016 May 10]. Available from: http://apps.who.int/iris/bitstream/10665/104772/6/9789241506823_ Module-4_eng.pdf ISBN 978 92 4 150682 3
25. Castillo M. Drought heightens seasonal food scarcity in Guatemala. News OK. Associate Press. published 2016 Jun 13 [cited 2017 Feb 18]. Available from: http://newsok.com/article/feed/1026811
26. Portela MC, Pronovost PJ, Woodcock T, Carter P, Dixon-Woods M. How to study improvement interventions: a brief overview of possible study types. BMJ Quality & Safety. 2015;24(5):325-336. doi:10.1136/bmjqs-2014-003620.
27. Anhoj J. Diagnostic value of run chart analysis: using likelihood rules to compare run chart rules on simulated data series. PLoS ONE. 2015;10(3):e0121349.
28. Institute for Healthcare Improvement. “How to improve: Science of improvement: Establishing measures.” 2017 [cited 2017 Feb 27]. Available from: http://www.ihi.org/resources/Pages/HowtoImprove/ScienceofImprovementEstablishingMeasures.aspx
29. Chary AN, Messmer SE, Rohloff PJ. Male influence on infant feeding in rural Guatemala and implications for child nutrition interventions. Breastfeed Med. 2011 Aug;6(4):227-31. doi: 10.1089/bfm.2011.0015.
30. van Deventer C, Robert G, Wright A. Improving childhood nutrition and wellness in South Africa: involving mothers/caregivers of malnourished or HIV positive children and health care workers as co-designers to enhance a local quality improvement intervention. BMC Health Serv Res. 2016 Aug 5;16(a):358. doi: 10.1186/s12913-016-1574-4

37
APPENDICES
• Consejos y Mensajes Claves Basados en Respuestas de Recuento Dietético v.24.feb.2016
(p.38)
o English version: Advice and Key Messages based on Responses to Dietary Recall –
version 24.Feb.2016 (p.39)
• Pasos con cada medida de crecimiento v.16.05.2016 (p.40-41)
o English version: Steps with every growth measurement - version 16.May.2016 (p.42-43)
• Observación de la Técnica Antropométrica (created by Dr. Boris Martinez) (p.44)
o English version: Observation of Anthropometric Technique (p.45)
• Acute v Chronic Malnutrition “Cheat Sheet” in Spanish (p.46) and English (p.47)

38

39

40
Pasos cada vez que obtenga medidas de crecimiento (peso y talla)
1. Obtener y apuntar medidas (hasta 0.1 kilo o 0.1 cm más cerca) 2. Graficar medidas en carnet o repasar gráfica en OpenMRS de una vez. 3. Calcular y apuntar puntuación Z (Z peso p. edad, Z talla/longitud p. edad, Z peso p. talla/longitud) de una vez. 4. Interpretar medidas de una vez. A. ¿Cómo está la talla del niño desde la última visita? ☐ Ha aumentado ☐ Se mantiene igual B. ¿Cómo está el peso el niño desde la última visita? ☐ Ha aumentado ☐ Se mantiene igual à Si no ha subido por más de 3 meses à llamar a nutricionista y programar para cita con médico ☐ Ha disminuido à Si pérdida de peso continúa por 3 meses o más –O- ha perdido más de 0.3 kilos à llamar a nutricionista y al médico de su comunidad y programmar para cita con médico 5. Interpretar puntuación Z A. Revisar Z talla/longitud por edad: ☐ Z entre -2 y -3 (retraso de crecimiento moderada) à Si tiene menos de 24 meses de edad y nunca ha recibido víveres, Watsiar. ☐ Z por debajo de -3 (retraso de crecimiento severo) à Si tiene menos de 24 meses de edad y nunca ha recibido víveres, Watsiar. ☐ Mejorando é ☐ Empeorando ê ☐ Igual ** ¡Ojo! Cualquier niño/a menor de 60 meses con Z talla/longitud por edad por debajo de -4.0, debe tener cita con un médico. B. Revisar Z peso por talla/longitud: ☐ Z entre -2 y -3 (desnutrición AGUDA MODERADA) à llamar a nutricionista AHORITA y si niño identificado con desnutrición aguda moderada por primera vez, llama al médico de su comunidad también ☐ Z por debajo de -3 (desnutrición AGUDA SEVERA) à llamar a nutricionista y al médico de su comunidad AHORITA, programar para cita, y notificar al Centro de Salud mismo día ☐ Mejorando é ☐ Empeorando ê à Si tiene Z peso p talla entre -1.8 y -2.0, llamar a nutricionista ☐ Igual C. Revisar Z peso por edad: ☐ Mejorando é ☐ Z entre -2 y -3 (bajo peso moderado) ☐ Empeorando ê ☐ Z por debajo de -3 (bajo peso severo) ☐ Igual

41
6. Interpretar gráfica A. ¿Cuál es la tendencia de crecimiento del niño en gráfica de talla/longitud por edad? ☐ Cruzando líneas hacia arriba ☐ Sigue la curva ☐ Estancado (es decir empeorando) B. ¿Cuál es la tendencia de crecimiento del niño en gráfica de peso por talla/longitud? ☐ Cruzando líneas hacia arriba ☐ Sigue la curva ☐ Estancado (es decir empeorando) C. ¿Cuál es la tendencia de crecimiento del niño en gráfica de peso por edad? ☐ Cruzando líneas ☐ Sigue la curva ☐ Estancado (signo de peligro) ☐ Bajando (empeorando = peligro) 7. Explicar crecimiento a la madre.
• Medidas o Peso - mejor, igual, o peor? o Talla - mejor o igual?
• Gráficas – mejorando, igual, empeorando? • Tipo(s) de desnutrición que tiene y si está mejorando, sigue igual, o empeorando
8. Necesita una cita con el médico? ☐ Sí, urgente à llamar al médico de su comunidad (si no contesta, llamar a Directora Médica) para consejos y mandar al Centro de Salud ahorita ☐ Sí, pero no urgente à programar para cita ☐ No

42
Steps with every growth measurement (weight and height)
1. Obtain and record the measurement (to the nearest 0.1 kilogram or 0.1 centimeter). 2. Graph the measurement on the paper chart or review the graph in OpenMRS immediately. 3. Calculate and record the Z scores immediately (weight-for-age Z score, height/length-for-age Z score, weight-for-height/length Z score). 4. Interpret the measurement immediately. A. How is the child’s height since the last visit? ☐ It has increased. ☐ It has remained the same. B. How is the child’s weight since the last visit? ☐ It has increased ☐ It is the same. à If the child’s weight has not increased for more than 3 months, call the nutritionist and schedule a doctor’s appointment! ☐ It has decreased à If the weight loss has continued for 3 or more months –OR- the child has lost more than 0.3 kilograms, call the nutritionist and the medical doctor assigned to your community and schedule a doctor’s appointment! 5. Interpret the Z scores. A. Review the height/length-for-age Z score: ☐ Z between -2 y -3 (moderate stunting) à If the child is less than 24 months old and has never received food supplementation, enroll in recuperative program. ☐ Z less than -3 (severe stunting) à If the child is less than 24 months old and has never received food supplementation, enroll in recuperative program. ☐ Improving é ☐ Worsening ê ☐ Unchanged ** Attention! Any child less than 5 years old (60 months), with a height/length-for-age Z score less than -4.0, needs a doctor’s appointment. B. Review the weight-for-height/length Z score: ☐ Z between -2 and -3 (MODERATE ACUTE malnutrition) à call the nutritionist NOW and if this is the first time the child has been identified as having moderate acute malnutrition, also call the doctor assigned to your community. ☐ Z less than -3 (SEVERE ACUTE malnutrition) à call the nutritionist and the doctor assigned to your community NOW, schedule a doctor’s appointment, and notify the government Health Center the same day. ☐ Improving é ☐ Worsening ê à If the weight-for-height/length Z score is between -1.8 and -2.0, call the nutritionist. ☐ Unchanged

43
C. Review the weight-for-age Z (WAZ) score: ☐ Improving é ☐ WAZ between -2 and -3 (moderately underweight) ☐ Worsening ê ☐ WAZ less than -3 (severely underweight) ☐ Unchanged 6. Interpret the graphs. A. What is the growth trend on the height/length-for-age graph? ☐ Crossing lines upward ☐ Continues in the same curve/slope ☐ At a standstill (that is to say worsening) B. What is the growth trend on the weight-for –height/length graph? ☐ Crossing lines upward ☐ Continues in the same curve/slope ☐ At a standstill (that is to say worsening) C. What is the growth trend on the weight-for-age graph? ☐ Crossing lines upward ☐ Continues in the same curve/slope ☐ At a standstill (sign of danger) ☐ Downward (worsening = danger) 7. Explain the growth to the caregiver.
• Measurements o Weight – better, same, or worse? o Height – better or same?
• Graphs – better, same, worse? • Type(s) of malnutrition that the child has and if improving, same, or worsening.
8. Does the child need a doctor’s appointment? ☐ Yes, urgently à Call the doctor assigned to your community (if the doctor does not answer, call the Medical Director) for advice, and send the child to the nearest health center now! ☐ Yes, but it’s not urgent. à Schedule an appointment ☐ No

44
Observación de la Técnica Antropométrica
Medida 1 Bien 0 Mal
PESO LONGITUD
1 2 3 1 2 3
1 Posición del equipo
2 Ajuste a cero
3 Ropa
4 Actitud del niño
5 Posición del niño
6 Tiempo de lectura
7 Angulo de lectura
8
Valor de medidor apuntado hasta 0.1 cm o 0.1 kilo más cercano
9 Valor acertado
VA
LO
R
Valor medidor . . . . . . Valor Observador . . . . . . Diferencia
. . . . . .
10 Anotación correcta de puntos en las graficas 1 Si 2 No
11 Explicación del resultado de peso y talla
12 Dibujo de la curva de crecimiento
13 Explicación de la tendencia
Observaciones:

45
Observation of Anthropometric Technique
Measure 1Good 0 Bad
Weight Length/Height
1 2 3 1 2 3
1 Positioning of equipment
2 Balance zeroed
3 Appropriate amount of clothing
4 Child’s behavior
5 Positioning of child
6 Reading time 7 Reading angle
8 Value recorded to nearest 0.1cm or 0.1 kg
9 Accurate Value
VA
LU
E
Value measured . . . . . . Value observed
. . . . . . Difference
. . . . . .
10 Correct plotting of the data points on the graph 1 Yes 2 No
11 Weight and height explained to care provider
12 Drawing of growth curve
13 Explanation of growth trend (improving, worsening, same)
Observations:

46

47