quality improvement professional development … · quality improvement – professional...
TRANSCRIPT

California Department of Education
Early Education and Support Division
Quality Improvement Office
Quality Improvement—Professional Development
Participation Report
2013-14 Tracking and Reporting of
Training Participants and Training Activities
March 2015
Reported by:
Child Development Training Consortium
Yosemite Community College District
Quality Improvement – Professional Development Training Participants Table of Contents
Introduction and History 1 2013-14 Data Comparison 2 Report Details 3 Professional Development Provider (PDP), Abbreviation, & Delivery Type 5 Regions, by County 6 Table 1: Quality Improvement (QI) Professional Development (PD) Training Participants 7 I. Quality Improvement - Professional Development Training Participants: Training
Attendance Aggregate of Direct Service & Infrastructure
F-1 Number of Participants by Training Activity Category 8 F-2 Number of Participants Attending 1, 2, or 3-Plus Trainings 9
II. Quality Improvement (QI) Professional Development (PD) Training Participants Working in Direct Service Programs
Section 1: Employment Characteristics of QI-PD Training Participants Working in Direct Service Programs
F-3 Employment Setting 10 F-4 Employment Setting, by Region 11 F-5 Employment Setting, by Professional Development Provider 12 F-6 Primary Job Position for Center Staff 13 F-7 Primary Job Position for Family Child Care 14 F-8 Primary Job Position for Center Staff, by Region 15 F-9 Primary Job Position for Center Staff, by Professional Development Provider 16 F-10 Caring for Dual Language Learners (DLL) 17
F-11 Caring for DLL, by Primary Job Position 18 F-12 Caring for DLL, by Region 19 F-13 Caring for DLL, by Professional Development Provider 20
F-14 Caring for Children with an Individualized Family Service Plan (IFSP) or Individualized Education Plan (IEP)
21
F-15 Caring for Children with an IFSP or IEP, by Primary Job Position 22 F-16 Caring for Children with an IFSP or IEP, by Region 23 F-17 Caring for Children with an IFSP or IEP, by Professional Development Provider 24 F-18 Number of Paid Hours Worked per Week 25 F-19 Number of Months Worked per Year 26
Table 2: Tenure in the ECE Field; with Current Employer; and in Current Job Position 27 Table 3: Mean Hourly Wages and Full-Time Equivalent Salary, by Primary Job Position 28 Section 2: Educational and Permit Level of QI-PD Training Participants Working in Direct Service Programs
F-20 Highest Level of Education 29 F-21 Highest Level of Education, by Primary Job Position 30 F-22 Highest Level of Education, by Region 31 F-23 Highest Level of Education, by Professional Development Provider 32 F-24 Current Permit Level 33
F-25 Current Permit Level, by Primary Job Position 34 F-26 Current Permit Level, by Professional Development Provider 35
Section 3: Demographic Characteristics of QI-PD Training Participants Working in Direct Service Programs
F-27 Gender 36 F-28 Race/Ethnicity 37 F-29 Race/Ethnicity, by Primary Job Position 38 F-30 Age 39 F-31 Age, by Primary Job Position 40 F-32 Language Fluency 41 F-33 Language Fluency, by Primary Job Position 42 F-34 Language Fluency, by Region 43 F-35 Language Fluency, by Professional Development Provider 44
III. Quality Improvement (QI) Professional Development (PD) Training Participants Working in Infrastructure Programs
Section 1: Employment Characteristics of QI-PD Training Participants Working in Infrastructure Programs
F-36 Employment Setting 45 F-37 Primary Job Position 46 F-38 Number of Paid Hours Worked per Week 47 F-39 Number of Months Worked per Year 48
Table 4: Tenure in the ECE Field; with Current Employer; and Current Job Position 49 Table 5: Mean Hourly Wages and Full-Time Equivalent Salaries, by Primary Job Position 50 Section 2: Educational and Permit Level of QI-PD Training Participants Working in Infrastructure Programs
F-40 Highest Level of Education 51 F-41 Highest Level of Education, by Primary Job Position 52 F-42 Highest Level of Education, by Professional Development Provider 53 F-43 Current Permit Level 54 F-44 Current Permit Level, by Primary Job Position 55 F-45 Current Permit Level, by Professional Development Provider 56
Section 3: Demographic Characteristics of QI-PD Training Participants Working in Infrastructure Programs
F-46 Gender 57 F-47 Race/Ethnicity 58 F-48 Race/Ethnicity, by Primary Job Position 59 F-49 Age 60 F-50 Age, by Primary Job Position 61 F-51 Languages Spoken Fluently 62 F-52 Languages Spoken Fluently, by Primary Job Position 63
Appendices A-1 Glossary of Terms: Professional Development Delivery Types 64 A-2 Professional Development Provider Contact Information 65
2013-14 QI-PD Participation Report, March 2015 1
Introduction and History
California continues to allocate a portion of its federal Child Care and Development Fund (CCDF) dollars to support professional development in the Early Learning System in the form of quality improvement activities. Quality investments and support systems that promote continuous quality improvement of both programs and the staff who work in them are a core element of CCDF. In 2013, the federal mandate is that at least four percent of CCDF funds are allocated to improve the quality of child care. The California Department of Education (CDE), Early Education and Support Division (EESD) provides high quality trainings and incentives with the four percent set aside of quality funds, many of which focus on professional development for the early care and education workforce.
In 2010, the CDE, EESD developed a standardized quality improvement participant registration form, the Professional Development (PD) Profile, to be completed by all early childhood educators participating in the EESD quality funded professional development activities. There are two versions of the PD Profile. One is the Direct Service Profile that is designed to collect the pertinent data of staff working directly with children. The other, the Infrastructure Profile, is designed for use by infrastructure practitioners in the field such as trainers, faculty, and others that assist or train the direct service providers. These EESD Profiles include standard data on participants’ demographics, education and training background, and employment. The form also allows for specific information needed by the individual EESD contractors who provide the professional development activities or trainings.
The data collected through the Direct Service and Infrastructure PD Profiles is now aggregated annually into the EESD Quality Improvement—Professional Development (QI-PD) Participation Report that tracks and reports information on the professional development providers, the training participants, and training/professional development activities. The data for the report are tracked and collected by the EESD contractors that conduct the activities, and the annual report is developed by the Child Development Training Consortium (CDTC).
This report is the state’s first attempt at looking across all EESD funded trainings to learn more about how the participants utilize the trainings and also to gather more information about the characteristics of the workforce. The report is beginning to demonstrate the effectiveness of the Quality Improvement Professional Development activities as a whole and indicates that many early care and education professionals utilize more than one activity. For example, in 2013-14, of the 32,272 participants attending trainings, fourteen percent participated in two training categories, and sixteen percent in three or more. This confirms that the EESD funded trainings are accessible to the workforce, who are using this system to advance their careers and expertise in early education.
This is the third year of tracking this information and the report is displaying similar information across the years, which supports the validity of the data. The prior year report, the 2012-13 Tracking and Reporting of QI-PD Training Participants and Activities, is considered baseline for future reports. These data are a comprehensive representation of the activities of the QI-PD’s.
2013-14 QI-PD Participation Report, March 2015 2
There are some notable comparisons to the 2011-12 data, 2012-13 data, and the data presented in this 2013-14 report.
2013-14 Data Comparison
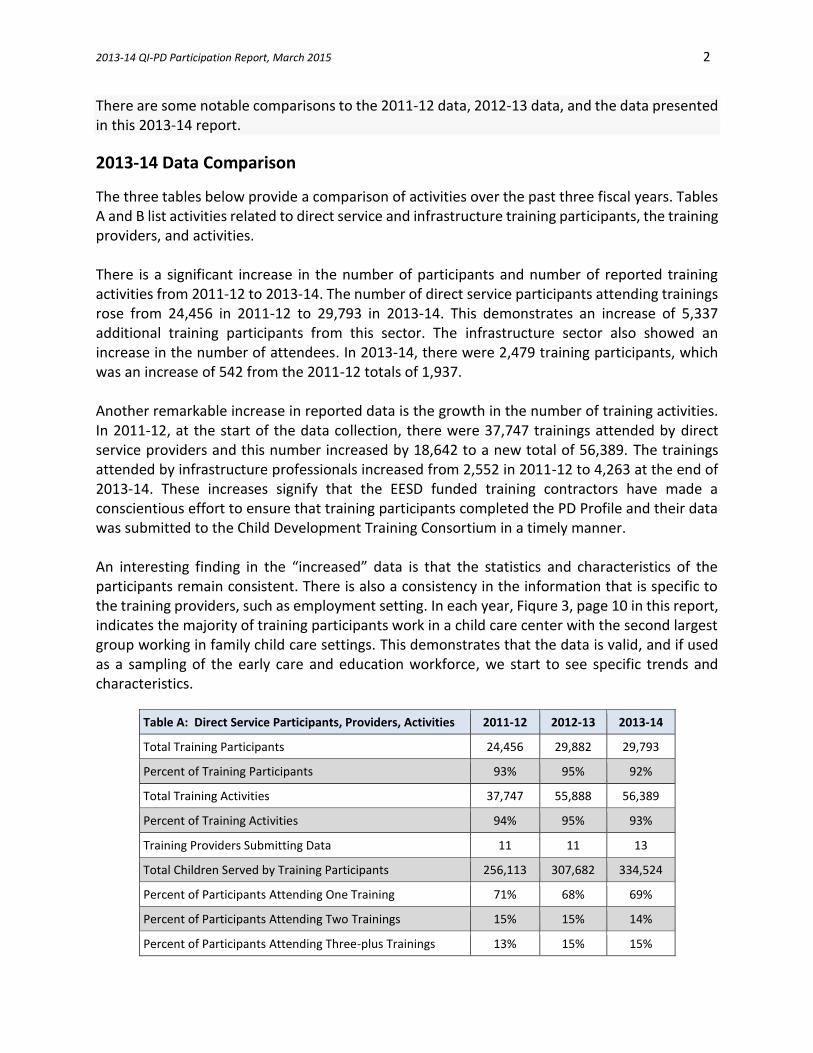
The three tables below provide a comparison of activities over the past three fiscal years. Tables A and B list activities related to direct service and infrastructure training participants, the training providers, and activities.
There is a significant increase in the number of participants and number of reported training activities from 2011-12 to 2013-14. The number of direct service participants attending trainings rose from 24,456 in 2011-12 to 29,793 in 2013-14. This demonstrates an increase of 5,337 additional training participants from this sector. The infrastructure sector also showed an increase in the number of attendees. In 2013-14, there were 2,479 training participants, which was an increase of 542 from the 2011-12 totals of 1,937.
Another remarkable increase in reported data is the growth in the number of training activities. In 2011-12, at the start of the data collection, there were 37,747 trainings attended by direct service providers and this number increased by 18,642 to a new total of 56,389. The trainings attended by infrastructure professionals increased from 2,552 in 2011-12 to 4,263 at the end of 2013-14. These increases signify that the EESD funded training contractors have made a conscientious effort to ensure that training participants completed the PD Profile and their data was submitted to the Child Development Training Consortium in a timely manner.
An interesting finding in the “increased” data is that the statistics and characteristics of the participants remain consistent. There is also a consistency in the information that is specific to the training providers, such as employment setting. In each year, Fiqure 3, page 10 in this report, indicates the majority of training participants work in a child care center with the second largest group working in family child care settings. This demonstrates that the data is valid, and if used as a sampling of the early care and education workforce, we start to see specific trends and characteristics.
Table A: Direct Service Participants, Providers, Activities 2011-12 2012-13 2013-14
Total Training Participants 24,456 29,882 29,793
Percent of Training Participants 93% 95% 92%
Total Training Activities 37,747 55,888 56,389
Percent of Training Activities 94% 95% 93%
Training Providers Submitting Data 11 11 13
Total Children Served by Training Participants 256,113 307,682 334,524
Percent of Participants Attending One Training 71% 68% 69%
Percent of Participants Attending Two Trainings 15% 15% 14%
Percent of Participants Attending Three-plus Trainings 13% 15% 15%
2013-14 QI-PD Participation Report, March 2015 3
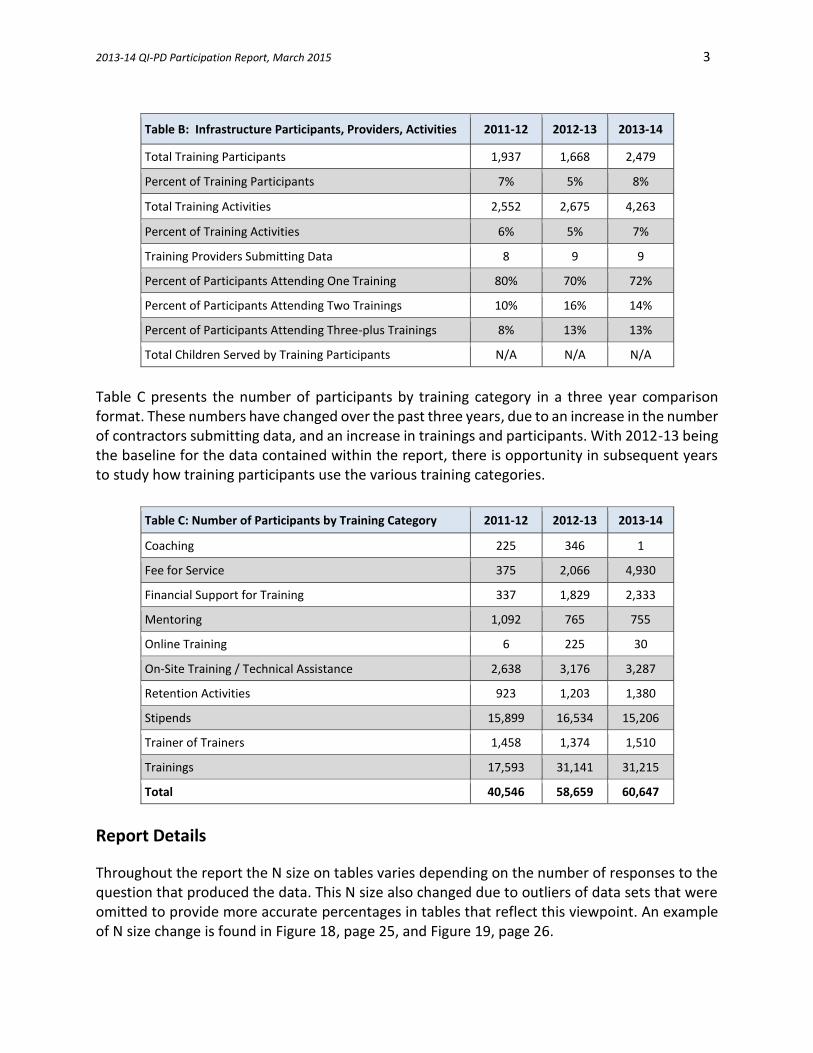
Table B: Infrastructure Participants, Providers, Activities 2011-12 2012-13 2013-14
Total Training Participants 1,937 1,668 2,479
Percent of Training Participants 7% 5% 8%
Total Training Activities 2,552 2,675 4,263
Percent of Training Activities 6% 5% 7%
Training Providers Submitting Data 8 9 9
Percent of Participants Attending One Training 80% 70% 72%
Percent of Participants Attending Two Trainings 10% 16% 14%
Percent of Participants Attending Three-plus Trainings 8% 13% 13%
Total Children Served by Training Participants N/A N/A N/A
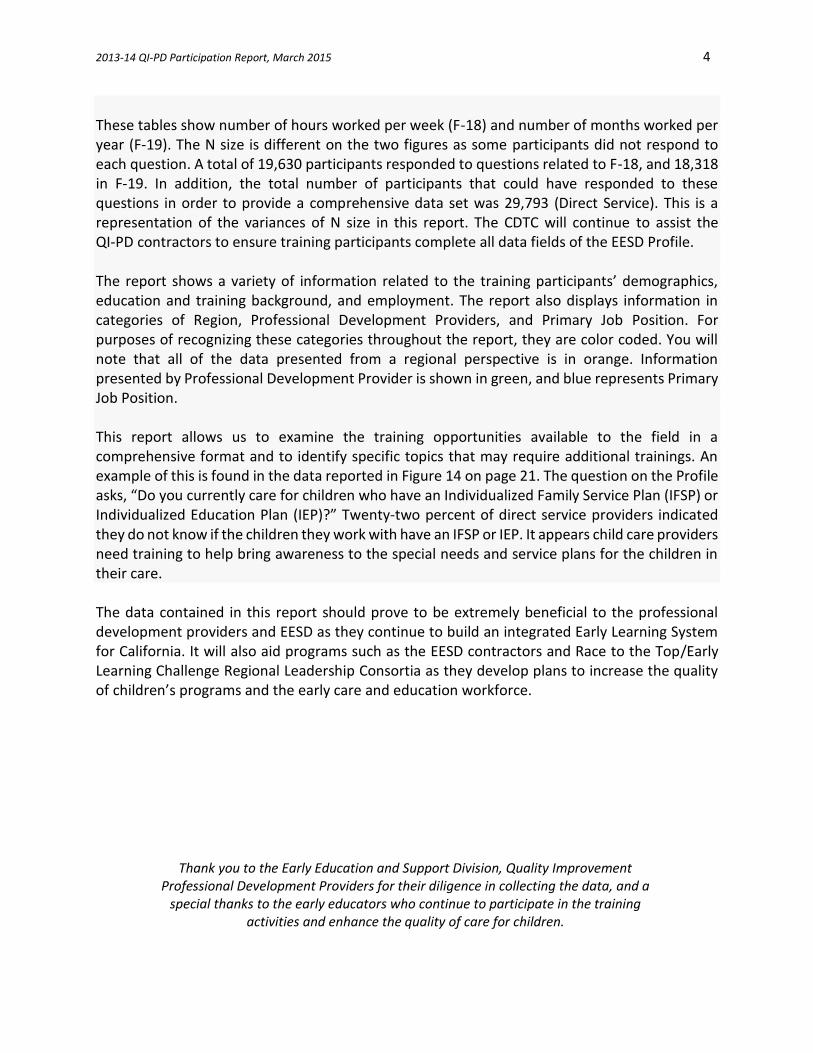
Table C presents the number of participants by training category in a three year comparison format. These numbers have changed over the past three years, due to an increase in the number of contractors submitting data, and an increase in trainings and participants. With 2012-13 being the baseline for the data contained within the report, there is opportunity in subsequent years to study how training participants use the various training categories.
Table C: Number of Participants by Training Category 2011-12 2012-13 2013-14
Coaching 225 346 1
Fee for Service 375 2,066 4,930
Financial Support for Training 337 1,829 2,333
Mentoring 1,092 765 755
Online Training 6 225 30
On-Site Training / Technical Assistance 2,638 3,176 3,287
Retention Activities 923 1,203 1,380
Stipends 15,899 16,534 15,206
Trainer of Trainers 1,458 1,374 1,510
Trainings 17,593 31,141 31,215
Total 40,546 58,659 60,647
Report Details
Throughout the report the N size on tables varies depending on the number of responses to the question that produced the data. This N size also changed due to outliers of data sets that were omitted to provide more accurate percentages in tables that reflect this viewpoint. An example of N size change is found in Figure 18, page 25, and Figure 19, page 26.
2013-14 QI-PD Participation Report, March 2015 4
These tables show number of hours worked per week (F-18) and number of months worked per year (F-19). The N size is different on the two figures as some participants did not respond to each question. A total of 19,630 participants responded to questions related to F-18, and 18,318 in F-19. In addition, the total number of participants that could have responded to these questions in order to provide a comprehensive data set was 29,793 (Direct Service). This is a representation of the variances of N size in this report. The CDTC will continue to assist the QI-PD contractors to ensure training participants complete all data fields of the EESD Profile.
The report shows a variety of information related to the training participants’ demographics, education and training background, and employment. The report also displays information in categories of Region, Professional Development Providers, and Primary Job Position. For purposes of recognizing these categories throughout the report, they are color coded. You will note that all of the data presented from a regional perspective is in orange. Information presented by Professional Development Provider is shown in green, and blue represents Primary Job Position.
This report allows us to examine the training opportunities available to the field in a comprehensive format and to identify specific topics that may require additional trainings. An example of this is found in the data reported in Figure 14 on page 21. The question on the Profile asks, “Do you currently care for children who have an Individualized Family Service Plan (IFSP) or Individualized Education Plan (IEP)?” Twenty-two percent of direct service providers indicated they do not know if the children they work with have an IFSP or IEP. It appears child care providers need training to help bring awareness to the special needs and service plans for the children in their care.
The data contained in this report should prove to be extremely beneficial to the professional development providers and EESD as they continue to build an integrated Early Learning System for California. It will also aid programs such as the EESD contractors and Race to the Top/Early Learning Challenge Regional Leadership Consortia as they develop plans to increase the quality of children’s programs and the early care and education workforce.
Thank you to the Early Education and Support Division, Quality Improvement Professional Development Providers for their diligence in collecting the data, and a
special thanks to the early educators who continue to participate in the training activities and enhance the quality of care for children.
2013-14 QI-PD Participation Report, March 2015 5
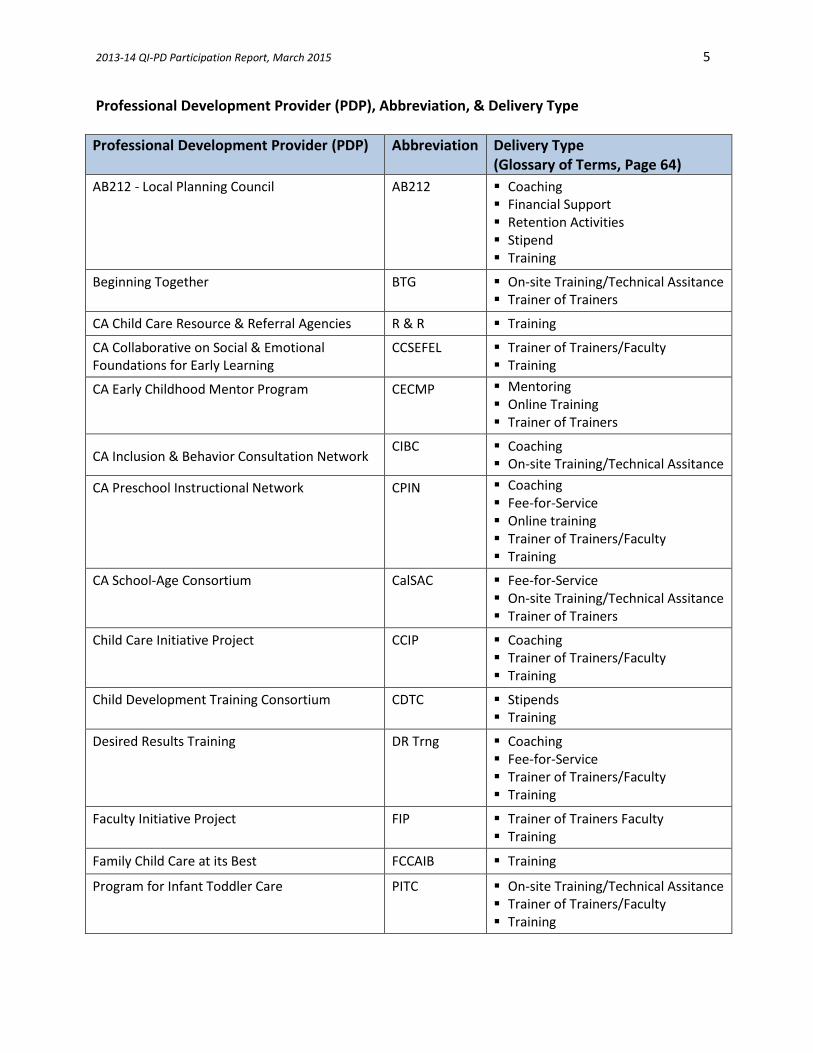
Professional Development Provider (PDP), Abbreviation, & Delivery Type
Professional Development Provider (PDP) Abbreviation Delivery Type (Glossary of Terms, Page 64)
AB212 - Local Planning Council AB212 Coaching Financial Support Retention Activities Stipend Training
Beginning Together BTG On-site Training/Technical Assitance Trainer of Trainers
CA Child Care Resource & Referral Agencies R & R Training
CA Collaborative on Social & Emotional Foundations for Early Learning
CCSEFEL Trainer of Trainers/Faculty Training
CA Early Childhood Mentor Program CECMP Mentoring Online Training Trainer of Trainers
CA Inclusion & Behavior Consultation Network CIBC Coaching
On-site Training/Technical Assitance
CA Preschool Instructional Network CPIN Coaching Fee-for-Service Online training Trainer of Trainers/Faculty Training
CA School-Age Consortium CalSAC Fee-for-Service On-site Training/Technical Assitance Trainer of Trainers
Child Care Initiative Project CCIP Coaching Trainer of Trainers/Faculty Training
Child Development Training Consortium CDTC Stipends Training
Desired Results Training DR Trng Coaching Fee-for-Service Trainer of Trainers/Faculty Training
Faculty Initiative Project FIP Trainer of Trainers Faculty Training
Family Child Care at its Best FCCAIB Training
Program for Infant Toddler Care PITC On-site Training/Technical Assitance Trainer of Trainers/Faculty Training
2013-14 QI-PD Participation Report, March 2015 6
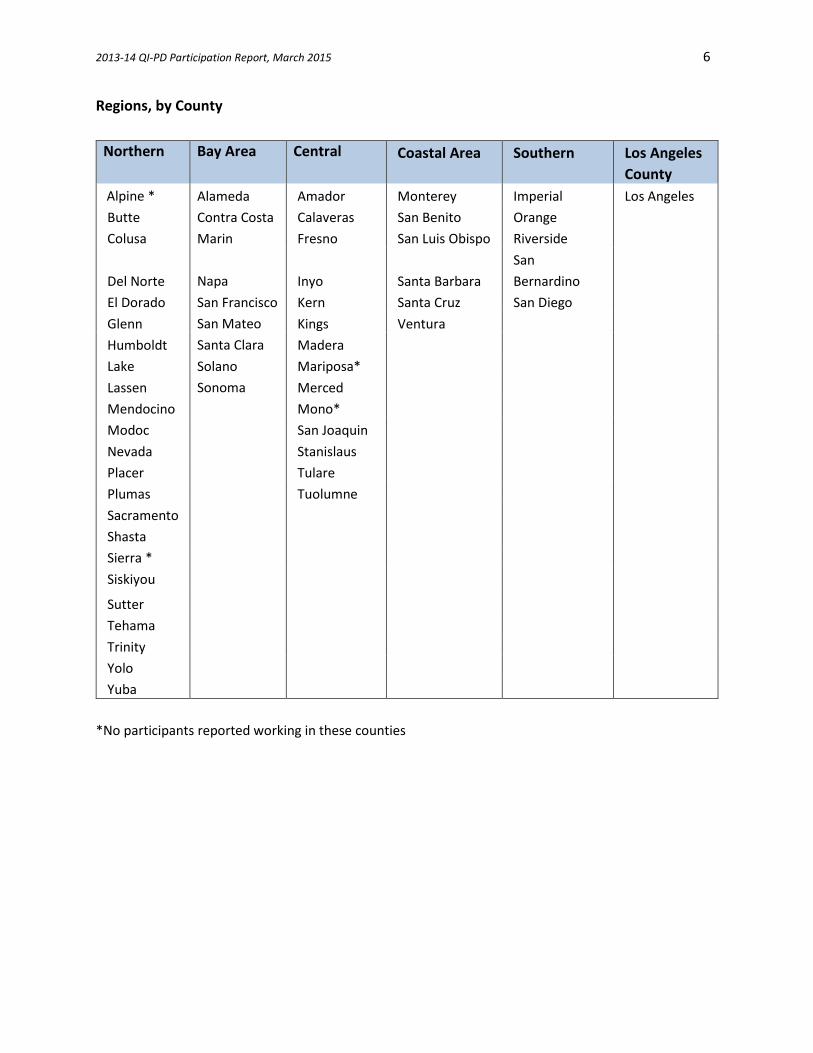
Regions, by County
Northern Bay Area Central Coastal Area Southern Los Angeles
County
Alpine * Alameda Amador Monterey Imperial Los Angeles
Butte Contra Costa Calaveras San Benito Orange
Colusa Marin Fresno San Luis Obispo Riverside
Del Norte Napa Inyo Santa Barbara
San
Bernardino
El Dorado San Francisco Kern Santa Cruz San Diego
Glenn San Mateo Kings Ventura
Humboldt Santa Clara Madera
Lake Solano Mariposa*
Lassen Sonoma Merced
Mendocino Mono*
Modoc San Joaquin
Nevada Stanislaus
Placer Tulare
Plumas Tuolumne
Sacramento
Shasta
Sierra *
Siskiyou
Sutter
Tehama
Trinity
Yolo
Yuba
*No participants reported working in these counties
2013-14 QI-PD Participation Report, March 2015 7
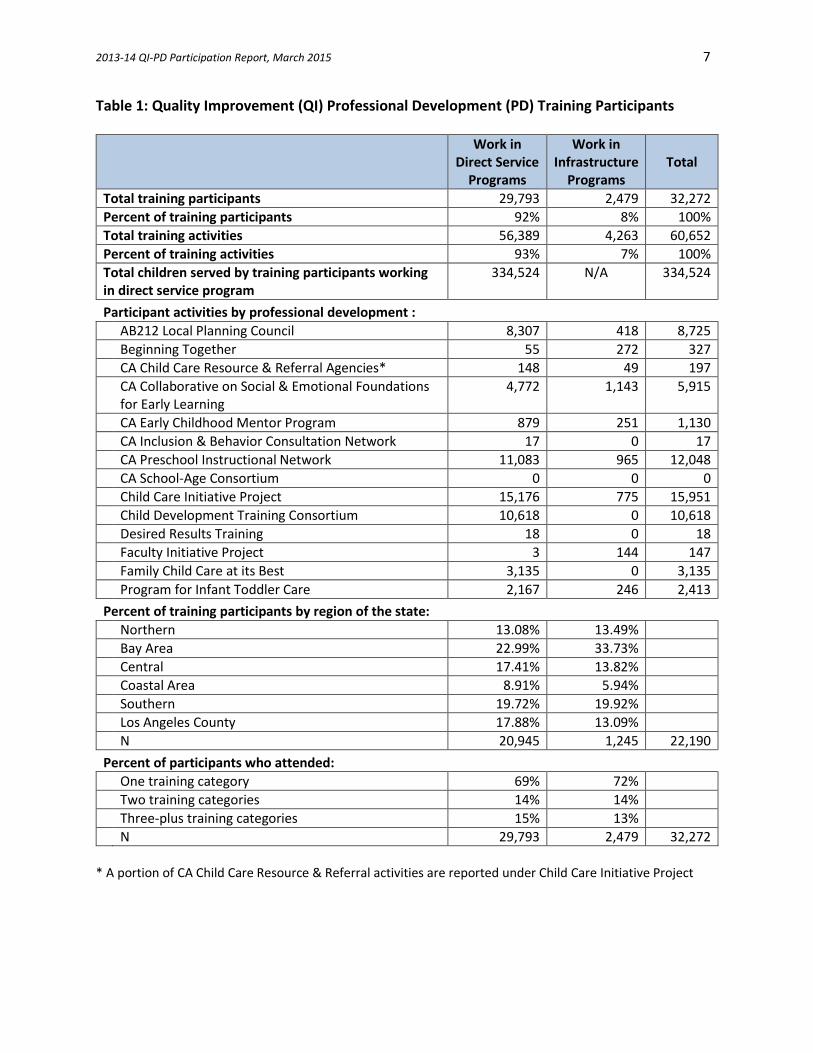
Table 1: Quality Improvement (QI) Professional Development (PD) Training Participants
Work in Direct Service
Programs
Work in Infrastructure
Programs Total
Total training participants 29,793 2,479 32,272
Percent of training participants 92% 8% 100%
Total training activities 56,389 4,263 60,652
Percent of training activities 93% 7% 100%
Total children served by training participants working in direct service program
334,524 N/A 334,524
Participant activities by professional development :
AB212 Local Planning Council 8,307 418 8,725
Beginning Together 55 272 327
CA Child Care Resource & Referral Agencies* 148 49 197
CA Collaborative on Social & Emotional Foundations for Early Learning
4,772 1,143 5,915
CA Early Childhood Mentor Program 879 251 1,130
CA Inclusion & Behavior Consultation Network 17 0 17
CA Preschool Instructional Network 11,083 965 12,048
CA School-Age Consortium 0 0 0
Child Care Initiative Project 15,176 775 15,951
Child Development Training Consortium 10,618 0 10,618
Desired Results Training 18 0 18
Faculty Initiative Project 3 144 147
Family Child Care at its Best 3,135 0 3,135
Program for Infant Toddler Care 2,167 246 2,413
Percent of training participants by region of the state:
Northern 13.08% 13.49%
Bay Area 22.99% 33.73%
Central 17.41% 13.82%
Coastal Area 8.91% 5.94%
Southern 19.72% 19.92%
Los Angeles County 17.88% 13.09%
N 20,945 1,245 22,190
Percent of participants who attended:
One training category 69% 72%
Two training categories 14% 14%
Three-plus training categories 15% 13%
N 29,793 2,479 32,272
* A portion of CA Child Care Resource & Referral activities are reported under Child Care Initiative Project
2013-14 QI-PD Participation Report, March 2015 8
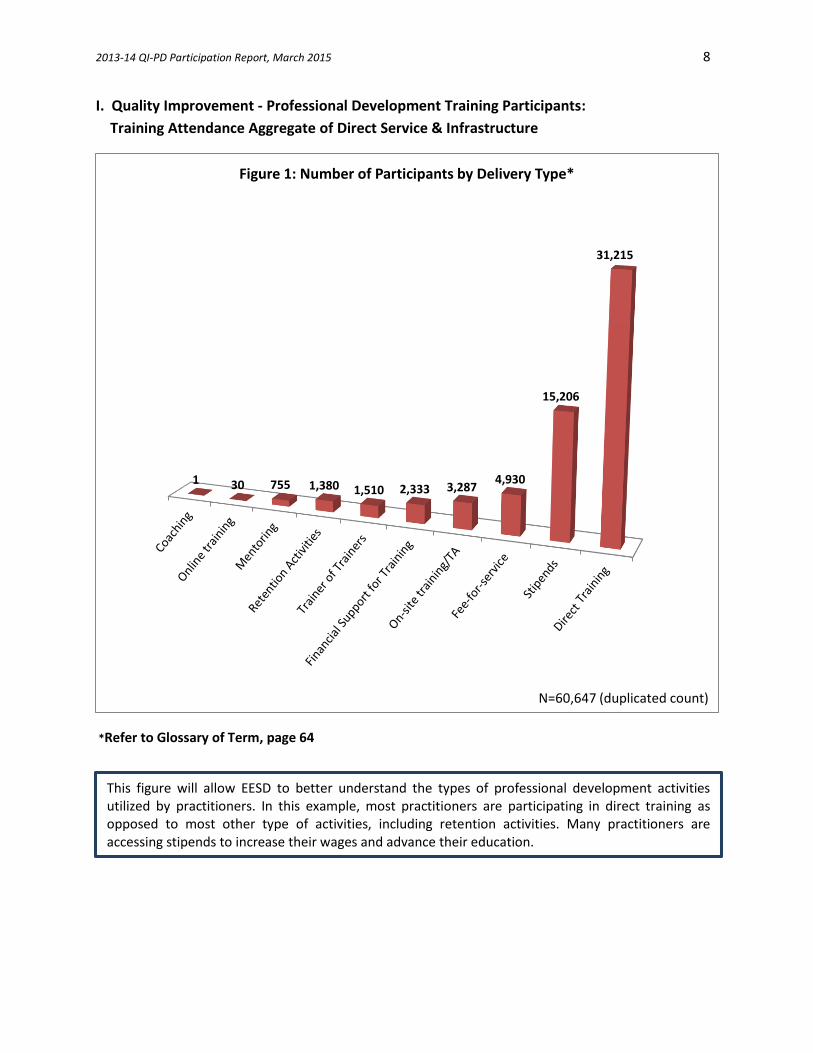
I. Quality Improvement - Professional Development Training Participants:
Training Attendance Aggregate of Direct Service & Infrastructure
1 30 755 1,380 1,510 2,333 3,2874,930
15,206
31,215
Figure 1: Number of Participants by Delivery Type*
N=60,647 (duplicated count)
*Refer to Glossary of Term, page 64
This figure will allow EESD to better understand the types of professional development activities utilized by practitioners. In this example, most practitioners are participating in direct training as opposed to most other type of activities, including retention activities. Many practitioners are accessing stipends to increase their wages and advance their education.
2013-14 QI-PD Participation Report, March 2015 9
69%
14%
16%
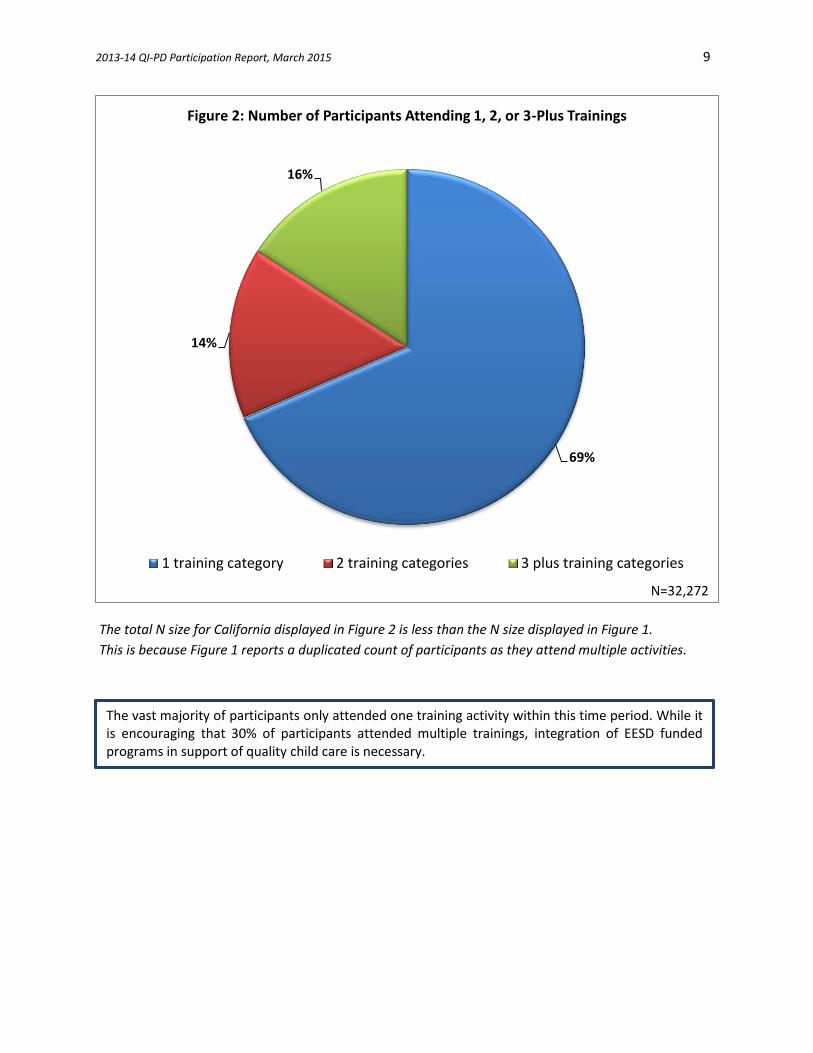
Figure 2: Number of Participants Attending 1, 2, or 3-Plus Trainings
1 training category 2 training categories 3 plus training categories
N=32,272
The total N size for California displayed in Figure 2 is less than the N size displayed in Figure 1.
This is because Figure 1 reports a duplicated count of participants as they attend multiple activities.
The vast majority of participants only attended one training activity within this time period. While it is encouraging that 30% of participants attended multiple trainings, integration of EESD funded programs in support of quality child care is necessary.
2013-14 QI-PD Participation Report, March 2015 10
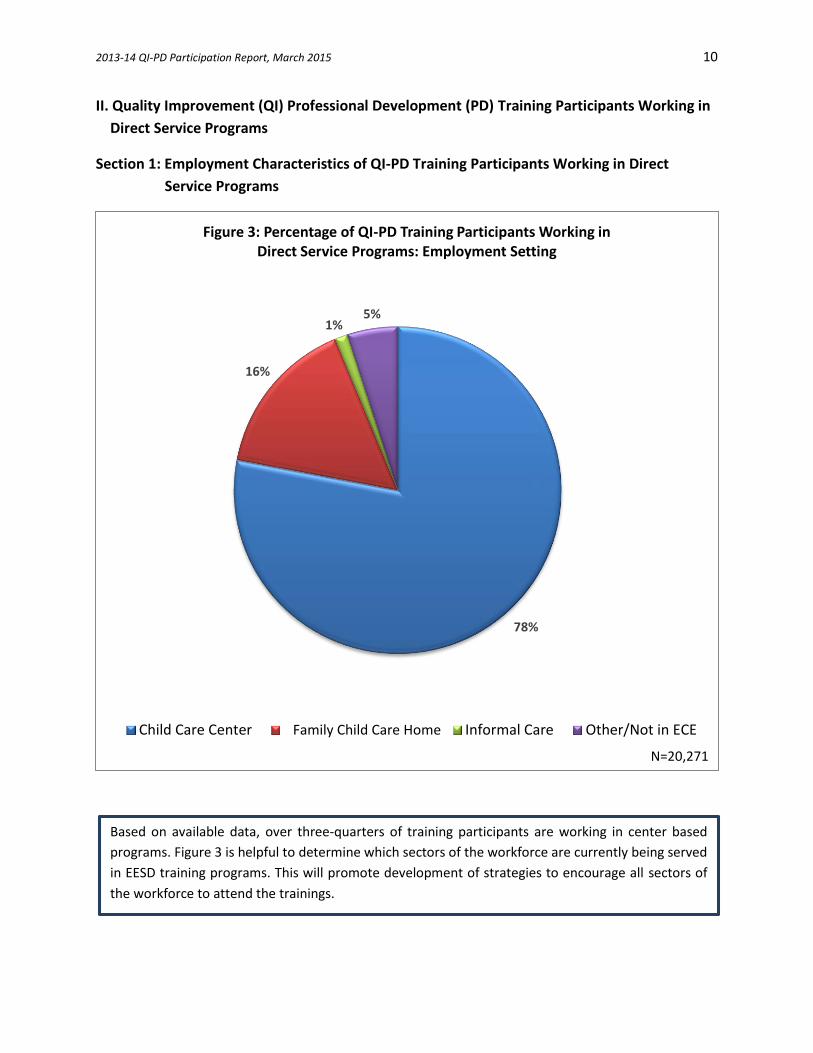
II. Quality Improvement (QI) Professional Development (PD) Training Participants Working in
Direct Service Programs
Section 1: Employment Characteristics of QI-PD Training Participants Working in Direct
Service Programs
78%
16%
1%5%
Figure 3: Percentage of QI-PD Training Participants Working in Direct Service Programs: Employment Setting
Child Care Center Family child care home Informal Care Other/Not in ECE
N=20,271
Family Child Care Home
Based on available data, over three-quarters of training participants are working in center based
programs. Figure 3 is helpful to determine which sectors of the workforce are currently being served
in EESD training programs. This will promote development of strategies to encourage all sectors of
the workforce to attend the trainings.
2013-14 QI-PD Participation Report, March 2015 11
67%75% 78% 80% 80% 83%
28%17% 16% 15% 14% 12%
1%1% 1% 1% 1% 1%
4% 6% 4% 4% 5% 4%
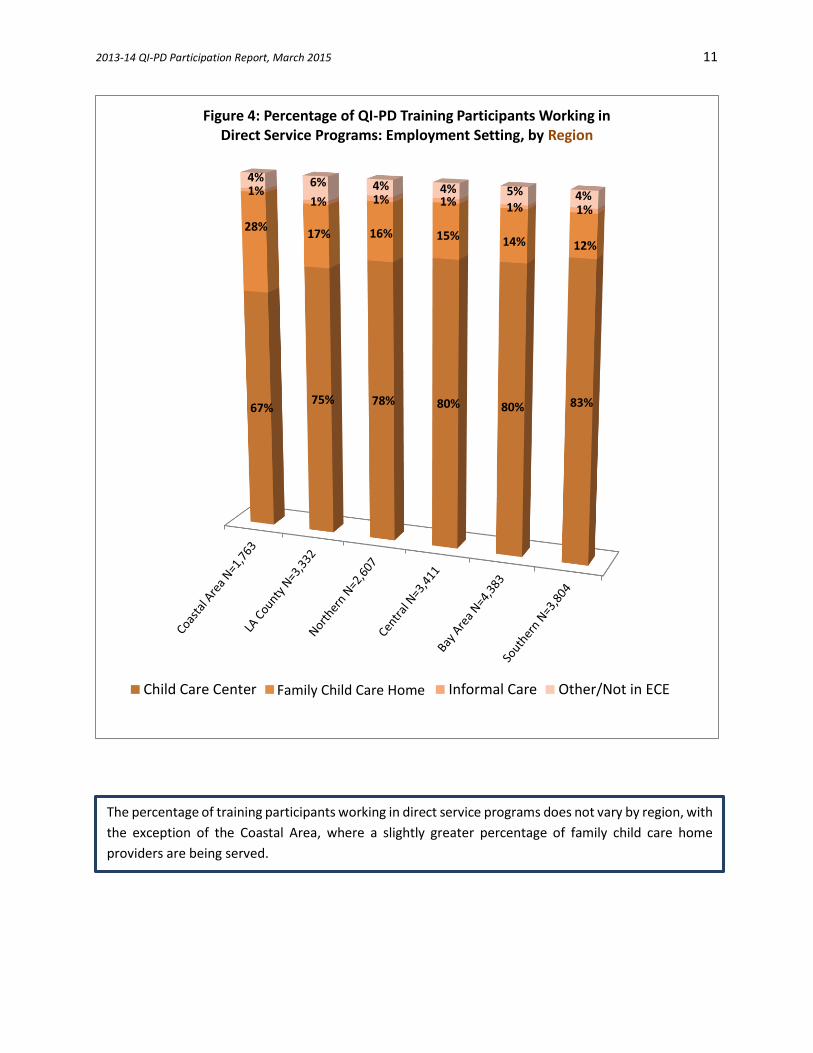
Figure 4: Percentage of QI-PD Training Participants Working in Direct Service Programs: Employment Setting, by Region
Child Care Center Family child care home Informal Care Other/Not in ECE
The percentage of training participants working in direct service programs does not vary by region, with
the exception of the Coastal Area, where a slightly greater percentage of family child care home
providers are being served.
Family Child Care Home
2013-14 QI-PD Participation Report, March 2015 12
18% 19%
63% 65%
79% 82% 82% 85% 88% 93% 94% 94% 100%
69%76%
28% 24%8%
9% 5%3% 1%2%
1% 5%4% 7% 5%
3%12% 2% 1%
6%1%
0% 5% 0% 0% 0% 1%5%
2%5% 6% 1% 5%
18%
7% 2% 3%
6%
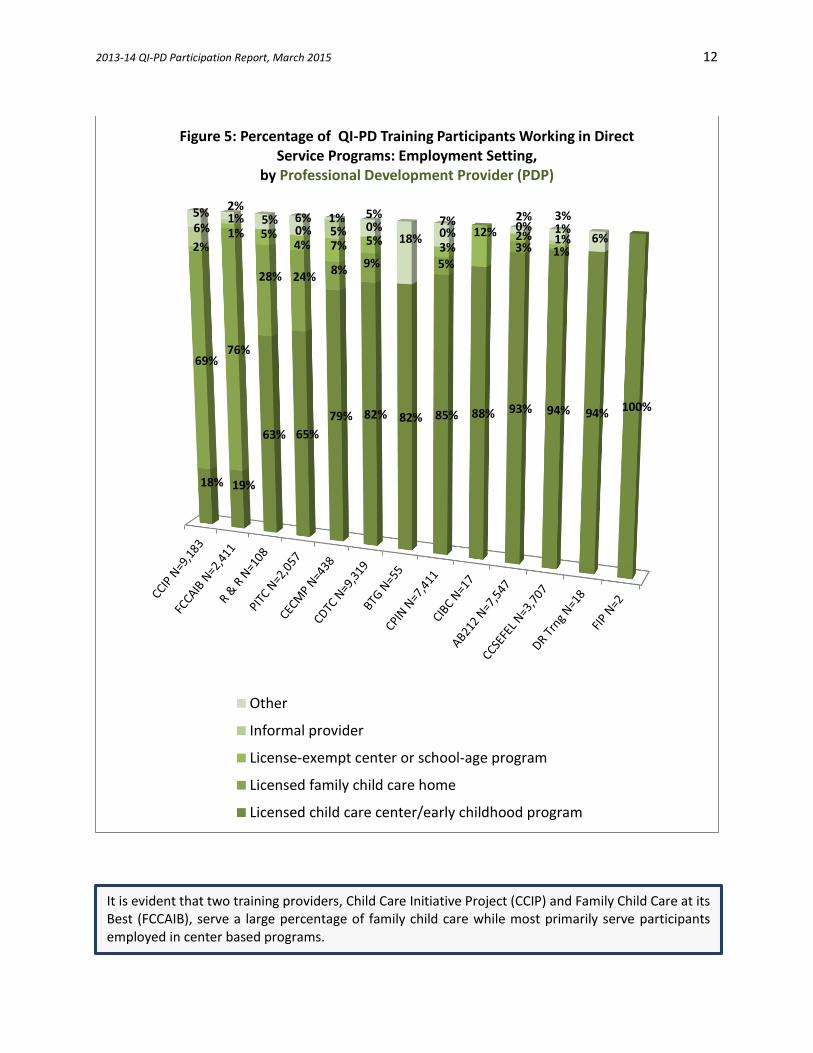
Figure 5: Percentage of QI-PD Training Participants Working in Direct Service Programs: Employment Setting,
by Professional Development Provider (PDP)
Other
Informal provider
License-exempt center or school-age program
Licensed family child care home
Licensed child care center/early childhood program
It is evident that two training providers, Child Care Initiative Project (CCIP) and Family Child Care at its Best (FCCAIB), serve a large percentage of family child care while most primarily serve participants employed in center based programs.
2013-14 QI-PD Participation Report, March 2015 13
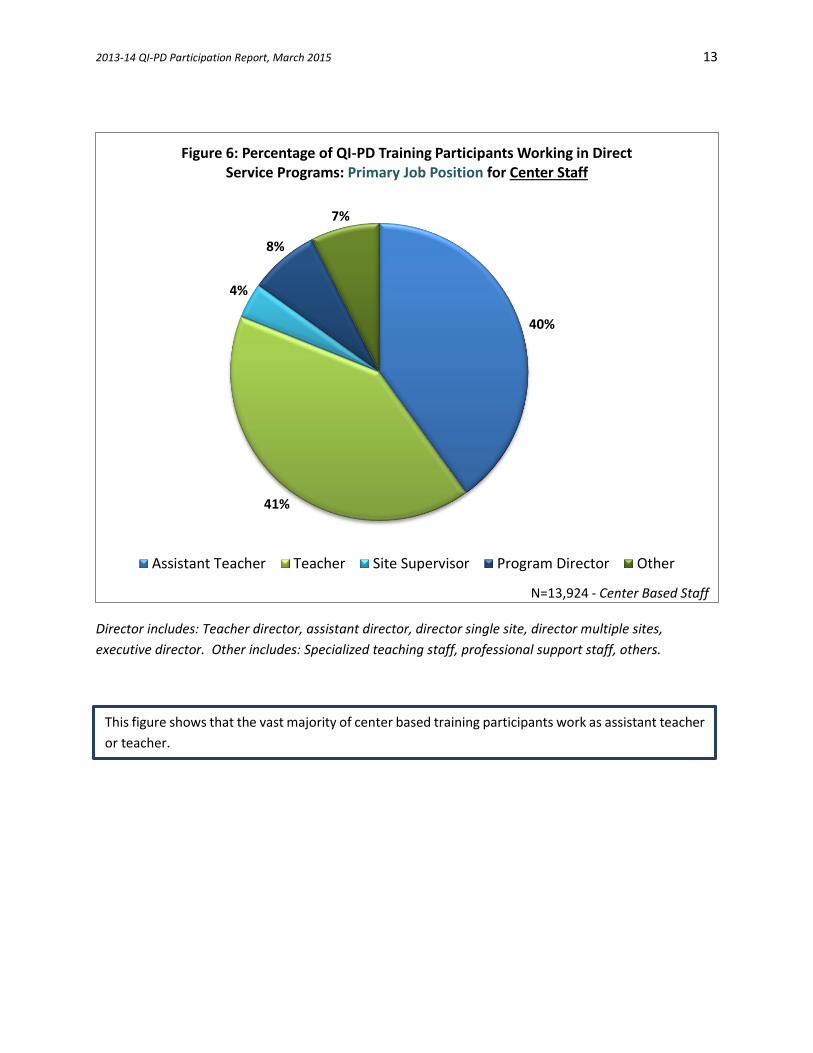
Director includes: Teacher director, assistant director, director single site, director multiple sites,
executive director. Other includes: Specialized teaching staff, professional support staff, others.
This figure shows that the vast majority of center based training participants work as assistant teacher
or teacher.
40%
41%
4%
8%
7%
Figure 6: Percentage of QI-PD Training Participants Working in Direct Service Programs: Primary Job Position for Center Staff
Assistant Teacher Teacher Site Supervisor Program Director Other
N=13,924 - Center Based Staff
2013-14 QI-PD Participation Report, March 2015 14
11%
70%
19%
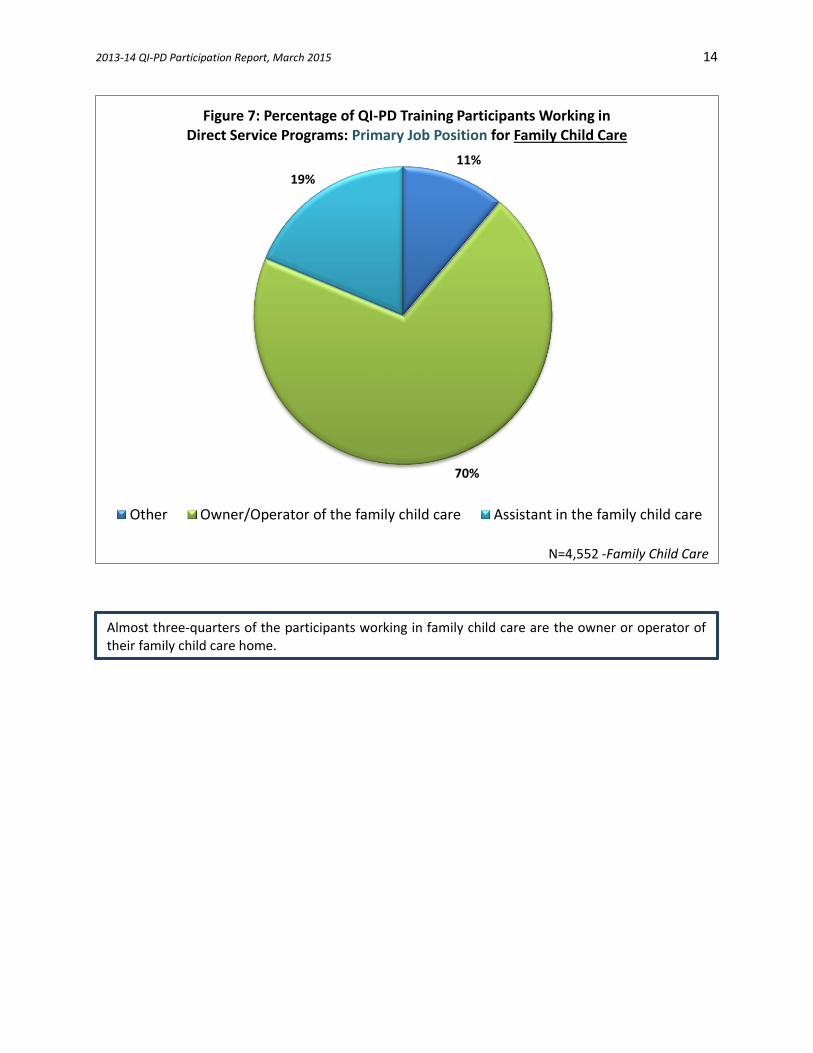
Figure 7: Percentage of QI-PD Training Participants Working in Direct Service Programs: Primary Job Position for Family Child Care
Other Owner/Operator of the family child care Assistant in the family child care
N=4,552 -Family Child Care
Almost three-quarters of the participants working in family child care are the owner or operator of their family child care home.
2013-14 QI-PD Participation Report, March 2015 15
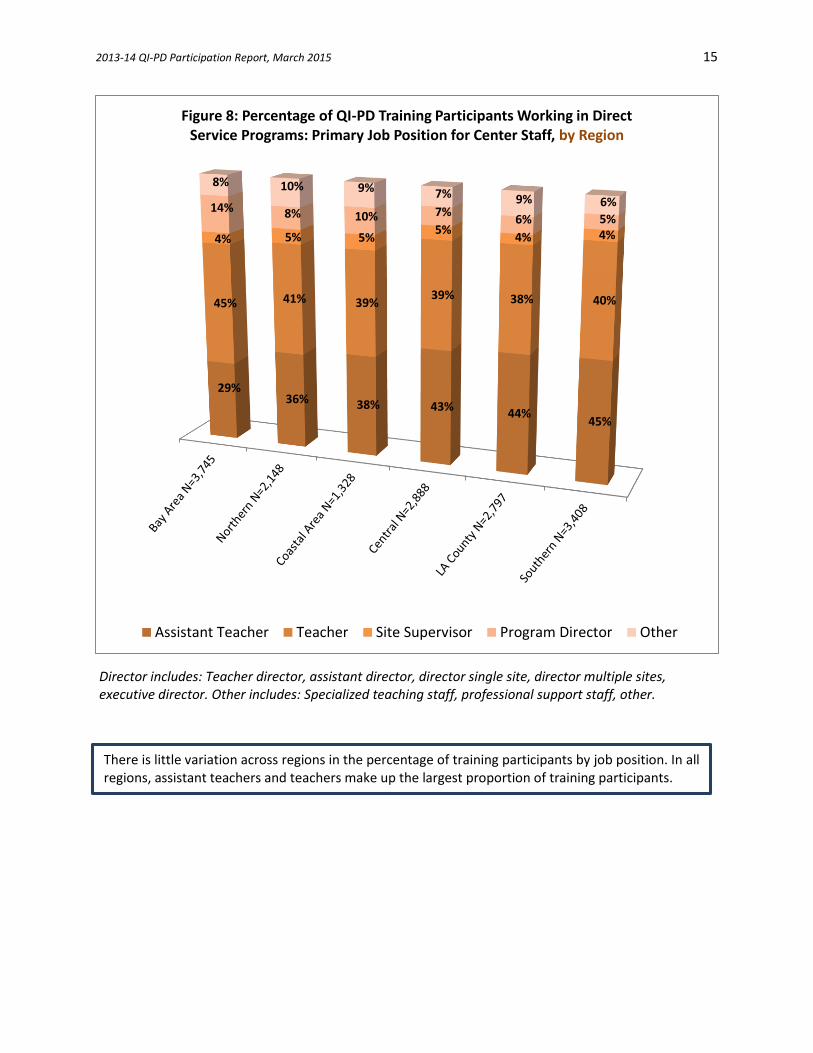
Director includes: Teacher director, assistant director, director single site, director multiple sites, executive director. Other includes: Specialized teaching staff, professional support staff, other.
There is little variation across regions in the percentage of training participants by job position. In all regions, assistant teachers and teachers make up the largest proportion of training participants.
29%36% 38% 43%
44%45%
45% 41% 39%39% 38% 40%
4% 5% 5%5%
4% 4%
14% 8% 10% 7%6% 5%
8% 10% 9% 7% 9% 6%
Figure 8: Percentage of QI-PD Training Participants Working in Direct Service Programs: Primary Job Position for Center Staff, by Region
Assistant Teacher Teacher Site Supervisor Program Director Other
2013-14 QI-PD Participation Report, March 2015 16
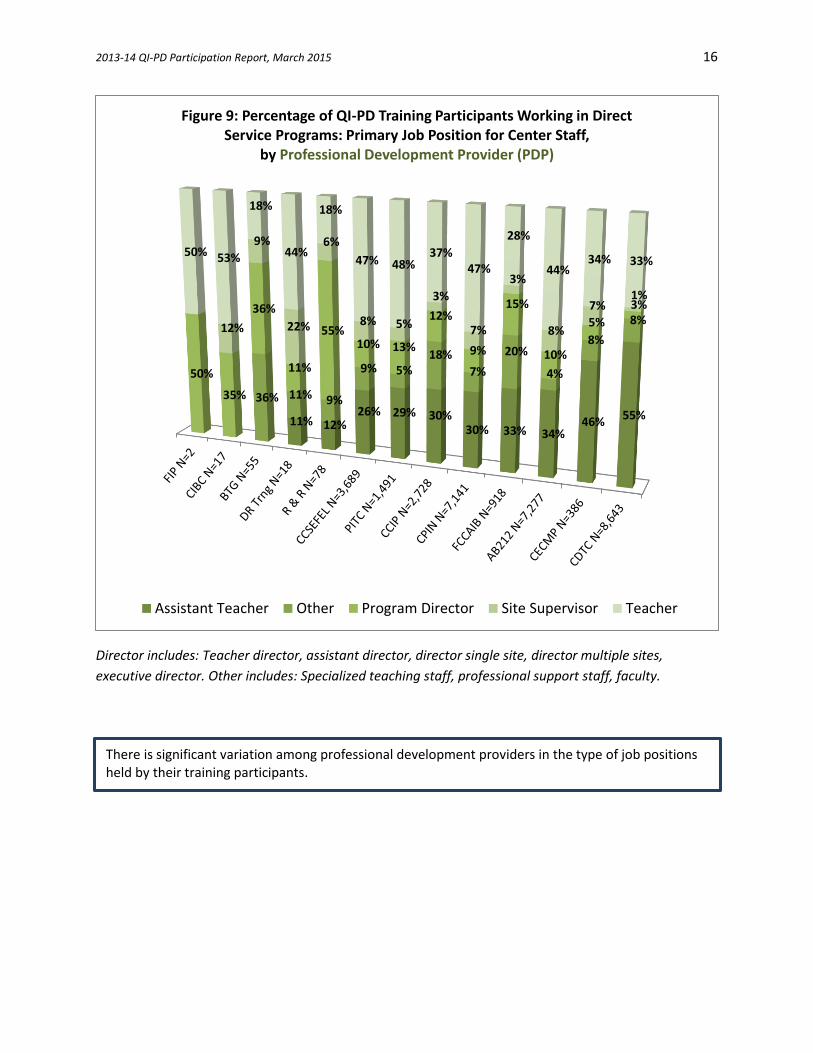
Director includes: Teacher director, assistant director, director single site, director multiple sites,
executive director. Other includes: Specialized teaching staff, professional support staff, faculty.
There is significant variation among professional development providers in the type of job positions held by their training participants.
11% 12%26% 29% 30%
30% 33% 34%46%
55%
36% 11% 9%
9% 5%18%
7%
20%
4%
8%
8%
50%
35%
36%
11%
55%10% 13%
12%
9%
15%
10%
5%
3%
12%
9%
22%
6%
8% 5%
3%
7%
3%
8%
7%1%
50% 53%
18%
44%
18%
47% 48%37%
47%
28%
44%34% 33%
Figure 9: Percentage of QI-PD Training Participants Working in Direct Service Programs: Primary Job Position for Center Staff,
by Professional Development Provider (PDP)
Assistant Teacher Other Program Director Site Supervisor Teacher
2013-14 QI-PD Participation Report, March 2015 17
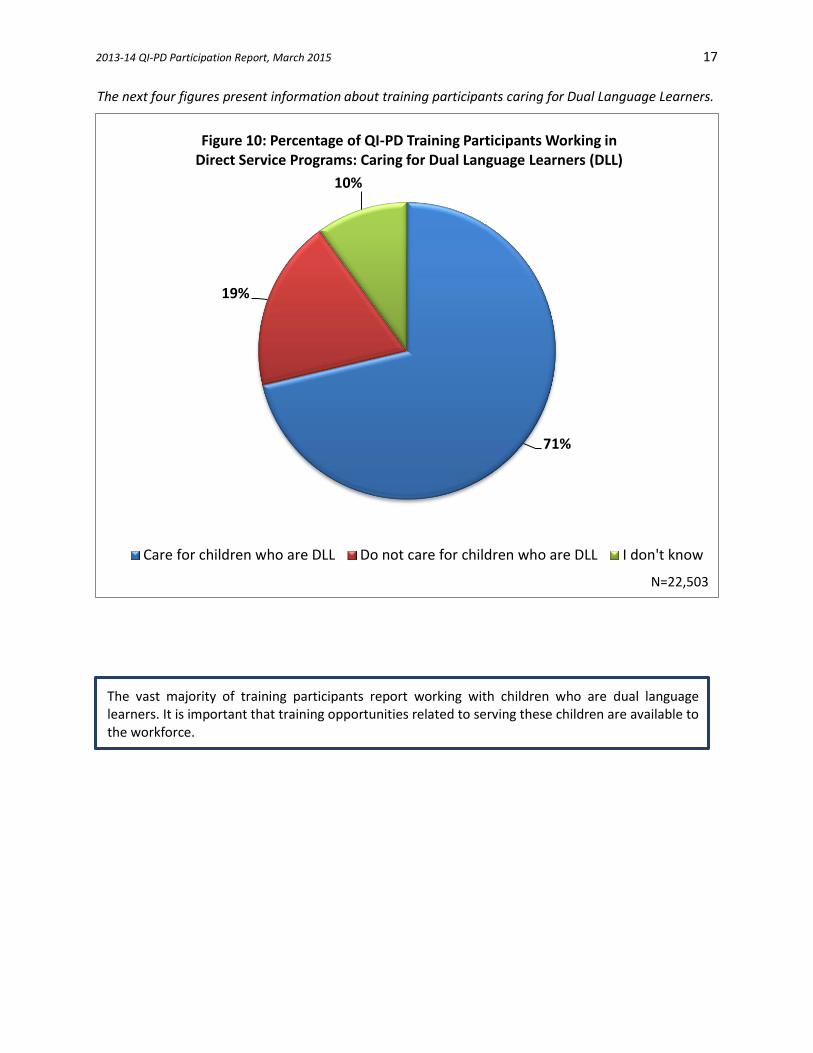
The next four figures present information about training participants caring for Dual Language Learners.
71%
19%
10%
Figure 10: Percentage of QI-PD Training Participants Working in Direct Service Programs: Caring for Dual Language Learners (DLL)
Care for children who are DLL Do not care for children who are DLL I don't know
N=22,503
The vast majority of training participants report working with children who are dual language learners. It is important that training opportunities related to serving these children are available to the workforce.
2013-14 QI-PD Participation Report, March 2015 18
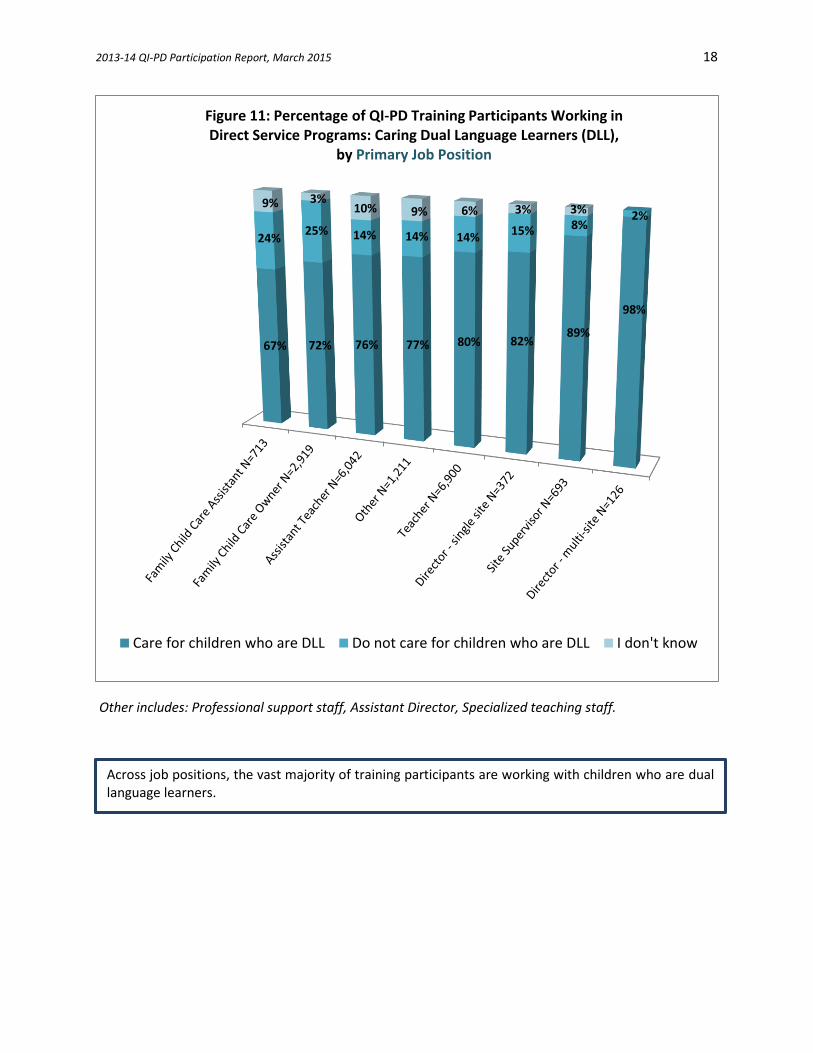
Other includes: Professional support staff, Assistant Director, Specialized teaching staff.
Across job positions, the vast majority of training participants are working with children who are dual language learners.
67% 72% 76% 77% 80% 82%89%
98%
24%25% 14% 14% 14%
15% 8%2%
9% 3%10% 9% 6% 3% 3%
Figure 11: Percentage of QI-PD Training Participants Working in Direct Service Programs: Caring Dual Language Learners (DLL),
by Primary Job Position
Care for children who are DLL Do not care for children who are DLL I don't know
2013-14 QI-PD Participation Report, March 2015 19
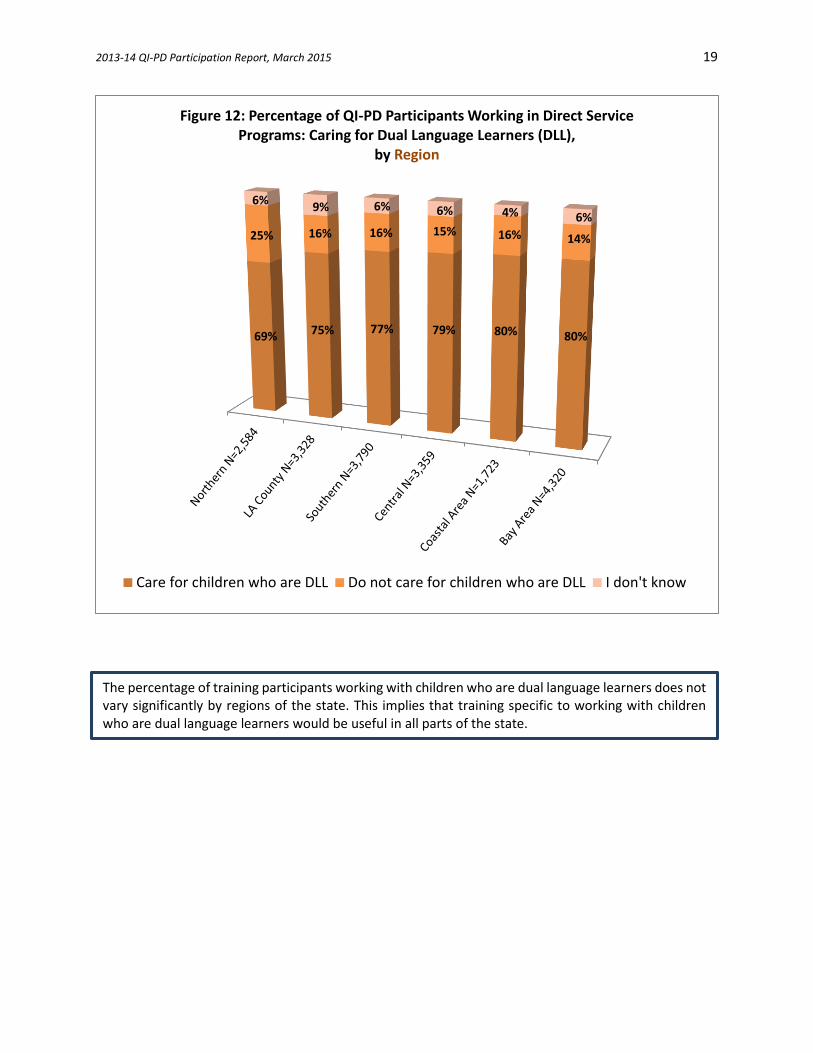
The percentage of training participants working with children who are dual language learners does not vary significantly by regions of the state. This implies that training specific to working with children who are dual language learners would be useful in all parts of the state.
69% 75% 77% 79% 80% 80%
25% 16% 16% 15% 16% 14%
6%9% 6% 6% 4% 6%
Figure 12: Percentage of QI-PD Participants Working in Direct Service Programs: Caring for Dual Language Learners (DLL),
by Region
Care for children who are DLL Do not care for children who are DLL I don't know
2013-14 QI-PD Participation Report, March 2015 20
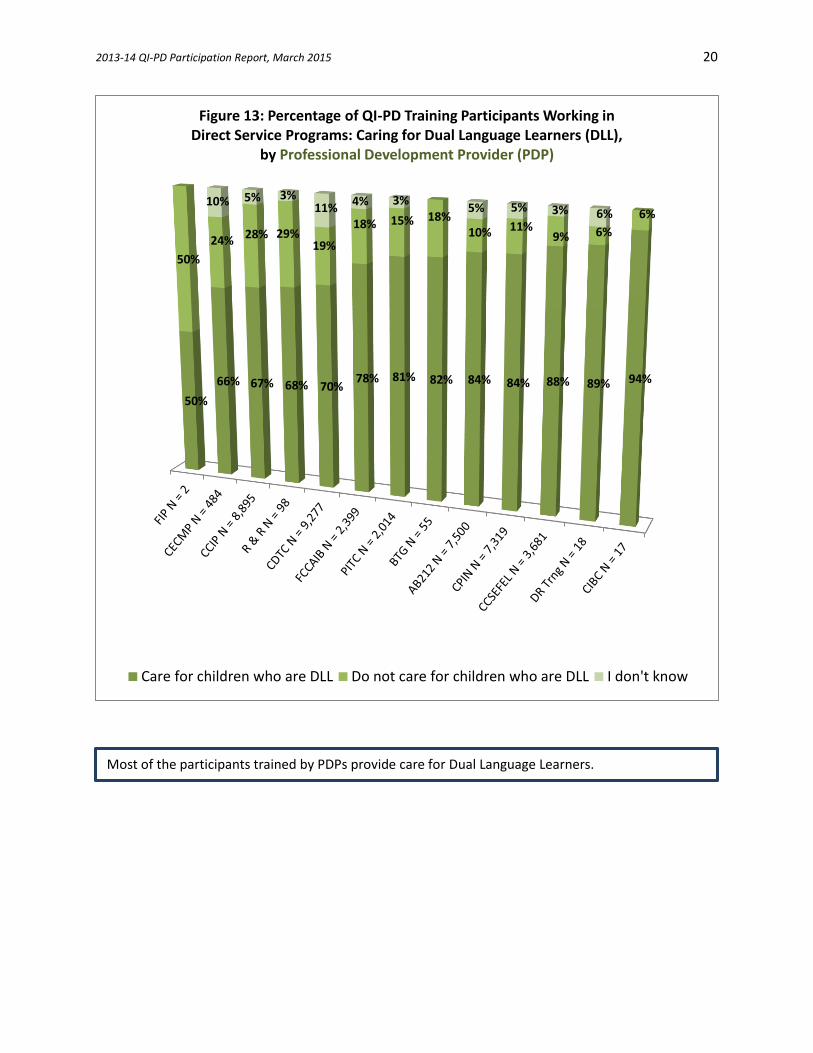
50%
66% 67% 68% 70%78% 81% 82% 84% 84% 88% 89% 94%
50%
24% 28% 29%19%
18% 15% 18%10% 11%
9% 6%
6%10% 5% 3%
11%4% 3%
5% 5% 3% 6%
Figure 13: Percentage of QI-PD Training Participants Working in Direct Service Programs: Caring for Dual Language Learners (DLL),
by Professional Development Provider (PDP)
Care for children who are DLL Do not care for children who are DLL I don't know
Most of the participants trained by PDPs provide care for Dual Language Learners.
2013-14 QI-PD Participation Report, March 2015 21
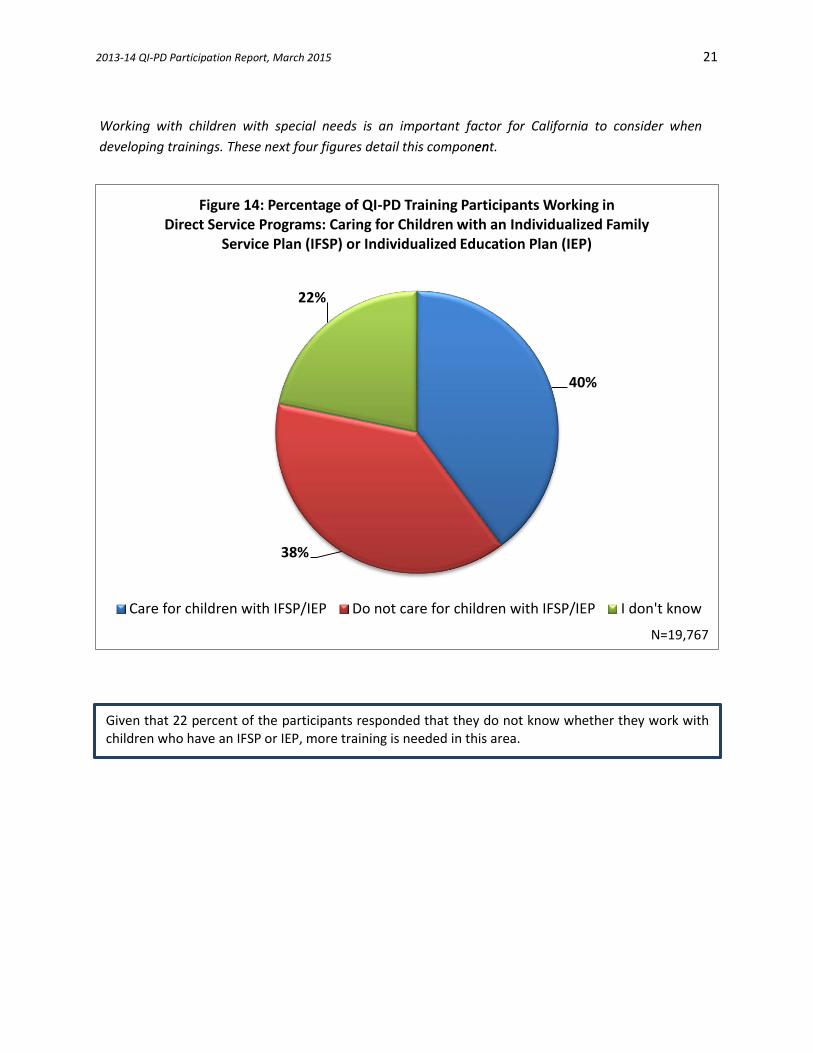
Working with children with special needs is an important factor for California to consider when
developing trainings. These next four figures detail this componenent.
40%
38%
22%
Figure 14: Percentage of QI-PD Training Participants Working in Direct Service Programs: Caring for Children with an Individualized Family
Service Plan (IFSP) or Individualized Education Plan (IEP)
Care for children with IFSP/IEP Do not care for children with IFSP/IEP I don't know
N=19,767
Given that 22 percent of the participants responded that they do not know whether they work with children who have an IFSP or IEP, more training is needed in this area.
2013-14 QI-PD Participation Report, March 2015 22
21% 22%39% 45%
54% 60%66%
85%
47%
62% 31%
38%
24%
32%
26%
11%32%
15%
30%
17%22%
8% 8% 3%
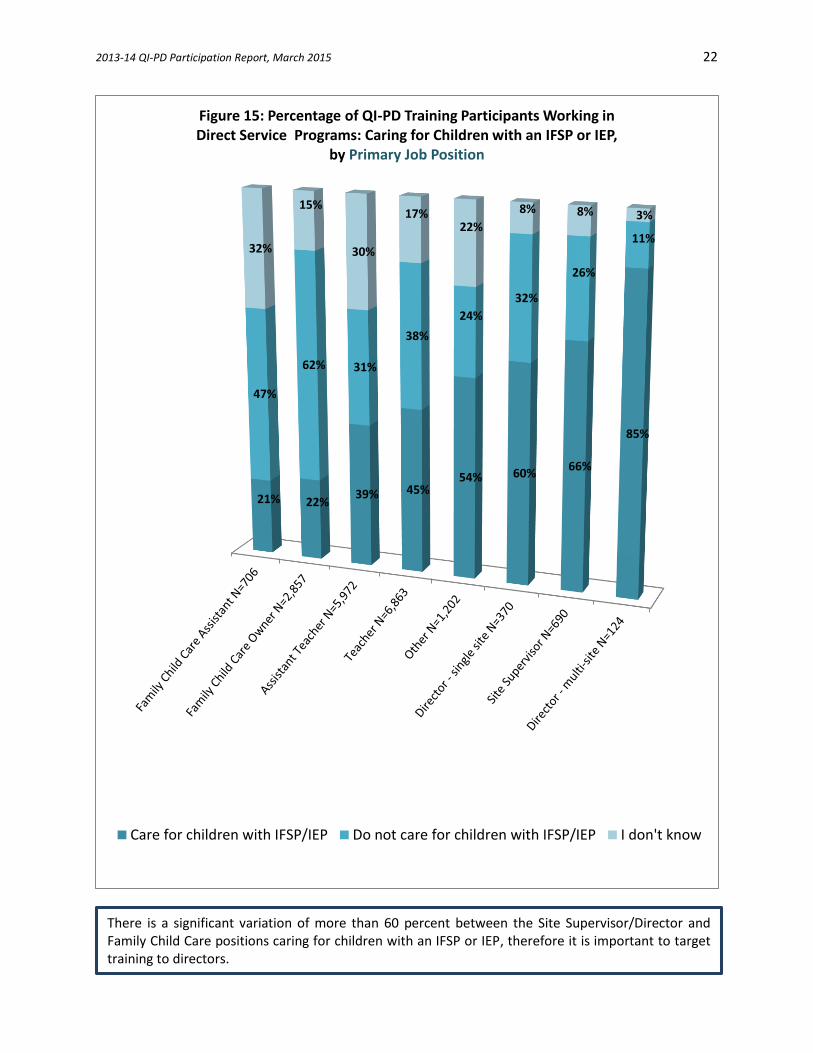
Figure 15: Percentage of QI-PD Training Participants Working in Direct Service Programs: Caring for Children with an IFSP or IEP,
by Primary Job Position
Care for children with IFSP/IEP Do not care for children with IFSP/IEP I don't know
There is a significant variation of more than 60 percent between the Site Supervisor/Director and Family Child Care positions caring for children with an IFSP or IEP, therefore it is important to target training to directors.
2013-14 QI-PD Participation Report, March 2015 23
35% 37% 41% 41% 43% 47%
39% 40% 37% 41% 38% 34%
26% 23% 22% 18%20% 18%
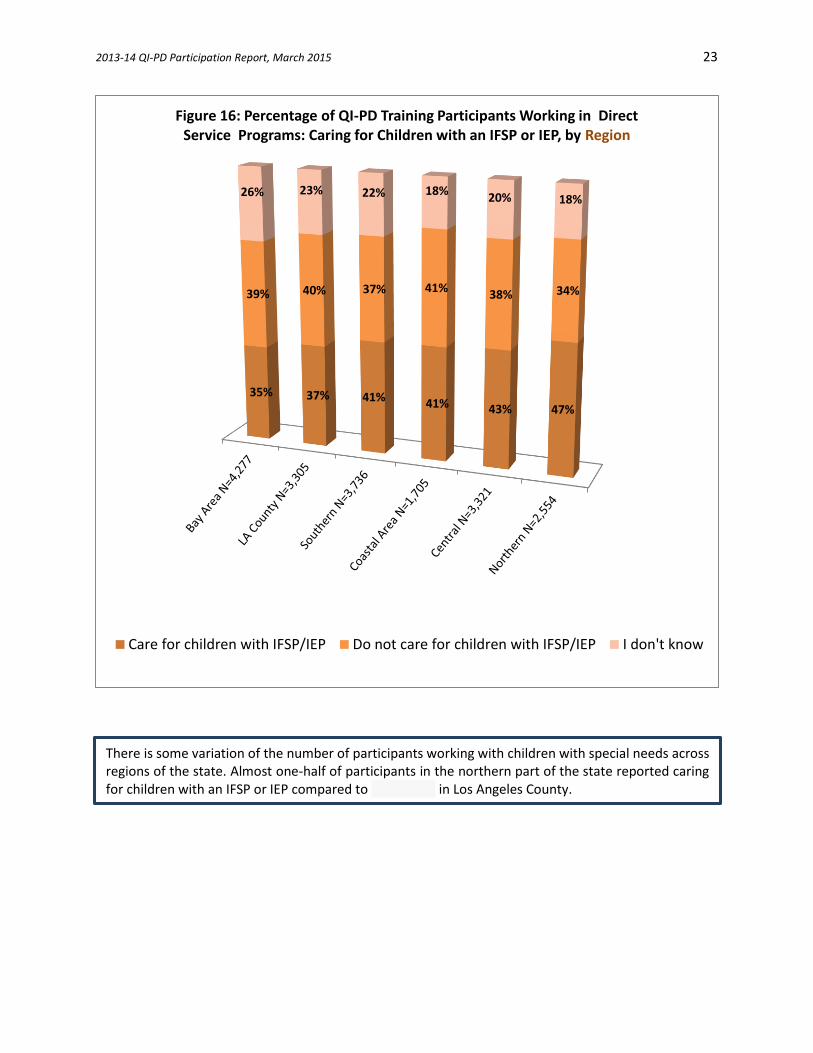
Figure 16: Percentage of QI-PD Training Participants Working in Direct Service Programs: Caring for Children with an IFSP or IEP, by Region
Care for children with IFSP/IEP Do not care for children with IFSP/IEP I don't know
There is some variation of the number of participants working with children with special needs across regions of the state. Almost one-half of participants in the northern part of the state reported caring for children with an IFSP or IEP compared to 37 percent in Los Angeles County.
2013-14 QI-PD Participation Report, March 2015 24
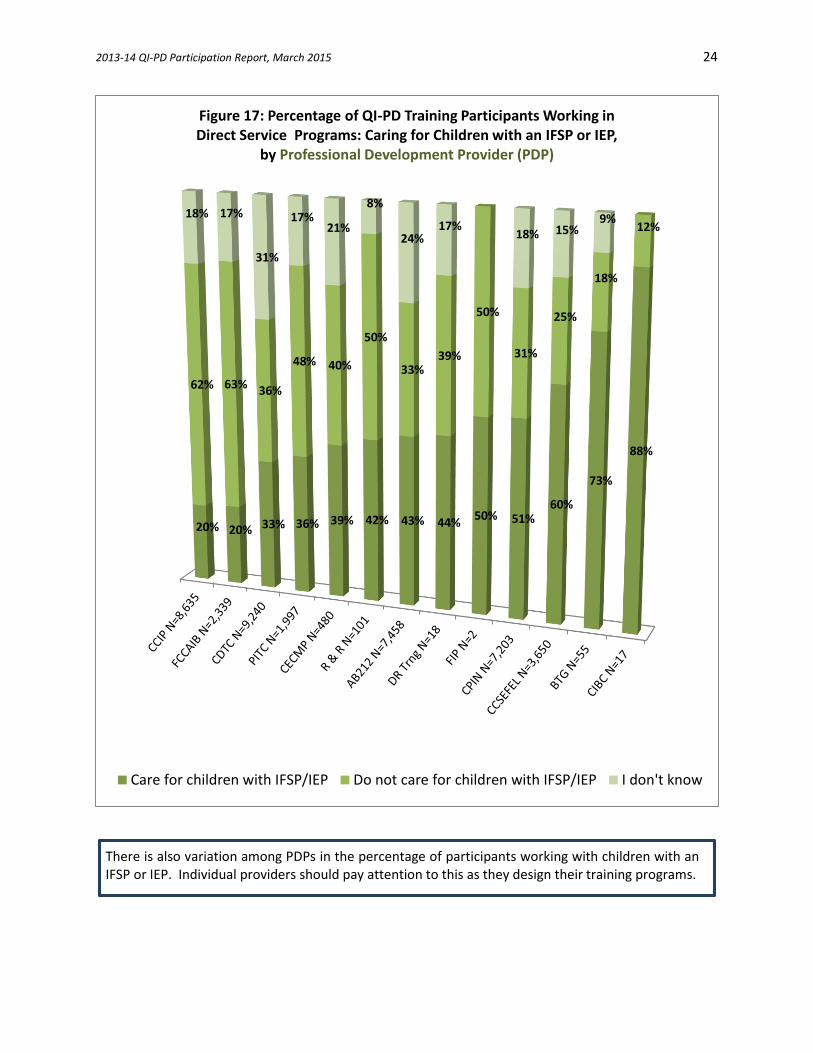
There is also variation among PDPs in the percentage of participants working with children with an IFSP or IEP. Individual providers should pay attention to this as they design their training programs.
20% 20% 33% 36% 39% 42% 43% 44%50% 51%
60%
73%
88%
62% 63% 36%
48% 40%
50%
33%39%
50%
31%
25%
18%
12%18% 17%
31%
17%21%
8%
24%17%
18% 15%9%
Figure 17: Percentage of QI-PD Training Participants Working in Direct Service Programs: Caring for Children with an IFSP or IEP,
by Professional Development Provider (PDP)
Care for children with IFSP/IEP Do not care for children with IFSP/IEP I don't know
2013-14 QI-PD Participation Report, March 2015 25
Full-time/part-time status, tenure and wages
The following section provides information about the employment status of the training participant.
16%
22%
61%
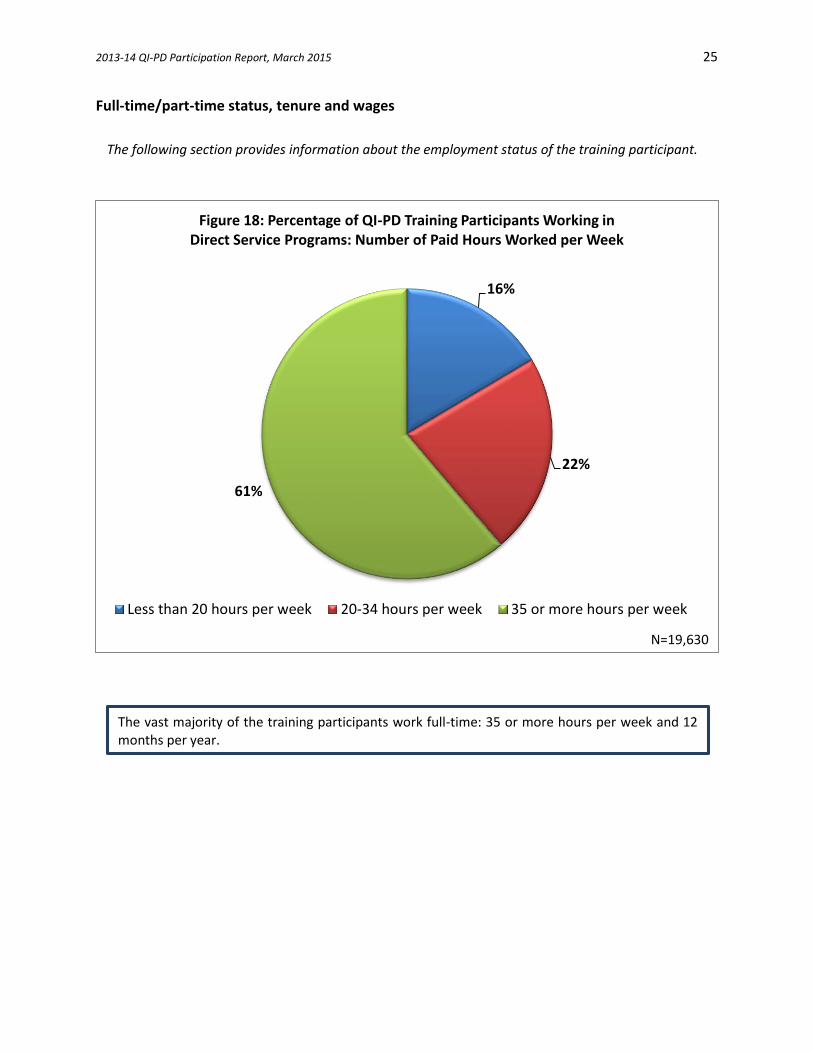
Figure 18: Percentage of QI-PD Training Participants Working in Direct Service Programs: Number of Paid Hours Worked per Week
Less than 20 hours per week 20-34 hours per week 35 or more hours per week
N=19,630
The vast majority of the training participants work full-time: 35 or more hours per week and 12 months per year.
2013-14 QI-PD Participation Report, March 2015 26
14%
23%
6%
58%
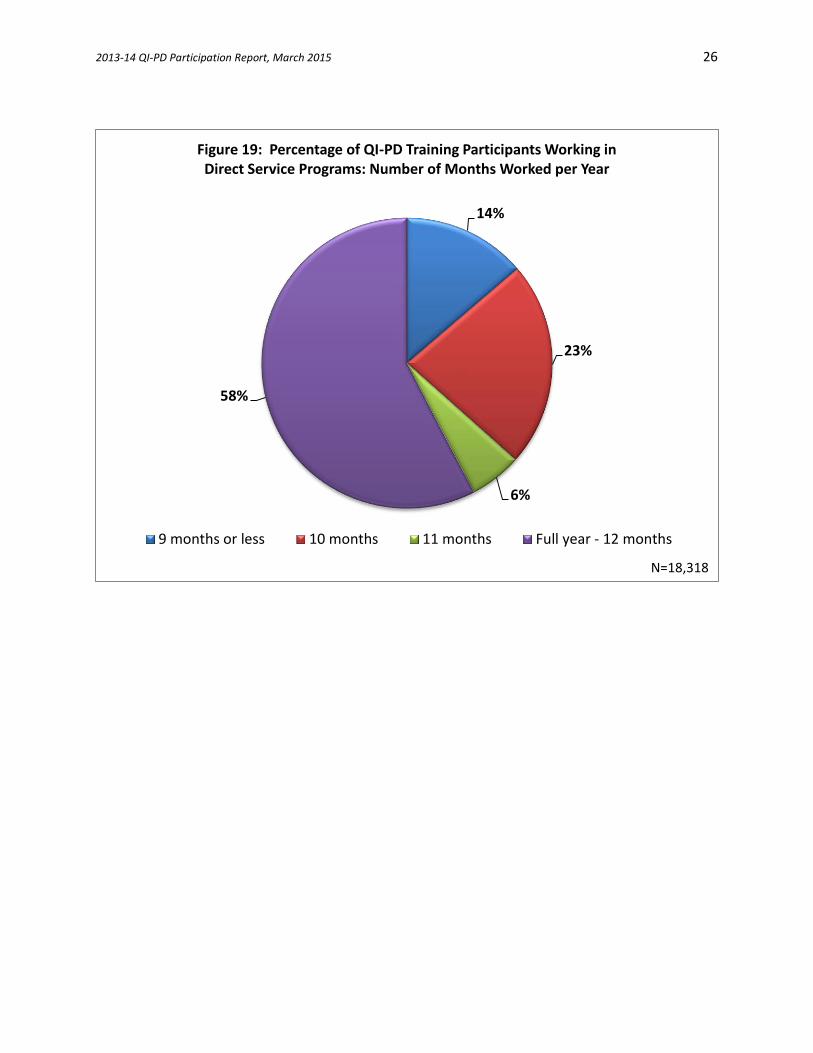
Figure 19: Percentage of QI-PD Training Participants Working in Direct Service Programs: Number of Months Worked per Year
9 months or less 10 months 11 months Full year - 12 months
N=18,318
2013-14 QI-PD Participation Report, March 2015 27
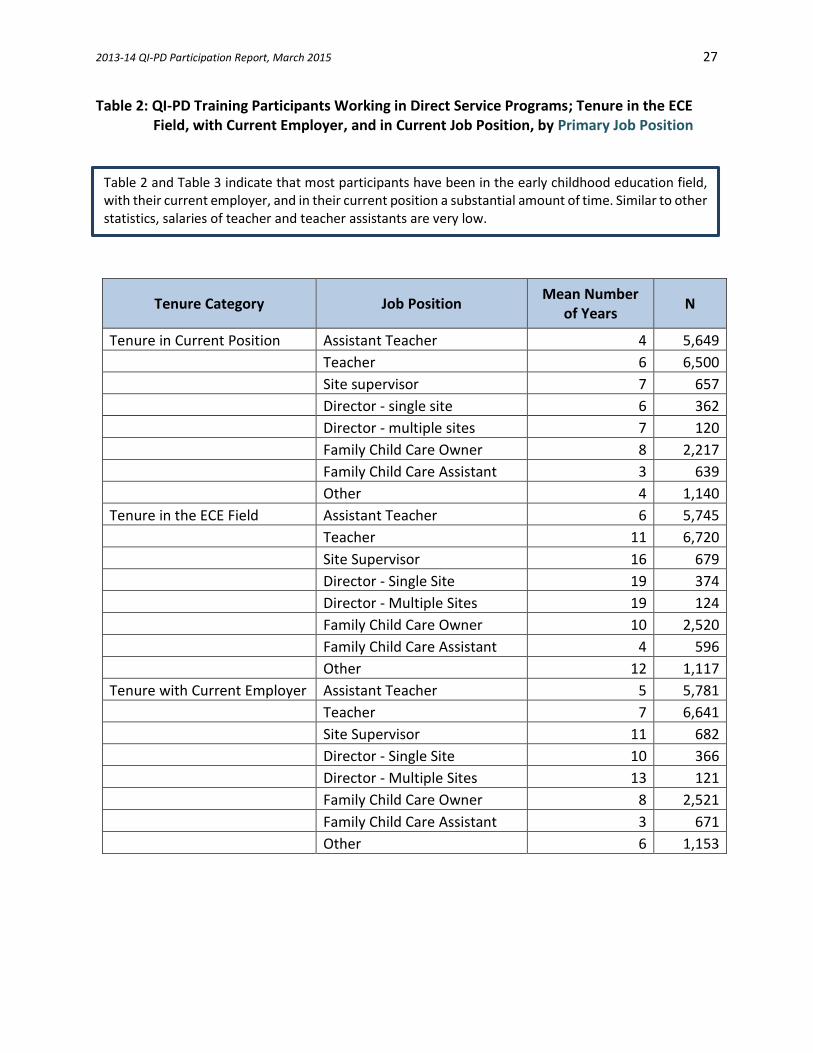
Table 2: QI-PD Training Participants Working in Direct Service Programs; Tenure in the ECE Field, with Current Employer, and in Current Job Position, by Primary Job Position
Table 2 and Table 3 indicate that most participants have been in the early childhood education field, with their current employer, and in their current position a substantial amount of time. Similar to other statistics, salaries of teacher and teacher assistants are very low.
Tenure Category Job Position Mean Number
of Years N
Tenure in Current Position Assistant Teacher 4 5,649
Teacher 6 6,500
Site supervisor 7 657
Director - single site 6 362
Director - multiple sites 7 120
Family Child Care Owner 8 2,217
Family Child Care Assistant 3 639
Other 4 1,140
Tenure in the ECE Field Assistant Teacher 6 5,745
Teacher 11 6,720
Site Supervisor 16 679
Director - Single Site 19 374
Director - Multiple Sites 19 124
Family Child Care Owner 10 2,520
Family Child Care Assistant 4 596
Other 12 1,117
Tenure with Current Employer Assistant Teacher 5 5,781
Teacher 7 6,641
Site Supervisor 11 682
Director - Single Site 10 366
Director - Multiple Sites 13 121
Family Child Care Owner 8 2,521
Family Child Care Assistant 3 671
Other 6 1,153
2013-14 QI-PD Participation Report, March 2015 28
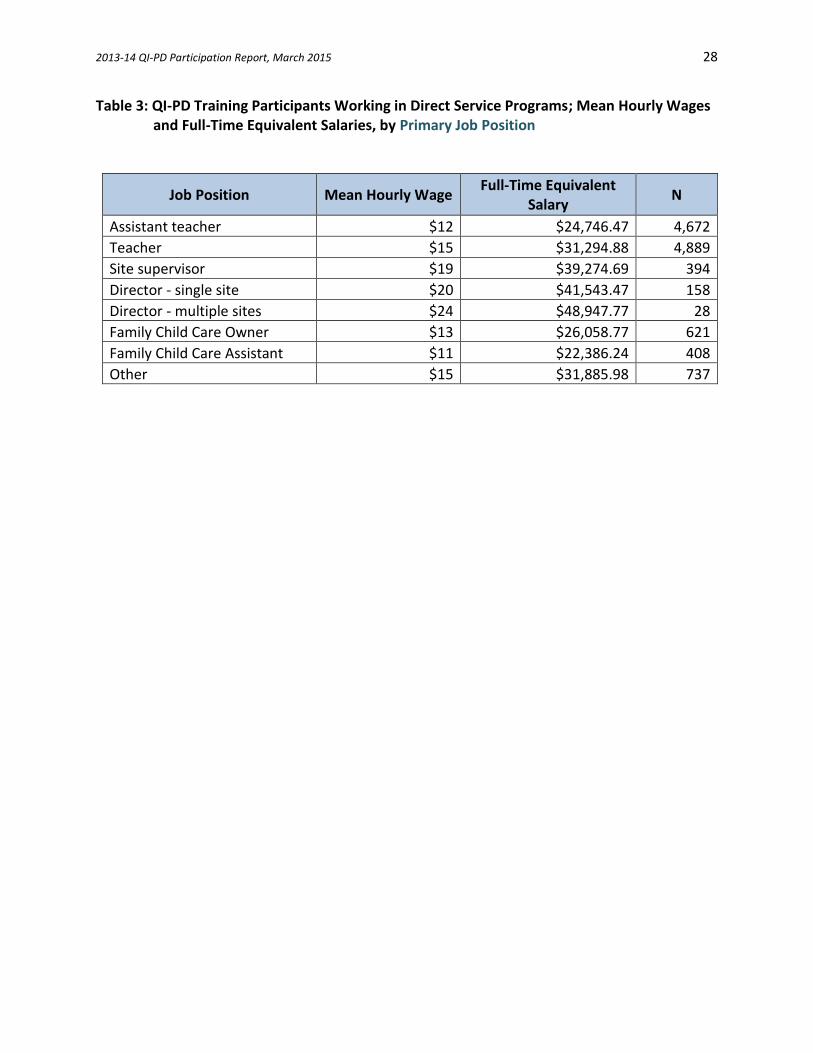
Table 3: QI-PD Training Participants Working in Direct Service Programs; Mean Hourly Wages and Full-Time Equivalent Salaries, by Primary Job Position
Job Position Mean Hourly Wage Full-Time Equivalent
Salary N
Assistant teacher $12 $24,746.47 4,672
Teacher $15 $31,294.88 4,889
Site supervisor $19 $39,274.69 394
Director - single site $20 $41,543.47 158
Director - multiple sites $24 $48,947.77 28
Family Child Care Owner $13 $26,058.77 621
Family Child Care Assistant $11 $22,386.24 408
Other $15 $31,885.98 737
2013-14 QI-PD Participation Report, March 2015 29
II. Quality Improvement (QI) Professional Development (PD) Training Participants Working in
Direct Service Programs
Section 2: Educational and Permit Level of QI-PD Training Participants Working in Direct
Service Programs
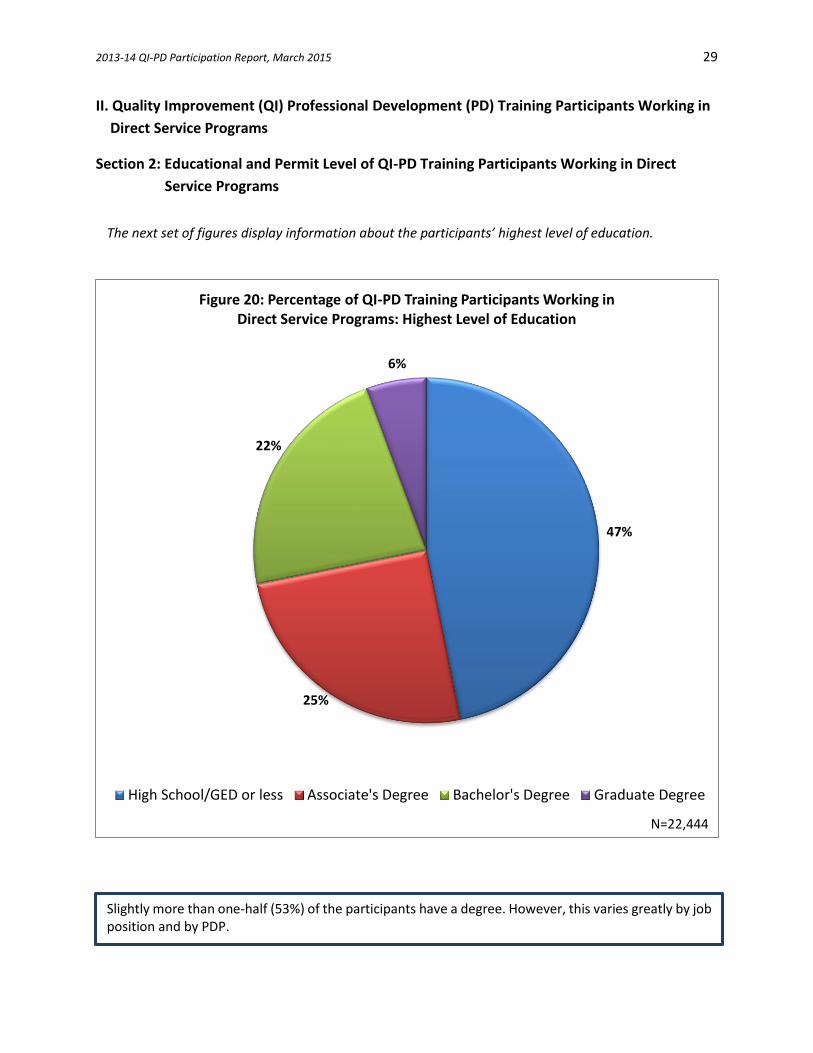
The next set of figures display information about the participants’ highest level of education.
47%
25%
22%
6%
Figure 20: Percentage of QI-PD Training Participants Working in Direct Service Programs: Highest Level of Education
High School/GED or less Associate's Degree Bachelor's Degree Graduate Degree
N=22,444
Slightly more than one-half (53%) of the participants have a degree. However, this varies greatly by job position and by PDP.
2013-14 QI-PD Participation Report, March 2015 30
3% 11% 12%
29%37%
63% 63%
70%
8%
17%
37%
33%18%
22%19%
17%
39%
40%
42%
32%
30%
14%15% 12%
50%
32%
8% 5%15%
2% 4% 1%
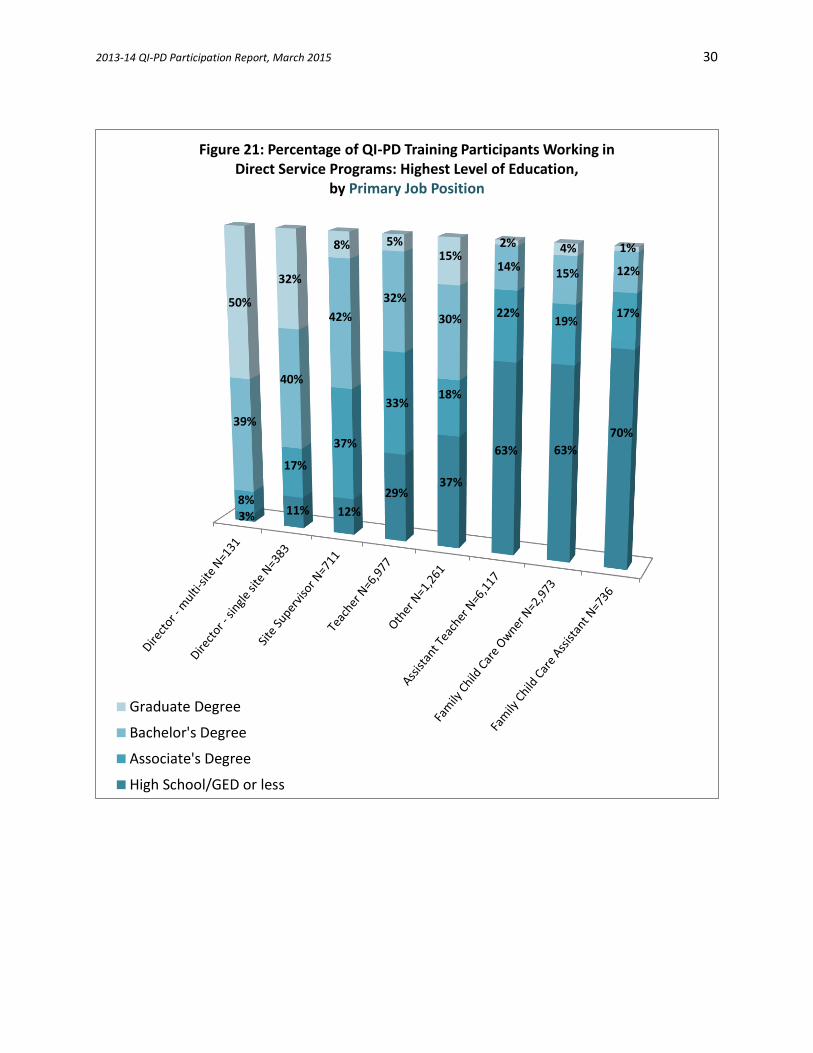
Figure 21: Percentage of QI-PD Training Participants Working in Direct Service Programs: Highest Level of Education,
by Primary Job Position
Graduate Degree
Bachelor's Degree
Associate's Degree
High School/GED or less
2013-14 QI-PD Participation Report, March 2015 31
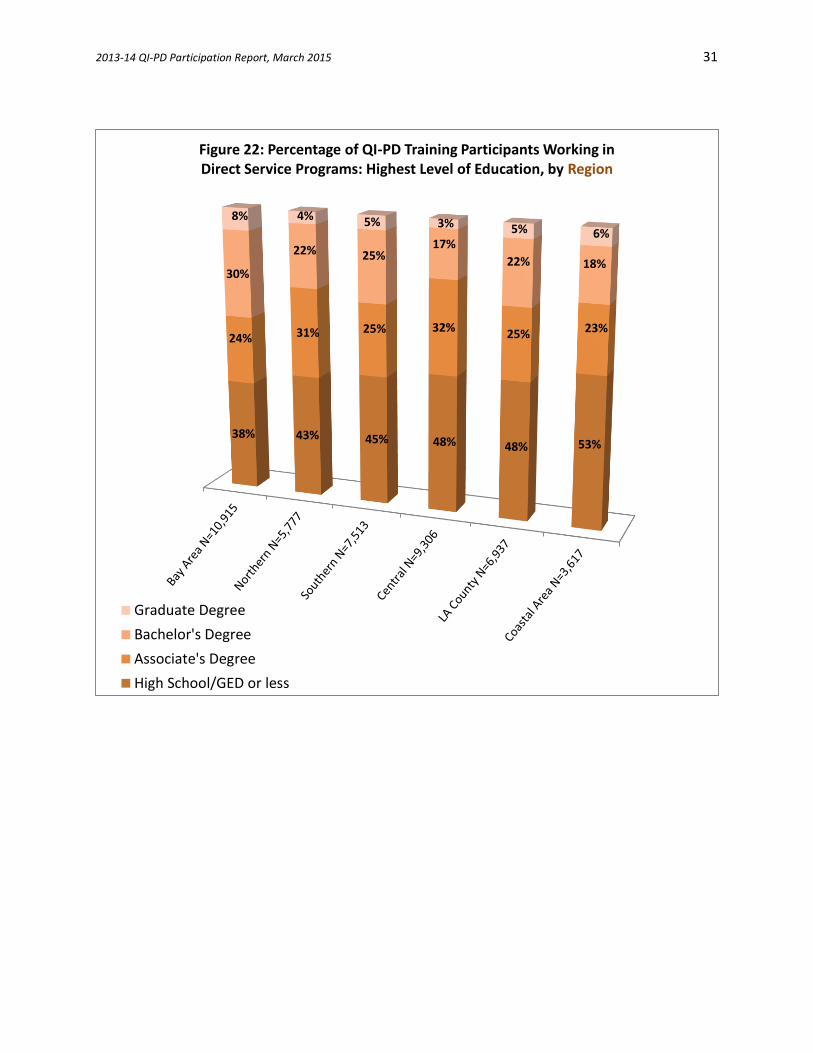
38% 43% 45% 48% 48% 53%
24% 31% 25% 32% 25% 23%
30%
22% 25%17%
22% 18%
8% 4% 5% 3% 5% 6%
Figure 22: Percentage of QI-PD Training Participants Working in Direct Service Programs: Highest Level of Education, by Region
Graduate Degree
Bachelor's Degree
Associate's Degree
High School/GED or less
2013-14 QI-PD Participation Report, March 2015 32
6% 6% 9%
25% 29% 37% 41% 43%50%
60%67% 69%
6%
29%18%
26%32%
31% 20%24%
26%
22%
17% 17%
50%
67%
59%
27%
35%
31%
26%
32%
24%
17%
16% 13% 12%
50%
22%
6%
45%
13% 7% 6% 7% 9% 7%2% 3% 3%
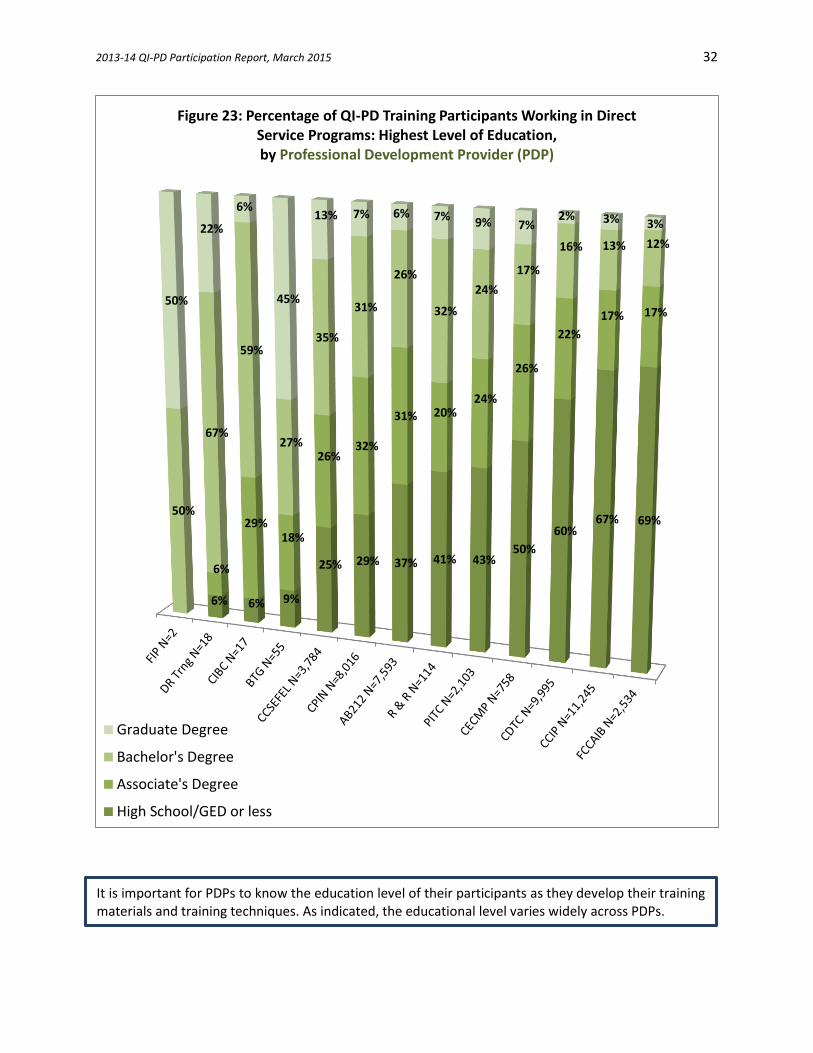
Figure 23: Percentage of QI-PD Training Participants Working in Direct Service Programs: Highest Level of Education, by Professional Development Provider (PDP)
Graduate Degree
Bachelor's Degree
Associate's Degree
High School/GED or less
It is important for PDPs to know the education level of their participants as they develop their training materials and training techniques. As indicated, the educational level varies widely across PDPs.
2013-14 QI-PD Participation Report, March 2015 33
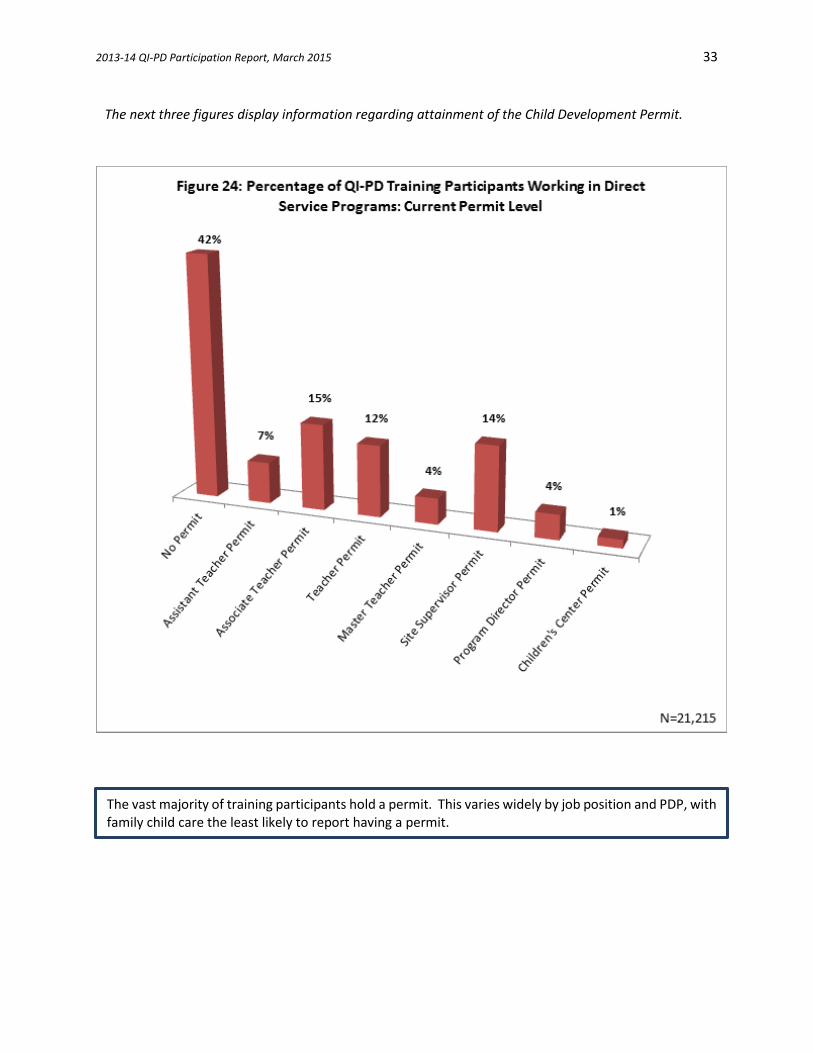
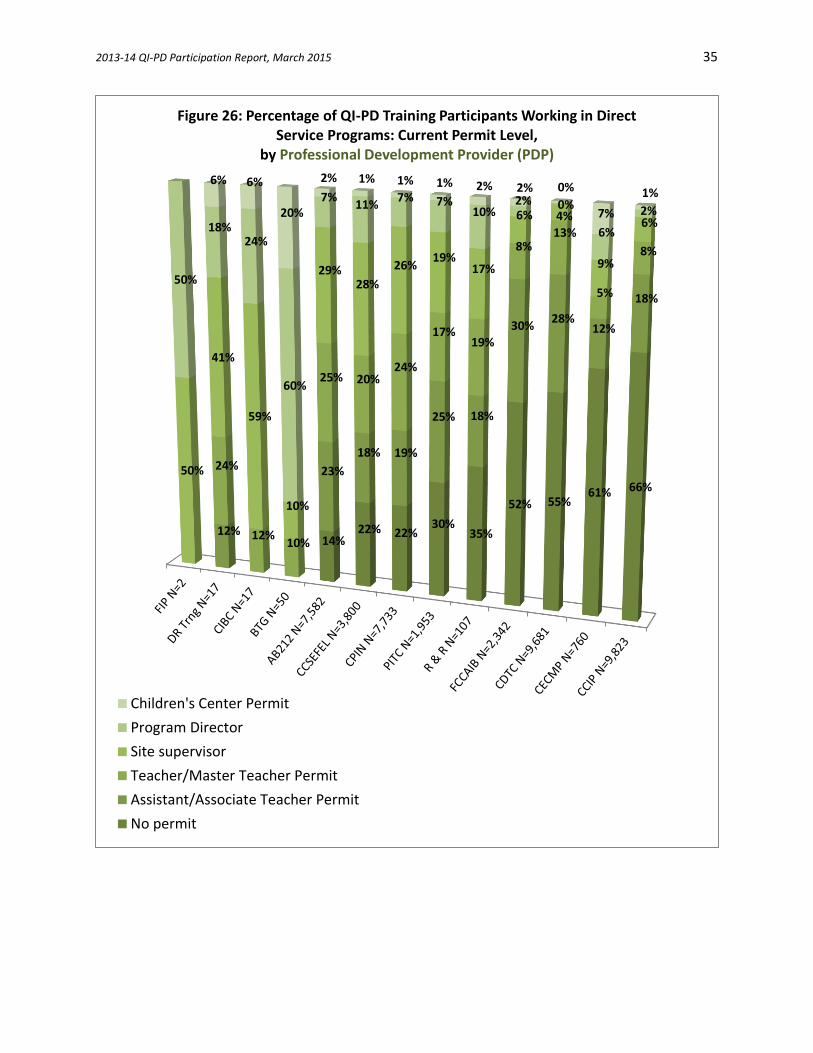
The next three figures display information regarding attainment of the Child Development Permit.
The vast majority of training participants hold a permit. This varies widely by job position and PDP, with family child care the least likely to report having a permit.
2013-14 QI-PD Participation Report, March 2015 34
7% 16%21% 22%
48% 51% 55%
72%
2%1%
3% 17%
36%27% 13%
21%
4%2%
4%
31%
12%
11%
8%
4%
68%
19%
31%
25%
4%5%
15%
0%16%
62%
39%
5% 0%2%
8%0%
2%2% 1% 1%
4% 2% 1%
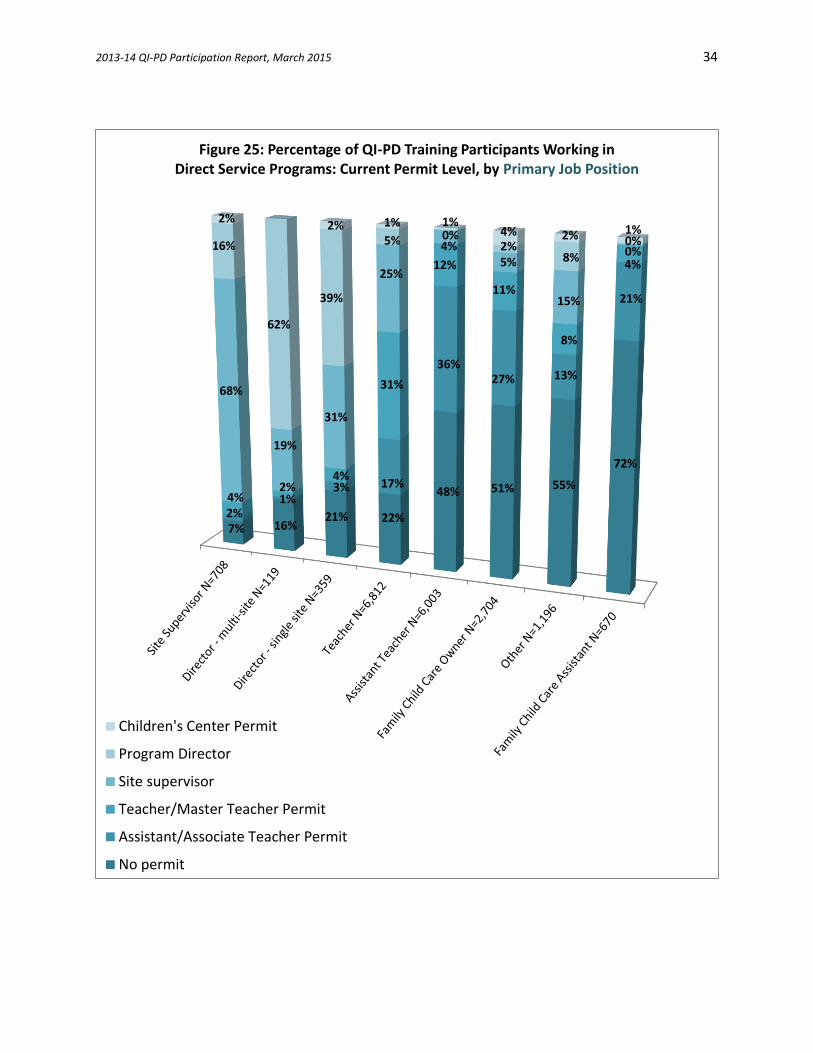
Figure 25: Percentage of QI-PD Training Participants Working in Direct Service Programs: Current Permit Level, by Primary Job Position
Children's Center Permit
Program Director
Site supervisor
Teacher/Master Teacher Permit
Assistant/Associate Teacher Permit
No permit
2013-14 QI-PD Participation Report, March 2015 35
14%22% 22%
30%35%
52% 55%61% 66%
12%
23%
18% 19%
25% 18%
30%28%
12%
18%
24%
12%10%
25% 20%24%
17%19%
8%13%
5%
8%
50%
41%
59%
10%
29%28%
26%19%
17%
6% 4%
9%
6%
50%
18%24%
60%
7%11%
7% 7%10%
2% 0%
6%
2%
6% 6%
20%
2% 1% 1% 1% 2% 2% 0%
7%
1%
Figure 26: Percentage of QI-PD Training Participants Working in Direct Service Programs: Current Permit Level,
by Professional Development Provider (PDP)
Not Specified
Children's Center Permit
Program Director
Site supervisor
Teacher/Master Teacher Permit
Assistant/Associate Teacher Permit
No permit
2013-14 QI-PD Participation Report, March 2015 36
II. Quality Improvement (QI) Professional Development (PD) Training Participants Working in
Direct Service Programs
Section 3: Demographic Characteristics of QI-PD Training Participants Working in Direct
Service Programs
The next figures are related to gender, race/ethnicity, and age.
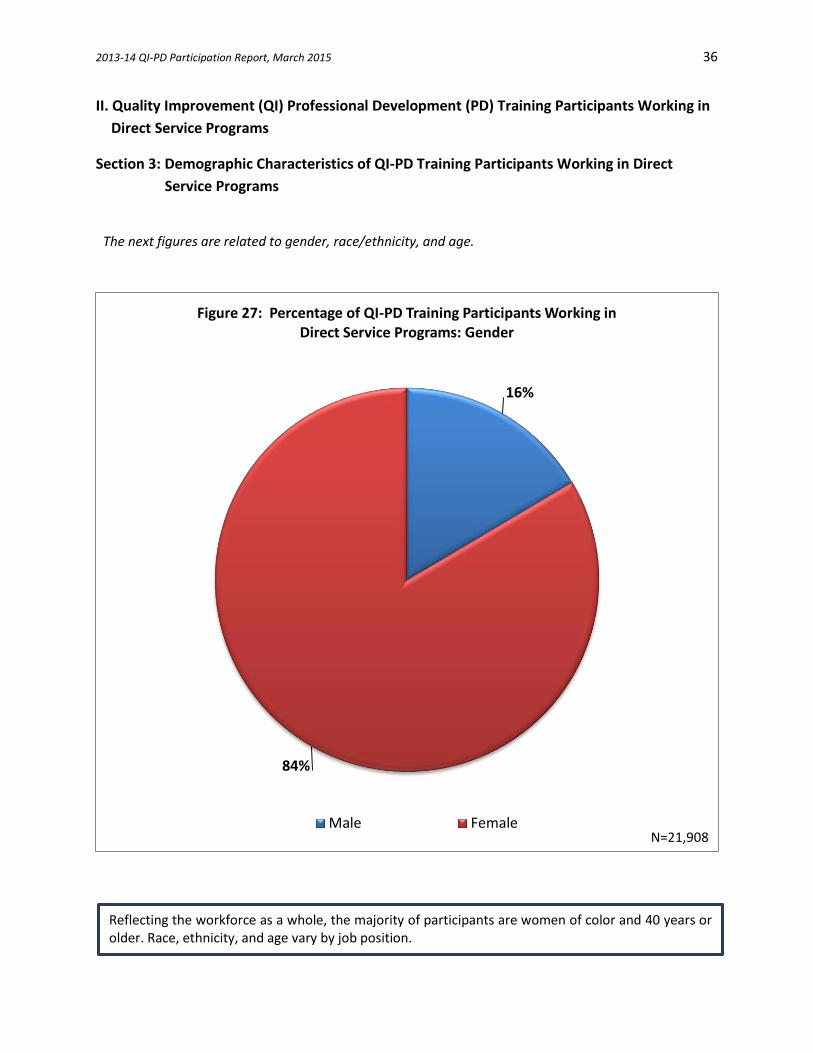
16%
84%
Figure 27: Percentage of QI-PD Training Participants Working in Direct Service Programs: Gender
Male FemaleN=21,908
Reflecting the workforce as a whole, the majority of participants are women of color and 40 years or older. Race, ethnicity, and age vary by job position.
2013-14 QI-PD Participation Report, March 2015 37
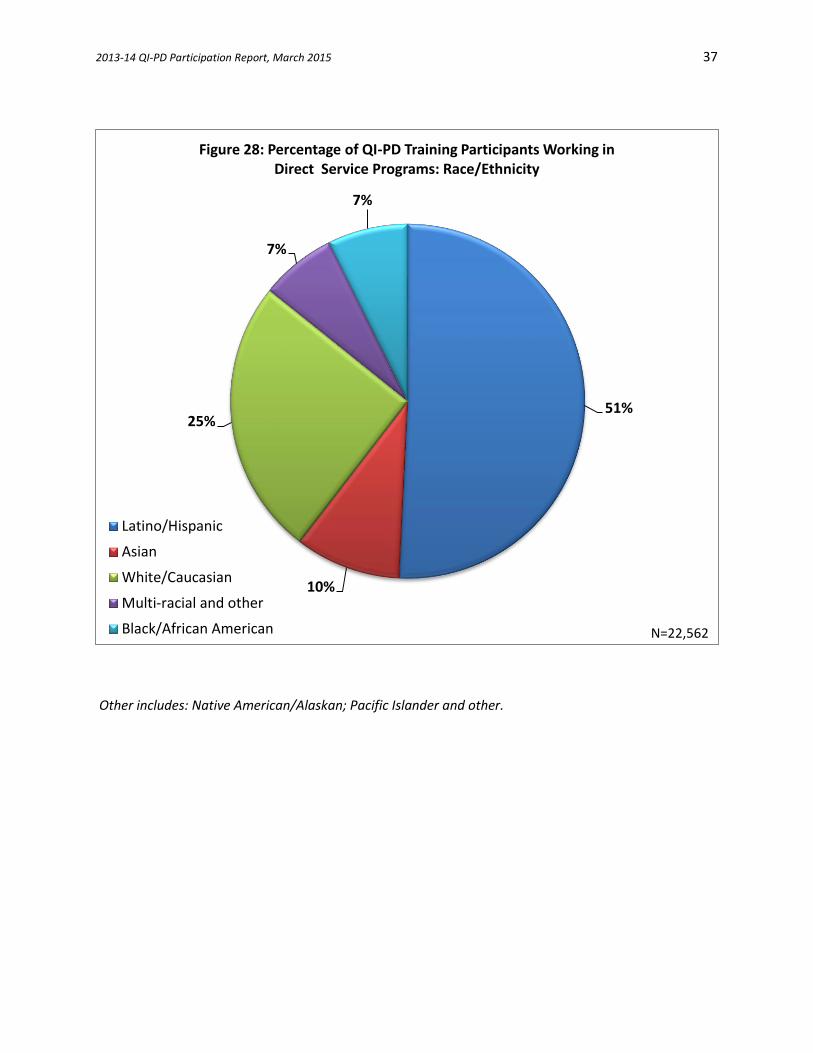
Other includes: Native American/Alaskan; Pacific Islander and other.
51%
10%
25%
7%
7%
Figure 28: Percentage of QI-PD Training Participants Working in Direct Service Programs: Race/Ethnicity
Latino/Hispanic
Asian
White/Caucasian
Multi-racial and other
Black/African American N=22,562
2013-14 QI-PD Participation Report, March 2015 38
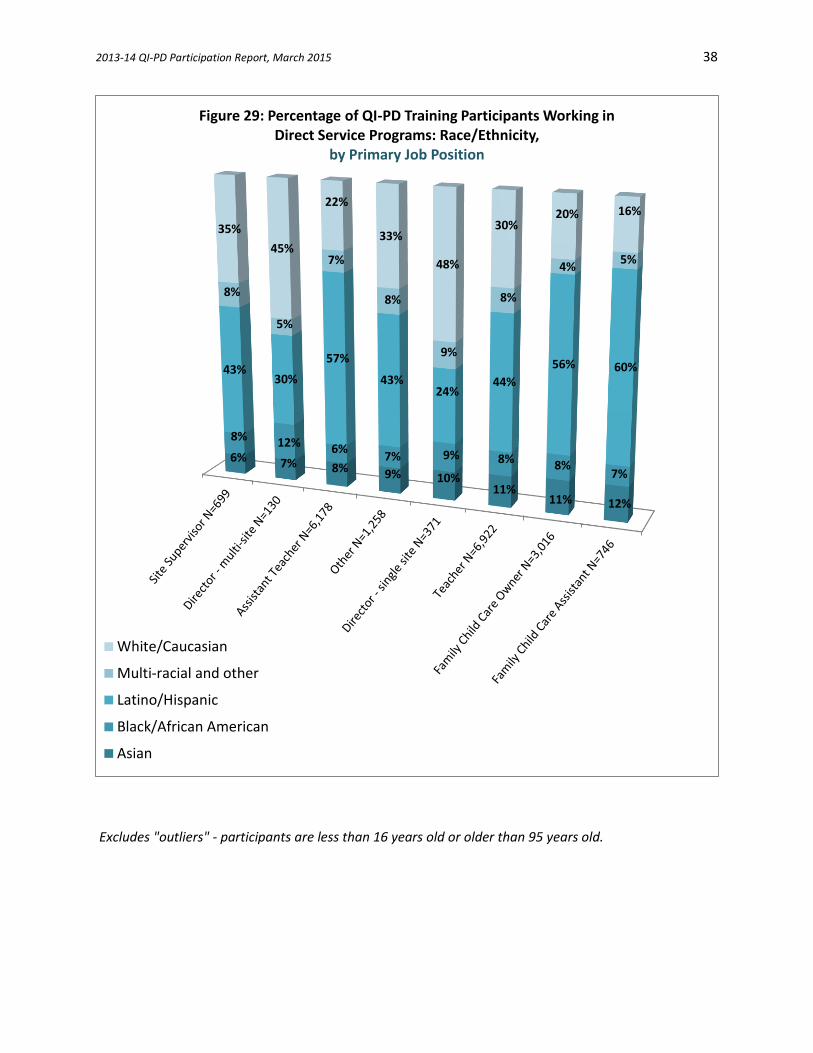
Excludes "outliers" - participants are less than 16 years old or older than 95 years old.
6% 7% 8% 9% 10%11%
11% 12%
8% 12% 6%7% 9% 8% 8%
7%
43%30%
57%
43%24%
44%
56% 60%
8%
5%
7%
8%
9%
8%
4%5%
35%
45%
22%
33%
48%
30%20% 16%
Figure 29: Percentage of QI-PD Training Participants Working in Direct Service Programs: Race/Ethnicity,
by Primary Job Position
White/Caucasian
Multi-racial and other
Latino/Hispanic
Black/African American
Asian
2013-14 QI-PD Participation Report, March 2015 39
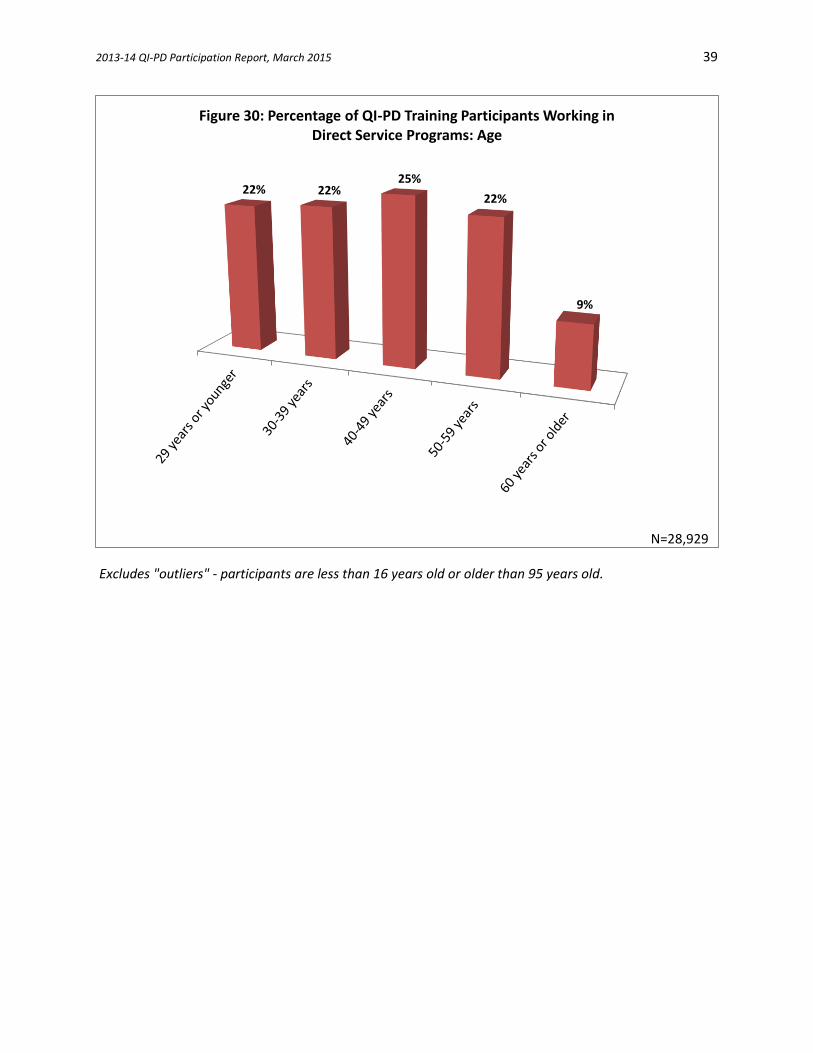
Excludes "outliers" - participants are less than 16 years old or older than 95 years old.
22% 22%25%
22%
9%
Figure 30: Percentage of QI-PD Training Participants Working in Direct Service Programs: Age
N=28,929
2013-14 QI-PD Participation Report, March 2015 40
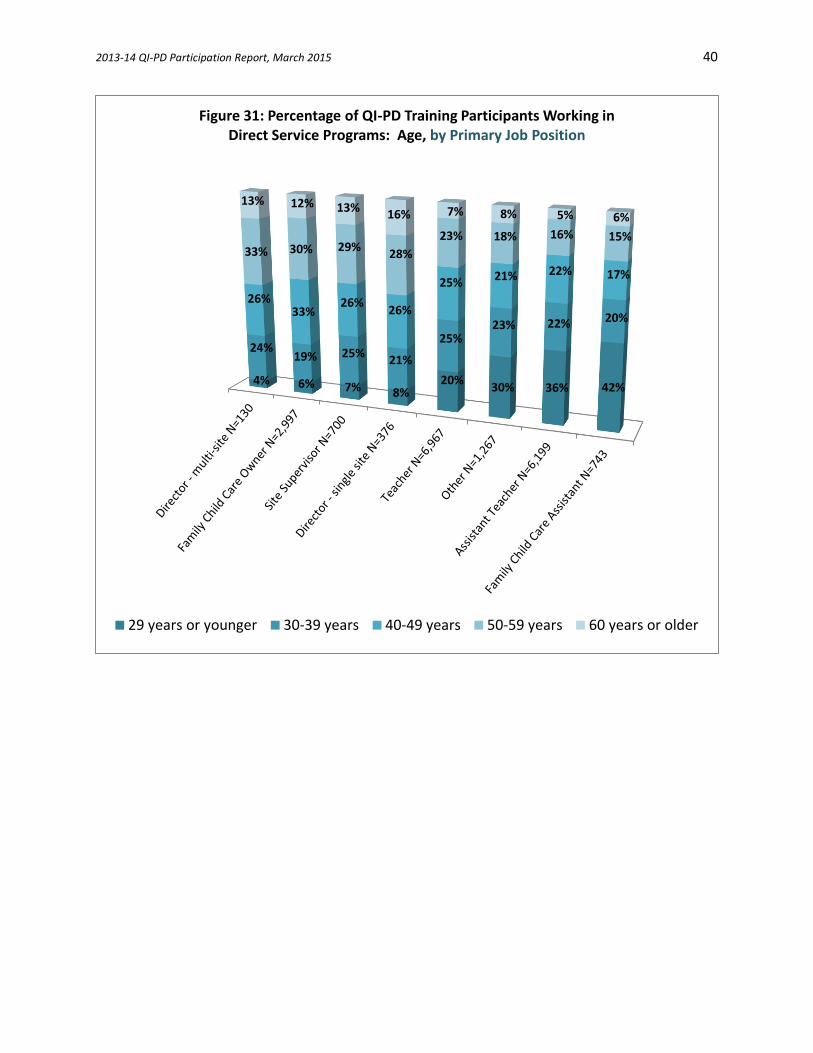
4% 6% 7% 8%20%
30% 36% 42%
24%19% 25%
21%
25%23% 22% 20%
26%33%
26%26%
25% 21% 22% 17%
33% 30% 29%28%
23% 18% 16% 15%
13% 12% 13%16% 7% 8% 5% 6%
Figure 31: Percentage of QI-PD Training Participants Working in Direct Service Programs: Age, by Primary Job Position
29 years or younger 30-39 years 40-49 years 50-59 years 60 years or older
2013-14 QI-PD Participation Report, March 2015 41
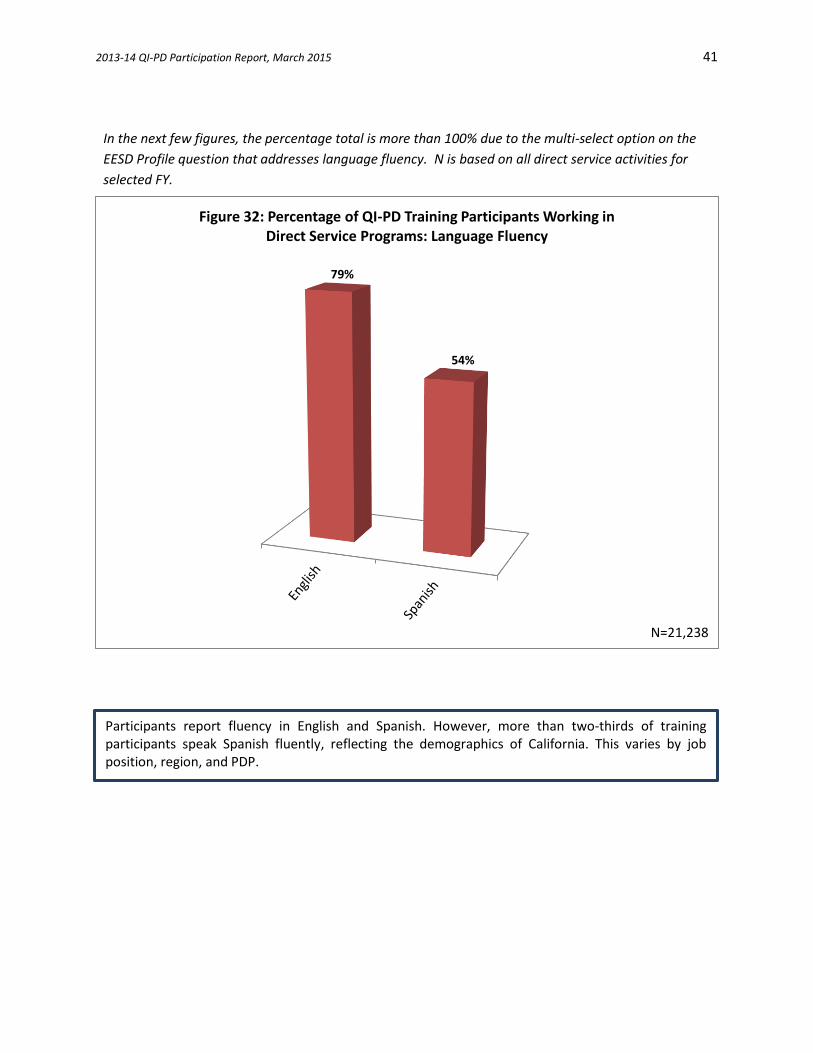
In the next few figures, the percentage total is more than 100% due to the multi-select option on the
EESD Profile question that addresses language fluency. N is based on all direct service activities for
selected FY.
79%
54%
Figure 32: Percentage of QI-PD Training Participants Working in Direct Service Programs: Language Fluency
N=21,238
Participants report fluency in English and Spanish. However, more than two-thirds of training participants speak Spanish fluently, reflecting the demographics of California. This varies by job position, region, and PDP.
2013-14 QI-PD Participation Report, March 2015 42
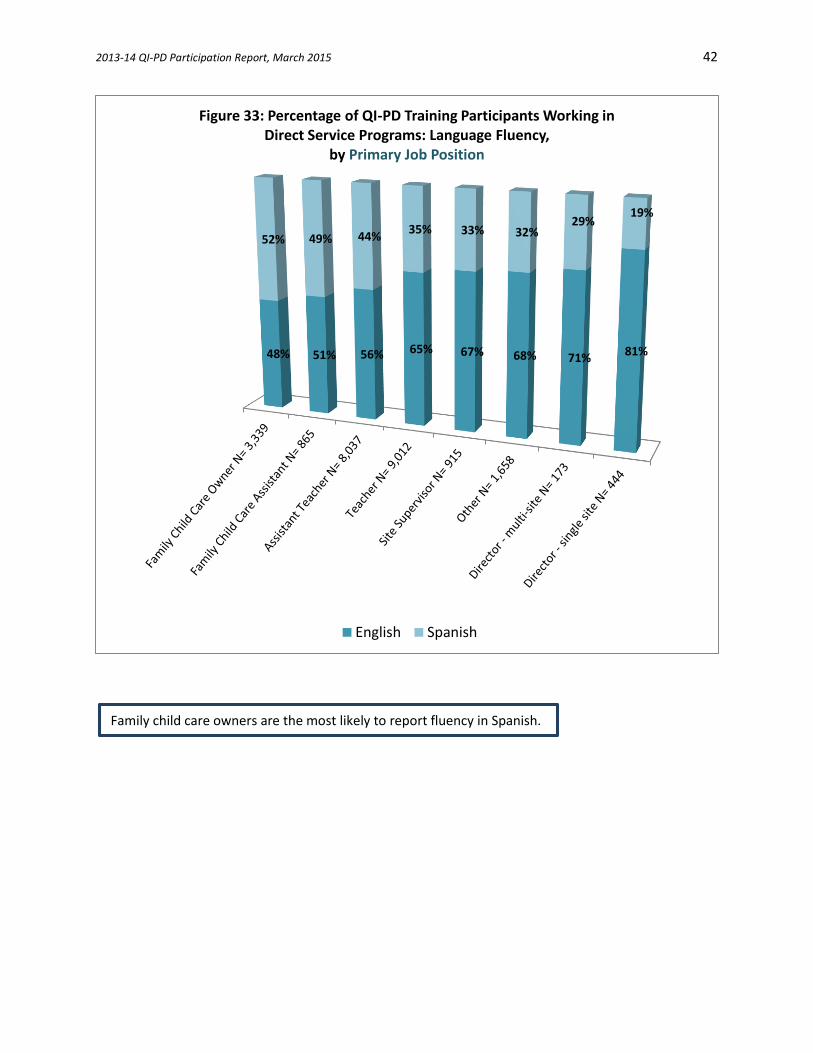
Family child care owners are the most likely to report fluency in Spanish.
48% 51% 56% 65% 67% 68% 71%81%
52% 49% 44%35% 33% 32%
29%19%
Figure 33: Percentage of QI-PD Training Participants Working in Direct Service Programs: Language Fluency,
by Primary Job Position
English Spanish
2013-14 QI-PD Participation Report, March 2015 43
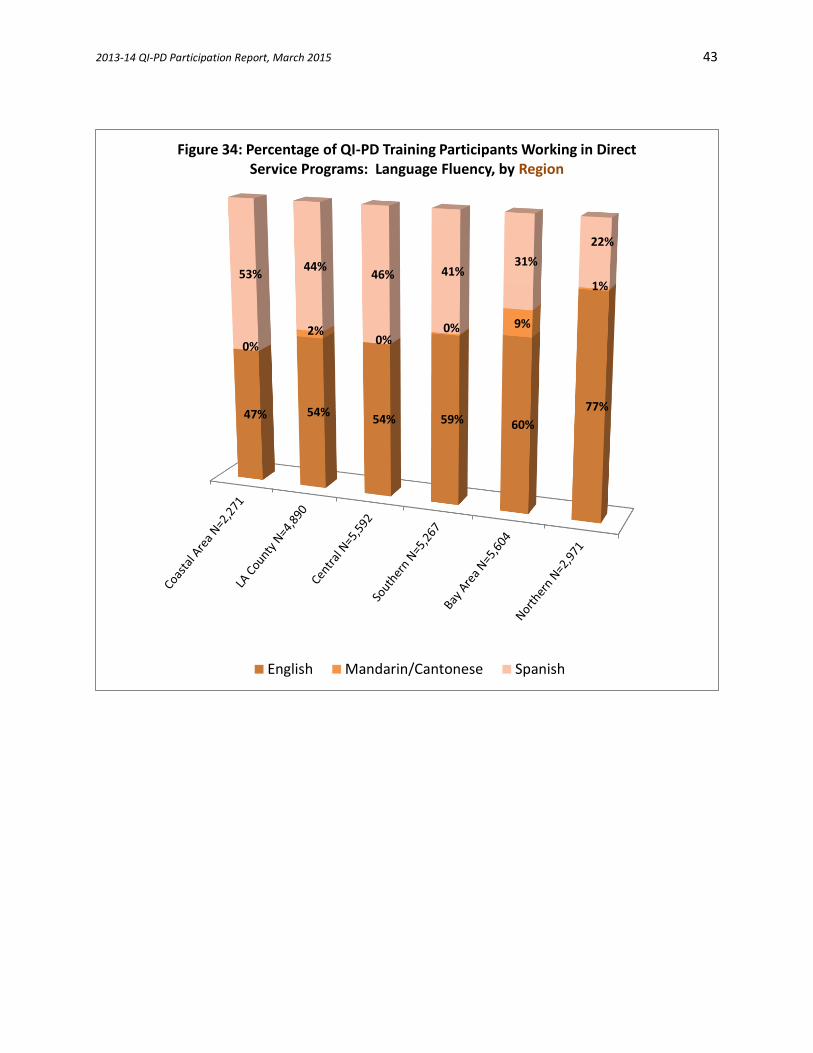
47% 54%54% 59% 60%
77%
0%2%
0%0% 9%
1%53%
44%46% 41%
31%
22%
Figure 34: Percentage of QI-PD Training Participants Working in Direct Service Programs: Language Fluency, by Region
English Mandarin/Cantonese Spanish
2013-14 QI-PD Participation Report, March 2015 44
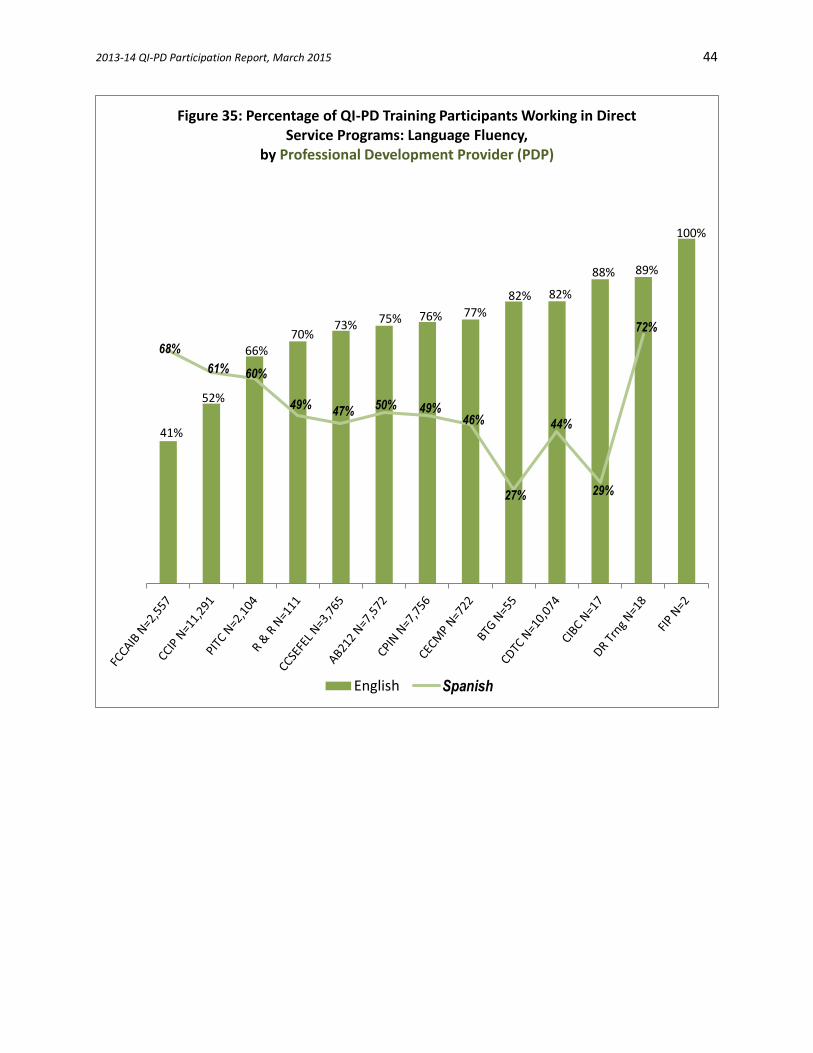
41%
52%
66%70%
73% 75% 76% 77%
82% 82%
88% 89%
100%
68%
61% 60%
49%47%
50% 49%46%
27%
44%
29%
72%
Figure 35: Percentage of QI-PD Training Participants Working in Direct Service Programs: Language Fluency,
by Professional Development Provider (PDP)
English Spanish
2013-14 QI-PD Participation Report, March 2015 45
III. Quality Improvement (QI) Professional Development (PD) Training Participants Working in
Infrastructure Programs
Section 1: Employment Characteristics of QI-PD Training Participants Working in
Infrastructure Programs
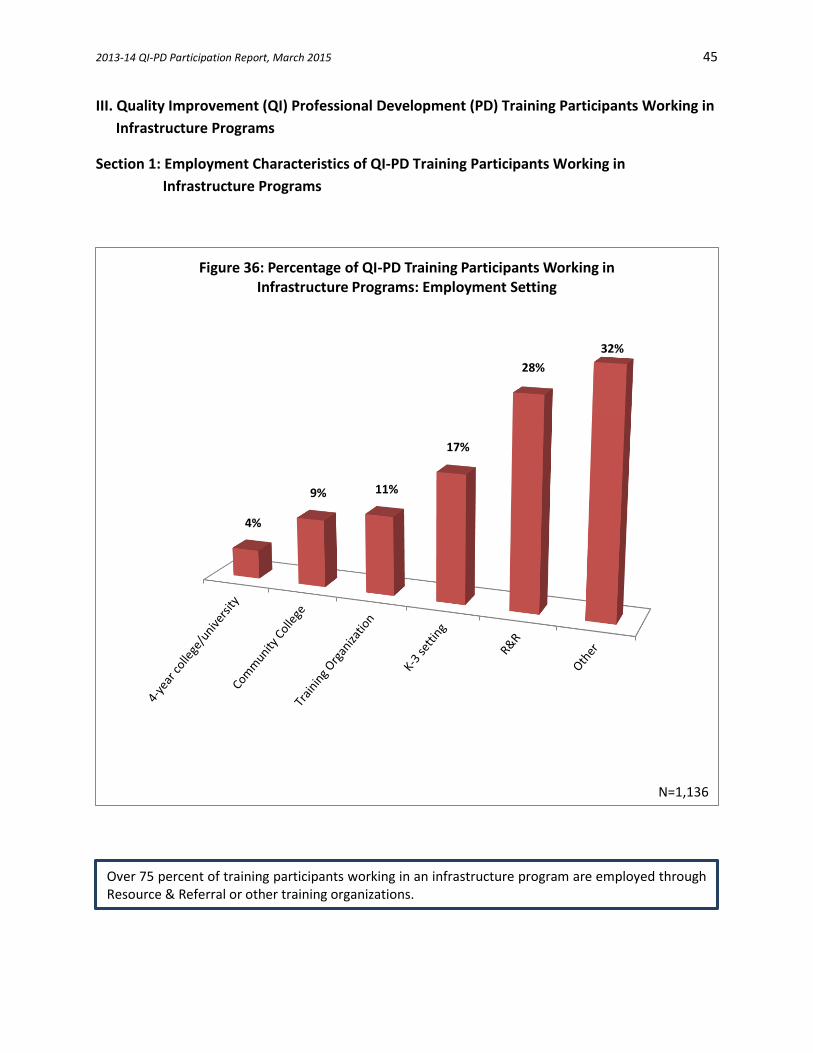
4%
9% 11%
17%
28%
32%
Figure 36: Percentage of QI-PD Training Participants Working in Infrastructure Programs: Employment Setting
N=1,136
Over 75 percent of training participants working in an infrastructure program are employed through Resource & Referral or other training organizations.
2013-14 QI-PD Participation Report, March 2015 46
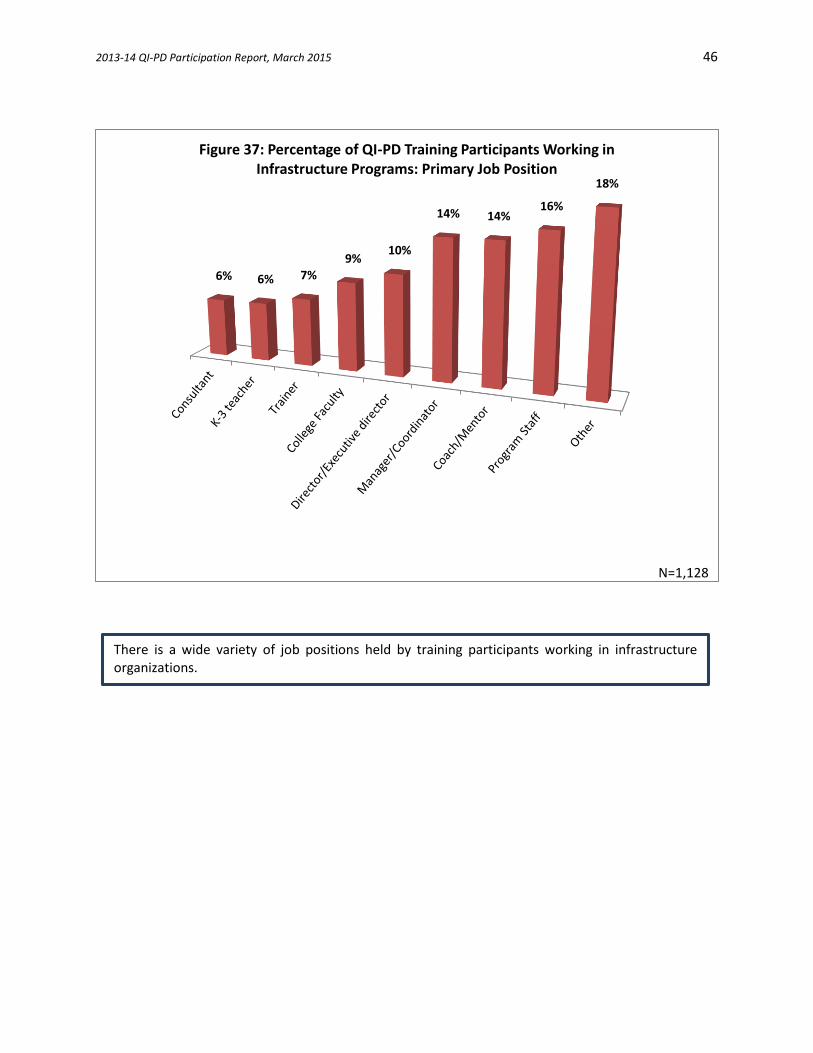
6% 6% 7%
9%10%
14% 14%16%
18%
Figure 37: Percentage of QI-PD Training Participants Working in Infrastructure Programs: Primary Job Position
N=1,128
There is a wide variety of job positions held by training participants working in infrastructure organizations.
2013-14 QI-PD Participation Report, March 2015 47
9%
14%
76%
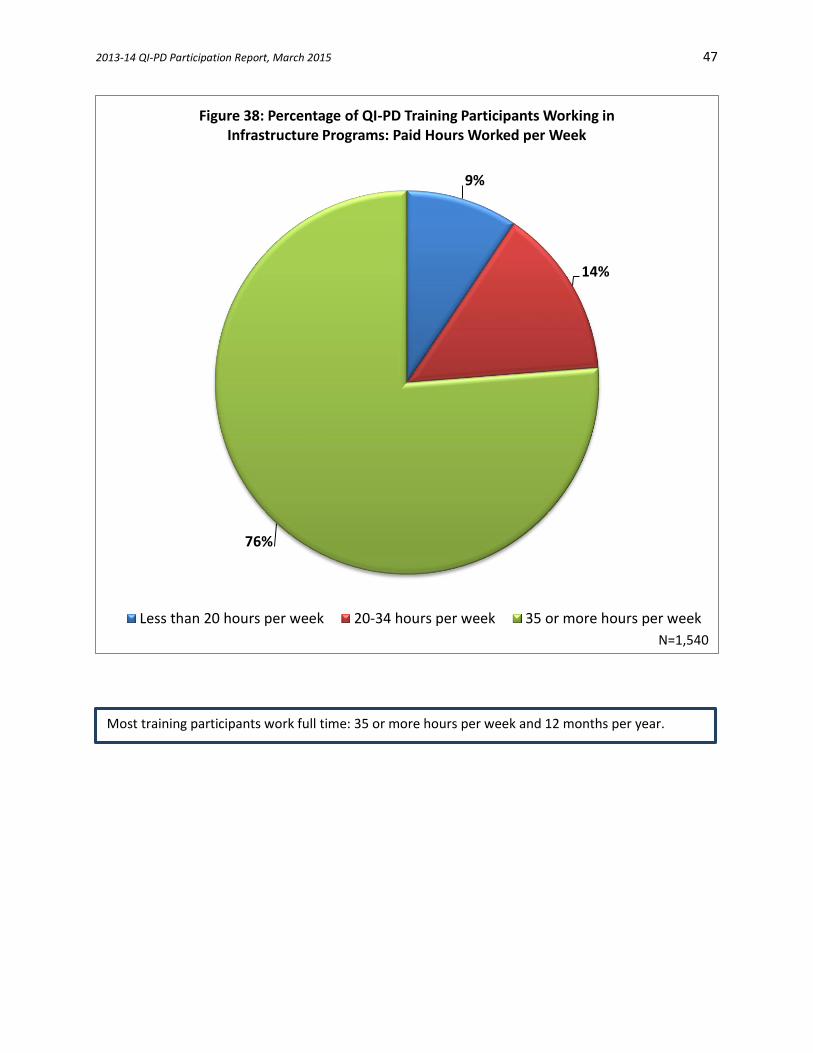
Figure 38: Percentage of QI-PD Training Participants Working in Infrastructure Programs: Paid Hours Worked per Week
Less than 20 hours per week 20-34 hours per week 35 or more hours per week
N=1,540
Most training participants work full time: 35 or more hours per week and 12 months per year.
2013-14 QI-PD Participation Report, March 2015 48
7%
21%
9%
58%
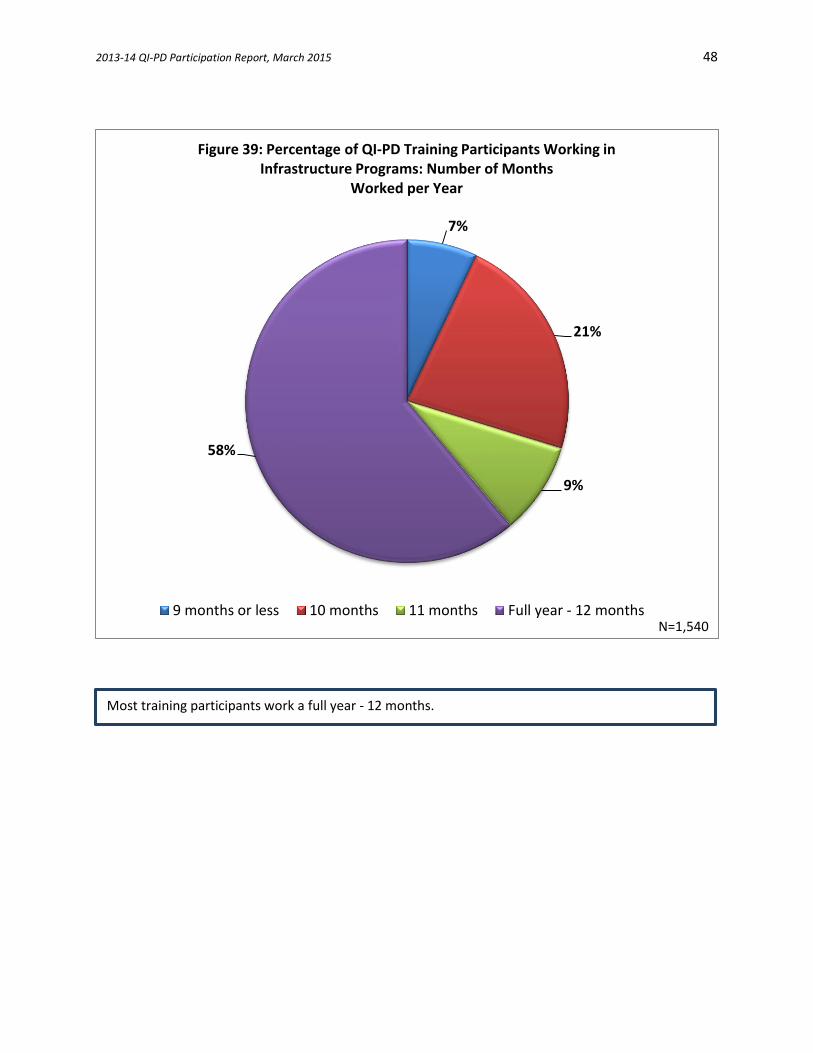
Figure 39: Percentage of QI-PD Training Participants Working in Infrastructure Programs: Number of Months
Worked per Year
9 months or less 10 months 11 months Full year - 12 monthsN=1,540
Most training participants work a full year - 12 months.
2013-14 QI-PD Participation Report, March 2015 49
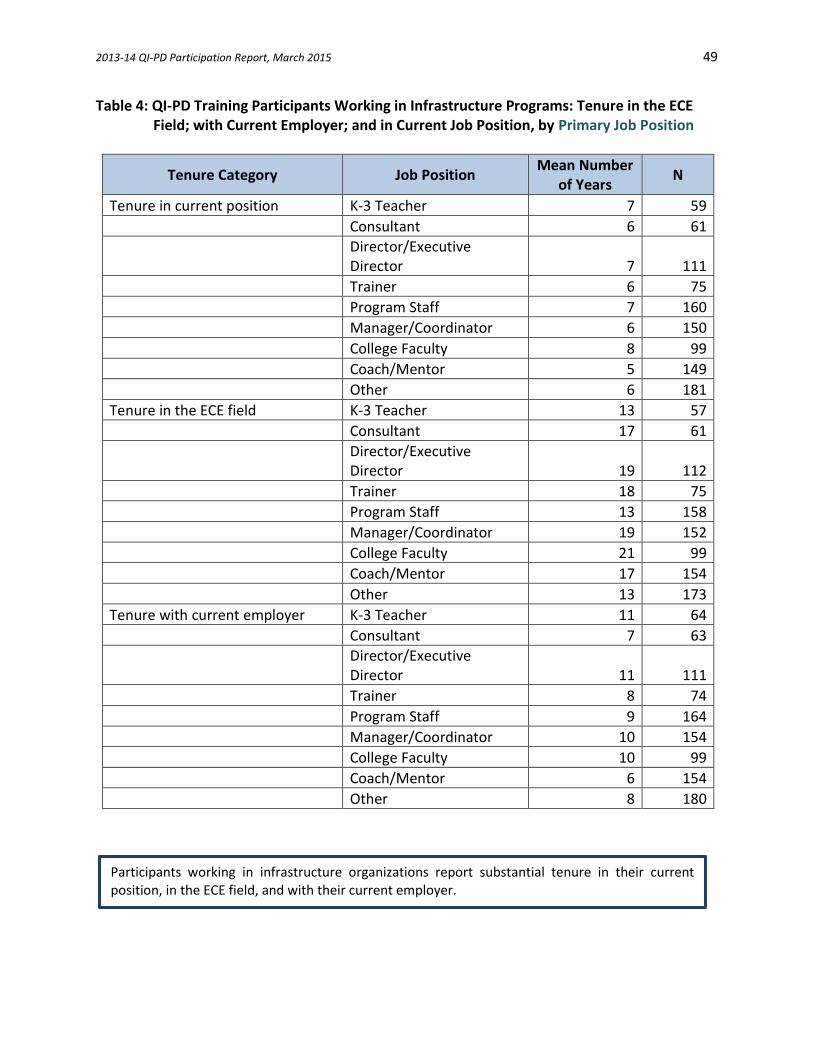
Table 4: QI-PD Training Participants Working in Infrastructure Programs: Tenure in the ECE Field; with Current Employer; and in Current Job Position, by Primary Job Position
Tenure Category Job Position Mean Number
of Years N
Tenure in current position K-3 Teacher 7 59
Consultant 6 61
Director/Executive Director 7 111
Trainer 6 75
Program Staff 7 160
Manager/Coordinator 6 150
College Faculty 8 99
Coach/Mentor 5 149
Other 6 181
Tenure in the ECE field K-3 Teacher 13 57
Consultant 17 61
Director/Executive Director 19 112
Trainer 18 75
Program Staff 13 158
Manager/Coordinator 19 152
College Faculty 21 99
Coach/Mentor 17 154
Other 13 173
Tenure with current employer K-3 Teacher 11 64
Consultant 7 63
Director/Executive Director 11 111
Trainer 8 74
Program Staff 9 164
Manager/Coordinator 10 154
College Faculty 10 99
Coach/Mentor 6 154
Other 8 180
Participants working in infrastructure organizations report substantial tenure in their current position, in the ECE field, and with their current employer.
2013-14 QI-PD Participation Report, March 2015 50
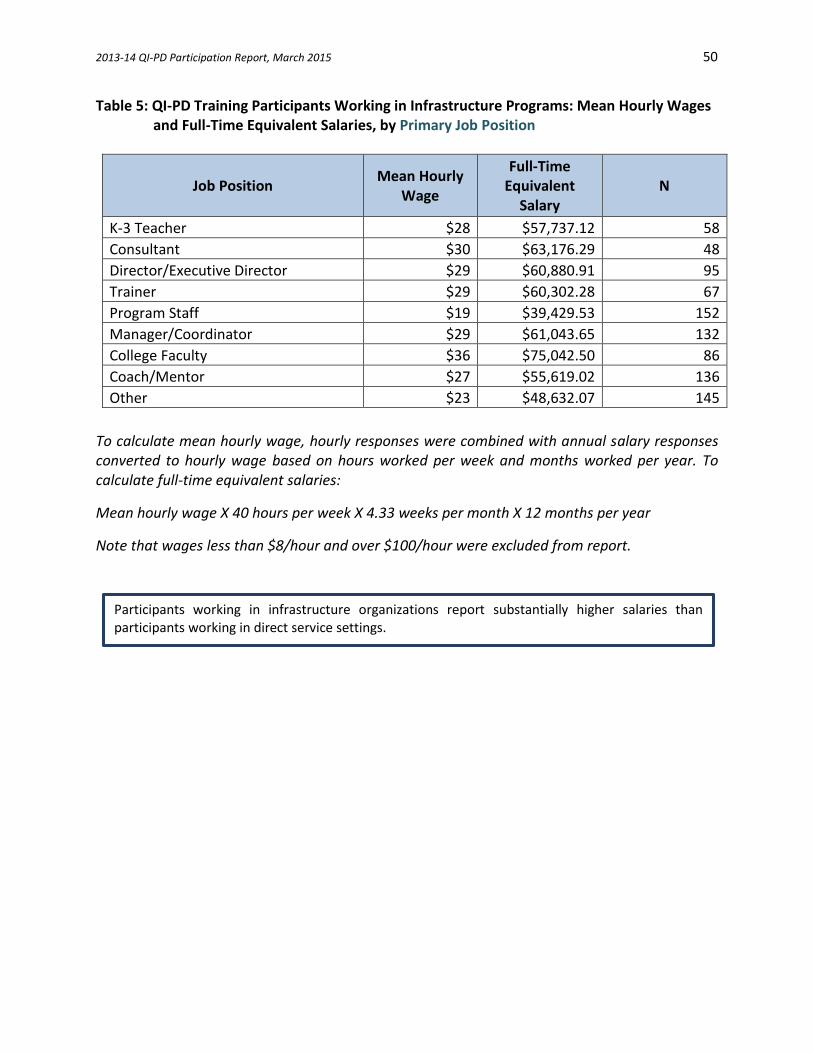
Table 5: QI-PD Training Participants Working in Infrastructure Programs: Mean Hourly Wages and Full-Time Equivalent Salaries, by Primary Job Position
Job Position Mean Hourly
Wage
Full-Time Equivalent
Salary N
K-3 Teacher $28 $57,737.12 58
Consultant $30 $63,176.29 48
Director/Executive Director $29 $60,880.91 95
Trainer $29 $60,302.28 67
Program Staff $19 $39,429.53 152
Manager/Coordinator $29 $61,043.65 132
College Faculty $36 $75,042.50 86
Coach/Mentor $27 $55,619.02 136
Other $23 $48,632.07 145
To calculate mean hourly wage, hourly responses were combined with annual salary responses converted to hourly wage based on hours worked per week and months worked per year. To calculate full-time equivalent salaries:
Mean hourly wage X 40 hours per week X 4.33 weeks per month X 12 months per year
Note that wages less than $8/hour and over $100/hour were excluded from report.
Participants working in infrastructure organizations report substantially higher salaries than participants working in direct service settings.
2013-14 QI-PD Participation Report, March 2015 51
II. Quality Improvement (QI) Professional Development (PD) Training Participants Working in
Infrastructure Programs
Section 2: Educational and Permit Level of QI-PD Training Participants Working in
Infrastructure Programs
16%
16%
35%
33%
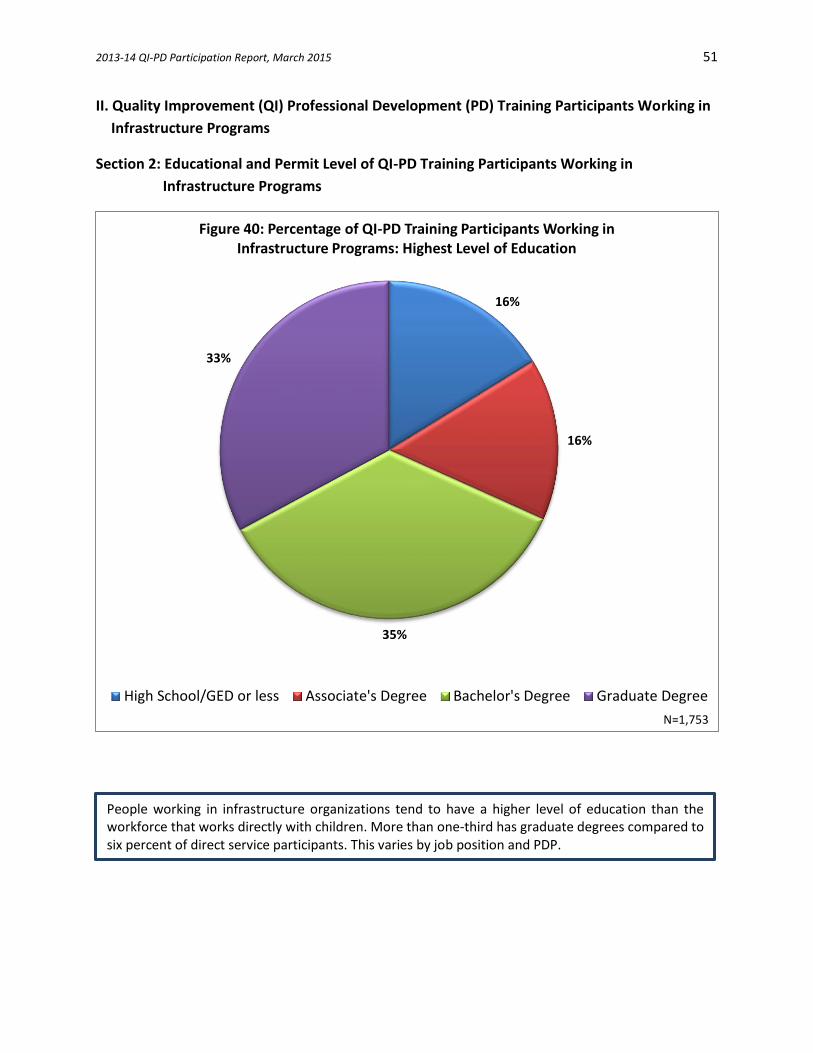
Figure 40: Percentage of QI-PD Training Participants Working in Infrastructure Programs: Highest Level of Education
High School/GED or less Associate's Degree Bachelor's Degree Graduate Degree
N=1,753
People working in infrastructure organizations tend to have a higher level of education than the workforce that works directly with children. More than one-third has graduate degrees compared to six percent of direct service participants. This varies by job position and PDP.
2013-14 QI-PD Participation Report, March 2015 52
3% 4%4% 6% 8% 8% 12%
21% 31%
6% 11%1%
16% 14%
7% 5%
15%
22%53% 49%
18%
32% 35%43%
9%
29%
35%
38% 37%
76%
47% 43% 42%
74%
35%
12%
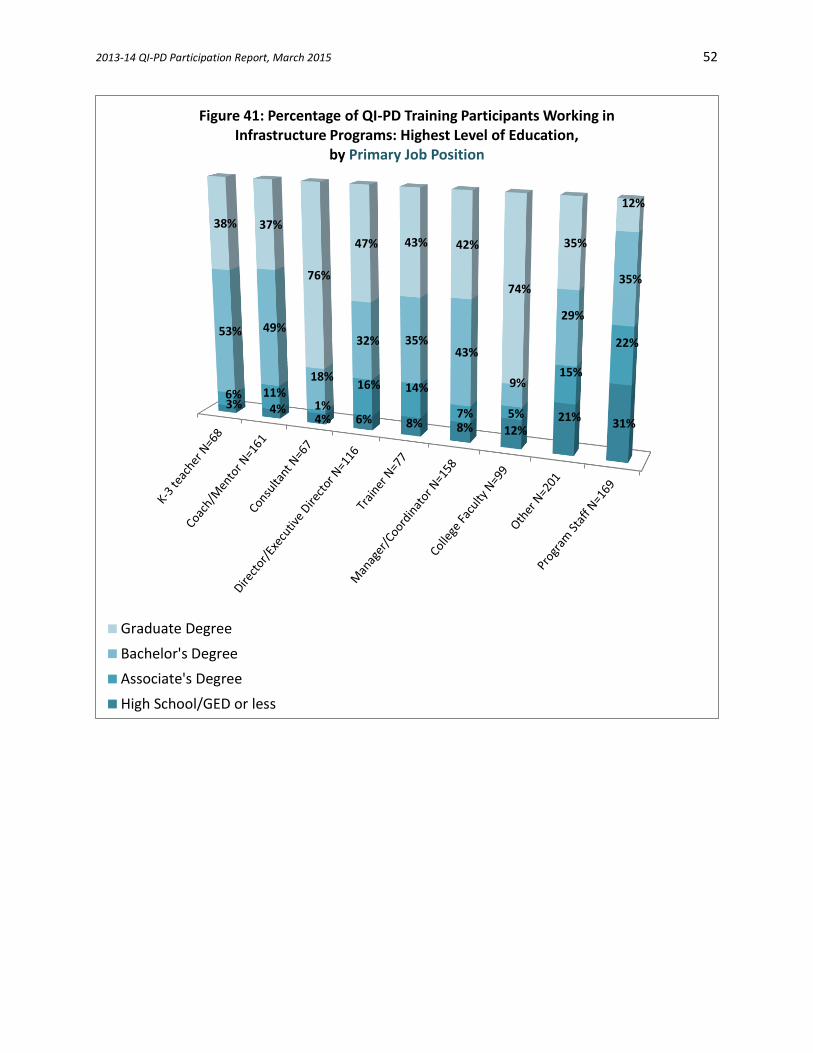
Figure 41: Percentage of QI-PD Training Participants Working in Infrastructure Programs: Highest Level of Education,
by Primary Job Position
Graduate Degree
Bachelor's Degree
Associate's Degree
High School/GED or less
2013-14 QI-PD Participation Report, March 2015 53
1% 4% 4%8%
8%
26% 29%50% 57%
6%
31% 17%
4%
12%19%
17%
17%
17%
40%
47%
44%
25%
21%
31%
15%
18%
82%
51%
17%
32%
63%
41%
21% 17% 7%
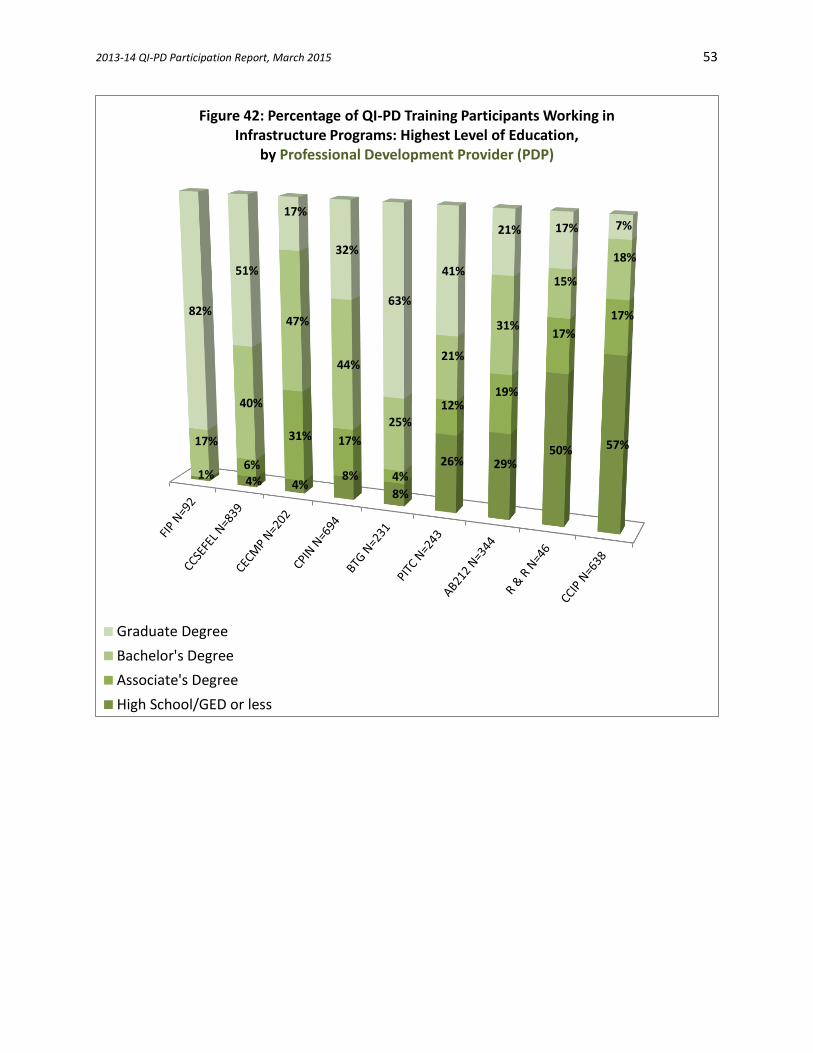
Figure 42: Percentage of QI-PD Training Participants Working in Infrastructure Programs: Highest Level of Education,
by Professional Development Provider (PDP)
Graduate Degree
Bachelor's Degree
Associate's Degree
High School/GED or less
2013-14 QI-PD Participation Report, March 2015 54
39%
2%
5%4%
22%
20%
2%
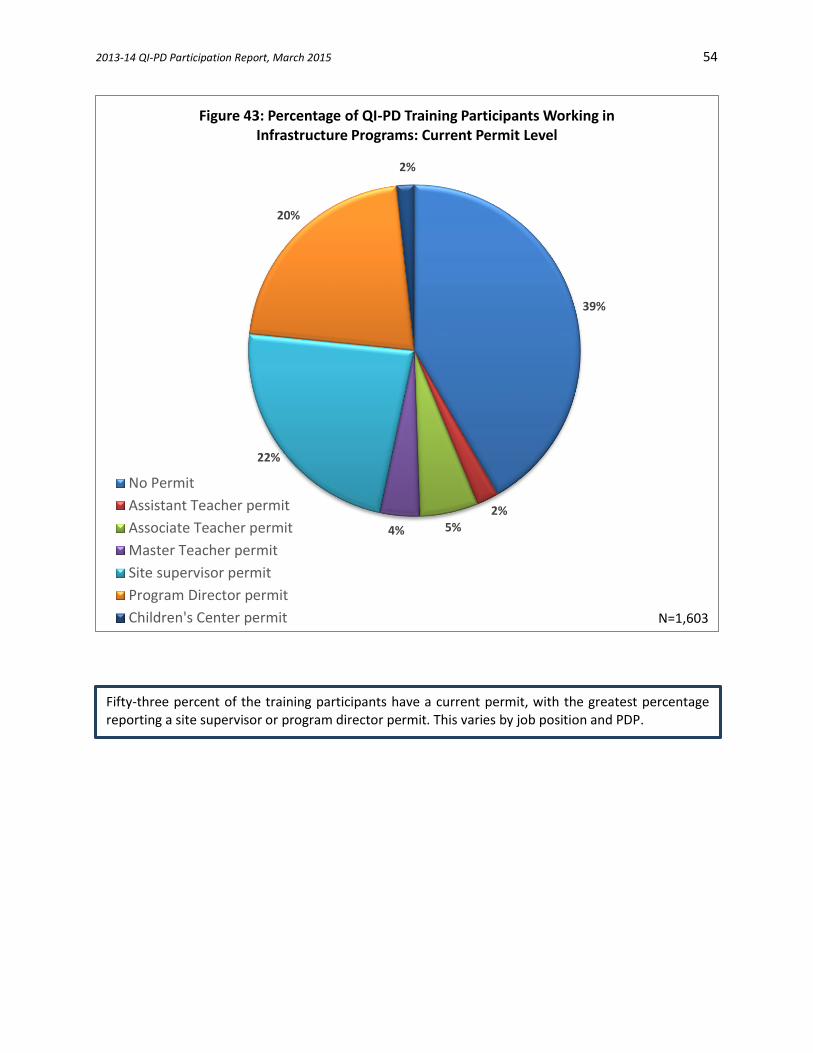
Figure 43: Percentage of QI-PD Training Participants Working in Infrastructure Programs: Current Permit Level
No Permit
Assistant Teacher permit
Associate Teacher permit
Master Teacher permit
Site supervisor permit
Program Director permit
Children's Center permit N=1,603
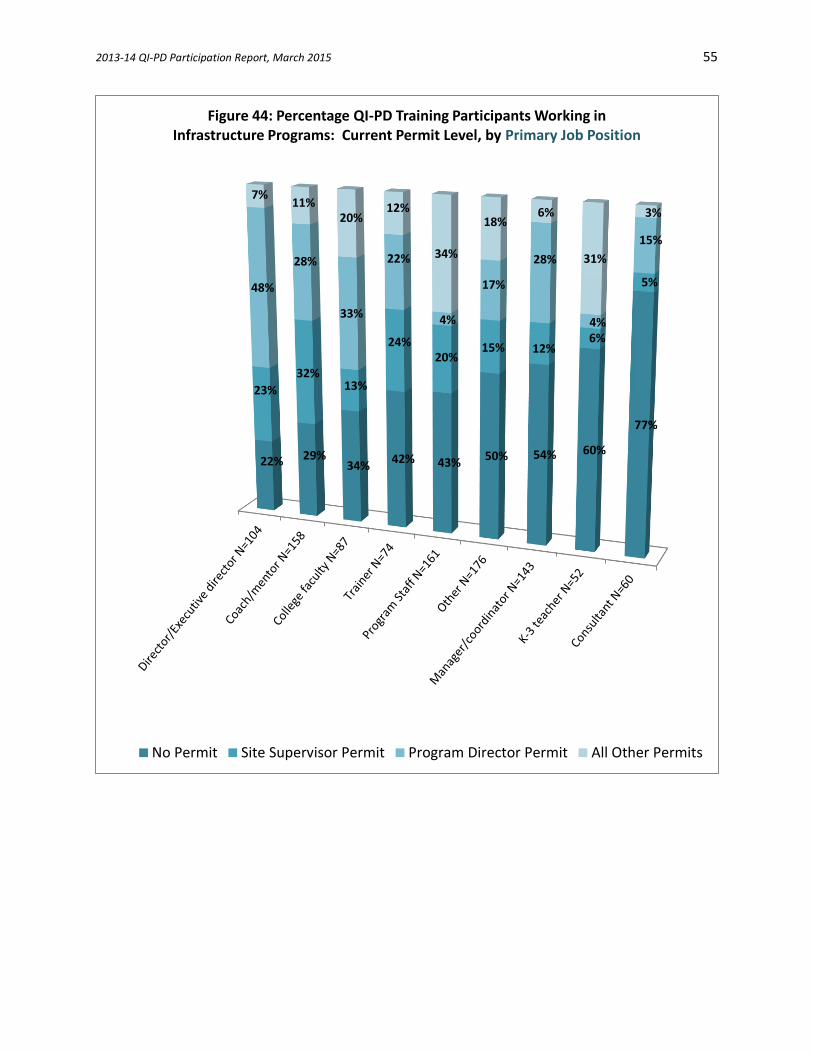
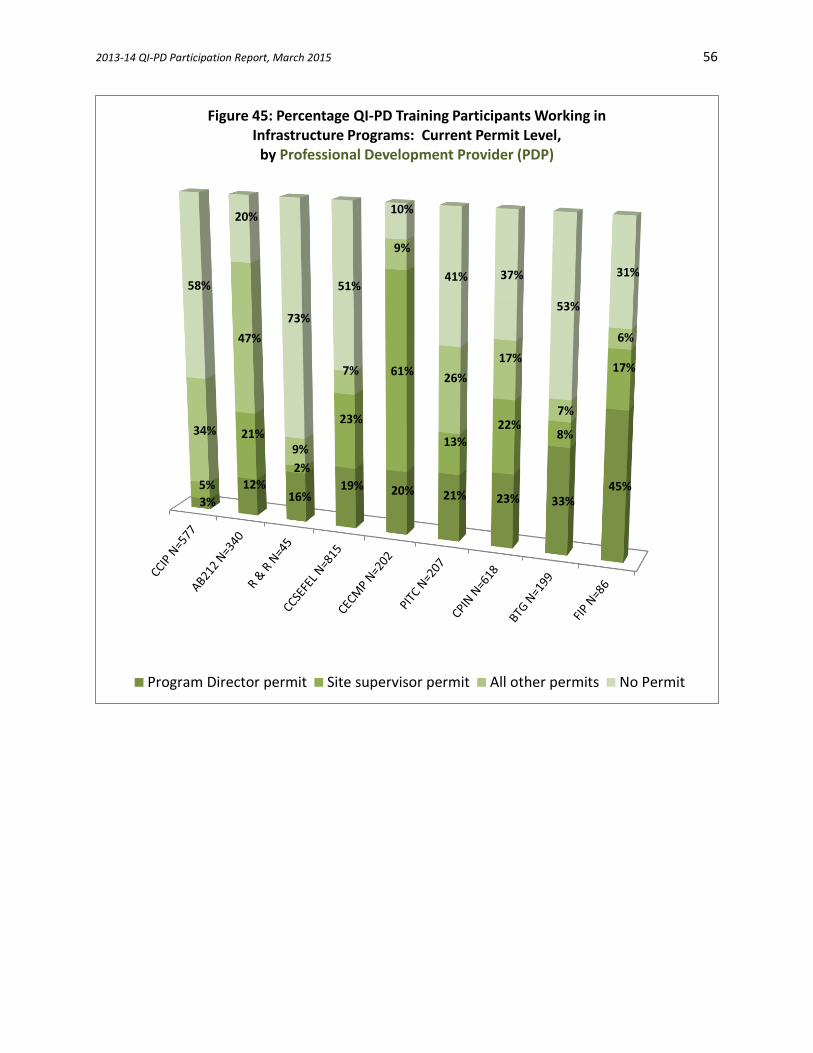
Fifty-three percent of the training participants have a current permit, with the greatest percentage reporting a site supervisor or program director permit. This varies by job position and PDP.
2013-14 QI-PD Participation Report, March 2015 55
22% 29%34%
42% 43%50% 54% 60%
77%
23%
32%13%
24%20%
15% 12%6%
5%48%
28%
33%
22%
4%
17%
28%
4%
15%
7%11%
20%12%
34%
18%6%
31%
3%
Figure 44: Percentage QI-PD Training Participants Working in Infrastructure Programs: Current Permit Level, by Primary Job Position
No Permit Site Supervisor Permit Program Director Permit All Other Permits
2013-14 QI-PD Participation Report, March 2015 56
3%
12%16%
19% 20% 21% 23% 33%45%5%
21%
2%
23%
61%
13%
22%8%
17%
34%
47%
9%
7%
9%
26%
17%
7%
6%
58%
20%
73%
51%
10%
41% 37%
53%
31%
Figure 45: Percentage QI-PD Training Participants Working in Infrastructure Programs: Current Permit Level,
by Professional Development Provider (PDP)
Program Director permit Site supervisor permit All other permits No Permit
2013-14 QI-PD Participation Report, March 2015 57
III. Quality Improvement (QI) Professional Development (PD) Training Participants Working in
Infrastructure Programs
Section 3: Demographic Characteristics of QI-PD Training Participants Working in
Infrastructure Programs
24%
76%
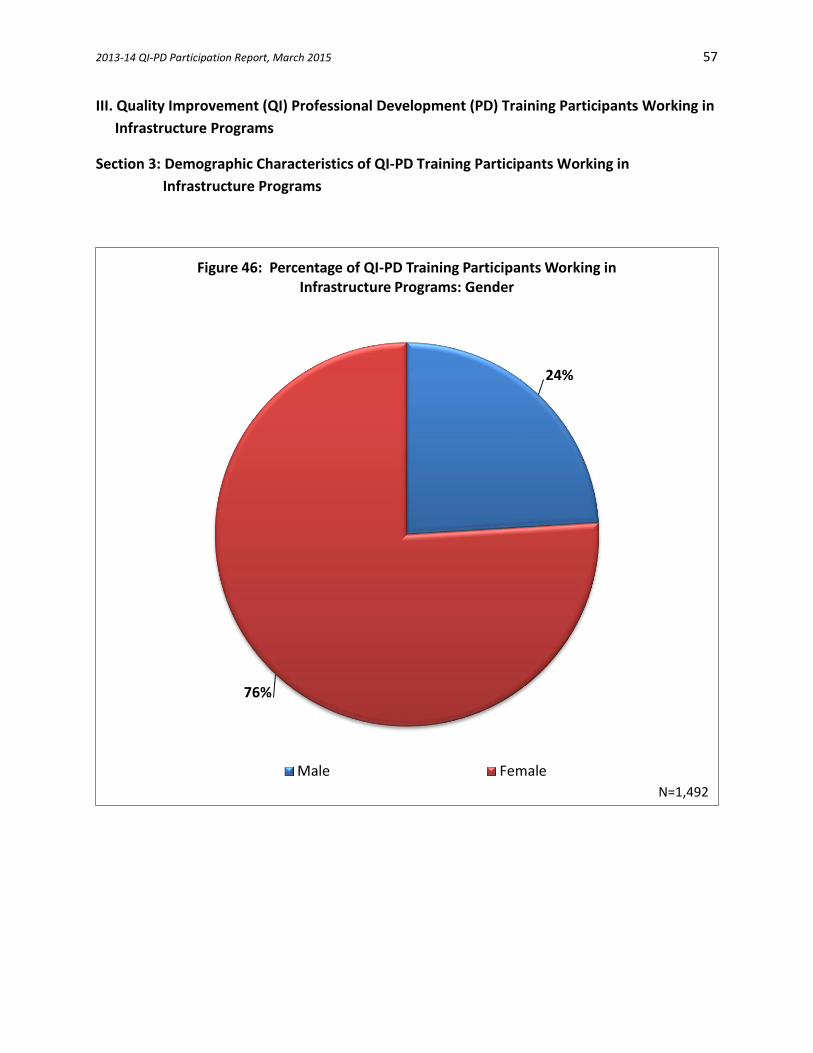
Figure 46: Percentage of QI-PD Training Participants Working in Infrastructure Programs: Gender
Male Female
N=1,492
2013-14 QI-PD Participation Report, March 2015 58
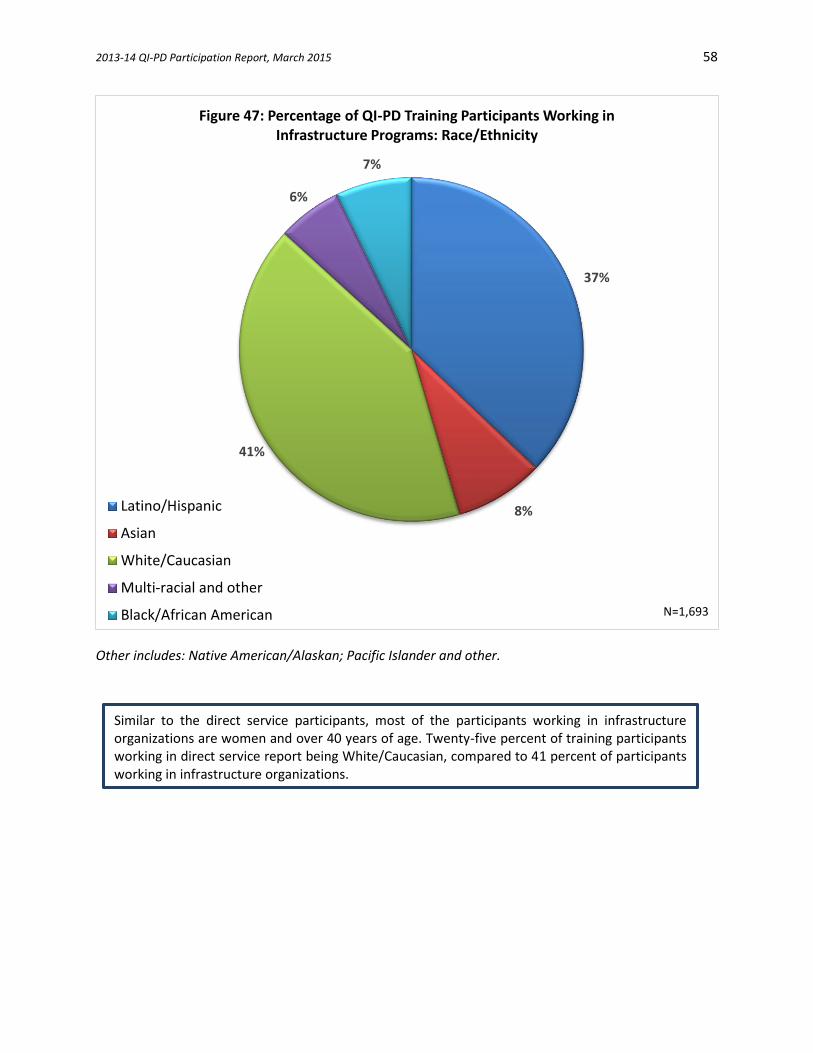
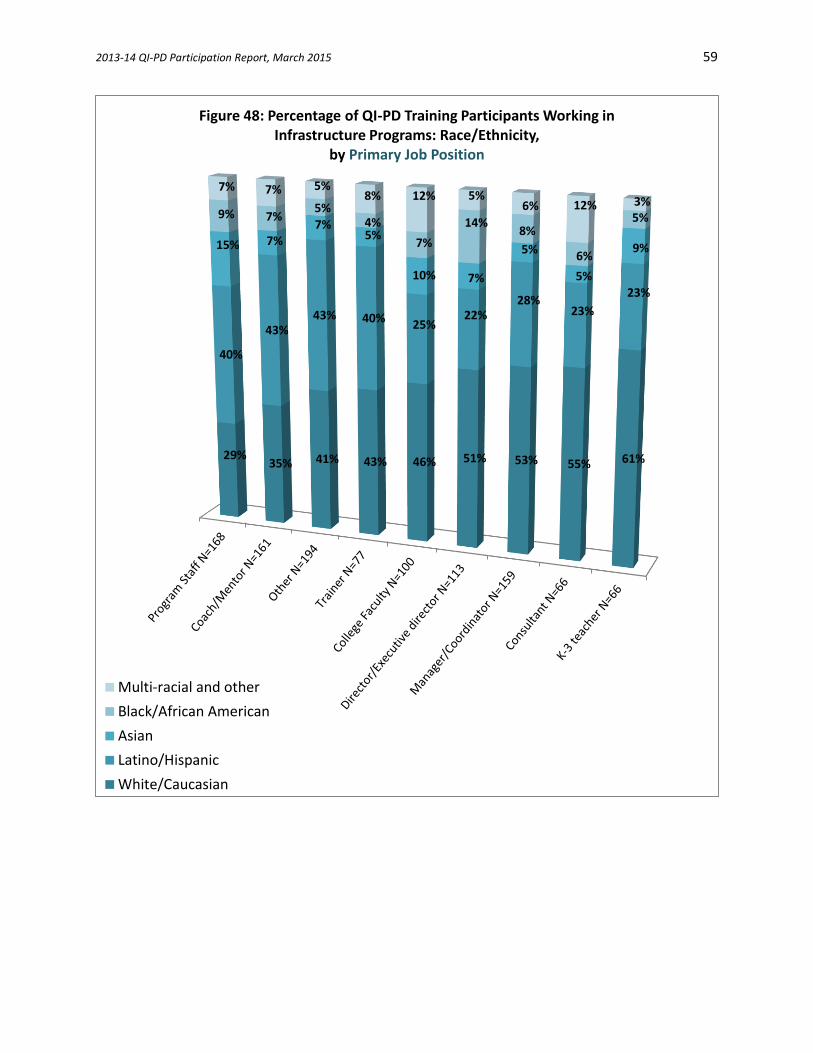
Other includes: Native American/Alaskan; Pacific Islander and other.
Similar to the direct service participants, most of the participants working in infrastructure organizations are women and over 40 years of age. Twenty-five percent of training participants working in direct service report being White/Caucasian, compared to 41 percent of participants working in infrastructure organizations.
37%
8%
41%
6%
7%
Figure 47: Percentage of QI-PD Training Participants Working in Infrastructure Programs: Race/Ethnicity
Latino/Hispanic
Asian
White/Caucasian
Multi-racial and other
Black/African American N=1,693
2013-14 QI-PD Participation Report, March 2015 59
29%35% 41% 43% 46% 51% 53% 55% 61%
40%
43%43% 40% 25%
22%28%
23%
23%
15% 7%7%
5%
10% 7%
5%
5%
9%
9% 7%5%
4%
7%
14%8%
6%
5%
7% 7% 5%8% 12% 5%
6% 12% 3%
Figure 48: Percentage of QI-PD Training Participants Working in Infrastructure Programs: Race/Ethnicity,
by Primary Job Position
Multi-racial and other
Black/African American
Asian
Latino/Hispanic
White/Caucasian
2013-14 QI-PD Participation Report, March 2015 60
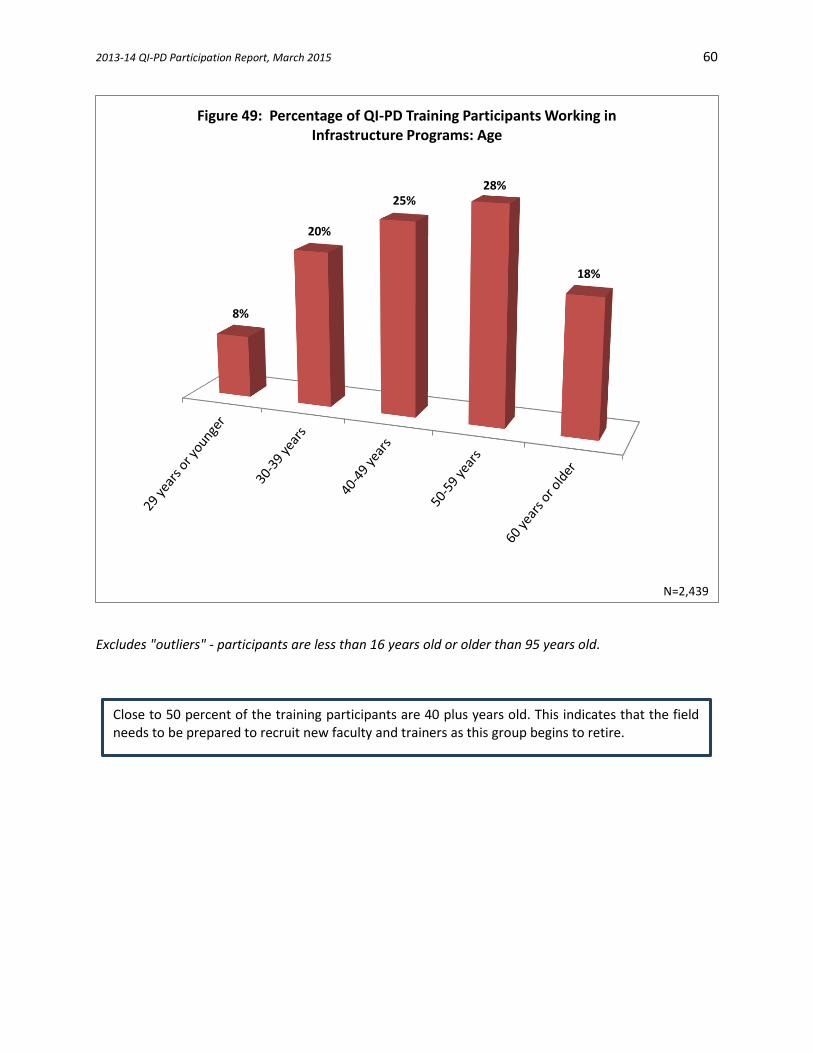
Excludes "outliers" - participants are less than 16 years old or older than 95 years old.
Close to 50 percent of the training participants are 40 plus years old. This indicates that the field needs to be prepared to recruit new faculty and trainers as this group begins to retire.
8%
20%
25%28%
18%
Figure 49: Percentage of QI-PD Training Participants Working in Infrastructure Programs: Age
N=2,439
2013-14 QI-PD Participation Report, March 2015 61
1% 3% 4% 5% 7% 8% 9% 13%17%
17%
29%
15% 17%27%
23%16%
22% 23%
33%
29%
19%
39%
28%
26%
34%
23% 21%
32%
18%
34%
21%26%
31%31% 28% 25%
18%21%
29%18%
11% 13% 9%13% 15%
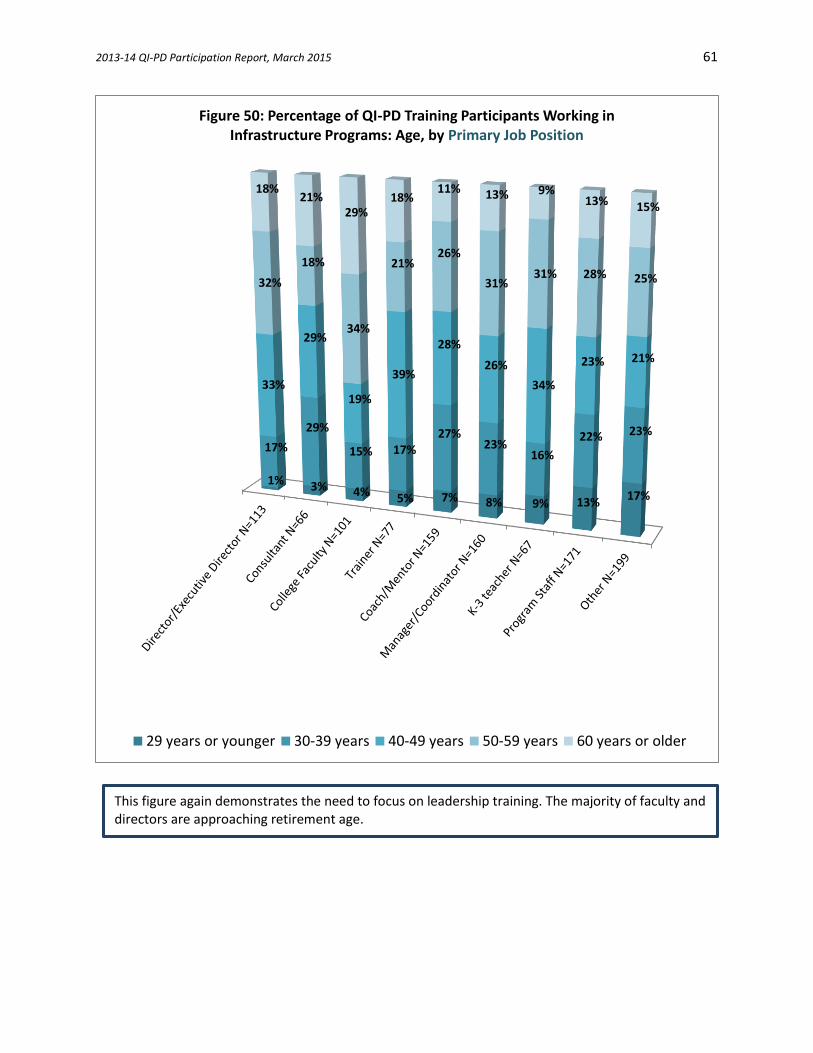
Figure 50: Percentage of QI-PD Training Participants Working in Infrastructure Programs: Age, by Primary Job Position
29 years or younger 30-39 years 40-49 years 50-59 years 60 years or older
This figure again demonstrates the need to focus on leadership training. The majority of faculty and directors are approaching retirement age.
2013-14 QI-PD Participation Report, March 2015 62
99%
43%
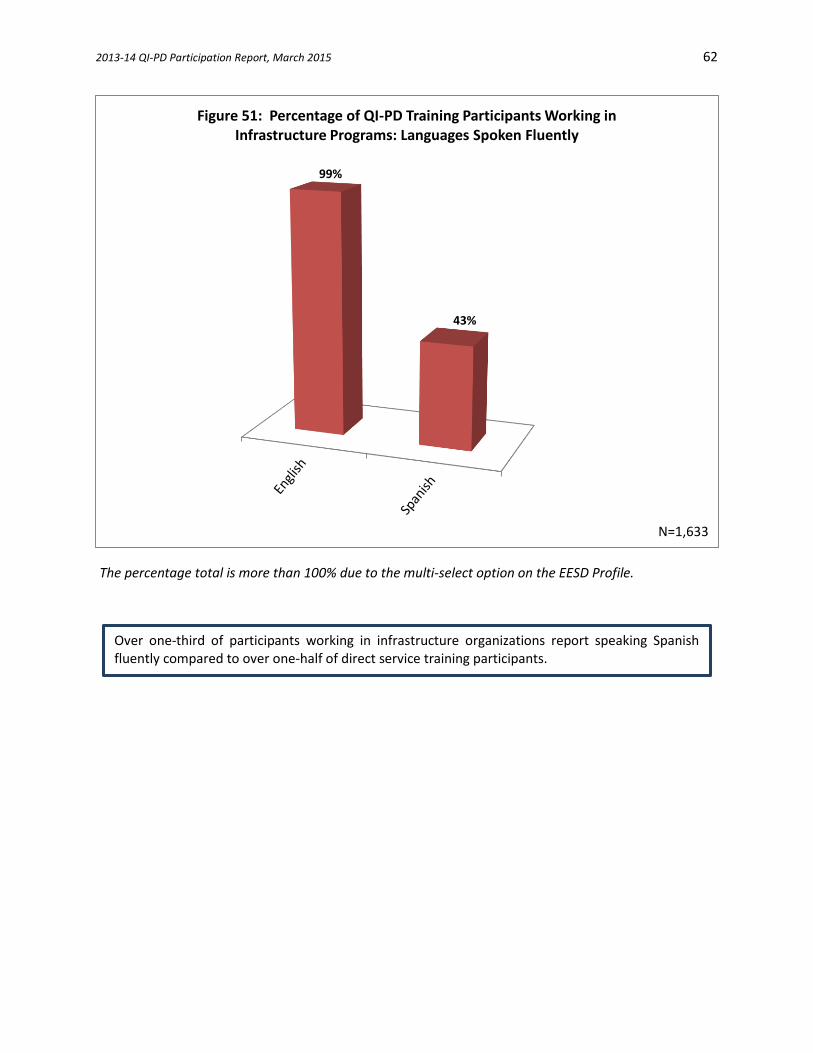
Figure 51: Percentage of QI-PD Training Participants Working in Infrastructure Programs: Languages Spoken Fluently
N=1,633
The percentage total is more than 100% due to the mul ti-select option on the EESD Profile.
Over one-third of participants working in infrastructure organizations report speaking Spanish fluently compared to over one-half of direct service training participants.
2013-14 QI-PD Participation Report, March 2015 63
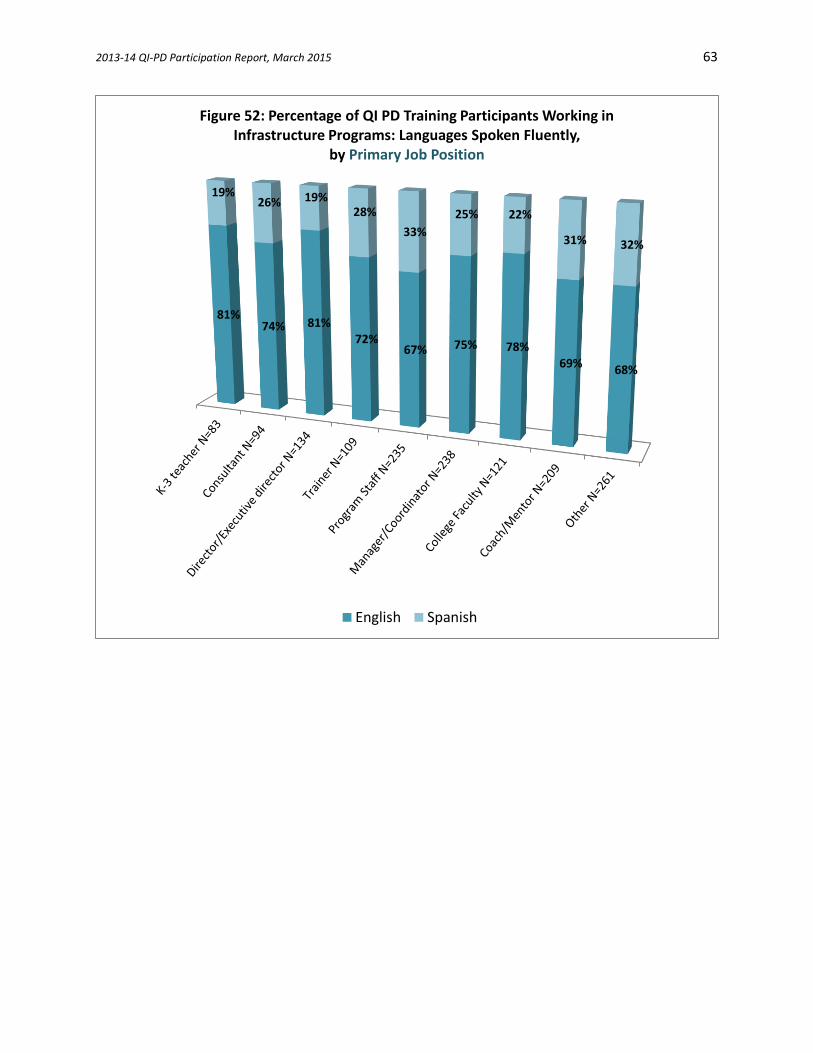
81%74% 81%
72%67% 75% 78%
69% 68%
19%26% 19%
28%
33%
25% 22%
31% 32%
Figure 52: Percentage of QI PD Training Participants Working in Infrastructure Programs: Languages Spoken Fluently,
by Primary Job Position
English Spanish

2013-14 QI-PD Participation Report, March 2015 64
Appendix-1 Glossary of Terms: Professional Development Delivery Types
Coaching is a relationship-based process led by an expert with specialized and adult learning knowledge and skills, who often serves in a different professional role than the recipient(s).* Coaching includes work done via telephone or e-mail. Fee-for-Service refers to training or services provided at cost that are above and beyond the level of service funded by CDE. This category is intended to capture data on unfunded need for California residents. Financial Support for training refers to the use of professional development financial support funding, such as AB212, that is used to sponsor a training, host a training, pay for substitutes, or similar support. Mentoring is a relationship-based process between colleagues in similar professional roles, with a more-experienced individual with adult learning knowledge and skills, the mentor, providing guidance and example to the less-experienced protégé or mentee.* Online Training is any learning experience provided through Webinar or coursework conducted through Web access. On-site Training/Technical Assistance (TA) is training or technical assistance provided in the program’s setting that impacts that site and site personnel for the benefit of that program. Technical Assistance is the provision of targeted and customized supports by a professional(s) with subject matter and adult learning knowledge and skills to develop or strengthen processes, knowledge application, or implementation of services by recipients.* Retention Activities refers to participant-specific career or professional development support, such as professional growth advising. Stipend is a payment, scholarship or grant to a student or eligible participant. Trainer of Trainers/Faculty refers to training provided to individuals who will in turn train others on the specific subject matter involved. Training is a learning experience, or series of experiences, specific to an area of inquiry and related set of skills or dispositions, delivered by a professional(s) with subject matter and adult learning knowledge and skills.* * Quoted from Early Childhood Education Professional Development: Training and Technical Assistance Glossary, a joint project of National Association for the Education of Young Children (NAEYC)and National Association of Child Care Resource & Referral Agencies (NACCRRA) 2011.
2013-14 QI-PD Participation Report, March 2015 65
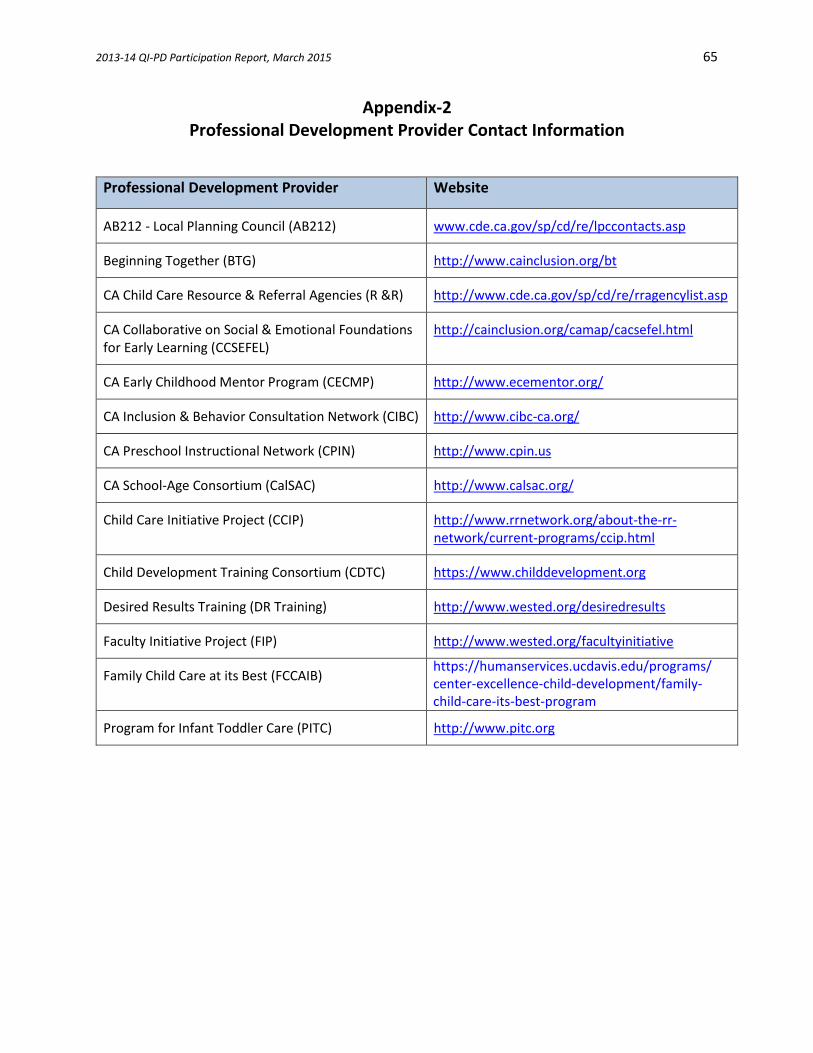
Appendix-2 Professional Development Provider Contact Information
Professional Development Provider Website
AB212 - Local Planning Council (AB212) www.cde.ca.gov/sp/cd/re/lpccontacts.asp
Beginning Together (BTG) http://www.cainclusion.org/bt
CA Child Care Resource & Referral Agencies (R &R) http://www.cde.ca.gov/sp/cd/re/rragencylist.asp
CA Collaborative on Social & Emotional Foundations for Early Learning (CCSEFEL)
http://cainclusion.org/camap/cacsefel.html
CA Early Childhood Mentor Program (CECMP) http://www.ecementor.org/
CA Inclusion & Behavior Consultation Network (CIBC) http://www.cibc-ca.org/
CA Preschool Instructional Network (CPIN) http://www.cpin.us
CA School-Age Consortium (CalSAC) http://www.calsac.org/
Child Care Initiative Project (CCIP) http://www.rrnetwork.org/about-the-rr-network/current-programs/ccip.html
Child Development Training Consortium (CDTC) https://www.childdevelopment.org
Desired Results Training (DR Training) http://www.wested.org/desiredresults
Faculty Initiative Project (FIP) http://www.wested.org/facultyinitiative
Family Child Care at its Best (FCCAIB)
Program for Infant Toddler Care (PITC) http://www.pitc.org
https://humanservices.ucdavis.edu/programs/center-excellence-child-development/family-child-care-its-best-program