quality in clinical trials: what really matters?
TRANSCRIPT

Quality in clinical trials:
what really matters?
Rory Collins
BHF Professor of Medicine & Epidemiology
Clinical Trial Service Unit
& Epidemiological Studies Unit
University of Oxford, UK

Put greater reliance on design strengths
inherent in randomized-controlled trials
• Randomization: unbiased comparison
of patient groups that differ randomly
• Control group: unbiased ascertainment
of outcomes in study treatment groups
Yields unbiased assessment of treatment
(which will only be reliable if large enough)

Proper randomized comparison
• No foreknowledge of likely
study treatment allocation
• Minimise post-randomization
withdrawals (i.e. intent-to-treat)
• Minimise losses to follow-up
(e.g. after primary event occurs
or study treatment stops)
Ensures patient groups differ only randomly:
allowing unbiased assessment of treatment

Sufficient numbers of relevant events
• Number of events, not patients, is chief
determinant of power (i.e. 1º prevention
trials are inefficient 2º prevention trials)
• Composite outcomes that combine events
which may involve different directions of
effect are less sensitive and generalizable
(e.g. total versus cause-specific mortality,
or total versus site-specific cancer)

EMEA: Guideline on the evaluation of medicinal
products for cardiovascular disease prevention
“Primary efficacy endpoints…..
All-cause mortality is preferred over cardiovascular
mortality…. Cardiovascular mortality, if objectively and conservatively defined, may also be acceptable..
...Composite outcomes may be appropriate in trials of
CV prevention when including hard clinical endpoints
(e.g. nonfatal myocardial infarction, stroke).”
This is irrespective of the likelihood of study
treatment affecting different causes of death,
or different types of vascular event, differently!

Different direction of effect on all-cause mortality
depending on split of vascular and non-vascular death
More vascular: More non-vascular:
0
20
40
60
80
100
120
Vasc Non-
vasc
All-
cause
Vasc Non-
vasc
All-
cause
Active
Placebo
Treatment GOOD Treatment BAD

Review underlying assumptions for
statistical power during the trial
• Assess overall rates of the main clinical
outcomes (blinded to allocated treatment)
• Assess impact of compliance to allocated
treatment on risk factor levels (for example
unblinded differences in lipids or BP)
• Modify study duration, number of events
and/or pre-specified outcomes (blinded to
effects of allocation on clinical outcomes)

Potential for false negative findings if power
assumptions are not assessed during trials
Treatment Anticipated Active Control Power at
effect on relative risk (n=4000) (n=4000) p=0.01
biomarker reduction
1.0 20% 480 600 91%
(12.0%) (15.0%)
0.7 14% 516 600 54%
(12.9%) (15.0%)
Not to check these assumptions may
have adverse public health implications

FDA draft guidance: Adaptive design clinical
trials for drugs and biologics
“Statistical bias can be introduced into adaptive
design studies that make modifications based on
interim analyses of a biomarker … even though the final study analysis uses a clinical efficacy
endpoint. This is because of the correlation
between the biomarker and final study endpoint.”
FALSE: Assessing the effect on a biomarker (such as blood pressure or cholesterol) does not introduce bias!

Fallacy in FDA draft guidance on unblinding
• Known that a treatment lowers risk factor levels
(such as blood pressure or cholesterol)
• Known that risk factors are correlated with risk
(such as blood pressure with stroke)
• But NOT known that changing risk factor levels
with the treatment is correlated with disease risk
(which is the hypothesis being tested in the trial)
• Unblinding the achieved change in the risk factor
level provides NO information about correlation
between this risk factor change and disease risk
• So, such unblinding does NOT cause any bias

Undue emphasis on data quality
Reliable RESULT ≠ High quality DATA
High quality DATA ≠ Reliable RESULT

Unbiased ascertainment of
major study outcomes
• Put greater reliance on comparison with
the randomly-allocated control group
• Missing data have little impact if this is
unbiased with respect to allocation
• Adjudication of study outcomes adds
substantial cost, but typically little gain

Simvastat in allocation Type of event Simvastat in Placebo
(n = 10269) (n= 10267)
Coranary events Non- fatal Ml 357 (3 .5%) 574 (5 .6%) Coronary deat h 587 (5.7%) 70 7 (6.9%)
Any coronary event 898 (8.7%) 1212 (11 .8%)
St1rokes Non- fatal :;.troke 366 (3 .6%) 499 (4 .9%) Fatall stroke 96 (0.9%) 119 (1.2%)
Any stroke, 4 44 (4.3%) 585 (5.7%)
R.evasculari satlons Coronary SB (5.0%) 725 (7. 1%) Non-coronary 45 0 (4.4%) 532 (5. 2%)
Any revascularisation 939 (9.1%) 1205 (11.7%)
ANY MAJOR VASCULAR. EVENT 2033 (19.8%) 2 585 (25.2%)
Risk ratio & 95% Cl Simvastat in bet.ter Plac.e.bo better
0.4 0 .6 0.8 !LO 1.2 l.4
0 .62 (0 .54- 0.70) 0 .82 (0.74- 0.92)
0 .73 (0.67-0.79)
0 . 72 (0 .6 3- 0 .83) 0 .80 (0.61-1.0 5)
0 .75 (0.66-0.85)
0 .70 (0.62 - 0.78) 0.84 (0.74- 0.95)
0.76 (0.70-0.83)
0 .76 (0.72 - 0.81)
HPS: Effects of simvastatin-allocation on
ADJUDICATED major vascular events
(Lancet 2002)

Simvastatin al llocation Type of event Sirnvastati n Placebo
(n = 10269) (n= 10267)
Coranary events Non-fatal Ml 492 (4.8%) 743 (7.2%) Coronary death 547 ( .3%) 687 (6.7%}
Any coronary event 988 (9.6%) 1350 (13.1%),
Strokes Non - fatal stroke 487 (4 .7%) 62.l (6 .0%} Fatal stroke 82 (0.8%) 105 (1.0%}
Any stroke 550 (5.4%) 700 (6.8%),
Revascu lari sations Coronary 487 (4.7%) 667 (6.5%)
on-coronary 492. (4.8%) 55 9 (5 .4%}
Any revasculari sation 943 (9.2%) 1166 (11.4%)
ANY MAJOR VASCULAR EVENT 2 187 (2 1.3%) 276S (26.9%)
Risk ratio & 95% Cl Simvastatin beuer Pllacebo better
0.4 0 .6 0.8 l.O 1.2 il..4
0 .. 65 (0.58- 0 .73) 0. 79 (0. 71- 0.88}
0 .7.2 (0.66-0.78)
0. 77 (0.69- 0.87) 0. 78 (0. 58- 1.03}
0.77 (0.69-0.8 7)
0 .. 72 (0.64- 0 .8 ) 0 .87 (0. 77- 0 .98}
0.79 (0. 73-0.86)
0.77 (0.72 - 0.81)
HPS: Effects of simvastatin-allocation on
UN-ADJUDICATED major vascular events

Minimal impact of adding false events
or of missing real events
Active Control OR (& 95%CI) Z score
(10,000) (10,000)
True events 800 1000 0.78 (0.71-0.86) 4.9
Extra false events (evenly distributed)
+ 10% 890 1090 0.80 (0.73-0.88) 4.7
+ 20% 980 1180 0.81 (0.74-0.89) 4.6
Missing real events (unevenly distributed)
- 10% 720 900 0.78 (0.71-0.87) 4.7
- 20% 640 800 0.79 (0.71-0.88) 4.4

Statistical monitoring of data
(rather than physical monitoring of sites)
• Standard checks of range, consistency and completeness of data
• Checks for unusual distribution of data within and between study sites (e.g. too little variance; lack of outliers; unlikely dates)
• Quality control assessments in random samples of investigators, patients and data items (supplemented by systematic checks of particular sites prompted by other analyses)

ESPS-2: Failure to detect fraud
during special audit site visit by
Good Clinical Research Practices Ltd
“The auditors were not able to
uncover major anomalies in the
data collected by this centre.”
ESPS-2 report,
June 1996

ESPS-2: Confirmation of problem
by central assay of blood samples
Both DIP & ASA were in all samples (rather than expected 25%)
DIP levels were either trace or very high (& different from other centres)
ASA levels were incompatible with low-dose aspirin regimen
Plasma protein polymorphism measurement showed each of 90 samples was from same mixture of plasma from several persons

Pharmacovigilance in randomized trials
• LARGE effects on RARE outcomes may be
detected by the reporting of Suspected
Unexpected Serious Adverse Reactions
(SUSARS) required in trials by regulations
– but this does not require randomization
• Reliable assessment of MODERATE effects on
COMMON outcomes does, however, need
LARGE-SCALE RANDOMIZED evidence
– and this is best monitored by a DSMB (rather
than by reporting masses of adverse events)
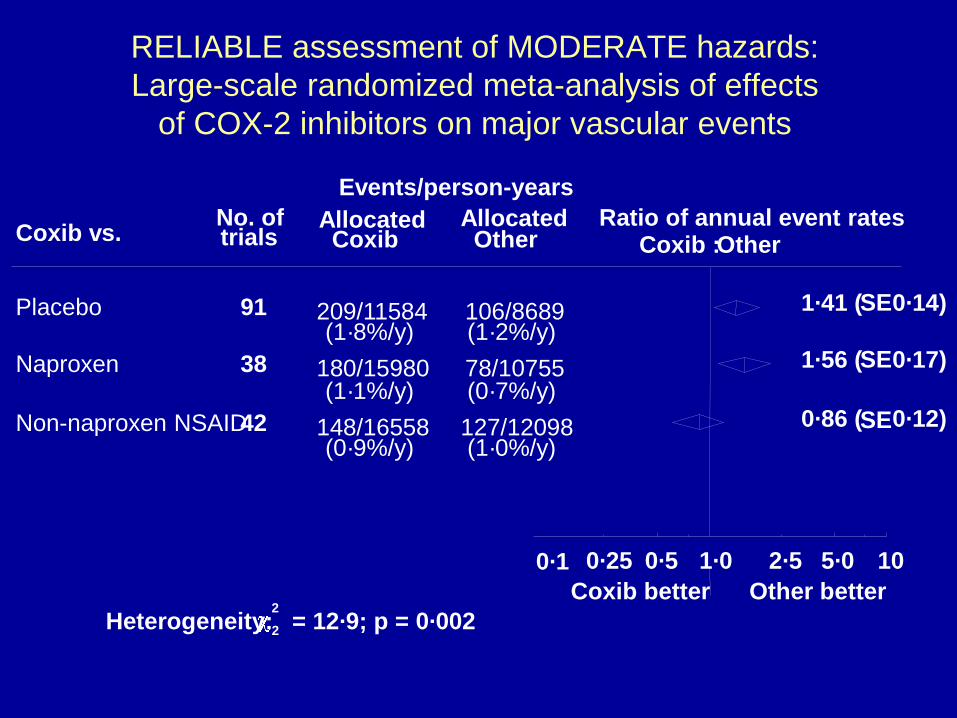
RELIABLE assessment of MODERATE hazards:
Large-scale randomized meta-analysis of effects
of COX-2 inhibitors on major vascular events
Coxib vs. No. of trials
Events/person-years
Allocated Coxib Other
Ratio of annual event rates Coxib :Other
Placebo 91 209/11584 106/8689 (1·8%/y) (1·2%/y)
1·41 (SE0·14)
Naproxen 38 180/15980 78/10755 (1·1%/y) (0·7%/y)
1·56 (SE0·17)
Non-naproxen NSAID42 148/16558 127/12098 (0·9%/y) (1·0%/y)
0·86 (SE0·12)
Allocated
2·5 5·0 10
Other better
0·25 0·5 1·0
Coxib better
0·1
Heterogeneity: 2
2 = 12·9; p = 0·002

Such moderate effects on common
outcomes cannot be reliably detected
by non-randomized pharmacovigilance
(as is sought by regulatory authorities)

Avoid subgroup and non-randomized
“on treatment” analyses
• Emphasis on findings in small subgroups (e.g. North American patients), even when a trial has compelling overall results, may well be seriously misleading
• “On treatment” comparisons of patients who get larger versus smaller response to treatment are non-randomized (and so not appropriate when randomization is needed to assess the overall effect reliably)

All
U8
MYltA. II
MYH.A. Ill
MYH.A. IV
EF:-:. C~ i;m12r1 ~
~r : Cl~l;l'l'1~1rl Cl~
II: .:hi ml ,:: I .:.lag !.'
M -:of s d'mi le f Id ,:g y
~~;,:~:,:
F~m~~ SE
(:~~
III CP±,
P~l.,OCIIJ5 m Mo ~IJ~ U
[llal:e ll!s ~llu:
Mo llztl~ ~smell u I"~ llOI.JS !'Ml~·~~ IOl"'I
N,:, pi'll~-:-IJ;;I t-,sp11rr.:,l,:,r,
H II.: ~ i'6 ti'i ~2!"1 i'2bpm )
H II.:~ i'6 tri ~2!"1 S::bpm )
a
-----------
I
■
---------
------I
■
■
------C.5 1S
MERIT-HF: Effects on total mortality of beta-
blocker in heart failure in various subgroups
US patient
subgroup
FDA datasheet: “..mortality plus
heart failure hospitalization
showed consistent effects in the
overall study population and
subgroups, including women and
the US population. However, in
the US subgroup (n=1071) and
women (n=898), overall mortality
and cardiovascular mortality
appeared less affected.”

All
U8
MYltA. II
MYH.A. Ill
MYH.A. IV
EF:-:. C~ i;m12r1 ~
~r : Cl~l;l'l'1~1rl Cl~
II: .:hi ml ,:: I .:.lag !.'
M -:of s d'mi le f Id ,:g y
~~;,:~:,:
F~m~~ SE
(:~~
III CP±,
P~l.,OCIIJ5 m Mo ~IJ~ U
[llal:e ll!s ~llu:
Mo llztl~ ~smell u I"~ llOI.JS !'Ml~·~~ IOl"'I
N,:, pi'll~-:-IJ;;I t-,sp11rr.:,l,:,r,
H II.: ~ i'6 ti'i ~2!"1 i'2bpm )
H II.:~ i'6 tri ~2!"1 S::bpm )
a
-----------
I
■
---------
------I
■
■
------C.5 1S
MERIT-HF: Effects on total mortality of beta-
blocker in heart failure in various subgroups
US patient
subgroup
“Analyses of US patients were carried out because
they represented about 25%
of the overall population.”
Why is that justification for
post hoc data-dependent
emphasis on a subgroup?

JUPITER: Non-randomized comparison of
effects of different apparent response
(Lancet 2009)
• “Compared with placebo, participants allocated to rosuvastatin who did not achieve LDL cholesterol
less than 1.8 mmol/L had no significant reduction
in vascular events …whereas we recorded a 55%
reduction in those who did achieve this target”
• But, patients defined by the difference in post-
randomization cholesterol-lowering response to
treatment may well not differ only randomly from
each other (e.g. factors related to lipid-response
might also be related to clinical outcome).

JUPITER: Non-randomized comparison of
effects of different apparent response
(Lancet 2009)
If pre-specified randomized comparisons
are required to detect the overall effects on
outcome, then why would analyses based
on non-randomized subgroup comparisons
be considered appropriate (and, indeed,
often required by regulatory authorities)?

PLATO trial: Effect on primary outcome of
vascular mortality, MI or stroke in ACS
Region Patients Ticr Clop HR (95%CI)
(%) (%)
Asia/Australia 1714 11.4 14.8 0.80 (0.61-1.04)
Central/South 1237 15.2 17.9 0.86 (0.65-1.13)
America
Europe/Middle 13859 8.8 11.0 0.80 (0.72-0.90)
East/Africa
North America 1814 11.9 9.6 1.25 (0.93-1.67)
ALL REGIONS 18624 9.8 11.7 0.84 (0.77-0.92)
P-value for interaction = 0.05 (before any adjustment
for this being 1 of 33 pre-specified subgroup analyses)

PLATO trial: Effect on primary outcome of
vascular mortality, MI or stroke in ACS
Post hoc subgroup analysis based on
post-randomisation defined subgroup
FDA ruling: “Aspirin doses above 100
milligrams daily decrease the effectiveness
of the medication.” July 2011
Study team: “The regional interaction could
arise from chance alone.” Circulation 2011
P-value for interaction = 0.05 (before any adjustment
for this being 1 of 33 pre-specified subgroup analyses)

Need emphasis to be on the key features
for getting reliable results from trials
• Proper randomization (and intent-to-treat analysis)
• Sufficient numbers of relevant clinical outcomes
(with efficacy and safety considered separately)
• Unbiased ascertainment of key study outcomes
(without excessive checking and adjudication)
• Comparisons with the randomized control group
(except for assessing big effects on rare events)
• Avoiding undue emphasis on subgroup findings
and on non-randomized “on treatment” analyses

Need emphasis to be on the key features
for getting reliable results from trials
And avoid distracting investigators with
undue focus on processes (e.g. site
monitoring; SUSAR reporting; source
data verification) of unproven value

a"a} s,1 ~t'..c( \01\.