quality inclusion: what does it look like and how can we...
TRANSCRIPT

+
2013 National Early Childhood Inclusion InstitutePam Winton & Tracey West
FPG Child Development Institute, UNCMay, 15 2013
Quality Inclusion: What does it look like and
how can we measure it?
National Professional Development Center on Inclusion (NPDCI)

+WelcomeWho’s in the Room?
Cen
ter
Dir
ecto
rs Advocates
Early
Ch
ildh
oo
d
Teach
ers
Policy Makers
Researchers

+Objectives
Provide context & need for ICP
Describe findings from the first US demonstration study
Describe training materials for users
Consider possible uses of ICP in your community
National Professional Development Center on Inclusion

+Why is it Important to Assess the Quality of Inclusion?
National Professional Development Center on Inclusion
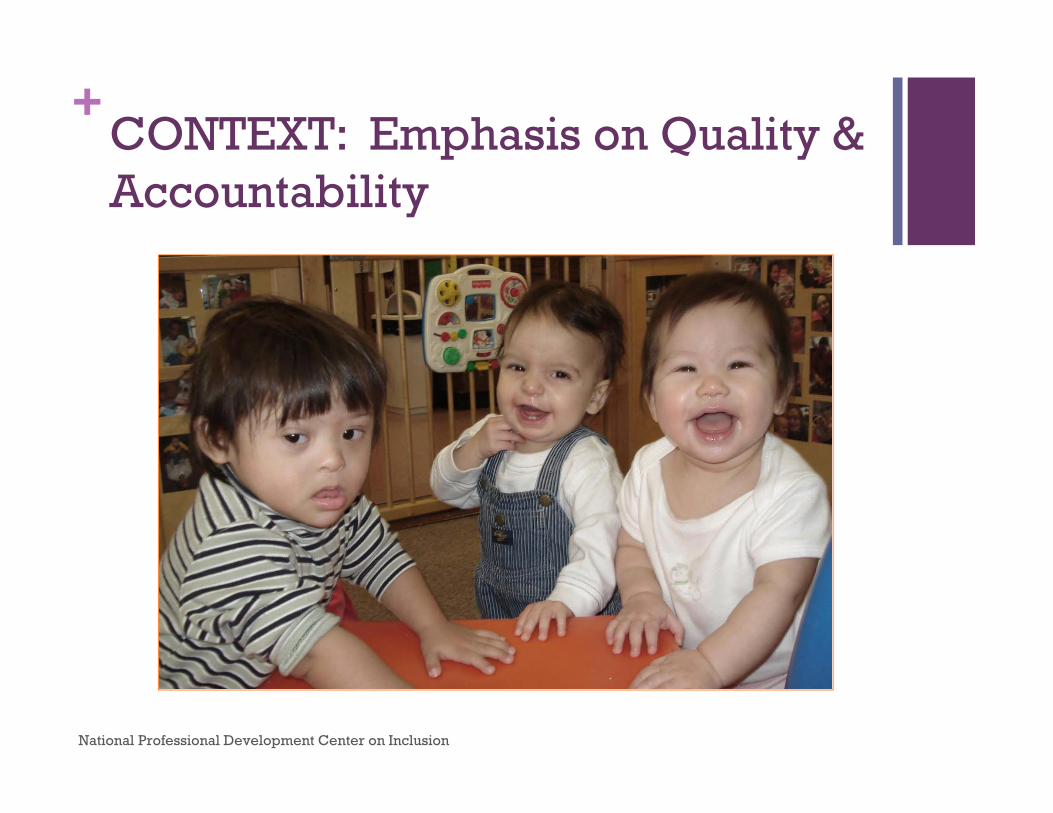
+CONTEXT: Emphasis on Quality & Accountability
National Professional Development Center on Inclusion

+ Quality Movement = Multiple Quality Initiatives
OSEP Monitoring andAccountability
Head Start PerformanceFramework
personnel standards

+ How Do States Address Inclusion within QRIS?
Several states with statewide QRIS have included standards for the care of children with special needs but there is no guidance nor standard approach (NPDCI, 2008; NCCIC, 2010)
QRIS standards related to inclusion vary across states by category, QRIS level, type of program, and documentation and monitoring
A report on how the 35 state applications for RTT-ELC addressed QRIS indicated that children with special needs were overlooked (Stoney, L., 2012)
7

+Grassroots Perspectives on QRIS & Inclusion
Survey of child care directors (n=48) in 8 states about benefits and challenges of participating in QRIS indicated concern about this issue
(Schulman, Matthews, Blank, & Ewen, 2012)
+Grassroots Perspectives: Findings from Survey (continued)
Childcare directors discussed “the importance not only of standards appropriate for children with special needs, but also of assessors with knowledge in special education who could recognize appropriate practices for children with special needs”
Example: for children with autism, room set-up to reduce distractions is not in accordance with requirements for specific number of materials of certain types in the classroom
(Schulman, Matthews, Blank, & Ewen, 2012, p.27)

+
Young children with disabilities can experience low quality in classes that are otherwise rated as being of high qualityWolery, et al., 2000
National Professional Development Center on Inclusion

+What are Research-Based Inclusion Practices?
National Professional Development Center on Inclusion

Research Synthesis Points on Quality Inclusive Practices
NPDCI

+How Do We know If We Are Practicing High Quality Inclusion?
National Professional Development Center on Inclusion

+Moving Beyond Global Quality: The Inclusive Classroom Profile (ICP)
Designed to complement existing classroom quality measures & standards
Focus on classroom-level, evidence-based inclusive practices that support the individual needs of children with disabilities
National Professional Development Center on Inclusion

+The Inclusive Classroom
Profile* (ICP)
Structured Observation
For use in preschool classes (3 – 5
years old)
1-7 point Rating Scale
12 Inclusive Practices *Soukakou, 2012
National Professional Development Center on Inclusion

+ ICP Items1. Adaptation of space and materials2. Adult involvement in peer interactions3. Adult guidance of children’s play4. Conflict resolution5. Membership6. Relationships between adults and children7. Support for social communication8. Adaptation of group activities9. Transitions between activities10. Feedback11. Family-professional partnerships12. Monitoring children’s learning
National Professional Development Center on Inclusion

+Rating Scale
National Professional Development Center on Inclusion

+Who Is Being Observed?
Children with identified disabilities
in the context of classroom activities
and social interactions with adults
and peers
Teachers, teacher assistants,
specialists
National Professional Development Center on Inclusion

+Administration
Observation
Teacher interview
Document review
National Professional Development Center on Inclusion

+How Can the ICP Be Used?
As a research tool.
As a program evaluation tool.
As a self-assessment tool.
As a professional development tool.
National Professional Development Center on Inclusion

+Locate Information About the ICP:
Link to Online Overview Modules
Demonstration Study Report
Handout
Presentations
http://npdci.fpg.unc.edu/measuring-quality-inclusion-inclusive-classroom-
profile
National Professional Development Center on Inclusion

+Pilot Studies on the ICP
1st pilot study in the UK showed promising results on reliability & validity (Soukakou, 2012)
2nd pilot study in the US in collaboration with:
NC Department of Instruction,Exceptional Children
National Professional Development Center on Inclusion

+ICP Pilot Study (US): Research Questions Did assessors learn to use the ICP
with accuracy?
What is the evidence for reliability and validity?
Did assessors find the ICP useful and acceptable for program evaluation?
National Professional Development Center on Inclusion

+Sample: Classrooms
51 inclusive classrooms in one state
Public Pre-K (5), Head Start (13), Developmental Day programs (13), Other child care centers (20)
150 children with disabilities
Mean age of children= 4.43 years
National Professional Development Center on Inclusion

+Sample: Lead Teacher Characteristics*
National Professional Development Center on Inclusion
Head Start
Child Care
Public Pre-K
Dev Day Total
Mean Mean Mean Mean Mean
Course hours in special education 9.25 1.18 1.50 16.08 7.52
Number of years of teaching child(ren) with a disability
10.77 5.95 4.40 5.48 6.91
Number of years of teaching in EC 13.62 12.85 5.60 8.10 11.12
* Based on teacher report

+Sample: Classroom and Child Characteristics
National Professional Development Center on Inclusion
Head Start
Child Care
PublicPre‐K
Dev. Day Total
Mean Mean Mean Mean Mean
Number of children in classroom 17.15 16.55 15.00 16.38 16.51
Number of children with IEP in classroom
2.62 2.15 2.40 4.69 2.94
Age of youngest child (Yrs) 3.54 3.20 4.00 3.69 3.49
Age of oldest child (Yrs) 4.54 4.30 4.60 4.62 4.47
Number of adults in classroom 2.38 1.70 2.20 3.46 2.37
Children with IEP/adults ratio 1.13 1.22 1.07 1.43 1.23
All children/adults ratio 7.66 10.91 7.10 5.02 8.21ECERS‐R score 4.95 4.58 5.14 5.31 4.92ICP score 4.64 3.67 4.76 5.12 4.39

+Sample: Children’s Primary Diagnoses*
Speech and language (38%)
Developmental delay (37%)
Autism (12%)
Other health impairment (5%)
Sensory impairment (4%)
Multiple disabilities (1%)
Orthopedic impairment (1%)
Don’t know (2%) * Based on teacher report

+Sample: Children with Disabilities
88% of classrooms had at least one child with a moderate or severe level of disability in at least one area. *
* Based on teacher responses using an adaptation of the ABILITIES Index (Simeonsson & Bailey, 1991).
National Professional Development Center on Inclusion

+ Sample: Percent of Children Receiving the Majority of Specialized Services in the Classroom
National Professional Development Center on Inclusion
Head Start
Child Care
Public
Pre‐K Dev. Day TotalChildren receiving majority of services in classroom
17.65% 37.21% 8.33% 67.21% 57%
• In North Carolina, the percentage of children receiving the majority of specialized services in the classroom is 50.97%*
• Nationally, the percentage of children receiving the majority of specialized services in the classroom is 41.67%*
*OSEP Report to Congress, 2011
+Procedures
51 ICP assessments
50 ECERS-R assessments
Assessor survey for gathering data on ICP acceptability
National Professional Development Center on Inclusion
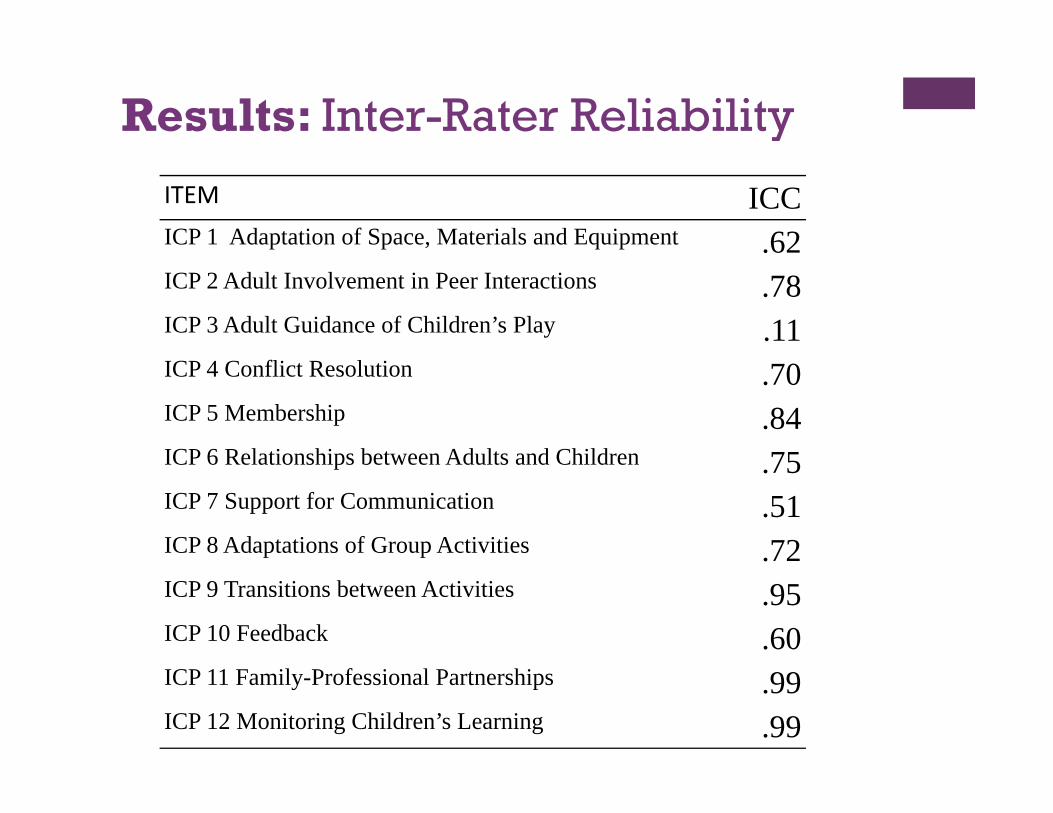
ITEM ICCICP 1 Adaptation of Space, Materials and Equipment .62ICP 2 Adult Involvement in Peer Interactions .78ICP 3 Adult Guidance of Children’s Play .11ICP 4 Conflict Resolution .70ICP 5 Membership .84ICP 6 Relationships between Adults and Children .75ICP 7 Support for Communication .51ICP 8 Adaptations of Group Activities .72ICP 9 Transitions between Activities .95ICP 10 Feedback .60ICP 11 Family-Professional Partnerships .99ICP 12 Monitoring Children’s Learning .99
Results: Inter-Rater Reliability

ECERS-R Scale
ICP Total Score
Space and Furnishings 0.48***Personal Care 0.21**Language and Reasoning 0.47***Program Structure 0.29*
Activities 0.30*Interactions 0.38**Parent and Staff 0.38**
ECERS Total Score 0.48***
Results: Rank-Order Correlations Between ICP and ECERS
Note: *p<.05, **p<.01, ***p<.001

+Results: Discriminant Validity
Mean(SE)/B(SE)
Child Care 3.67 (0.15)a
Developmental Day 5.12 (0.19)b
Head Start 4.64 (0.19) b
Public Pre-K 4.76 (0.30) b
Note: Means not sharing superscripts are significantly different.

+Results: Social Validity
On a 1-5 point scale, assessors:
Rated the importance of the ICP constructs measured very highly (m= 5)
Would highly recommend the ICP measure to others (m=5)
Found the measure easy to administer (m= 4)
Felt well prepared after the reliability training observations (m=4)
National Professional Development Center on Inclusion

+Summary of Findings
Assessors established adequate administration and reliability proficiency upon training.
Evidence for construct validity.
Differences in quality across types of programs
Assessors found the ICP easy to use and useful for program evaluation
National Professional Development Center on Inclusion

+Implications
ICP possibilities: research, program evaluation, and professional development.
Some next steps related to emerging interestsTraining program for users. Online overview
materials at http://npdci.fpg.unc.edu/measuring-quality-inclusion-inclusive-classroom-profile
Professional development curriculum for PD providers/consultants
National Professional Development Center on Inclusion

CONNECT Modules
Evidence‐Based
Inclusion Practices
Professional Development focused on Inclusion Practices

+See for Yourself / Find it Online
Module 2: TransitionModule 1: Embedded Interventions
Module 3: Communication for Collaboration
Module 4: Family‐Professional Partnerships
Module 5: Assistive Technology Interventions
Module 6: Dialogic ReadingModule 7: Tiered Instruction
(Social emotional development & Academic learning)

+
Online Overview Training Modules
National Professional Development Center on Inclusion
http://npdci.fpg.unc.edu/measuring-quality-inclusion-inclusive-classroom-profile

+
Module 1:
The purpose of the ICP
Structure
Administration
12 practices that are assessed by the ICP
Introduction to the ICP
National Professional Development Center on Inclusion

+
Module 2:
How to prepare for the visit
How to conduct the observation, interview, and document review
How to conclude the visit
Administration
National Professional Development Center on Inclusion

+Under Construction…
Inclusive Classroom Profile
Reliability Training Options:Face-to-Face Overview Webinar OverviewGuided Observations and
Debriefings
National Professional Development Center on Inclusion

+To find the resources talked about today go to:
http://npdci.fpg.unc.edu/
National Professional Development Center on Inclusion

How might the ICP be used in your community?
National Professional Development Center on Inclusion

+Small Group Discussion
Introductions
Appoint a facilitator and recorder
Discuss: How might you use the ICP in your work? Your community?
Who would you share information about the ICP with in your community?
Share- back one key point with the whole group
National Professional Development Center on Inclusion

+Resources and References
CONNECT Modules: http://community.fpg.unc.edu/
DEC/NAEYC. (2009). Definition of Inclusion. http://npdci.fpg.unc.edu/sites/npdci.fpg.unc.edu/files/resources/Inclusion-Position-Statement-Summary-4-2009.pdf
NPDCI. (2011). Research synthesis points on quality inclusive practiceshttp://npdci.fpg.unc.edu/sites/npdci.fpg.unc.edu/files/resources/NPDCI-ResearchSynthesisPointsInclusivePractices-2011_0.pdf
Soukakou E. P. (2012). Measuring quality in inclusive preschool classrooms: Development and validation of the Inclusive Classroom Profile (ICP). Early Childhood Research Quarterly, 27(3), 478-488.
National Professional Development Center on Inclusion

+Sample: children
Mean number of children with a disability per class = 2.94 (range =1-8).
Children had special needs in the following areas: intentional communication (90%); behavior/social (67%); fine motor coordination (45%); gross motor (27%); and sensory integration (27%).
59% of the classrooms had a least one child with a disability at the “severe” level (4 on a scale of 1 -4), while 88% of classrooms had at least one child with a moderate or severe level of disability in at least one area.