quality management practices, knowledge management and key...
TRANSCRIPT

Calvo-Mora et al. QM, KM, Results, multi-group analysis
2nd International Symposium on Partial Least Squares Path Modeling, Seville (Spain), 2015 1
Quality management practices, knowledge management and key business results in SMEs and large organizations: a multi-group analysis
Completed Research Paper
Arturo Calvo-Mora University of Seville
Antonio Navarro-García University of Seville
[email protected] Manuel Rey-Moreno University of Seville
Rafael Periáñez-Cristóbal University of Seville
[email protected] Abstract Following the Total Quality Management philosophy and the knowledge management (KM) approach, this contribution aims to study the influence of process management methodology (PMM) and partner management (PM) on KM, and the relationships between this variable and key business results. The conceptual model is tested on a sample of 225 Spanish companies. PLS-SEM approach was used to test the research model. In order to assess the moderating effects of organisational size, a multi-group approach was adopted using two subsamples with large companies and small and medium-sized enterprises (SMEs). The findings indicate that the use of PMM and partner involvement are key factors for KM to have a significant impact on the key business results (KBR). Moreover, the organisational size is determinant when analysing the effect of PMM and PM on KM. Keywords: Knowledge management, EFQM Model, Moderating effects, Organisational size. 1. Introduction
The literature contributes evidence of relationships and synergies between total quality management (TQM) practices and knowledge management (KM). In this sense, the more studied topics refer to how quality management favours knowledge creation (Linderman et al., 2004), knowledge transfer and the complete process of creation, sharing and application of knowledge (Molina et al., 2007). Various studies (Bou-Llusar et al., 2009; Kim et al., 2010) show how excellence models offer a suitable reference framework for the implementation of TQM. Benavides and Quintana (2003) maintain that similarities exist between KM activities and the evaluation criteria of the EFQM Model.
However, there is a lack of research that empirically analyses the suitability of the EFQM Model as a reference framework for a KM implementation and how it can positively influence the key results of the organisation. Neither are there research studies which use a horizontal reading of the EFQM Model to analyse questions related to TQM and KM. The horizontal reading of the EFQM Model through the transverse axes is a powerful tool for analysing important concepts of the organisation, although it is not as obvious as the traditional reading through criteria and sub-criteria. In this study, the transversal analysis of the EFQM Model allows KM to be analysed in organisations which have been subjected to the evaluation process, taking into account that KM is not contemplated in any specify criterion of the

Calvo-Mora et al. QM, KM, Results, multi-group analysis
2nd International Symposium on Partial Least Squares Path Modeling, Seville (Spain), 2015 2
model. More specifically, it will be attempted to analyse two important aspects for the effectiveness of KM: PMM (Asif et al., 2013) and the management of external alliances (Daud et al., 2011), because, knowledge management must begin with the knowledge that the organisation obtains from its internal processes, as well from its main partners and external collaborators. In addition, the effectiveness of KM will be analysed through the impact on the key business results (KBR).
Finally, the previous practices and the results can be seen to be conditioned by the size of the organisation. Thus the organisational characteristics of SMEs, such as informality at the process level, person-to-person contact, limited human resources, limited financial assets, limited access to technology or shortage of time, could encourage the management of their knowledge (Durst and Edvardsson, 2012; McAdam and Reid, 2001). For that reason, the present study attempts to reach the following objectives: (1) Confirm the reliability and validity of the horizontal reading of the EFQM Model for studying key aspects of KM, (2) Analyse the relationships between three transverse axes of the EFQM Model (PMM, PM and KM) and KBR, (3) Study the moderating effect that organisational size can have on the relationships between the previous variables. 2. Integrating TQM, EFQM Model and KM
TQM is a comprehensive management philosophy oriented towards achieving excellent results in relation to stakeholders (Prajogo and McDermott, 2005). In order to attain these results, it is crucial to be able to count on the commitment and involvement of all the people in the organisation, as well as the use of certain management tools, techniques and practices. The principles and practices for TQM to produce the desired effects on an organisation’s performance are called critical factors (e.g., leadership, strategic planning). Kim et al., (2010) show how excellence models offer a suitable reference framework that facilitates the implementation and improvement of TQM. In Europe, the EFQM Model is the best-known and most widespread reference when introducing and improving a TQM system. Bou-Llusar et al., (2009) point out how the use of the EFQM Model guarantees that the management practices employed form a coherent system.
Knowledge is a flow that combines values, experiences, abilities and attitudes that facilitate a framework of analysis for the assessment and new incorporation of experience and information (Davenport and Prusak, 1998). For Ju et al., (2006), TQM and KM have points in common: orientation towards results; the search for stakeholder satisfaction or a people focused management approach. Thus, certain critical factors of TQM such as top management commitment, PMM, employee training and empowerment or PM, have a positive effect on the KM process. Linderman et al., (2004) go further, by considering that TQM and KM seek the same objective: to create and use tacit and explicit knowledge more efficiently, at individual and collective level, to continuously improve and to obtain better results. Molina et al., (2004) confirm that companies which follow principles and practices of quality, strengthen the transfer and transferability of knowledge. Molina et al., (2007) emphasise the importance of technical and social aspects of quality and KM so that the knowledge transfer process is efficient. Daud et al., (2011) examine the influence of social and hard factors of TQM in the acquisition, generation and application of knowledge. The results indicate that behavioural or social aspects of management favour KM processes to a greater extent in comparison with TQM technical factors. Specifically, human capital is the main factor that influences KM processes. In short, KM processes do not make sense if they are not developed systematically. To be competitive, organisations need to continuously generate and assimilate knowledge and new capabilities. Therefore, TQM as a management philosophy based on

Calvo-Mora et al. QM, KM, Results, multi-group analysis
2nd International Symposium on Partial Least Squares Path Modeling, Seville (Spain), 2015 3
continuous improvement, innovation and learning can serve as a context and support for the start-up and later development of KM.
Benavides and Quintana (2003) maintain that the EFQM Model constitutes an element of stimulus and fundamental support to KM, and that there are important relationships between the critical activities of KM and the fundamental concepts of excellence and criteria of the EFQM Model.
The aim of the EFQM Model is to support organisations to achieve business excellence through continuous improvement, learning and innovation. The model presents a non-prescriptive working framework which analyses the relationships between what an organisation does and the results that it is able to attain. The EFQM Model includes eight fundamental concepts of excellence and nine criteria. The fundamental concepts outline the foundation for achieving sustainable excellence in any organisation. They can be used as the basis to describe the attributes of an excellent organisational culture. The criteria that the model proposes represent the indicative elements of the degree of progression which a certain organisation follows to achieve excellence. These criteria, or dimensions, are specified in five agents (leadership, policy and strategy, partnerships and resources, people and process), and four results (customers, employees, society and key results). Moreover, the EFQM Model has a dynamic nature. It indicates that activities such as innovation, learning or creativity, boost and empower the impact that the model's agents have on the results (EFQM, 2003).
However, the EFQM Model is not a set of unconnected criteria. On the contrary, it presents a series of related practices which offer high levels of continuity and coherency. The interpretation of the relationships between the criteria are shaped by the so-called transverse axes. The existence of these axes implies that, by adopting a systemic management approach, when starting up improvement projects in any one of the processes or practices of the organisation, effects will be obtained in more than one criterion. This means global improvements in the organisation cannot be achieved if the different aspects of the criteria of the model are not simultaneously approached as interdependent elements.
3. Research model and hypotheses The research model is based on the extent to which the organisation can improve its key
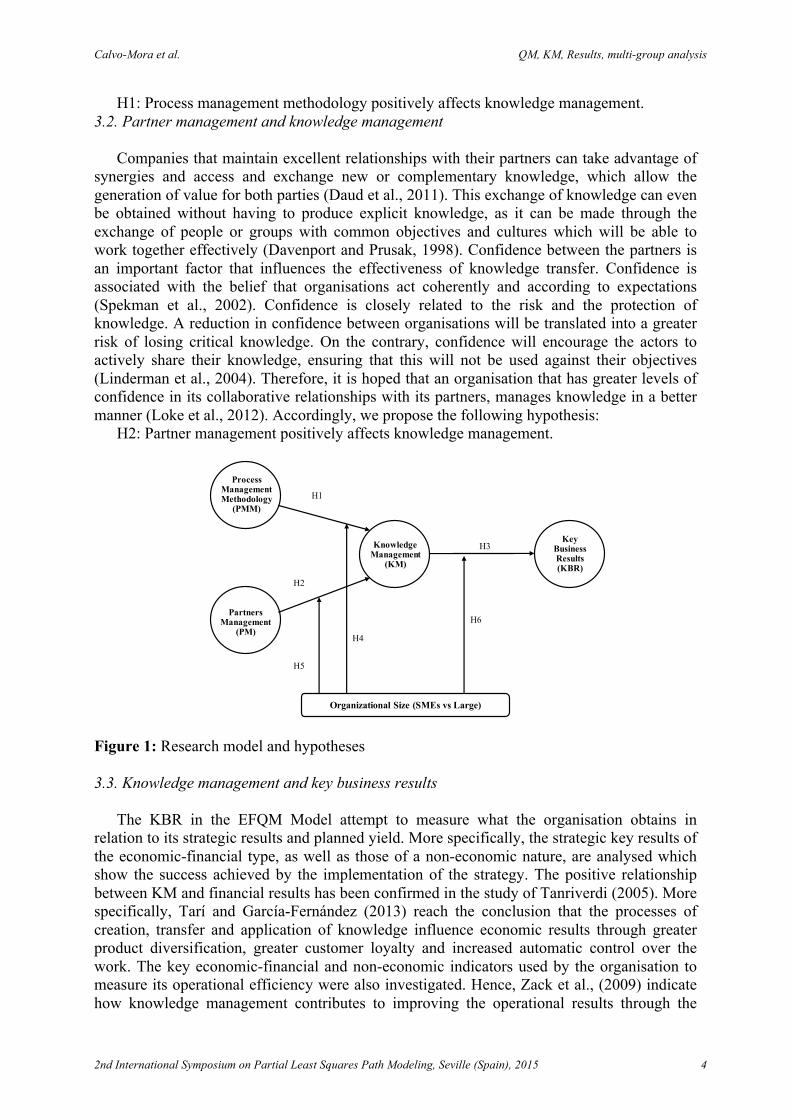
results through KM, for which it will have to apply PMM, as well as having the participation and involvement of its strategic partners in the process. Moreover, the relationship between these variables may be affected by organisational size (Figure 1). 3.1. Process management methodology and knowledge management
PMM includes the following activities: assignment of proprietors or those responsible for
the processes; implementation of standardised systems for its management; establishment of objectives and monitoring and measurement systems; and systems of analysis and improvement of these processes. These activities need to document the processes, in order to describe what the organisation does and, consequently, to make its knowledge and capacities explicit (Tang and Tong, 2007). Therefore, PMM facilitates the creation of knowledge (Asif et al., 2013), as the processes include concepts, methods and techniques to support the design, implementation and analysis of the activities that generate value. Accordingly, the information derived from the activities that form the processes are transformed into knowledge. PMM also favours the storage and the transfer of knowledge (Molina et al., 2007) when cooperating to transform it from tacit to explicit. Therefore, we propose the following hypothesis:
Calvo-Mora et al. QM, KM, Results, multi-group analysis
2nd International Symposium on Partial Least Squares Path Modeling, Seville (Spain), 2015 4
H1: Process management methodology positively affects knowledge management. 3.2. Partner management and knowledge management
Companies that maintain excellent relationships with their partners can take advantage of synergies and access and exchange new or complementary knowledge, which allow the generation of value for both parties (Daud et al., 2011). This exchange of knowledge can even be obtained without having to produce explicit knowledge, as it can be made through the exchange of people or groups with common objectives and cultures which will be able to work together effectively (Davenport and Prusak, 1998). Confidence between the partners is an important factor that influences the effectiveness of knowledge transfer. Confidence is associated with the belief that organisations act coherently and according to expectations (Spekman et al., 2002). Confidence is closely related to the risk and the protection of knowledge. A reduction in confidence between organisations will be translated into a greater risk of losing critical knowledge. On the contrary, confidence will encourage the actors to actively share their knowledge, ensuring that this will not be used against their objectives (Linderman et al., 2004). Therefore, it is hoped that an organisation that has greater levels of confidence in its collaborative relationships with its partners, manages knowledge in a better manner (Loke et al., 2012). Accordingly, we propose the following hypothesis:
H2: Partner management positively affects knowledge management.
Figure 1: Research model and hypotheses 3.3. Knowledge management and key business results
The KBR in the EFQM Model attempt to measure what the organisation obtains in
relation to its strategic results and planned yield. More specifically, the strategic key results of the economic-financial type, as well as those of a non-economic nature, are analysed which show the success achieved by the implementation of the strategy. The positive relationship between KM and financial results has been confirmed in the study of Tanriverdi (2005). More specifically, Tarí and García-Fernández (2013) reach the conclusion that the processes of creation, transfer and application of knowledge influence economic results through greater product diversification, greater customer loyalty and increased automatic control over the work. The key economic-financial and non-economic indicators used by the organisation to measure its operational efficiency were also investigated. Hence, Zack et al., (2009) indicate how knowledge management contributes to improving the operational results through the
ProcessManagementMethodology
(PMM)
Partners Management
(PM)
Knowledge Management
(KM)
Key Business Results(KBR)
H4
H3
Organizational Size (SMEs vs Large)
H5
H6
H1
H2

Calvo-Mora et al. QM, KM, Results, multi-group analysis
2nd International Symposium on Partial Least Squares Path Modeling, Seville (Spain), 2015 5
development of a global vision of the company, empowerment, improvement in decision making, reduction of errors, teamwork or the training and qualification of the workers. Therefore, the following hypothesis is proposed:
H3: Knowledge management positively affects key business results.
3.4. The moderating role of organisational size
The management of SMEs must be based on a philosophy and a perspective different from those of larger sized organisational units. Gray and Mabey (2005) indicate that size influences the decision making processes and strategic choices of companies. In small businesses, the important decisions are taken day to day, with the short term view predominating and planning is not given its due importance. Also, the simpler organisational structure in SMEs entails greater centralisation in decision making.
Another important factor that limits the competitiveness of SMEs is their difficulty in accessing resources, especially those of a financial and intangible nature. It is difficult for SMEs to access capital markets which is why it is more complicated for them to take advantage of cutting-edge technological knowhow or to contract highly qualified employees. Innovation in SMEs tends to be more informal and ad hoc, which may lead to a short-term viewpoint. Furthermore, innovation in SMEs is usually linked with development orientation, through the continuous improvement of PMM, whereas that of large companies is usually linked with research (Laforet, 2013).
The smaller size and the lesser specialisation of the workforce lead to a greater probability of collaboration and cooperation between the employees, which largely favours the processes of creation, transfer and application of knowledge. Along this line, Durst and Edvardsson (2012) indicate that size must be considered an important factor when attempting to understand how knowledge is managed, although empirical studies are contradictory in many cases. In this sense, for McAdam and Reid (2001), SMEs are less advanced, having a mechanistic approach to knowledge (based on repetitive procedures and practices) and a lack of investment in KM approaches and systems. Finally, there is another factor which limits the competitive position of the SMEs, and that is their lesser negotiating power with customers, suppliers, distributors and other partners.
Regarding results, McAdam and Reid (2001) concluded that SMEs and large organisations have much to gain by developing effective KM systems. These benefits are related to cost reduction and an improvement in quality and efficiency. The SMEs reflect a greater emphasis on the commercial benefits of KM, whereas large organisations see greater benefits for the business through more efficient planning. Accordingly, the following hypotheses are proposed:
H4: Organisational size moderates the relationships between process management methodology and knowledge management.
H5: Organisational size moderates the relationships between partner management and knowledge management.
H6: Organisational size moderates the relationships between knowledge management and key business results.
4. Method: sample, measurements and data analysis
The sample consisted of 225 Spanish companies that had been subjected to self, and external assessment on the basis of the EFQM Excellence Model. Considering Size as a categorical variable, the sample was split into two groups (SMEs =146; Large companies =

Calvo-Mora et al. QM, KM, Results, multi-group analysis
2nd International Symposium on Partial Least Squares Path Modeling, Seville (Spain), 2015 6
79). To this end, the Recommendation of the European Commission 96/280/EC was followed. In this sense, SMEs will be considered to be those companies which employ less than 250 people, whose annual business volume does not exceed 50 million euros or whose annual general balance sheet figures do not exceed 43 million euros.
The variables and their respective measurement indicators were obtained from the transverse axes of the EFQM Model (EFQM, 2003). In this work, and according to the objectives considered, three transverse axes were selected (KM, PMM and PM), as well as the KBR (see Table 1). The data were collected from the assessment processes according to the RADAR (Results-Approach-Deployment-Assessment and Review) logic which the EFQM Model uses to score the level of excellence of organisations. The RADAR logic is a dynamic assessment framework and a powerful management tool that provides a structured approach to questioning the performance of an organisation.
Two stages were developed in the data analysis using a variance-based, structural equation modelling (partial least squares -PLS-; SmartPLS 3.1.9. software was used -Ringle and Wende, 2014-). (1) For the whole sample, the research models depicted in Figure 1 were tested allowing the assessment of the measurement model and the testing of the linkages proposed between constructs (Roldán and Sánchez-Franco, 2012). (2) The moderating effects of Size were analysed through a multi-group comparison approach, due to the Size type of variable being categorical (Henseler and Fassott, 2010). For this purpose, responses were divided into two groups, depending on Size (group 1 = SMEs; group 2 = Large company). Then, with the use of PLS the path coefficients were estimated for each group or subsample (Sarstedt et al., 2011). Finally, the differences between the coefficients' paths were analysed. If they are significant, they can be interpreted as having moderating effects. To determine the significance of differences between the estimated parameters for each of the groups, two approaches were followed. On the one hand, the parametric approach was used considering both equal variances and different variances (Chin, 2000). On the other hand, a non-parametric confidence approach was applied (Sarstedt et al., 2011). An example of multi-group comparisons considering organisational size as a moderator variable can be consulted in Real, Roldán and Leal (2012). 5. Results
Given that the measurement model has been designed as composite (indicators are
expected to be correlated, dropping an indicator from the measurement model alters the meaning of the construct, measures of internal consistency and reliability do only make sense if the composite approximates a reflective construct) following a reflective approach (we assume that these indicators are correlated) (Henseler, 2014). In addition, our model is oriented to prediction. Its assessment has to be based with regard to reliability and validity (Roldán and Sánchez-Franco, 2012). Subsequent PLS path model analysis reveals that all measures meet the commonly suggested criteria for measurement model assessment as described, for example, by Henseler et al., (2009), and Hair et al., (2012). In this vein, loadings of both indicators and dimensions exceed the 0.707 threshold. Consequently, indicators and dimensions are reliable. Constructs and dimensions present high internal consistency, as its composite reliability indices are above 0.7. In addition, the convergent validity is achieved for all latent variables because the average variance extracted (AVE) ratios exceed the 0.5 benchmark (Table 1).

Calvo-Mora et al. QM, KM, Results, multi-group analysis
2nd International Symposium on Partial Least Squares Path Modeling, Seville (Spain), 2015 7
Table 1: Measurement model
On the other hand, Table 2 shows the discriminant validity. According to the Fornell-
Larcker criterion, the square root of the AVE of each latent is greater than its correlations with any other latent variable (Fornell and Larcker, 1981). Moreover, we used the Heterotrait-monotrait (HTMT) ratio of correlations (Henseler, Ringle, & Sarstedt, 2015). In this vein, all values are under 0.85. Thus, the discriminant validity is reached, and it can be concluded that the main constructs measure different aspects.
Table 2: Discriminant validity
Fornell-Larcker
Total Sample; n= 225 SMEs; n= 146 Large companies; n= 79 PMM PM KM KBR PMM PM KM KBR PMM PM KM KBR
PMM 0.850 0.856 0.846 PM 0.820 0.868 0.821 0.868 0.821 0.870 KM 0.806 0.802 0.857 0.822 0.804 0.856 0.791 0.819 0.862 KBR 0.561 0.660 0.677 0.954 0.532 0.706 0.722 0.960 0.626 0.583 0.611 0.946 Note: Diagonal elements (bold) are the square root of the variance shared between the constructs and their measures (average variance extracted). Off-diagonal elements are the correlations among constructs
HTMT Total Sample; n= 225 SMEs; n= 146 Large companies; n= 79
PMM PM KM KBR PMM PM KM KBR PMM PM KM KBR PMM PM 0.827 0.826 0.803 KM 0.818 0.821 0.819 0.847 0.809 0.837 KBR 0.610 0.729 0.778 0.558 0.772 0.818 0.718 0.652 0.713 In summary, according to the PLS analyses, the measurement model is completely
satisfactory for our model, both with the whole sample and with each subsample (SMEs and large companies). In addition, the proposed measurement model does not vary when the size of the company is taken into account. That is, factor loadings for the same indicators are invariant between SMEs and large companies, guaranteeing the metric invariance (Afonso, et al., 2012) (Table 3).
Table 4 shows the results of the structural model assessment. Consistent with Hair et al., (2013), bootstrapping (5000 resamples; one-tailed Student t distribution with (n-1) degrees of freedom) was used to generate standard errors, t-statistics, and percentile 95% confidence intervals. This analysis was carried out both for the total sample and for the two subsamples. The three main paths are significant, except for the PMM and KM relationship in the large
Construct/Indicator (EFQM Sub-criteria)
Total Sample; n= 225 SMEs; n= 146 Large companies; n= 79
Loadings!Composite Reliability! AVE! Loadings!
Composite Reliability! AVE! Loadings!
Composite Reliability! AVE!
Process management methodology (PMM)! ! 0.912! 0.722! ! 0.916! 0.732! ! 0.909! 0.715!1b. Development of a process management system and to assign its proprietors! 0.871! ! ! 0.879! ! ! 0.869! ! !2d. Identify and develop the key process diagram! 0.867! ! ! 0.885! ! ! 0.841! ! !5a. Description of the system to design and to manage processes! 0.777! ! ! 0.752! ! ! 0.816! ! !5b. Description of the system oriented to the improvement of processes! 0.880! ! ! 0.899! ! ! 0.855! ! !Partner management (PM)! ! 0.924! 0.753! ! 0.925! 0.754! ! 0.926! 0.757!1c. Involvement of the leaders with suppliers and partners! 0.866! ! ! 0.855! ! ! 0.890! ! !2a. Establish needs and expectations! 0.916! ! ! 0.909! ! ! 0.927! ! !2c. Balance needs and expectations! 0.871! ! ! 0.881! ! ! 0.863! ! !4a. Manage alliances! 0.814! ! ! 0.827! ! ! 0.796! ! !Knowledge management (KM)! ! 0.892! 0.735! ! 0.891! 0.732! ! 0.896! 0.743!2b. Contributions of knowledge to the policy and strategy of the organisation! 0.894! ! ! 0.902! ! ! 0.889! ! !3b. Identification, development and maintenance of the knowledge in the personnel! 0.849! ! ! 0.872! ! ! 0.813! ! !4e. Management of the organisation’s knowledge! 0.827! ! ! 0.788! ! ! 0.881! ! !Key business results (KBR)! ! 0.953! 0.911! ! 0.959! 0.921! ! 0.944! 0.894!9a. Operational results! 0.952! ! ! 0.958! ! ! 0.942! ! !9b. Strategic results! 0.957! ! ! 0.961! ! ! 0.950! ! !!

Calvo-Mora et al. QM, KM, Results, multi-group analysis
2nd International Symposium on Partial Least Squares Path Modeling, Seville (Spain), 2015 8
companies subsample. The endogenous constructs achieve R2 values between 0.373 and 0.521 for KBR, considering those values of moderate character (Chin, 2010). In the case of the knowledge factor, R2 varies between 0.785 and 0.848. In this case, this is higher than the substantial level indicated by Chin (2010). The predictive relevance of the theoretical/structural model is assessed with the cross-validated redundancy index (Q2) for endogenous constructs. Since all Q2 values are greater than 0, evidence was found that our model has predictive relevance (Chin, 2010). In addition, Table 4 shows the amount of variance that each antecedent variable explains on each dependent variable, the greater value being obtained in the case of the suppliers/partners variable when explaining the explained variance of the KBR (67%). Also, Table 4 shows that the indirect effects are significant for the whole sample, with significant differences being generated, according to the size of the company, in the effect generated by PMM on KBR through KM. Therefore, in small companies, designing a good PMM from the point of view of the application of the EFQM model can be vital for knowledge generation and obtaining good results. In the PM-KM-KBR relationship, the size did not generate significant differences (Table 4).
Table 3: Metric invariance assessment multi-group analysis
Once the metric invariance was guaranteed in the measurement model and the structural
model tested, the multi-group analyses were performed for the hypotheses 4–6, allowing the testing of the moderating role of organisational size on the relationships included in the research model. Firstly, the parametric approach is applied. The moderating effect is examined using a t-test with pooled standard errors. This approach requires the data to be distributed normally and/or that the variances of the two samples are not too different from one another –tParam (EV)-. In the case of assuming there are different variances for the two samples, a Welch-Satterthwait test -tParam(NEV)- can be applied (Sarstedt et al., 2011). Both tests have been applied in the comparison, obtaining similar results (Table 5). As can be seen, statistical support is found for H4 and H5, but not for H6. The same result is derived from the application of the non-parametric approaches (the bias –correct 95% confidence intervals). In this case, if the parameter estimate for a path relationship of one group (Table 4) does not fall within the corresponding confidence interval of another group (Table 5) and vice versa, there exists no overlap and it can be assumed that the group-specific path coefficients are significantly different with regard to a significance level α (Sarstedt et al., 2011). This condition is fulfilled for H4 and H5, but not confirmed for H6.
Construct/Indicator!
Diff (SME-L)
Parametric Test
t-value
Welch Satterthwait
Test (t-value)
Construct/Indicator
Diff (SME-L)
Parametric Test
t-value
Welch Satterthwait Test
(t-value) PMM! ! ! ! KM! ! ! !1b. 0.001 0.273 ns 0.265 ns 2b. 0.013 0.544 ns 0.496 ns 2d. 0.044 1.415 ns 1.273 ns 3b. 0.059 1.096 ns 0.959 ns 5a. 0.064 0.825 ns 0.826 ns 4e. 0.093 1.296 ns 1.601 ns 5b. 0.043 0.916 ns 0.777 ns PM KBR 1c. 0.035 0.900 ns 0.965 ns 9a. 0.016 0.955 ns 0.856 ns 2a. 0.018 0.742 ns 0.803 ns 9b. 0.011 1.010 ns 0.979 ns 2c. 0.018 0.548 ns 0.507 ns 4a. 0.031 0.568 ns 0.560 ns ns = not significant
!

Calvo-Mora et al. QM, KM, Results, multi-group analysis
2nd International Symposium on Partial Least Squares Path Modeling, Seville (Spain), 2015 9
Table 4: Direct and indirect effects multi-group comparison. Bias-correct 95% confidence
intervals
Table 5: Multi-group comparison test results and Bias-corrected 95% confidence intervals
Finally, the overall model was measured through standardized root mean square residual (SRMR) composite factor model (Henseler et al., 2014). Thus, the values obtained for the complete model (0.075) for large companies model (0.073) and SMEs model (0.079) give below the limit recommended value of 0.08 (Hu and Bentler, 1999). 6. Discussion and conclusions
The results support the reliability and validity of the measurement model (Tables 1 and 2), both for the model that represents the whole sample of companies and for the subsamples that represent the SMEs and the large companies. In addition, the property of metric invariance is verified, that is to say, the measurement model does not change when dividing the original sample into two subsamples (Table 3). This result supports the universal character of the Excellence Models that can be used as reference for evaluation and improvement by both large organisations and by SMEs (EFQM, 2003). Moreover, the results confirm the high predictive power (R2) and high predictive validity (Q2) of the EFQM model as a framework for the implementation and integration of TQM and KM practices. As can be seen in Table 4, the KM and KBR variables display substantial R2 values (R2 > 0.67) according to Chin (2010), both for the whole sample and for the two subsamples representing the SMEs and large companies. Moreover, the endogenous variables present Q2 coefficient values above 0, specifically, they display values of Q2 > 0.33.
With respect to the direct effects represented by the H1, H2 and H3 hypotheses, firstly it is highlighted (Table 4) that PM plays a central role in the complete model, and in that representing the SMEs, where there is a significant direct effect on KM (H1). In addition, PM is used with more intensity in the SMEs (0.344) than in large organisations (0.113). In this sense, in the model that represents large companies, the relationship between PMM and KM, although positive, is not statistically significant. In addition, this causes the indirect effect between PMM, KM and KBR to lack statistical significance. This result may be due to greater collaboration and cooperation between employees in the SMEs when putting key processes
Total Sample; n= 225 SMEs; n= 146 Large companies; n= 79 Effects on endogenous variables Direct
effect t-value
(bootstrap) Explained variance
Direct effect
t-value (bootstrap)
Explained variance
Direct effect
t-value (bootstrap)
Explained variance
Knowledge management (R2 = 0.798 / Q2 = 0.580) (R2 = 0.785 / Q2 = 0.564) (R2 = 0.848 / Q2 = 0.609) H1: Process management methodology 0.252*** 4.919 20.40% 0.344*** 5.256 28.28% 0.113ns 1.507 8.94% H2: Partner management 0.675*** 13.672 54.13% 0.581*** 8.798 46.71% 0.826*** 13.069 67.65% Key business results (R2 = 0.458 / Q2 = 0.416) (R2 = 0.521 / Q2 = 0.476) (R2 = 0.373 / Q2 = 0.331) H3: Knowledge management 0.677*** 17.473 45.83% 0.722*** 19.940 52.13% 0.611*** 7.269 37.33% Indirect effect Total sample SMEs Vs. Large companies Significance PMM! KM! KBR Percentile 95% bootstrap confidence intervals
0.171 [0.114; 0.228]
0.248 [0.163; 0.336]
0.069 [-0.022; 0.161]
Sig.
PM! KM! KBR Percentile 95% confidence intervals
0.456 [0.386; 0.534]
0.419 [0.314; 0.533]
0.504 [0.344; 0.669]
Nsig
*** p < 0.001, (based on t(4999), one-tailed test); t(0.05, 4999) = 1.645, t(0.01. 4999) = 2.327, t(0.001, 4999) = 3.092; Bootstrapping based on n = 5.000 subsamples; ns = not significant Sig. denotes a significant difference -indirect effect- at 0.05; Nsig. denotes a non-significant difference -indirect effect- at 0.05.
!
Relationship |diff| tParametric(EV) tParametric(NEV) Confidence Intervals Significance SMEs Large Companies H4 (SME-L) PMM!KM 0.231 2.242** 2.354** [0.317, 0.572] [-0.041, 0.254] Sig.
H5 (SME-L) PM!KM
0.244 2.448** 2.706** [0.455, 0.702] [0.707, 0.955] Sig.
H6 (SME-L) KM!KBR
0.111 1.396 ns 1.210 ns [0.655, 0.794] [0.445, 0.769] NSig.
Notes: ** Significant at 0.05 (two-tail t distribution, one-sided test) ; ns = not significance
Notes: Sig. denote a significant difference at 0.05; Nsig. denote a non-significant difference at 0.05:
!

Calvo-Mora et al. QM, KM, Results, multi-group analysis
2nd International Symposium on Partial Least Squares Path Modeling, Seville (Spain), 2015 10
into practice (Durst and Edvardsson, 2012) and to the SMEs greater focus on continuous improvement through processes and less towards technological and more radical innovation compared to large companies (McAdam and Reid, 2001). The importance of this factor is also reflected in the high percentages of variance (R2) of the KM variable in both the complete model (20.4%) and in that representing the SMEs (28.28%).
Secondly, the management of the main partners of the organisations is also a critical variable for KM within the framework of the EFQM model. Thus, the direct effect between PM and KM (H2) is statistically significant both in the model that represents all the companies and in the models segmented according to size (Table 4). In addition, management in large companies emphasises the importance of PM for KM (0.826). This value is far beyond that obtained for this same relationship in the SMEs (0.581). For that reason the indirect effect between these variables and KBR is statistically significant (Table 4). This result may be due to the greater negotiating power that large companies have over their main partners, such as suppliers, providers or distributors (Gray and Mabey, 2005). This crucial role in the model is also observed when analysing the percentage of variance accounted for by the endogenous KM variable in the complete sample (54.13%), as well as in those of SMEs (46.71%) and large companies (67.65%).
Thirdly, it is necessary to emphasize how the specific efforts that companies make to manage their knowledge have a direct and significant effect on the KBR (H4). This effect is confirmed both for the whole sample and for the subsamples that represent the SMEs and large companies (Table 4). In addition, no important differences exist in the values of the indirect effects in this case, although the relationship between KM and KBR is more intense in the SMEs (0.722) than in large companies (0.611), explaining up to 52.13% of the variance of the KBR variable.
Finally, if the results of the moderating effect that the size variable exerts on the direct relationships between the variables of the model are analysed, it is seen that there are significant differences (Table 5) in the relationships between PMM and KM (H4) and between PM and KM (H5). These differences corroborate that indicated in the literature on the distinctive features presented by the management of SMEs with respect to large companies. More specifically, PMM has a greater effect on KM in the SMEs. This may be due to the smaller size and the lower level of specialisation of the workforce, causing a greater probability of collaboration and cooperation between the employees, which to a large extent favours the processes of creation, transfer and application of knowledge. In addition, as noted previously, the SMEs are more focused on continuous improvement through processes and not as much towards technological innovation (McAdam and Reid, 2001). On the contrary, the relationship between PM and KM is more intense in large companies. In this sense, the large companies have greater negotiating power over their main partners (Gray and Mabey, 2005) and have more financial means to know the movements and actions of competitors and other stakeholders.
Finally, it is corroborated that KM can be effective and improve the KBR independently of the size of the organisation, when there are no significant differences between both samples. 7. References Afonso, A., Roldán, J.L., Sánchez-Franco, M.J., & González, M. (2012). The moderator role
of Gender in the Unified Theory of Acceptance and Use of Technology (UTAUT): A study on users of Electronic Document Management Systems. 7th International Conference on Partial Least Squares and Related Methods, At Houston, Texas, USA

Calvo-Mora et al. QM, KM, Results, multi-group analysis
2nd International Symposium on Partial Least Squares Path Modeling, Seville (Spain), 2015 11
Asif, M., de Vries, H. J., & Ahmad, N. (2013). Knowledge creation through quality management. Total Quality Management & Business Excellence, 24(5-6), 664-677.
Benavides, C., & Quintana, C. (2003). Gestión del conocimiento y calidad total. Madrid: Díaz de Santos.
Bou-Llusar, J. C., Escrig-Tena, A. B., Roca-Puig, V., & Beltrán-Martín, I. (2009). An empirical assessment of the EFQM Excellence Model: Evaluation as a TQM framework relative to the MBNQA Model. Journal of Operations Management, 27(1), 1-22.
Chin, W. W. (2000). Multi-group analysis with PLS. Retrieved from http://disc-nt.cba.uh.edu/ Chin, W.W. (2010). How to write up and report PLS analyses. In Esposito Vinzi, V., Chin,
W. W., Henseler, J., & Wang, H. (Eds.), Handbook of partial least squares: Concepts, methods and applications (pp. 655–690). Berlin, Germany: Springer-Verlag.
chin/plsfaq/multigroup.htm. Daud, S., Fadzilah, W., & Yusoff, W. (2011). The Influence of Soft and Hard TQM Factors
on Knowledge Management: Perspective from Malaysia. In 2011 International Conference on Management and Service Science, 8, 17-22.
Davenport, T. H., & Prusak, L. (1998). Working knowledge: How organisations manage what they know. Harvard Business Press.
Durst, S., & Runar Edvardsson, I. (2012). Knowledge management in SMEs: a literature review. Journal of Knowledge Management, 16(6), 879-903.
EFQM. (2003). EFQM Excellence Model. European Foundation for Quality Management, Brussels, Belgium.
Fornell, C., & Larcker, D. F. (1981). Structural equation models with unobservable variables and measurement error: Algebra and statistics. Journal of Marketing Research, 382-388.
Gray, C., & Mabey, C. (2005). Management Development Key Differences between Small and Large Businesses in Europe. International Small Business Journal, 23(5), 467-485.
Hair Jr, J. F., Hult, G. T. M., Ringle, C., & Sarstedt, M. (2013). A primer on partial least squares structural equation modeling (PLS-SEM). Sage Publications.
Hair, J. F., Sarstedt, M., Ringle, C. M., & Mena, J. A. (2012). An assessment of the use of partial least squares structural equation modeling in marketing research. Journal of the Academy of Marketing Science, 40(3), 414-433.
Henseler, J. (2014). Common factor models, composite models, and formative measurement: Their nature, application, and testing. Lecture at University of Seville, November 20.
Henseler, J., & Fassott, G. (2010). Testing moderating effects in PLS path models: An illustration of available procedures. In Handbook of partial least squares (pp. 713-735). Springer Berlin Heidelberg.
Henseler, J., Dijkstra, T.K., Sarstedt, M., Ringle, C.M., Diamantopoulos, A., Straub, D.W., Ketchen, D.J., Jr., Hair, J.F., Hult, G., Tomas M., & Calantone, R.J. (2014). Common beliefs and reality about PLS: Comments on Rönkkö & Evermann (2013), Organizational Research Methods, 17 (2), 182-209.
Henseler, J., Ringle, C. M., & Sinkovics, R. R. (2009). The use of partial least squares path modeling in international marketing. Advances in International Marketing, 20, 277–320.
Henseler, J., Ringle, C.M., & Sarstedt, M. (2015). A new criterion for assessing discriminant validity in variance-based structural equation modeling. Journal of the Academy of Marketing Science, 43 (1), 115-135.
Hu, L.-T., & Bentler, P. M. (1999). Cutoff criteria for fit indexes in covariance structure analysis: Conventional criteria versus new alternatives. Structural Equation Modeling:
Calvo-Mora et al. QM, KM, Results, multi-group analysis
2nd International Symposium on Partial Least Squares Path Modeling, Seville (Spain), 2015 12
A Multidisciplinary Journal, 6(1), 1-55. Ju, T. L., Lin, B., Lin, C., & Kuo, H. J. (2006). TQM critical factors and KM value chain
activities. Total Quality Management & Business Excellence, 17(3), 373-393. Kim, D., Kumar, V., & Murphy, S. A. (2010). European foundation for quality management
business excellence model: an integrative review and research agenda. International Journal of Quality & Reliability Management, 27(6), 684-701.
Laforet, S. (2013). Organizational innovation outcomes in SMEs: Effects of age, size, and sector. Journal of World business, 48(4), 490-502.
Linderman, K., Schroeder, R. G., Zaheer, S., Liedtke, C., & Choo, A. S. (2004). Integrating quality management practices with knowledge creation processes. Journal of Operations Management, 22(6), 589-607.
Loke, S. P., Downe, A. G., Sambasivan, M., & Khalid, K. (2012). A structural approach to integrating total quality management and knowledge management with supply chain learning. Journal of Business Economics and Management, 13(4), 776-800.
McAdam, R., & Reid, R. (2001). SME and large organisation perceptions of knowledge management: comparisons and contrasts. Journal of Knowledge Management, 5(3), 231-241.
Molina, L. M., Lloréns Montes, F. J., & Del Mar Fuentes, M. (2004). TQM and ISO 9000 effects on knowledge transferability and knowledge transfers. Total Quality Management & Business Excellence, 15(7), 1001-1015.
Molina, L. M., Lloréns-Montes, J., & Ruiz-Moreno, A. (2007). Relationship between quality management practices and knowledge transfer. Journal of Operations Management, 25(3), 682-701.
Prajogo, D. I., & McDermott, C. M. (2005). The relationship between total quality management practices and organizational culture. International Journal of Operations & Production Management, 25(11), 1101-1122.
Real, J. C., Roldán, J. L., & Leal, A. (2014). From entrepreneurial orientation and learning orientation to business performance: analysing the mediating role of organizational learning and the moderating effects of organizational size. British Journal of Management, 25(2), 186-208.
Ringle, C.M., Wende, S. & Becker, J-M. (2015). SmartPLS, 3. SmartPLS GmbH. Boenningstedt, Germany. URL: www.smartpls.com
Roldán, J. L., & Sánchez-Franco, M. J. (2012). Variance-Based Structural Equation Modeling: Guidelines for Using Partial Least Squares. Research methodologies, innovations and philosophies in software systems engineering and information systems, 193.
Sarstedt, M., Henseler, J., & Ringle, C. M. (2011). Multigroup analysis in partial least squares (PLS) path modeling: Alternative methods and empirical results. Advances in International Marketing, 22(1), 195-218.
Spekman, R. E., Spear, J., & Kamauff, J. (2002). Supply chain competency: learning as a key component. Supply Chain Management: An International Journal, 7(1), 41-55.
Tang, J., & Tong, J. Y. (2007). A two-phase knowledge management system for the quality standard ISO9001. International Journal of Management, 24(1), 184.
Tanriverdi, H. (2005). Information technology relatedness, knowledge management capability, and performance of multibusiness firms. MIS Quarterly, 311-334.
Tarí Guilló, J. J., & García Fernández, M. (2013). ¿Puede la gestión del conocimiento influir en los resultados empresariales? Cuadernos de Gestión, 13(1), 151-176.
Zack, M., McKeen, J., & Singh, S. (2009). Knowledge management and organizational performance: an exploratory analysis. Journal of Knowledge Management, 13(6), 392-409.

Calvo-Mora et al. QM, KM, Results, multi-group analysis
2nd International Symposium on Partial Least Squares Path Modeling, Seville (Spain), 2015 13