quality manual of luminous flux measurements - aaltometrology.hut.fi/quality/qmlm.pdf · quality...
TRANSCRIPT
Aalto University
School of Electrical Engineering
Metrology Research Institute
Version 3.0
02/12/2014
Jari Hovila
Pasi Manninen
Tuomas Poikonen
Quality Manual of Luminous Flux Measurements

Quality Manual of Lumi-nous Flux Measurements
Page 2 (23)
Version: 3.0 Date: December 2, 2014 Last edited by: TuP
1. Table of contents
Quality Manual of Luminous Flux Measurements ................................................... 11. Table of contents ............................................................................................. 22. Definition ........................................................................................................ 3
2.1. Scope .......................................................................................................... 32.2. Object and field of application .................................................................... 32.3. Features ...................................................................................................... 32.4. Principle of the realization .......................................................................... 3
3. Equipment ....................................................................................................... 43.1. Description of setup .................................................................................... 4
3.1.1. Equipment needed for calibrating luminous flux standard lamps ........... 43.2. Calibration requirements ............................................................................ 6
3.2.1. Maintenance .......................................................................................... 64. Measurement traceability ............................................................................... 7
4.1. Uncertainty budget ..................................................................................... 85. Calibration and measurement procedures including validation methods ......... 9
5.1. Wirings ........................................................................................................ 105.2. Measurement procedure ............................................................................ 105.3. Characterization procedure of the measurement system ............................ 11
5.3.1. Measurement of illuminance distribution on the aperture plane............ 115.3.2. Scanning of the spatial uniformity of the integrating sphere .................. 135.3.3. Measurement of the incident angle factor ............................................. 165.3.4. Spectral throughput of the integrating sphere ........................................ 17
6. Handling of calibration items ........................................................................... 186.1. Safety and handling precautions ................................................................. 186.2. Monitoring of luminous flux standard lamps ............................................... 18
7. Uncertainty budgets ........................................................................................ 198. Measurement of luminous efficacy.................................................................. 209. Accommodation and environmental condions................................................. 2110. Control data .................................................................................................... 2211. Certificates ...................................................................................................... 2212. Intercomparisons ............................................................................................ 2213. Publications ..................................................................................................... 22
Quality Manual of Lumi-nous Flux Measurements
Page 3 (23)
Version: 3.0 Date: December 2, 2014 Last edited by: TuP
2. Definition
2.1. Scope
This instruction manual describes the principle and the operation of the equipmentused for detector-based luminous flux (lm) measurements. The calibrated devices arestandard lamp light sources.
2.2. Object and field of application
Standard photometer: Secondary standard for illuminance measurements.
Sphere photometer: Measures illuminance levels relative to the luminous flux.
Spectroradiometer: Used for measuring the spectrum of the luminous flux sources.
Integrating sphere: Collects the total luminous flux of the lamp inside the sphere.
2.3. Features
a) Standard photometer:
See Ref. 1.
b) Sphere photometer:
Diffuser-equipped photometer attached to the integrating sphere. It measures illumi-nance values that are relative to the luminous flux levels inside the sphere.
c) Spectroradiometer:
See Ref. 2.
d) Integrating sphere:
The diameter of the sphere is 165 cm. The inner surface of the sphere is painted with ahigh-reflectance BaSO4-coating. The sphere consists of two hemispheres which can beseparated to mount/change the lamp inside.
2.4. Principle of the realization
The principle of the realization is described thoroughly in [3-5]. Therefore only a shortintroduction to the theory is given here.
The unknown luminous flux of a standard lamp (later referred as the internal source)inside the integrating sphere is measured by comparing it against a known referenceluminous flux introduced to the sphere from an external source through an opening onthe sphere wall.
The reference luminous flux is obtained by measuring the illuminance of the externalsource at the aperture plane of a precision aperture outside the sphere. The referenceluminous flux is then

Quality Manual of Lumi-nous Flux Measurements
Page 4 (23)
Version: 3.0 Date: December 2, 2014 Last edited by: TuP
AEvext , (1)
where Ev is the measured illuminance and A is the area of the aperture.
The standard photometer is removed and the reference luminous flux enters thesphere through a 10 cm opening. The signal yext from the sphere photometer is record-ed. The external source is then switched off and the internal source is switched on.Another signal from the sphere photometer yint is recorded. The luminous flux of thestandard lamp inside the sphere can then be obtained as
extext
intint y
y . (2)
The resulting luminous flux value is then multiplied by a correction factor f which con-sists of six sub-correction factors:
Spectral-mismatch correction factor for the external source
Spectral-mismatch correction factor for the internal source
Correction factor for the spatial non-uniformity of the sphere surface
Correction factor for the angular intensity distribution of the luminous flux stand-ard lamp
Correction factor for the non-uniformity of the illuminance at the aperture plane
Correction factor for the different reflectivity of the sphere surface on different in-cident angles.
These correction factors are further explained in [4].
3. Equipment
3.1. Description of setup
3.1.1. Equipment needed for calibrating luminous flux standard lamps
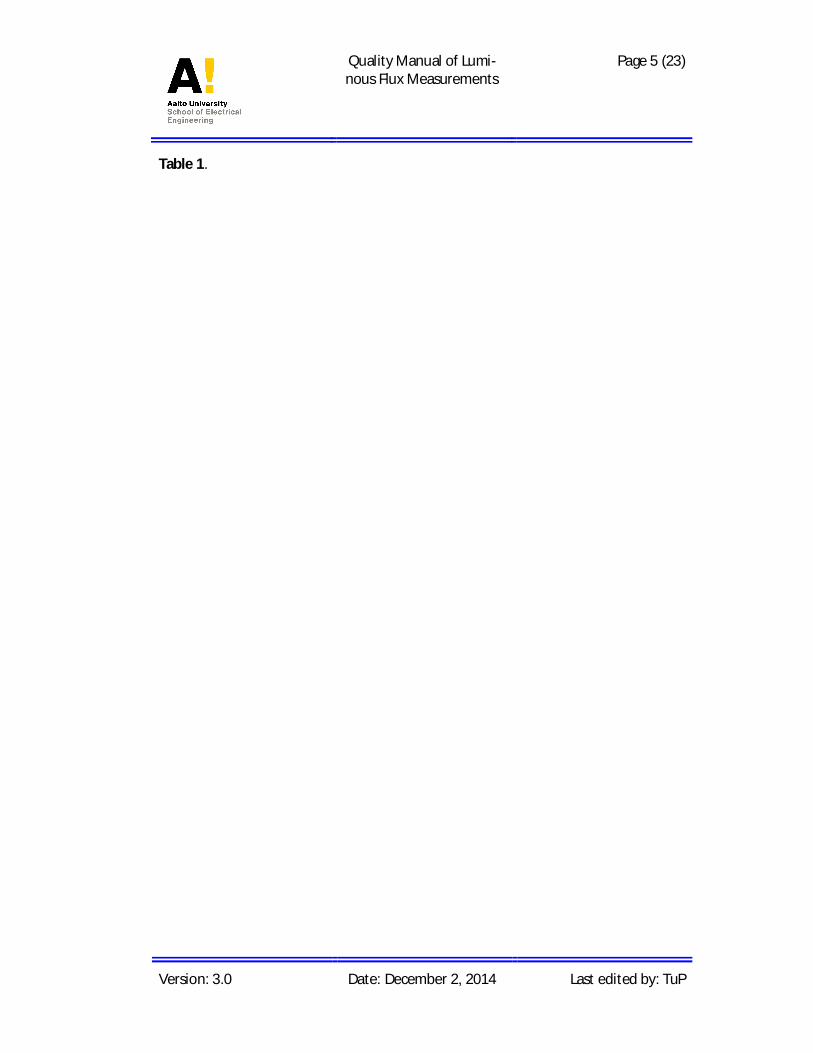
Equipment needed in the luminous flux calibrations is presented in
Quality Manual of Lumi-nous Flux Measurements
Page 5 (23)
Version: 3.0 Date: December 2, 2014 Last edited by: TuP
Table 1.

Quality Manual of Lumi-nous Flux Measurements
Page 6 (23)
Version: 3.0 Date: December 2, 2014 Last edited by: TuP
Table 1. Equipment of luminous flux calibrations.
Description Quantity Serial NR / Identification
A. Light measurement1. PRC-photometer [Error! Bookmark 2 HUT-1 / HUT-2, LM-1 / LM-22. Integrating sphere 1 Labsphere LMS-6503. Spectroradiometer [Error! Book- 1 Bentham DTMc-3004. Precision aperture 3 AV1, AV2, AV35. Current-to-voltage converter (CVC) 1 Vinculum SP0426. Digital voltmeter (DVM) 1 HP 3458A
B. Light source1. Osram Sylvania T6 1 BN-9101-391, BN-9101-4652. Osram Wi40/G Globe 5 LMS9901-02,LMS0003-053. Lamp power supply 2 Heinzinger PTN55 125-10
4.Standard resistor 2 Guildline 9230-15 (0.1 ):
s/n 65852 / 62587
5. Digital voltmeter (DVM) 3 HP 3458A6. Alignment laser 1 OMTec
C. Control and data acquisition1. Computer 1 Hewlet Packard: “Photometry”2. Software 1 Lumen_TKK.vi
3.2. Calibration requirements
3.2.1. Maintenance
To ensure accurate measurement results and traceability, the measurement systemand the devices used in the calibrations must be calibrated often enough. The charac-terization of the measurement system is performed according to schedule presentedin Table 2. The calibration schedule for the devices is presented in Table 3. The lumi-nous flux standard lamps should be measured every 2 years, or at the same time withcustomer’s lamps to ensure stability of the luminous flux scale. The burning timesshould be minimized because of poor availability of new standard lamps.
Table 2. Schedule for the system characterization measurements.
Characterization component Calibration intervalSphere surface scan 4Aperture plane illuminance distribution 4Spectral throughput of the sphere 4Incident angle 8Lamp spectra 2

Quality Manual of Lumi-nous Flux Measurements
Page 7 (23)
Version: 3.0 Date: December 2, 2014 Last edited by: TuP
Table 3. Shedule for the device and lamp calibrations.
Device to be calibrated Calibration intervalPRC-photometer 1Spectroradiometer See [2]Precision aperture 4Current-to-voltage converter See [6]Digital voltmeter See [6]Precision resistor See [6]Temperature and humidity meter See [6]Luminous flux standard lamps 2
4. Measurement traceability
The unit of luminous flux is linked to the detector-based photometric scale of Metrolo-gy Research Institute via the illuminance responsivity of the standard photometer.Therefore, the luminous flux scale is traceable to the primary standards of opticalpower, spectral transmittance and length. The traceability chain of the unit of lumi-nous flux is presented in Figure 1.
Figure 1. Traceability chain of the unit of luminous flux.
Optical power [W]
Illuminance [lx]
Luminous flux [lm]
Transmittance Length [m]
Length [m]
Current [A]
Quality Manual of Lumi-nous Flux Measurements
Page 8 (23)
Version: 3.0 Date: December 2, 2014 Last edited by: TuP
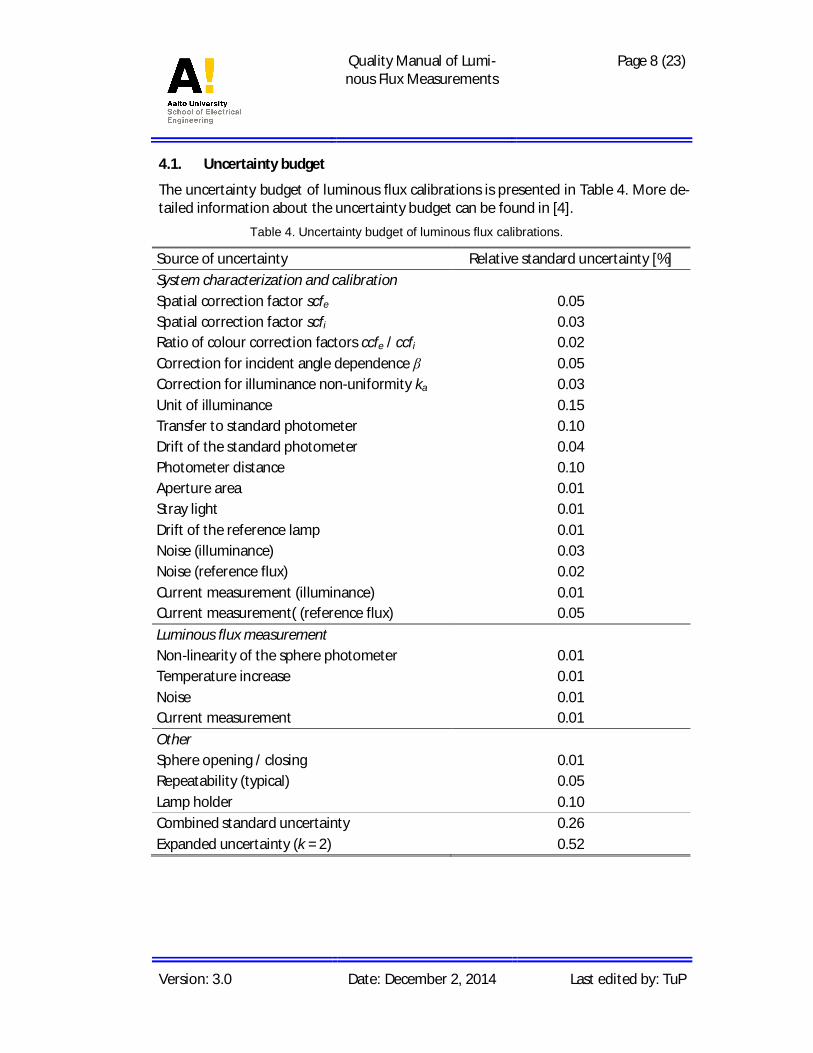
4.1. Uncertainty budget
The uncertainty budget of luminous flux calibrations is presented in Table 4. More de-tailed information about the uncertainty budget can be found in [4].
Table 4. Uncertainty budget of luminous flux calibrations.
Source of uncertainty Relative standard uncertainty [%]System characterization and calibrationSpatial correction factor scfe 0.05Spatial correction factor scfi 0.03Ratio of colour correction factors ccfe / ccfi 0.02Correction for incident angle dependence 0.05Correction for illuminance non-uniformity ka 0.03Unit of illuminance 0.15Transfer to standard photometer 0.10Drift of the standard photometer 0.04Photometer distance 0.10Aperture area 0.01Stray light 0.01Drift of the reference lamp 0.01Noise (illuminance) 0.03Noise (reference flux) 0.02Current measurement (illuminance) 0.01Current measurement( (reference flux) 0.05Luminous flux measurementNon-linearity of the sphere photometer 0.01Temperature increase 0.01Noise 0.01Current measurement 0.01OtherSphere opening / closing 0.01Repeatability (typical) 0.05Lamp holder 0.10Combined standard uncertainty 0.26Expanded uncertainty (k = 2) 0.52

Quality Manual of Lumi-nous Flux Measurements
Page 9 (23)
Version: 3.0 Date: December 2, 2014 Last edited by: TuP
5. Calibration and measurement procedures including vali-dation methods
The luminous flux measurement setup is presented in Figure 2. The figure is simplified;it does not contain power supplies, precision resistors, DVMs, CVC nor wirings. Thereference luminous flux is produced using the stable external source of type 1000 WOsram FEL Sylvania T6, aperture array with a shutter, precision aperture and a stand-ard photometer. As a standard photometer, HUT-1 or HUT-2 is used. The photometerused in the detector port of the sphere is either LM-1 or LM-2 with diffuser input. Aspectroradiometer can be mounted to the detector port of the sphere using a diffuser-adapter. Spectral measurements are needed for determining the spectral-mismatchcorrection, and the CCT of the lamp, as well as the spectral throughput of the sphere.
The sphere is equipped with three baffles that are painted using the same BaSO4-coating, as the sphere. Any light illuminating a baffle gets diffuse-reflected from its sur-face. The purpose of baffle 1 is to prevent the flux test-lamp from escaping the spherethrough the opening used for the reference flux during the measurements. Baffle 2ensures that the detector does not see the test-lamp directly, but only the light opti-cally integrated by the sphere surface. The auxiliary lamp and baffle 3 form an addi-tional source that can be used for self-absorption measurements of test-lamps. Theauxiliary lamp is not used in calibrations, where the external source is operated. Theself-absorption of the luminous flux standard lamp is taken into account in the lumi-nous flux responsivity calibration of the system.
Figure 2. Luminous flux measurement setup.

Quality Manual of Lumi-nous Flux Measurements
Page 10 (23)
Version: 3.0 Date: December 2, 2014 Last edited by: TuP
5.1. Wirings
Wiring of the external source is described in [7]. DVM-2 (front terminal) is used for theinternal lamp current measurement. The lamp holder for the internal source is at-tached to the top of the sphere. The lamp is mounted base up and so that the filamentof the lamp is at the center of the sphere. The lamp mounting base has a 4-point E27socket for precise operating current and base voltage measurements. DVM-2 (rearterminal) is used for the current measurement of the external lamp. In a similar way,the DVM-3 is used for the voltage measurement of both internal (front terminal) andexternal (rear terminal) lamps. The measurement can be conducted using one or twoCVC devices. If two CVCs are used, both photometers can be connected at all timesand the photometer, of which signal is to be measured is selected using the front/rearterminal switch of the DVM-1. If only one CVC is used, the signal cables from the pho-tometers are manually switched using the adapter box of the LM-1 photometer.
5.2. Measurement procedure
The measurement program Lumen_TKK.vi is located in the measurement computer indirectory
C:\Calibrations\Measurement programs\
The program gives instructions about necessary actions (eg. wiring changes) betweendifferent calibration phases.
The following measurement procedure is different than described in Chapter 2.4, but itis optimized to fulfil the following criteria:
The operating time of the internal source remains minimum
Overall time of the calibration is minimized
Several internal sources can be consecutively measured (external source is notswitched off at any point)
No unnecessary wiring changes
Normally the aperture AV2 with a nominal diameter of 40 mm is used. The externalsource is operated at a color temperature close to the standard illuminant A (2856 K).The operating currents of the luminous flux standard lamps of the Metrology ResearchInstitute are chosen so that their correlated colour temperature is close to 2750 K.
The current of the internal source must be set as close as possible to the nominal valuebecause the current has a direct effect on the obtained luminous flux value. TwoHeinzinger PTN55 125-10 power supplies equipped with output current fine-tuning areused for operating the internal and external source during the measurements.
Procedure for luminous flux standard lamp calibration:
1. External source is switched on
2. Aperture array shutter is closed

Quality Manual of Lumi-nous Flux Measurements
Page 11 (23)
Version: 3.0 Date: December 2, 2014 Last edited by: TuP
3. After 30 minutes, internal source is switched on
4. After 10 minutes, signal from LM-1 is measured
5. Internal source is switched off
6. The dark current of LM-1 is measured with two different CVC sensitivity levels
7. HUT-1 is put in place and its dark current is measured
8. Aperture array shutter is opened
9. Signal from HUT-2 is measured
10. HUT-1 is removed, signal from LM-1 is measured
11. Aperture array shutter is closed
12. Internal source is changed and switched on
13. Calibration is continued from step 4.
The measurement data is analyzed using a LabVIEW-file Lumen_TKK.vi. It is located inthe measurement computer, in directory
C:\Calibrations\Measurement programs\
The dark currents are automatically subtracted from the photocurrents. The calculatedluminous flux of the internal source is adjusted by multiplying it with a valid correctionfactor f. The luminous flux is further adjusted by comparing the recorded operatingcurrent and base voltage against the nominal values.
5.3. Characterization procedure of the measurement system
5.3.1. Measurement of illuminance distribution on the aperture plane
The illuminance distribution of the external lamp (FEL-465) is measured on an opticalrail. Two linear translators are assembled as XY-configuration for moving the HUT-1 orHUT-2 photometer head within the area corresponding to the 40-mm precision aper-ture used in the measurement of reference luminous flux see Figure 3. The aperture isnot used in this measurement. The distance between the lamp and the photometershould be the same as in the reference luminous flux measurement, i.e. 700 mm.
The alignment of the XY-translator is carried out with the two-beam alignment laserand a mirror pressed against the adapter plate of the vertical translator. The construc-tion of the translator needs to be fine-tuned to obtain movement that is perpendicularto the optical axis. After this, the photometer can be attached to the vertical transla-tor, and aligned using the two-beam alignment laser. During the alignment, the trans-lators need to be near their mid positions that there is enough travel left to cover thewhole aperture area. The photometer can be mounted to the translators using a right-angle plate, kinematic mount and optical posts, as shown in Figure 3.

Quality Manual of Lumi-nous Flux Measurements
Page 12 (23)
Version: 3.0 Date: December 2, 2014 Last edited by: TuP
Figure 3. HUT-2 photometer assembled on two linear translators for illuminanceuniformity measurement (left) and the pattern used in the measurement (right).
The linear translators used in the measurement are of type Newmark NLS4-4 andNLS4-6 with travels of 100 mm and 150 mm, respectively. Two NLS4-6 translatorscould also be used. The translators are driven with a Newmark NSC-A2L motion con-troller (at the computer it uses Performax-drivers). The measurement programs andMatlab-functions needed for the measurement can be found in the directory
\\work\T405\MIKES-Aalto\Quality\Photom\Luminous flux\Programs 2014\.
In the FEL_spatial_scan.vi, the photometer should first be moved to optical axis manu-ally using the program functions. After pressing the “Measure”-button, the programmeasures the lamp signal for 60 seconds at the optical axis (middle point). Of these 60seconds e.g. first 20 seconds can be used for measuring the dark current by manuallycontrolling the shutter. Then, a sequence of ten different scans is initiated. In eachround the illuminance distribution of the lamp is scanned using the 5x5 –grid shown inFigure 3. The diameter of the measurement sites is 8 mm and corresponds to the di-ameter of the standard photometer aperture. The illuminance at the optical axis (mid-dle point) is measured for 10 seconds between the rounds for monitoring the stabilityof the lamp and the measurement system. After the sequence, the photometer is re-turned to the optical axis by the program. The program saves the date and startingtime of the measurement together with the text in the comments-field and the meas-urement data.
The measurement data is analyzed with FEL_spatial.m Matlab-function. In this functionthe measurement file should be put correctly in the given variable and nothing elseshould be changed. The function calculates the illuminance distribution correction fac-tor for each measurement round described earlier and returns the mean and standarderror of these values. Returned standard error is presented as a percentage of themean. The measurement points shown in Figure 3 with grey face colour are weightedwith the area that lies inside the 40 mm of the precision aperture. The weighting factor

Quality Manual of Lumi-nous Flux Measurements
Page 13 (23)
Version: 3.0 Date: December 2, 2014 Last edited by: TuP
is calculated geometrically when the diameters of the precision aperture and referencephotometer aperture are known. For the values 40 mm and 8 mm, respectively, theweighting factor is 0.8056 and it is calculated automatically by the Matlab-function.Measurement points with black colour are discarded.
5.3.2. Scanning of the spatial uniformity of the integrating sphere
Due to small spatial differences in the coating reflectivity of integrating spheres, thesphere surface needs to be scanned with narrow beam source. This measurement isthen used for calculating a correction factor for the case when light is input to thesphere at the reference port versus a lamp illuminating the sphere surface from inside.The scan is performed with 5° steps in sphere coordinates using a Czibula & Grund-mann sphere scanner with a white LED (Figure 4). The measurement programs andMatlab-functions used in the measurements can be found in the directory
\\work\T405\MIKES-Aalto\Quality\Photom\Luminous flux\Programs 2014\.
Figure 4. Czibula & Grundmann Sphere scanner, Luxmeter-unitand the cable to connect them between each other.
5.3.2.1 Preparations for the measurements
The scanner should never be rotated by hand!
Attach the sphere scanner firmly into the E27-socket of the integrating sphere. It ispossible to use either one of the E27-base lamp holders for this measurements, butdue to the dimensions of the scanner it is preferred to use the shorter holder meantfor measurements of DC-operated luminous flux standard lamps.
Connect the Luxmeter-unit with the scanner cable to the two wires coming from thesphere. Be sure that the polarity is correct (brown cable with red connector to the ringand white cable with black connector to the tip of the E27-base). Connect the Luxme-ter-unit to the measurement computer using a serial cable and a USB-to-Serial -

Quality Manual of Lumi-nous Flux Measurements
Page 14 (23)
Version: 3.0 Date: December 2, 2014 Last edited by: TuP
adapter. Ensure that the serial-port for the scanner is correct in the software. Run theSScan.vi program. If the controls for moving the scanner are disabled, run the “Refer-enz” -function. This initialized the scanner and defines the rotating limits of the scan-ner motors. Afterwards, the scanner will not move further than the limits. Switch onthe scanner LED, and set the current value to 700 mA from the software. The maxi-mum value for the current is 700 mA. The scan can be performed with a lower currentalso, but then the CVC gain will need to be 10^8 or higher. Leave the LED on and allowit to stabilize for at least 20 minutes.
Attach the LM-1 or LM-2 photometer to the detector port of the sphere and connect itto the power supply of its temperature controller and switch it on. Connect the pho-tometer signal cable to a Vinculum SP042 CVC, and the output of the CVC to a HP3458A DVM. Check the settings of the measurement. The sensitivity of the CVC shouldbe 10^7. Note that the instruments should be turned on for at least half an hour be-fore starting the measurement in order to avoid errors due to stabilization.
5.3.2.2 Sphere scanning software
To begin the scan, target the scanner beam to the reference port baffle inside thesphere using the MOVE H/V controls in the software. The horizontal value should be amultiple of 5° and the vertical value can be given with 0.1° precision. Normally the val-ue for the vertical angle is between 0° and 15° and between 250° and 270° for the hor-izontal. These might depend on the holder used in the sphere. Ensure also that theLED is turned on. After this, close the sphere firmly from the direction of the auxiliaryport.
Check the GPIB-address for the DVM, name your measurement file and be sure thatyou have proper path for the file. Insert values for time to wait before the first meas-urement in seconds, step size (5°), standard deviation limit (0.01 %) and number ofpower line cycles (10) for the measurement at a single point. The proposed values areshown in parentheses. Write down the names of devices used and their settings to thecomments-field for later use. If dark current measurement for the sphere is needed,turn the “DARK”-control on, this will turn the LED off and measure 100 points at 5 sec-ond intervals after the scanning sequence. When running the measurement sequence,the date and time are saved to the file together with the text from the comments field.
The measurement can be started by pressing the “Measure”-control. Measurementtakes normally around four hours, but the cycle can be aborted by pressing the “STOPMEAS” -control. At every measurement point, the mean of three consecutive readingsthat have standard deviation below the assigned limit is saved to the measurement filewith the scanner position and the standard deviation. Measurement values can bemonitored from the measurement array. After the measurement sequence has ended,move the horizontal axis to 180° and vertical to 90°. At this point the program can bestopped pressing the large red STOP-control.

Quality Manual of Lumi-nous Flux Measurements
Page 15 (23)
Version: 3.0 Date: December 2, 2014 Last edited by: TuP
Leave the scanner attached to the holder for the self-absorption measurement. Con-nect the 150 W auxiliary lamp to the Heinzinger PTN55 125-10 power supply andswitch the lamp on so that its current is 6 amperes. With this current, the sensitivityneeded for the CVC should be 10^5. Initialize the setup using the same method as forthe previous scan, preferably using the same values. Target the scanner beam again tothe reference port using the values of the first measurement. In the self-absorptionmeasurement of the scanner, its LED must be switched off. Close the sphere and leavethe AUX-lamp and the temperature of the sphere to stabilize for 2-3 hours. After this,begin the scanning sequence with the SScan.vi –program. When the LED is notswitched on, the program asks you to confirm that you really want to run the sequencewithout the scanner LED switched on. After the sequence, rotate the scanner to thehorizontal angle of 90 ° and vertical angle of 180 °. Then, stop the program and removethe scanner from the sphere. Close the sphere and let the lamp to stabilize for an hour.After this, run the program SphereAUX.vi with the same settings as the previous scanusing 50 to 200 rounds. Place the saved measurement files into the folder data andname them as self_absorption.txt and self_absorption_empty.txt. The analysis withMatlab takes these files into account, if the self-absorption correction is enabled.
5.3.2.3 Analysis of the measurement results
For analysing the measurement results, use the SScan.m Matlab-function. In the func-tion, change the measurement file name to the correct one and choose whether theself-absorption correction for the scanner should be used. After these, no more chang-es are needed.
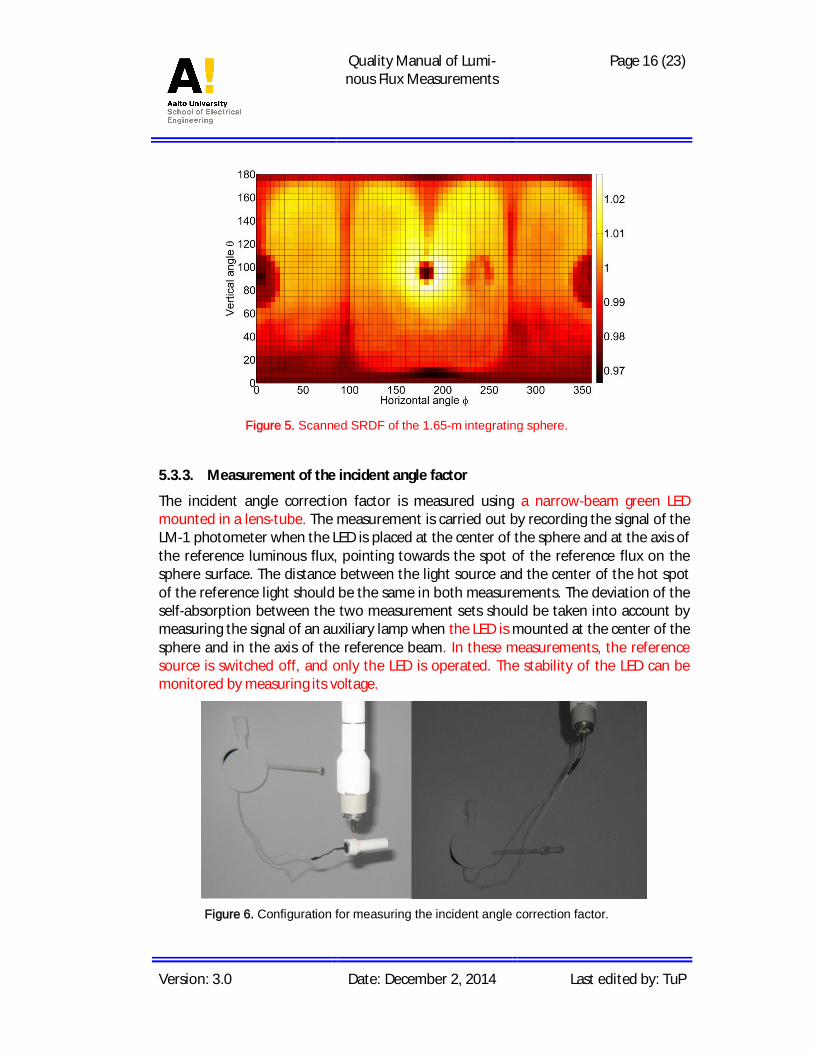
The Matlab-function parses the measurement data and modifies it for plotting the spa-tial responsivity distribution function (SRDF) of the sphere. The function subtracts thedark signal from the measured signal values, and multiplies the data with the self-absorption correction data. The output data is normalized to the measurement pointsat the bottom of the sphere. In addition, a correction is applied to the vertical anglesbecause the scanner is positioned below the center point of the sphere, when at-tached to the E27-base holder. It is possible to select, which one of the two holderswas used for the measurement. If some other holder is used, the Matlab functionneeds to be modified for that. Finally, the SRDF is calculated using equation
( , ) = ( , )
( , ), (3)
where is the horizontal angle and is the vertical angle of the measurement. Thecorrection factor ( ) used in the analysis for the external source is
= 1/ ( , ), (4)
where = 90° and = 315° correspond to the coordinates of the reference hot spot.An example of the SRDF measured for the integrating sphere is shown in Figure 5.
Quality Manual of Lumi-nous Flux Measurements
Page 16 (23)
Version: 3.0 Date: December 2, 2014 Last edited by: TuP
Figure 5. Scanned SRDF of the 1.65-m integrating sphere.
5.3.3. Measurement of the incident angle factor
The incident angle correction factor is measured using a narrow-beam green LEDmounted in a lens-tube. The measurement is carried out by recording the signal of theLM-1 photometer when the LED is placed at the center of the sphere and at the axis ofthe reference luminous flux, pointing towards the spot of the reference flux on thesphere surface. The distance between the light source and the center of the hot spotof the reference light should be the same in both measurements. The deviation of theself-absorption between the two measurement sets should be taken into account bymeasuring the signal of an auxiliary lamp when the LED is mounted at the center of thesphere and in the axis of the reference beam. In these measurements, the referencesource is switched off, and only the LED is operated. The stability of the LED can bemonitored by measuring its voltage.
Figure 6. Configuration for measuring the incident angle correction factor.

Quality Manual of Lumi-nous Flux Measurements
Page 17 (23)
Version: 3.0 Date: December 2, 2014 Last edited by: TuP
5.3.4. Spectral throughput of the integrating sphere
The spectral throughput of the sphere is determined by measuring the spectrum of aluminous flux standard lamp inside the sphere and outside of the sphere. The spectralirradiance of the lamp is first measured on an optical rail by mounting it into an auxilia-ry lamp holder with the E27 base i.e. cup of the lamp is up. The polarity of the lampused needs to be the same as in the lamp holder of the sphere. A measurement dis-tance of 0.5-1.0 m from the lamp is suitable. A baffle with an opening of 10 cm shouldbe used between the lamp and the diffuser head of the spectroradiometer for stray-light rejection. The spectral irradiance of the lamp is measured from 3 different direc-tions of the lamp using a spectroradiometer with 5-nm bandwidth, and an average ofthe measurements can be used as the spectral irradiance of the lamp Eext( ) in theanalysis. The direction can be changed by switching off the lamp, letting it cool down,and rotating the E27-base. After the irradiance measurement, the lamp is mounted inthe integrating sphere, and the spectroradiometer is used for measuring the integrat-ed spectrum int( ) of the lamp. The relative spectral throughput of the sphere T( )can then be calculated as
)()()(
ext
int
ET . (5)
In the analysis of spectral mismatch correction factors, the relative spectral throughputof the sphere is combined with the relative spectral responsivity of the photometerhead LM-1 or LM-2, used in the detector port of the sphere. The method is practicalfor analysis of spectral-mismatch corrections of photometric measurements. For color-imetric measurements with the sphere, using of a calibrated spectral radiant fluxstandard lamp should be used. More information of the characterization measure-ments and analyzing of the correction factors can be found in [4]. An example of themeasured relative spectral throughput is presented in Figure 7.
Figure 7. Relative spectral throughput of the 1.65-m integrating sphere.

Quality Manual of Lumi-nous Flux Measurements
Page 18 (23)
Version: 3.0 Date: December 2, 2014 Last edited by: TuP
6. Handling of calibration items
6.1. Safety and handling precautions
The lamps should be turned on and off slowly (30–60 seconds). The lamps shouldnot be moved while operated.
Do not touch the envelope of the external source. If there are finger prints do nottry to clean them. Before operating, the dust should be removed with soft brush orby blowing clean air. After operating, allow the lamp cool down for 2 hours beforeremoving it from the setup.
Do not touch the bulb of the internal source with bare hands. Use cotton gloveswhen mounting the lamps into the socket.
Be careful when changing the internal source between calibrations. The bulb isprobably still warm.
Be very careful when handling customer lamps. Pay attention to customer wishesconcerning lamp operation and handling.
6.2. Monitoring of luminous flux standard lampsTable 5. Calibration history of the luminous flux standard lamps.
LAMP lms9901 lms9902 lms0003 lms0004 lms0005
Current [A] 5.5380 5.6694 5.8506 5.8229 5.7338
Voltage [V] 28.812 28.849 30.133 29.603 29.326
Color temperature [K] 2721 2729 2724 2727 2716
Date Luminous flux [lm]
October 2003 2067.5 2158.5 2382.0 2317.0 2222.1
May 2005 2067.6 2162.8 2384.1 2316.7 2219.6
September 2006 2012.0 2167.8 2387.0 2322.6 2220.5
September 2008 2055.4 2162.8 2374.2 2307.2 2206.8
October 2009 2054.0 2170.7 2374.9 2304.4 2200.4
March 2012 2055.6 2172.0 2373.1 2304.4 2196.4
October 2014 2056.3 2171.6 2370.7 2302.7 2190.7
Quality Manual of Lumi-nous Flux Measurements
Page 19 (23)
Version: 3.0 Date: December 2, 2014 Last edited by: TuP
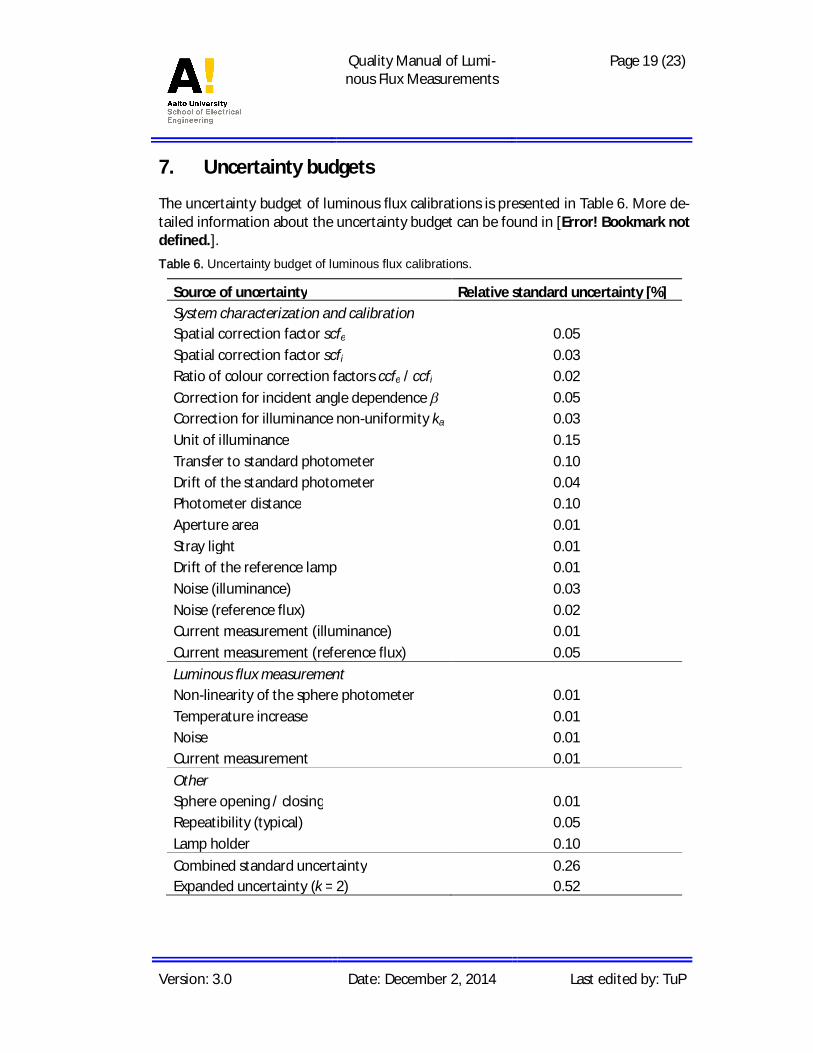
7. Uncertainty budgets
The uncertainty budget of luminous flux calibrations is presented in Table 6. More de-tailed information about the uncertainty budget can be found in [Error! Bookmark notdefined.].Table 6. Uncertainty budget of luminous flux calibrations.
Source of uncertainty Relative standard uncertainty [%]System characterization and calibrationSpatial correction factor scfe 0.05Spatial correction factor scfi 0.03Ratio of colour correction factors ccfe / ccfi 0.02Correction for incident angle dependence 0.05Correction for illuminance non-uniformity ka 0.03Unit of illuminance 0.15Transfer to standard photometer 0.10Drift of the standard photometer 0.04Photometer distance 0.10Aperture area 0.01Stray light 0.01Drift of the reference lamp 0.01Noise (illuminance) 0.03Noise (reference flux) 0.02Current measurement (illuminance) 0.01Current measurement (reference flux) 0.05Luminous flux measurementNon-linearity of the sphere photometer 0.01Temperature increase 0.01Noise 0.01Current measurement 0.01OtherSphere opening / closing 0.01Repeatibility (typical) 0.05Lamp holder 0.10Combined standard uncertainty 0.26Expanded uncertainty (k = 2) 0.52

Quality Manual of Lumi-nous Flux Measurements
Page 20 (23)
Version: 3.0 Date: December 2, 2014 Last edited by: TuP
8. Measurement of luminous efficacy
In addition to E27-base DC-operated standard lamps, it is possible to use the meas-urement facility for measurements of energy-saving lighting products, such as compactfluorescent lamps (CFLs) and solid-state lighting products (SSLs) based on light-emittingdiodes (LEDs). If E27-base 230 V lamps are to be measured, the DC-lamp holder needsto be replaced by another E27-base holder that has wiring suitable for the higher AC-voltage. For determining the luminous efficacy (lm/W) of a light source, its luminousefficacy and active power consumption need to be measured. In the measurements,the equipment used for photometric and spectral measurements remains the same, asin the measurement of DC-operated lamps, but the equipment used for power sourc-ing and measurement is different. Due to the complicated spectral and angular proper-ties of most SSLs, special care should be taken in the analysis of their spectral and spa-tial corrections. Correction methods for these have been described in detail in [11-13].
The AC-voltage of the lamps can be supplied using a regulating AC-voltage source oftype Chroma 61601 (500 VA) or Pacific 115ASXT (1500 VA). The voltage and frequencyof both devices can be programmed from the front panel of the device. In a typical lu-minous efficacy measurement, the measurement system is controlled using a Labviewprogram Luminous_Efficacy_Monitoring.vi. The program initializes all meters,measures the dark current of the photometer, ignites the lamp and monitors the stabi-lization of the luminous flux, as well as values related to the electrical power meas-urement, such as active power (W), power factor and total harmonic distortion (THD).
Figure 8. Integrating sphere facility configured for luminous efficacymeasurement of energy-saving lighting products.
For the electrical power measurement, a Yokogawa WT-1800 power analyzer is used.The device is configured with 4 measurement channels. Channels 1-3 have 5 A current
Quality Manual of Lumi-nous Flux Measurements
Page 21 (23)
Version: 3.0 Date: December 2, 2014 Last edited by: TuP
inputs with a shunt resistor size of 0.1 . Channel 4 is reserved for measurements ofhigher currents, up to 50 A, and has a shunt resistor size of 5 m . For measurementsof typical low-power energy-saving lighting products, it is recommended to use chan-nel 1 with the 5 A current input.
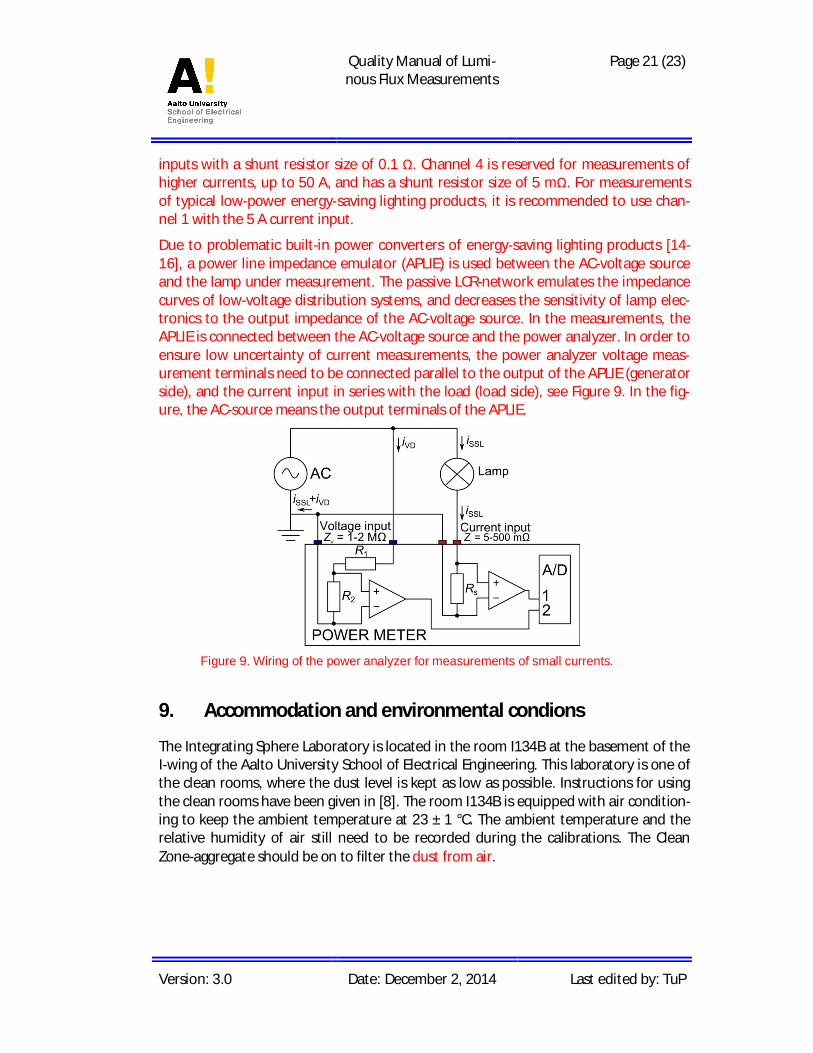
Due to problematic built-in power converters of energy-saving lighting products [14-16], a power line impedance emulator (APLIE) is used between the AC-voltage sourceand the lamp under measurement. The passive LCR-network emulates the impedancecurves of low-voltage distribution systems, and decreases the sensitivity of lamp elec-tronics to the output impedance of the AC-voltage source. In the measurements, theAPLIE is connected between the AC-voltage source and the power analyzer. In order toensure low uncertainty of current measurements, the power analyzer voltage meas-urement terminals need to be connected parallel to the output of the APLIE (generatorside), and the current input in series with the load (load side), see Figure 9. In the fig-ure, the AC-source means the output terminals of the APLIE.
Figure 9. Wiring of the power analyzer for measurements of small currents.
9. Accommodation and environmental condions
The Integrating Sphere Laboratory is located in the room I134B at the basement of theI-wing of the Aalto University School of Electrical Engineering. This laboratory is one ofthe clean rooms, where the dust level is kept as low as possible. Instructions for usingthe clean rooms have been given in [8]. The room I134B is equipped with air condition-ing to keep the ambient temperature at 23 ± 1 °C. The ambient temperature and therelative humidity of air still need to be recorded during the calibrations. The CleanZone-aggregate should be on to filter the dust from air.

Quality Manual of Lumi-nous Flux Measurements
Page 22 (23)
Version: 3.0 Date: December 2, 2014 Last edited by: TuP
10. Control data
The usage of the luminous flux standard lamps is monitored by using a logbook. Thelogbook is kept in the same closet with the lamps. Each lamp has its own sheet withthe following columns: date, user, burn start time, burn stop time, total burning timeso far and base voltage. The measurement data coming from the calibrations and de-velopment of the equipment are archived.
The measurement notes (date, setup, raw data) are written down in a brown envelope“Photometric Measurements and Calibrations”. The measurement data, both raw andanalyzed, are stored in the author’s computer. The names of the data files are writtenon the measurement notes. The data is organized by creating a folder for each cus-tomer.
11. Certificates
Calibration certificates are handled according to [9]. The following information needsto be included in the certificate:
Ambient temperature and relative humidity.
Luminous flux of the standard lamp with corresponding operating current and basevoltage.
Burning time of the lamp during the calibration and total burning time after thecalibration if the information is available.
12. Intercomparisons
The latest international comparisons of the unit of luminous flux:
2000: Comparison of luminous flux units with NIST (USA) [10]
Level of agreement 0.06 % with an expanded uncertainty (k = 2) of 1.01 %.
2003: Comparison of luminous flux units with SP (BIPM calibration in 2001)
Level of agreement 0.16 % with an expanded uncertainty (k = 2) of 1.10 %.
2008: Luminous Flux EURAMET.PR.-K4 Key-Comparison
Level of agreement 0.03 % with an expanded uncertainty (k = 2) of 0.76 %.
13. Publications
[1] Quality Manual of Luminous Intensity Laboratory

Quality Manual of Lumi-nous Flux Measurements
Page 23 (23)
Version: 3.0 Date: December 2, 2014 Last edited by: TuP
[2] Quality Manual of Spectral Irradiance Measurements
[3] Ohno Y., “Detector-based luminous-flux calibration using the Absolute In-grating-Sphere Method”, Metrologia, 35, 473-478 (1998)
[4] Hovila J., “Characterisation of the national measurement standard of lu-minous flux”, Master’s Thesis (2001) (In Finnish)
[5] J. Hovila, P. Toivanen, E. Ikonen, “Realization of the unit of luminous fluxat the HUT using the absolute integrating-sphere method,” Metrologia41, 407-413 (2004).
[6] MRI calibration schedule: http://metrology.hut.fi/quality/Calsched.pdf
[7] Instruction Manual for Operating Standard Lamps
[8] Puhdastilaohjeet / Clean room instructions
[9] http://metrology.hut.fi/quality/AnnexD.pdf (instructions for writing cali-bration certificates)
[10] Hovila J., Toivanen P., Ikonen E., Ohno Y., “International comparison ofthe illuminance responsivity scales and units of luminous flux at the HUT(Finland) and the NIST (USA)”, Metrologia, 39, 219-223 (2002)
[11] T. Pulli, ”Energiansäästölamppujen valotehokkuuden mittaaminen, ” B.Sc.thesis, Aalto University, 34 p. (2010). In Finnish
[12] T. Pulli, “Goniospektrometri ledien karakterisointiin”, Optisen teknologianerikoistyö, Aalto-University, 37 p. (2011). In Finnish
[13] T. Poikonen, T. Pulli, A. Vaskuri, H. Baumgartner, P. Kärhä and E. Ikonen, ”Luminous efficacy measurement of solid-state lamps,” Metrologia 49S135–S140 (2012).
[14] A. Vaskuri, “Energiansäästölamppujen sähköiset karakterisoinnit,” B.Sc.thesis, Aalto University, 44 p. (2011). In Finnish
[15] T. Koskinen, “Sähköverkon impedanssin vaikutus energiansäästölamppu-jen valotehokkuuden mittauksissa, “ M.Sc. thesis, Aalto University, 63 p.(2013).
[16] T. Poikonen, T. Koskinen, H. Baumgartner, P. Kärhä, and E. Ikonen, ”Ad-justable power line impedance emulator for characterization of energy-saving lamps,” In Proc. NEWRAD 2014, Espoo, Finland (2014).