quality of experience of hand controller latency in a
TRANSCRIPT
Quality of Experience of hand controller latency in a Virtual Reality simulator Kjell Brunnströma,b, Elijs Dimab, Mattias Anderssonb, Mårten Sjöströmb, Tahir Qureshi c Mathias Johansond aRISE AB, Acreo, Kista, Sweden bMid Sweden University, Sundsvall, Sweden cHIAB, Hudiksvall, Sweden dAlkit Communications AB, Mölndal, Sweden
Abstract
In this study, we investigate a VR simulator of a forestry crane used for loading logs onto a truck, mainly looking at Quality of Experience (QoE) aspects that may be relevant for task completion, but also whether there are any discomfort related symptoms experienced during task execution. A QoE test has been designed to capture both the general subjective experience of using the simulator and to study task performance. Moreover, a specific focus has been to study the effects of latency on the subjective experience, with regards to delays in the crane control interface. A formal subjective study has been performed where we have added controlled delays to the hand controller (joystick) signals. The added delays ranged from 0 ms to 800 ms. We found no significant effects of delays on the task performance on any scales up to 200 ms. A significant negative effect was found for 800 ms added delay. The Symptoms reported in the Simulator Sickness Questionnaire (SSQ) was significantly higher for all the symptom groups, but a majority of the participants reported only slight symptoms. Two out of thirty test persons stopped the test before finishing due to their symptoms.
Introduction Virtual and augmented reality (VR, AR) are emerging
technologies for assisting or solving real world industrial problems. We consider in this case immersive techniques, where the user is visually interacting with the physical environment using Head-Mounted Displays (HMD), also popularly denoted “VR goggles”. Potentially this will imply that workers will be using such goggles for extended periods of time; not only the same day, but most likely each working day for a long time. Therefore, the quality related issues are crucial, not only because they are tied to performance and task completion, but also because of the well-being of the worker.
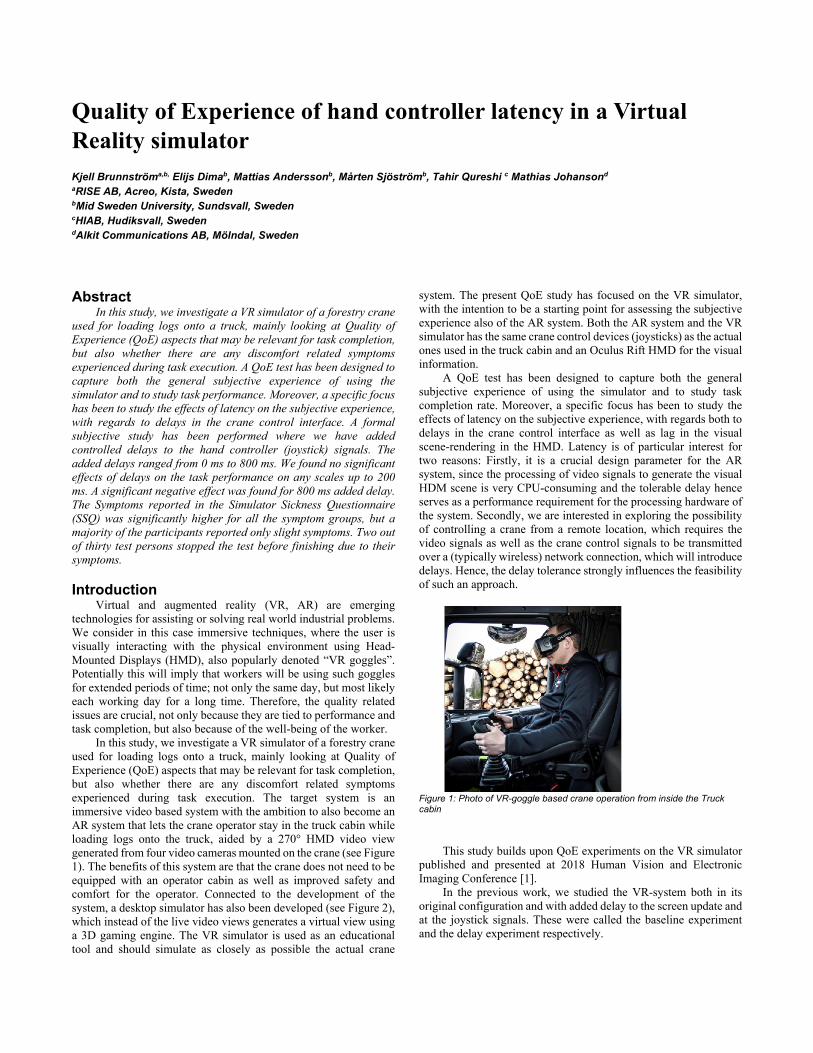
In this study, we investigate a VR simulator of a forestry crane used for loading logs onto a truck, mainly looking at Quality of Experience (QoE) aspects that may be relevant for task completion, but also whether there are any discomfort related symptoms experienced during task execution. The target system is an immersive video based system with the ambition to also become an AR system that lets the crane operator stay in the truck cabin while loading logs onto the truck, aided by a 270° HMD video view generated from four video cameras mounted on the crane (see Figure 1). The benefits of this system are that the crane does not need to be equipped with an operator cabin as well as improved safety and comfort for the operator. Connected to the development of the system, a desktop simulator has also been developed (see Figure 2), which instead of the live video views generates a virtual view using a 3D gaming engine. The VR simulator is used as an educational tool and should simulate as closely as possible the actual crane
system. The present QoE study has focused on the VR simulator, with the intention to be a starting point for assessing the subjective experience also of the AR system. Both the AR system and the VR simulator has the same crane control devices (joysticks) as the actual ones used in the truck cabin and an Oculus Rift HMD for the visual information.
A QoE test has been designed to capture both the general subjective experience of using the simulator and to study task completion rate. Moreover, a specific focus has been to study the effects of latency on the subjective experience, with regards both to delays in the crane control interface as well as lag in the visual scene-rendering in the HMD. Latency is of particular interest for two reasons: Firstly, it is a crucial design parameter for the AR system, since the processing of video signals to generate the visual HDM scene is very CPU-consuming and the tolerable delay hence serves as a performance requirement for the processing hardware of the system. Secondly, we are interested in exploring the possibility of controlling a crane from a remote location, which requires the video signals as well as the crane control signals to be transmitted over a (typically wireless) network connection, which will introduce delays. Hence, the delay tolerance strongly influences the feasibility of such an approach.
Figure 1: Photo of VR-goggle based crane operation from inside the Truck cabin
This study builds upon QoE experiments on the VR simulator published and presented at 2018 Human Vision and Electronic Imaging Conference [1].
In the previous work, we studied the VR-system both in its original configuration and with added delay to the screen update and at the joystick signals. These were called the baseline experiment and the delay experiment respectively.

The baseline study showed that most people are more or less pleased with the VR-system and that it does not have strong effect on any symptoms as listed in the SSQ. There is some room for improvement since all scales were not above Good (> 4 on a scale from 1-5). For instance, the Picture Quality had only a MOS of 3.6.
In the delay study we found significant effects on Comfort Quality and Immersion Quality for higher Display delay (≥ 30 ms), but very small impact of Joystick delay. Furthermore, the Display delay had strong influence on the symptoms in the SSQ, as well as causing test subjects to decide to discontinue the experiment; this effect was found to be connected to longer added Display delays (≥ 20 ms).
In this study we would like to more thoroughly explore the small impact on the Joystick delay. Maybe it was just too short and could not be perceived well by the test subjects. We have therefore followed up with an experiment having a larger range of delays, ranging from 0 ms to 800 ms added delay.
Background Augmented Telepresence
To highlight the focus and the direction of our work we are using the term Augmented Telepresence (AT) to denote applications where high-quality video-mediated communication is the enabling technology, but where additional data can be superimposed on or merged with the video as in Augmented Reality. It is not yet a commonly used term, but has been used by a few authors [2, 3].
AT is similar to augmented reality in that it tries to present additional information on top of the view seen by the user. It primarily differs from augmented reality in that the user is present in a remote location seeing the augmented view, but may also include the case were a two-way audio and/or audio-visual communication is being retained at the same time with the user seeing the augmented view.
Quality of Experience Quality of Experience (QoE) is the degree of delight or
annoyance of the user of an application or service. It results from the fulfillment of his or her expectations with respect to the utility and/or enjoyment of the application or service in light of the user’s personality and current state, as defined by EU Cost Action 1003 Qualinet [4] and standardized by the International Telecommunication Union (ITU)[5]. A comprehensive overview of the field can be found in the recent QoE book by Möller and Raake [6].
The above definition of QoE, which is also pointed out by Möller and Raake [6], goes beyond the traditional QoE and Quality of Service (QoS) research and then makes a clear overlap with the User Experience (UX) research tradition. These two fields originate from two different research traditions and communities i.e. Telecommunication and Human Computer Interaction respectively. The QoE community is still in the process of embracing some of the more user-centric and UXlike methods.
Traditionally, in the QoE research, the methods to gain insight into the delivered quality of a service and the users’ experience of it have been done through controlled laboratory experiments, where the opinions of panels of users have been collected. The results are reported in Mean Opinion Scores (MOS). These methods are very often referred to as subjective quality assessment methods and there are standardized ways of conducting them e.g. for visual quality, ITU-R Rec. BT.500-13[7] or ITU-T Rec. P.910[8]. These methods have been criticized for not providing enough ecological validity
[9]. Improvements have been done for example in ITU-T Rec. P.913[10]. The intensive investigations into 3D video quality a few years ago, when the 3D TV hype was the most intense, have now resulted in new Recommendations from the ITU [11-13]. It was discovered that if care was not taken, several user experience issues such as discomfort and visual fatigue may occur. The Recommendations give some guidance on how to minimize these. An attempt to build an experimental framework for QoE of AR was made by Puig et al. [14] who advocate a combination of subjective assessment (e.g. questionnaires, subjective ratings) and objective measurements (e.g. task completion time, error rates). They only presented the results from a pilot study, so it still needs to be experimentally confirmed whether the framework gives scientifically reproducible results and if it can be extended to AT.
Now we are in the early stages of large-scale deployment of fully immersive environments e.g. Oculus Rift, PS4 VR, or HTC Vive. Furthermore, the development of 5G will give higher bandwidth, and more importantly, low latency mobile networks. This means that we are now facing low latency immersive environments on a large scale, meaning that it is of utmost importance to understand the user experience issues connected to it. New types of interaction, especially those of a highly immersive nature, will put new demands on the correct way of designing the user environment. Therefore, increased efforts should be allocated to understanding the QoE for not inducing a negative perceived user experience, discomfort or even simulator sickness. Furthermore, low latency can enable services and applications with an intensive interaction component such as gaming or remote control of professional equipment, which will increase the load on the user. Although such research has been ongoing for some time, the technical development and increasing availability of immersive low latency user environments make research more urgent.
Related work This section presents some related work that deals with
measuring quality of experience of VR-simulators in different perspectives and involving visual and/or haptic delay.
Debattista et al. [15] presented a subjective evaluation of high fidelity virtual environments for driving simulations. The evaluation was based on 44 participants; providing them access to the real world and a purpose-built representative virtual environment with graphics quality settings of low, medium and high. The study concluded that graphics quality affects the perceived fidelity of visual and overall experience. However, the study was limited to only judging graphics quality in three fixed states and the authors acknowledge the complexity of the visual simulator.
Strazdins et al. [16] studied virtual reality in the context of gesture recognition for deck operation training. Since existing simulators used only keyboards and joysticks for getting input, the authors developed a prototype of gesture recognition system and performed their study on 15 people. The study concluded that improving video quality affects the user experience positively; better quality improved score from 3.63 to 4.83 on a scale from to 5. However, participants’ self-assessment score, measuring how well they performed, was 3.7 on 5 scale. It is worth mentioning that the study was performed on students with no actual crane operation experience.
Suznjevic et al. [17] compared the QoE of two different VR-goggle technologies i.e. Oculus Rift and HTC Vive in a pick-and-place task. They found a slight advantage for the HTC Vive.
Jay et al. [18] studied delay in haptic and visual feedback in collaborative virtual environments. They found the latency in visual
feedback had a strong influence on the haptic task performance. They studied the effect on task requiring continuous haptic and visual exchange between participants to acquire a target.
Jay and Hubbold [19] investigated if visual and/or haptic delay influenced task performance in reciprocal tapping tasks. They found that the haptic delay had low influence, but the visual delay and combined delay had considerable impact.
Knörlien et al. [20] studied the influence of visual and haptic delay on stiffness perception in AR. They found that haptic delay decreased stiffness perception whereas visual delay increased it.
Our work is unique in the sense that the simulator provides the experience of the same real-world scenario, as the simulator is a digital clone of an actual product commercially available on the market. In addition to this, the study includes participants from both academia and industry.
Method In this article, we present a larger formal subjective study with
the VR-system where we have added controlled delay to the joystick signals to study the QoE of the experienced latency in performing the task of loading logs on to a truck.
Procedures for the formal test Test subjects were invited to perform a log-loading task in the
VR simulator. The set-up is shown in Figure 2. They were asked to read the instructions, which explained the task to perform. The description on how to operate the crane in the simulator was given briefly verbally and the test subjects were instructed to first test all controls individually in a dedicated training session to get an understanding on how to operate the crane. The test subjects were not required to have any previous experience in real truck crane operation, but all participants did understand this quickly when trying in the training session.
In the instructions, the following was pointed out: “For some people, an immersive simulator may give some discomfort or nausea. If you want to stop and not finish the test you can do it at any time without giving a reason. All the data that are gathered during the test will be treated and analysed strictly anonymously. We do not keep record on who is participating in the test that can be connected to the data.”
We collected a written informed consent form, which was signed by all participants before starting the test.
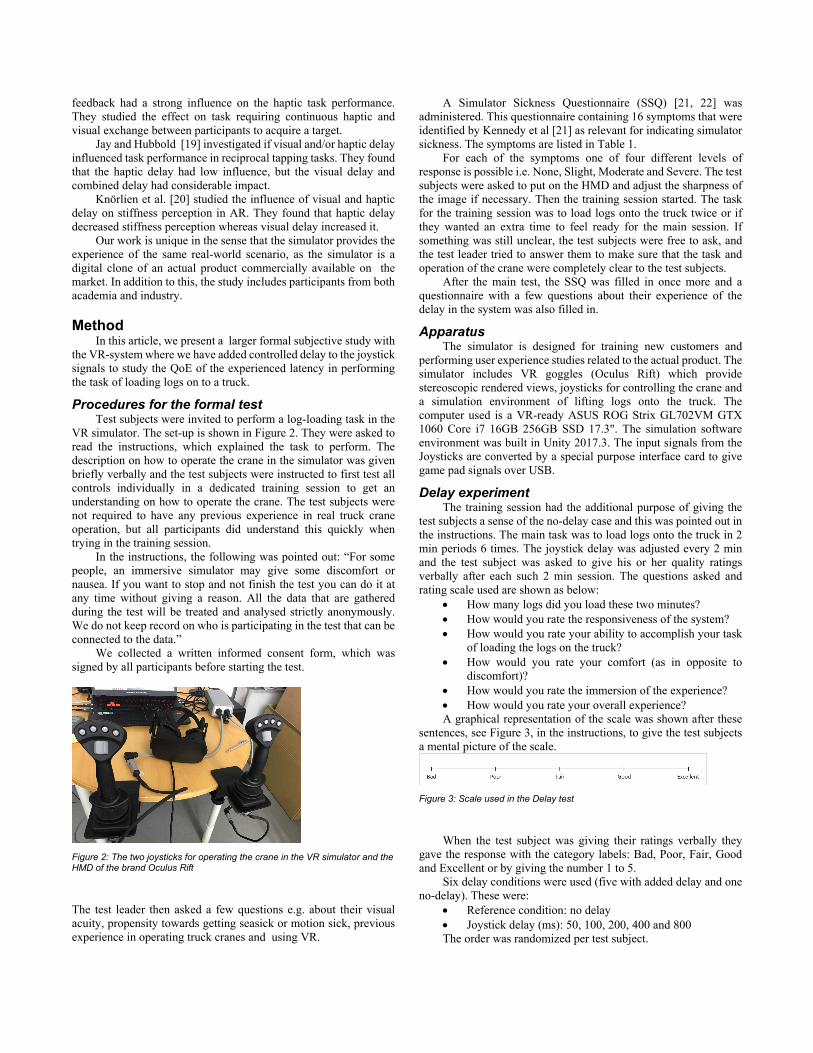
Figure 2: The two joysticks for operating the crane in the VR simulator and the HMD of the brand Oculus Rift
The test leader then asked a few questions e.g. about their visual acuity, propensity towards getting seasick or motion sick, previous experience in operating truck cranes and using VR.
A Simulator Sickness Questionnaire (SSQ) [21, 22] was administered. This questionnaire containing 16 symptoms that were identified by Kennedy et al [21] as relevant for indicating simulator sickness. The symptoms are listed in Table 1.
For each of the symptoms one of four different levels of response is possible i.e. None, Slight, Moderate and Severe. The test subjects were asked to put on the HMD and adjust the sharpness of the image if necessary. Then the training session started. The task for the training session was to load logs onto the truck twice or if they wanted an extra time to feel ready for the main session. If something was still unclear, the test subjects were free to ask, and the test leader tried to answer them to make sure that the task and operation of the crane were completely clear to the test subjects.
After the main test, the SSQ was filled in once more and a questionnaire with a few questions about their experience of the delay in the system was also filled in.
Apparatus The simulator is designed for training new customers and
performing user experience studies related to the actual product. The simulator includes VR goggles (Oculus Rift) which provide stereoscopic rendered views, joysticks for controlling the crane and a simulation environment of lifting logs onto the truck. The computer used is a VR-ready ASUS ROG Strix GL702VM GTX 1060 Core i7 16GB 256GB SSD 17.3". The simulation software environment was built in Unity 2017.3. The input signals from the Joysticks are converted by a special purpose interface card to give game pad signals over USB.
Delay experiment The training session had the additional purpose of giving the
test subjects a sense of the no-delay case and this was pointed out in the instructions. The main task was to load logs onto the truck in 2 min periods 6 times. The joystick delay was adjusted every 2 min and the test subject was asked to give his or her quality ratings verbally after each such 2 min session. The questions asked and rating scale used are shown as below:
• How many logs did you load these two minutes? • How would you rate the responsiveness of the system? • How would you rate your ability to accomplish your task
of loading the logs on the truck? • How would you rate your comfort (as in opposite to
discomfort)? • How would you rate the immersion of the experience? • How would you rate your overall experience? A graphical representation of the scale was shown after these
sentences, see Figure 3, in the instructions, to give the test subjects a mental picture of the scale.
Figure 3: Scale used in the Delay test
When the test subject was giving their ratings verbally they gave the response with the category labels: Bad, Poor, Fair, Good and Excellent or by giving the number 1 to 5.
Six delay conditions were used (five with added delay and one no-delay). These were:
• Reference condition: no delay • Joystick delay (ms): 50, 100, 200, 400 and 800 The order was randomized per test subject.

Analysis
Scale analysis The scale responses were given numerical values when
analyzed using the following: Bad = 1, Poor = 2, Fair = 3, Good = 4 and Excellent = 5. The instructions showed a graphical representation of the scales with equal distances between the categories. It was also pointed out in writing in the instructions. We have, therefore, assumed that we can analyze the scales as interval scales. The mean opinion scores (MOS) were calculated from the scale responses of the test subjects.
For this study comparisons and statistical test between involved conditions were done for the performance measure and for each scale separately. In this case 6x5/2 =15 comparisons.
The statistical analysis has been performed by first applying a repeated measures Analysis of Variance (ANOVA) and then a post-hoc analysis based on Tukey Honestly Significant Difference (HSD)[23, 24].
SSQ analysis The questionnaire answers were translated into a number in our
case by None = 0, Slight = 1, Moderate = 2, Severe = 3 for allowing parametric statistical analysis
Kennedy et al. (1993) [7] suggested a statistical analysis for the SSQ by grouping the different symptoms into three groups: Nausea (N), Oculomotor (O) and Disorientation (D). They also calculated a total score (TS). The Nausea symptom group contained the symptoms nausea, stomach awareness, increased salivation and burping. The Oculomotor grouped eyestrain, difficulty focusing, blurred vision, and headache. The symptom group Disorientation included the symptoms dizziness and vertigo. They are not completely disjoint since a few of the variables are used when calculating the scores in more than one group e.g. nausea and difficulty concentrating. In Table 1 it is indicated which of the symptoms that are grouped together. The calculation is done by adding together the values with a 1 in Table 1 and then multiply that sum with factors at the bottom of the table, using the conversion between severity and numbers described below.
Table 1: SSQ score calculations as described in Kennedy et al. (1993)[21]
Weight SSQ Symptoms N O D 1 General Discomfort 1 1 2 Fatigue 1 3 Headache 1 4 Eye Strain 1 5 Difficulty Focusing 1 1 6 Increased Salivation 1 7 Sweating 1 8 Nausea 1 1 9 Difficulty Concentrating 1 1 10 Fullness of Head 1 11 Blurred Vision 1 1 12 Dizzy (Eyes Open) 1 13 Dizzy (Eyes Closed) 1 14 Vertigo 1 15 Stomach Awareness 1 16 Burping 1 Total [1] [2] [3]
𝑁𝑁 = [1] × 9.54 𝑂𝑂 = [2] × 7.58 𝐷𝐷 = [3] × 13.92 𝑇𝑇𝑇𝑇 = ([1] + [2] + [3]) × 3.74
After the symptom scores have been calculated. The mean over the test subjects were calculated for the SSQ administered before the experiment and for the SSQ administered after the experiment.
The number of interesting comparisons performed were between each symptom group before and after, which is in total four comparisons. This gives with α = 0.05 p ≤ 0.0125 as the significance level. Here the statistical test was also performed with a one-tailed dependent T-test for paired samples.
Results Delay experiment
The Delay experiment was conducted at RISE Acreo’s lab in Kista, Sweden. No particular control of the environment was done for this experiment, other than keep it quiet from disturbing noises and at temperature that was comfortable. 31 test subjects participated in the test, 22 males and 9 females, with a mean age of 39 where the youngest participants was 22 and the oldest 64. They were recruited from RISE Research Institutes of Sweden AB in Kista and made up of a variety of staff, visiting researchers and students. None of the test subjects was experienced in operating a real truck crane. Some had some experience in using VR-systems and some had participated in one of our previous studies. The visual statuses of the test subjects were self-reported. No problems with performing the task was reported due to poor vision. Some of the test subject wore their glasses while using the HMD.
Two test subjects aborted the test and did not complete all test conditions. The reason to stop was discomfort and nausea. The test leader was present during the entire test and could monitor and also give feedback to test subjects whether to continue or not if they felt discomfort or nausea. In two cases, the recommendation to test subjects was to stop. The ratings given up to the point of stopping have been included in the analysis. In all cases the SSQ were filled in for these test subjects, so these scores have been included in the analysis.
The result of the number of logs loaded by test subjects are shown in Figure 4. The height of the bars shows the mean number and the error bars indicates 95% confidence intervals. Striped bars indicate significantly different mean number of logs. A repeated measures ANOVA shows a significant main effect of delay on the number of logs loaded, F(5, 140)=6.3948, p=0.00002. A Tukey HSD post-hoc test reveals that the significance comes from the 800 ms delay case is significantly different from all the other cases i.e. 0 ms (p = 0.000094), 50 ms (p = 0.00027), 100 ms (p = 0.000036), 200 ms (p = 0.0017) and 400 ms (p = 0.0028).
In Figure 5 we can see the MOS of the Responsiveness Quality as the height of the bars and ordered along the x-axis with increasing added Joystick delay. Striped bars indicate significantly different MOS. A repeated measures ANOVA shows a significant main effect of delay on Responsiveness Quality, F(5, 140)=18.288, p=0.00000. Based on Tukey HSD all the MOS 0 to 400 ms were significantly different from 800 ms. All of them had p = 0.000020.
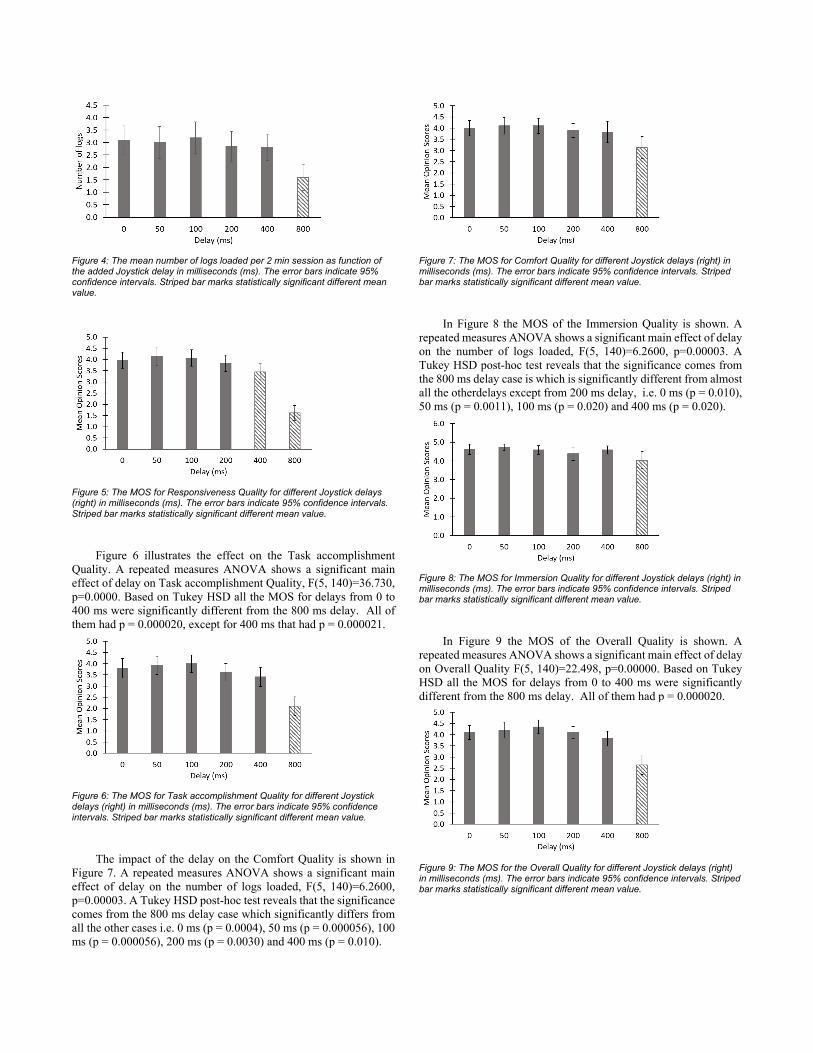
Figure 4: The mean number of logs loaded per 2 min session as function of the added Joystick delay in milliseconds (ms). The error bars indicate 95% confidence intervals. Striped bar marks statistically significant different mean value.
Figure 5: The MOS for Responsiveness Quality for different Joystick delays (right) in milliseconds (ms). The error bars indicate 95% confidence intervals. Striped bar marks statistically significant different mean value.
Figure 6 illustrates the effect on the Task accomplishment Quality. A repeated measures ANOVA shows a significant main effect of delay on Task accomplishment Quality, F(5, 140)=36.730, p=0.0000. Based on Tukey HSD all the MOS for delays from 0 to 400 ms were significantly different from the 800 ms delay. All of them had p = 0.000020, except for 400 ms that had p = 0.000021.
Figure 6: The MOS for Task accomplishment Quality for different Joystick delays (right) in milliseconds (ms). The error bars indicate 95% confidence intervals. Striped bar marks statistically significant different mean value.
The impact of the delay on the Comfort Quality is shown in Figure 7. A repeated measures ANOVA shows a significant main effect of delay on the number of logs loaded, F(5, 140)=6.2600, p=0.00003. A Tukey HSD post-hoc test reveals that the significance comes from the 800 ms delay case which significantly differs from all the other cases i.e. 0 ms (p = 0.0004), 50 ms (p = 0.000056), 100 ms (p = 0.000056), 200 ms (p = 0.0030) and 400 ms (p = 0.010).
Figure 7: The MOS for Comfort Quality for different Joystick delays (right) in milliseconds (ms). The error bars indicate 95% confidence intervals. Striped bar marks statistically significant different mean value.
In Figure 8 the MOS of the Immersion Quality is shown. A repeated measures ANOVA shows a significant main effect of delay on the number of logs loaded, F(5, 140)=6.2600, p=0.00003. A Tukey HSD post-hoc test reveals that the significance comes from the 800 ms delay case is which is significantly different from almost all the otherdelays except from 200 ms delay, i.e. 0 ms (p = 0.010), 50 ms (p = 0.0011), 100 ms (p = 0.020) and 400 ms (p = 0.020).
Figure 8: The MOS for Immersion Quality for different Joystick delays (right) in milliseconds (ms). The error bars indicate 95% confidence intervals. Striped bar marks statistically significant different mean value.
In Figure 9 the MOS of the Overall Quality is shown. A repeated measures ANOVA shows a significant main effect of delay on Overall Quality F(5, 140)=22.498, p=0.00000. Based on Tukey HSD all the MOS for delays from 0 to 400 ms were significantly different from the 800 ms delay. All of them had p = 0.000020.
Figure 9: The MOS for the Overall Quality for different Joystick delays (right) in milliseconds (ms). The error bars indicate 95% confidence intervals. Striped bar marks statistically significant different mean value.

The SSQ analysis for the delay revealed large increase in the symptom levels (Figure 10), all of which were statistically significant i.e. < 0.0125; where Nausea had p = 0.00024, Oculomotor p = 0.000014, Disorientation (p = 0.000022) and the Total Score p = 0.0000063). However, one test subject reported symptoms on Severe level (highest in the SSQ) and he/she also stopped the test. In this analysis all test subjects were included, even those not finishing the main session.
Figure 10: Simulator Sickness Questionnaire (SSQ) scores for the delay experiment, where the left (medium grey) bars represent the symptom levels before the experiment and the right (striped bars indicating statistically significant difference) bars the symptom levels after the experiment. The different symptom groups along the x-axis are: Nausea (N), Oculomotor (O), Disorientation (D) and the Total Score (TS). The error bars indicate 99% (left) confidence intervals.
Comparison with experienced log lifters To investigate whether the results obtained is different if the
test subjects have extensive experience in operating truck cranes, we let seven experienced truck crane operators perform the experiment as well. We reduced the number of scales to rate after each 2 min period, in order to make the test a bit quicker for this group, otherwise the experiment was performed as before. The questions then asked after each 2 min period were:
• How many logs did load these two minutes? • How would you rate the responsiveness of the system? • How would you rate your ability to accomplish your task
of loading the logs on the truck? In Figure 11, the mean number of logs are shown, and it can be
observed that the mean is distinctly higher, which would be expected. It can also be observed that the overall impact is the same, in that the results are very similar up to and including 400 ms but then drops drastically for 800 ms.
The rated experiences for the Responsiveness Quality (Figure 12) and the Task accomplishment Quality (Figure 13) shows similar trends as for the unexperienced test subject, with clearly lower rating for the 800 ms case. It may be noted that for the experienced test persons the drop for 400 ms slighty deeper, although this is very uncertain due the few numbers of experienced test subjects.
Figure 11: The mean number of logs loaded by the experienced log lifting test subjects per two min session as function of the added Joystick delay in milliseconds (ms).
Figure 12: The MOS for Responsiveness Quality for different Joystick delays (right) in milliseconds (ms) rated by the experienced log lifting test subjects.
Figure 13: The MOS for Task accomplishment Quality for different Joystick delays (right) in milliseconds (ms) rated by the experienced log lifting test subjects.

The SSQ results are also inline with what was obtained for the unexperienced test subjects, see Figure 14.
Figure 14: Simulator Sickness Questionnaire (SSQ) scores for the delay experiment, where the left (medium grey) bars represent the symptom levels before the experiment and the right (light grey) bars the symptom levels after the experiment for the experienced log lifting test subjects. The different symptom groups along the x-axis are: Nausea (N), Oculomotor (O), Disorientation (D) and the Total Score (TS).
Discussion This study was motivated by the small statistically non-
significant effects observed in our previous study[1], for the impact on the added Joystick delay. Earlier studies have shown that impact of delay on task performance is very task dependent, see e.g. [18, 19]. Furthermore, test subject may not always clearly identify the delay as the source of the problem, as has been shown in telemeeting applications [25]. It can be noticed in the ratings from the test subject that several inversions exist i.e. that a test subject has rated lower quality of case with shorter delay compared to the case with longer delay e.g. the zero added delay case has been rated sometimes as low as the 800 ms case.
The result presented here corroborates previous finding about insensitivities of hand controller latency. For a Telesurgery application, Rayman et al. [26] found that a set of robotic laparoscopic tasks could be performed at latencies up to 400 ms without significantly affecting task performance, and that simple tasks were possible to perform with a high level of accuracy with delays as high as 800 ms. Kim and Ryu [27] studied a haptic teleoperation task at different visual and haptic delays. Their results show that task performances were largely unaffected for delays below 200 ms, and that lower haptic delays were preferable to synchronized visual and haptic delays. For all scales and the number of logs loaded it is only for the longest delay there is a clear effect i.e. 800 ms. This may be largely dependent on this particular task. However, if humans were very sensitive to this type and easily disturbed by it, larger effects should have been observed at shorter added delays, which is in line with the observation that both the experienced and the unexperienced test subjects react in a similar way.
The SSQ show a significant increase of symptoms. The SSQ score included all participants even those that stopped. Overall, this test did not seem to betoo strenuous for most people to be able to complete. However, there are some that are very sensitive, in this case 2 out of 30 participants.
It is known from the operation of the real crane system that the crane operators are normally very good in compensating for a bit of delay in the crane controls, which are the Joysticks in this study. It is therefore reasonable to assume that also novice operators can manage to compensate for some delay when operating the crane.
Conclusions In this study, we found no significant effects of delays on the
task performance (number of logs loaded) or on any scales up to 200 ms. Very weak effects were found for 400 ms, it was only found significantly lower in responsiveness quality. A strong significant effect was found for 800 ms added delay, being significantly lower for the number of logs and for all scales against all the other delays (except in one case). It seems as if the delays need to become at least about half a second to be clearly noticeable and disturbing for this type of task. Although the group of experienced log lifting test subjects is relatively small, it supports the findings of the unexperienced group to be just applicable to the unexperienced test subjects, but seems to apply more generally.
The symptoms reported in the Simulator Sickness Questionnaire were significantly higher for all the symptom groups, but most reported just slight symptoms, a few also moderate and just one a severe symptom. Also, for the SSQ the results were very similar for both the unexperienced and experienced group. Two out of thirty test persons stopped the test prematurely due to their symptoms. Thus, most of test persons were fine using the VR-simulator, but a few seem to be very sensitive.
Acknowledgement The economic support from the Knowledge Foundation (grant
nr 20160194) is hereby gratefully acknowledged.
References [1]. Brunnström, K., M. Sjöström, M. Imran, M. Pettersson, and M.
Johanson. Quality of Experience for a Virtual Reality simulator. in Human Vision and Electronic Imaging 2018. 2018. Burlingame, California USA, 28 Jan. - 2 Feb, 2018 Society for Imaging Science and Technology.
[2]. Okura, F., M. Kanbara, and N. Yokoya. Augmented Telepresence Using Autopilot Airship and Omni-directional Camera. in IEEE International Symposium on Mixed and Augmented Reality 2010. 2010. Seoul, Korea: IEEE Xplore. p. 259-260.
[3]. Saxena, V.V., T. Feldt, and M. Goel. Augmented Telepresence as a Tool for Immersive Simulated Dancing in Experience and Learning. in The India HCI 2014 Conference on Human Computer Interaction 2014. ACM New York, NY, USA. p. 86-89, DOI: 10.1145/2676702.2676708.
[4]. Le Callet, P., S. Möller, and A. Perkis. (2012). Qualinet White Paper on Definitions of Quality of Experience (2012). European Network on Quality of Experience in Multimedia Systems and Services (COST Action IC 1003) (Version 1.2 (http://www.qualinet.eu/images/stories/QoE_whitepaper_v1.2.pdf)): Lausanne, Switzerland.
[5]. ITU-T. (2017). Vocabulary for performance, quality of service and quality of experience (ITU-T Rec. P.10/G.100). International Telecommunication Union (ITU), ITU Telecommunication Standardization Sector: Place des Nations, CH-1211 Geneva 20.
[6]. Möller, S. and A. Raake, Quality of Experience - Advanced Concepts, Applications and Methods. T-Labs Series in Telecommunication Services. 2014, Switzerland: Springer International Publishing.
[7]. ITU-R. (2012). Methodology for the subjective assessment of the quality of television pictures (ITU-R Rec. BT.500-13). International Telecommunication Union, Radiocommunication Sector.
[8]. ITU-T. (1999). Subjective video quality assessment methods for multimedia applications (ITU-T Rec. P.910). International Telecommunication Union, Telecommunication standardization sector.
[9]. De Moor, K., M. Fiedler, P. Reichl, and M. Varela. (2015). Quality of Experience: From Assessment to Application (Dagstuhl Seminar 15022) (DOI: 10.4230/DagRep.5.1.57 (http://drops.dagstuhl.de/opus/volltexte/2015/5036/)). DROPS (Dagstuhl Online Publication Service).
[10]. ITU-T. (2014). Methods for the subjective assessment of video quality, audio quality and audiovisual quality of Internet video and distribution quality television in any environment (ITU-T Rec. P.913). International Telecommunication Union, Telecommunication standardization sector.
[11]. ITU-T. (2016). Display requirements for 3D video quality assesment (ITU-T Rec. P.914). International Telecommunication Union.
[12]. ITU-T. (2016). Information and guidelines for assessing and minimizing visual discomfort and visual fatigue from 3D video (ITU-T Rec. P.916). International Telecommunication Union.
[13]. ITU-T. (2016). Subjective assessment methods for 3D video quality (ITU-T Rec. P.915). International Telecommunication Union.
[14]. Puig, J., A. Perkis, F. Lindseth, and T. Ebrahimi. Towards an efficient methodology for evaluation of quality of Experience in augmented reality. in Fourth International Workshop on Quality of Multimedia Experience (QoMEX 2012). 2012. Melbourne, Australia: IEEE Xplore. p. 188-193.
[15]. Debattista, K., T. Bashford-Rogers, C. Harvey, B. Waterfield, and A. Chalmers, Subjective Evaluation of High-Fidelity Virtual Environments for Driving Simulations. IEEE Transactions on Human-Machine Systems, 2018. 48(1): p. 30-40, DOI: 10.1109/THMS.2017.2762632.
[16]. Strazdins, G., B.S. Pedersen, H. Zhang, and P. Major. Virtual reality using gesture recognition for deck operation training. in OCEANS 2017 - Aberdeen. 2017.
[17]. Suznjevic, M., M. Mandurov, and M. Matijasevic. Performance and QoE assessment of HTC Vive and Oculus Rift for pick-and-place tasks in VR. in 2017 Ninth International Conference on Quality of Multimedia Experience (QoMEX). 2017.
[18]. Jay, C., M. Glencross, and R. Hubbold, Modeling the effects of delayed haptic and visual feedback in a collaborative virtual environment. ACM Trans. Comput.-Hum. Interact., 2007. 14(2): p. 8, DOI: 10.1145/1275511.1275514.
[19]. Jay, C. and R. Hubbold. Delayed visual and haptic feedback in a reciprocal tapping task. in First Joint Eurohaptics Conference and Symposium on Haptic Interfaces for Virtual Environment and Teleoperator Systems. World Haptics Conference. 2005.
[20]. Knorlein, B., M.D. Luca, and M. Harders. Influence of visual and haptic delays on stiffness perception in augmented reality. in 2009 8th IEEE International Symposium on Mixed and Augmented Reality. 2009.
[21]. Kennedy, R.S., N.E. Lane, K.S. Berbaum, and M.G. Lilienthal, Simulator Sickness Questionnaire: An Enhanced Method of Quantifying Simulator Sickness. The International Journal of Aviation Psychology, 1993. 3(3): p. 203-220.
[22]. Brunnström, K., K. Wang, S. Tavakoli, and B. Andrén, Symptoms analysis of 3D TV viewing based on Simulator Sickness Questionnaires. Quality and User Experience, 2017. 2(1): p. 1-15, DOI: 10.1007/s41233-016-0003-0.
[23]. Maxwell, S.E. and H.D. Delaney, Designing experiments and analyzing data : a model comparison perspective. 2nd ed. 2003, Mahwah, New Jersey, USA: Lawrence Erlbaum Associates, Inc.
[24]. Brunnström, K. and M. Barkowsky, Statistical quality of experience analysis: on planning the sample size and statistical significance testing. Journal of Electronic Imaging, 2018. 27(5): p. 11, DOI: 10.1117/1.JEI.27.5.053013.
[25]. ITU-T. (2016). Telemeeting assessment - Effect of delays on telemeeting quality (ITU-T Rec. P.1305). International Telecommunication Union, Telecommunication standardization sector.
[26]. Rayman, R., S. Primak, R. Patel, M. Moallem, R. Morady, M. Tavakoli, V. Subotic, N. Galbraith, A. Van Wynsberghe, and K. Croome, Effects of Latency on Telesurgery: An Experimental
Study. 2005, Springer Berlin Heidelberg. p. 57-64, DOI: 10.1007/11566489_8.
[27]. Kim, Y. and J. Ryu. Performance analysis of teleoperation systems with different haptic and video time-delay. in 2009 ICCAS-SICE. 2009.
Author Biography Kjell Brunnström, Ph.D., is a Senior Scientist at Acreo Swedish ICT AB and Adjunct Professor at Mid Sweden University. He is an expert in image processing, computer vision, image and video quality assessment having worked in the area for more than 25 years. Currently, he is leading standardization activities for video quality measurements as Co-chair of the Video Quality Experts Group (VQEG). His current research interests are in Quality of Experience for visual media in particular video quality assessment both for 2D and 3D, as well as display quality related to the TCO requirements.
Mårten Sjöström received the M.Sc. degree in electrical engineering and applied physics from Linköping University, Sweden, in 1992, the Licentiate of Technology degree in signal processing from KTH, Stockholm, Sweden, in 1998, and the Ph.D. degree in modeling of nonlinear systems from EPFL, Lausanne, Switzerland, in 2001. He was an Electrical Engineer with ABB, Sweden, from 1993 to 1994, was a fellow with CERN from 1994 to 1996. He joined Mid Sweden University in 2001, and was appointed an Associate Professor and a Full Professor in Signal Processing in 2008 and 2013, respectively. He has been the Head of the Computer and System Sciences with Mid Sweden University since 2013. He founded the Realistic 3-D Research Group in 2007. His current research interests are within multidimensional signal processing and imaging, as well as system modeling and identification.
Elijs Dima received his B.Sc. and M.Sc. degrees in Computer Engineering from Mid Sweden University, Sweden, in 2013 and 2015, and his Lic. degree in 2018. Since 2015, he has been a researcher, lab supervisor, teaching assistant and Ph.D. student in the Realistic 3D research group at Mid Sweden University. His research interests include 360-degree video and light field capture, rendering and streaming, parallel data processing, and the synchronization, calibration, modeling, and development of Virtual Reality, Agumented Reality and multi-camera systems.
Mattias Andersson received the M.Sc. in Applied Physics and Electrical Engineering in 1998, the Licentiate of Technology in Media Technology in 2004 and the PhD in Media Technology, all from Linköping University in 2006. He then worked in commercial and industrial life as with computer vision, multispectral imaging and color appearance. He joined Mid Sweden University in 2011 and is currently working as a research engineer. His current research interests include multidimensional imaging and augmented reality.
Tahir Qureshi got his Ph.D. from the Royal Institute of Technology 2012 researching on model-based development as the main research area. He worked on architecture centric approach for developing automotive embedded systems. From Jan 2013 Dr Qureshi is working at HIAB AB as a research manager on embedded systems.
Mathias Johanson, Ph.D., is R&D manager at Alkit Communications AB and an expert on video-mediated communication and distributed collaborative environments. His research interests also include automotive telematics and e-health systems and services.