quality of life indicators comprehensive report - … · 2015-06-29 · 2012 quality of life...
TRANSCRIPT
Quality of Life Indicators
Comprehensive Report Centre for Social Impact
2012
Note: This document is in draft form
Quality of Life Indicators Comprehensive Report: City of Ryde
2
Table of Content Table of Content .......................................................................................................................................... 2 About this Report ......................................................................................................................................... 4 Approach, Methodology and Scope .............................................................................................................. 6 Benchmarking .............................................................................................................................................. 9 Spheres of Council Influence ......................................................................................................................10 Limitations of the Study ...............................................................................................................................11 Key Discussion Issues ................................................................................................................................12
Key issue: A sustainable local economy ..................................................................................................12 Key theme: Housing Options ...................................................................................................................13 Key theme: Healthy Communities ............................................................................................................14 Key theme: Community participation and leadership ................................................................................15
Geography, Demographics and Population .................................................................................................18 Location, key features and formal boundaries ..........................................................................................18 Population, family and households ..........................................................................................................19 Demographic change ..............................................................................................................................22
A City of Liveable Neighbourhoods .............................................................................................................25 Introduction .............................................................................................................................................25 Key indicator: Dwelling and tenure characteristics....................................................................................26 Key indicator: Housing affordability ..........................................................................................................30 Key indicator: Housing stress ..................................................................................................................35 Key indicator: Public and community housing and homelessness ............................................................39 Key indicator: Incidence of crime .............................................................................................................41 Key indicator: Alcohol-related crime and domestic violence .....................................................................44 Key indicator: Victims of crime .................................................................................................................46 Key indicator: Children at risk and child protection ...................................................................................48 Discussion ...............................................................................................................................................51
A City of Wellbeing......................................................................................................................................53 Introduction .............................................................................................................................................53 Key indicator: Self-reported health ...........................................................................................................54 Key indicator: Life expectancy .................................................................................................................56 Key indicator: Mortality rates....................................................................................................................58 Key indicator: Health-related behaviours and risk factors .........................................................................61 Key indicator: Mental health.....................................................................................................................64 Key indicator: People with a disability ......................................................................................................66 Key indicator: Infant mortality and child health .........................................................................................69 Key indicator: Fertility rate .......................................................................................................................73 Key indicator: Carers and aged care ........................................................................................................74 Key indicator: Social participation ............................................................................................................77 Discussion ...............................................................................................................................................79
A City of Prosperity .....................................................................................................................................80 Introduction .............................................................................................................................................80 Key indicator: SEIFA ...............................................................................................................................82 Key indicator: Dependency ratio ..............................................................................................................84 Key indicator: Average income and incidence of low income ....................................................................86 Key indicator: Financial stress and depth of deficient income ...................................................................89 Key indicator: Labour force participation ..................................................................................................92 Key indicator: Local employment and employing businesses ...................................................................95 Key indicator: Businesses and employment industries .............................................................................97 Key indicator: Unemployment and labour underutilisation ......................................................................100 Key indicator: Employment of older workers ..........................................................................................103 Key indicator: Long-term unemployment and income support ................................................................105 Key indicator: Jobless households and children in jobless households ...................................................107 Discussion .............................................................................................................................................109
A City of Environmental Sensitivity ............................................................................................................110 Introduction ...........................................................................................................................................110 Key indicator: Air quality ........................................................................................................................112

Quality of Life Indicators Comprehensive Report: City of Ryde
3
Key indicator: Energy use, climate change and carbon abatement .........................................................115 Key indicator: Climate, temperature and rainfall .....................................................................................118 Key indicator: Water use and conservation ............................................................................................121 Key indicator: Waste and recycling ........................................................................................................123 Key indicator: Biodiversity ......................................................................................................................126 Key indicator: Urban green spaces ........................................................................................................128 Key indicator: Importance of and satisfaction with green spaces ............................................................131 Discussion .............................................................................................................................................133
A City of Connections ...............................................................................................................................134 Introduction ...........................................................................................................................................134 Key indicator: Transport options and public transport .............................................................................135 Key indicator: Private motor vehicle travel..............................................................................................138 Key indicator: Transport safety ..............................................................................................................140 Key indicator: Access to the internet and IT ...........................................................................................143 Discussion .............................................................................................................................................145
A City of Harmony and Culture ..................................................................................................................146 Introduction ...........................................................................................................................................146 Key indicator: Preschool attendance and childcare ................................................................................147 Key indicator: Early childhood development ...........................................................................................149 Key indicator: Child literacy and numeracy.............................................................................................152 Key indicator: Education participation and retention ...............................................................................154 Key indicator: Youth Engagement ..........................................................................................................158 Key indicator: Post-school qualifications ................................................................................................160 Key indicator: Library use ......................................................................................................................163 Key indicator: Ryde’s culturally and linguistically Diverse (CALD) community .........................................165 Key indicator: Level of spoken English ...................................................................................................167 Key indicator: Participation in work and learning in culturally and linguistically diverse (CALD) communities .............................................................................................................................................................169 Key indicator: Participation in cultural, recreational and leisure activities ................................................172 Discussion .............................................................................................................................................175
A City of Progressive Leadership ..............................................................................................................177 Introduction ...........................................................................................................................................177 Key indicator: Influencing decision-makers ............................................................................................178 Key indicator: Occupation and skills.......................................................................................................181 Key indicator: Community Services........................................................................................................183 Key indicator: Volunteering ....................................................................................................................186 Discussion .............................................................................................................................................189
Abbreviations ............................................................................................................................................190 Glossary ...................................................................................................................................................191

Quality of Life Indicators Comprehensive Report: City of Ryde
4
About this Report
This report was prepared by the Centre for Social Impact for the City of Ryde Council. It looks at a suite of
social and community indicators, or quality of life indicators, to provide a picture of community wellbeing in
Ryde. The social indicator approach is useful for addressing challenging and complex community problems
with rigor and clarity. Indicators chosen are supported by secondary data from a variety of sources including;
federal, state and local government data, as well as information collected by not-for-profit organisations and
academic institutions.
Data collected for the chosen indicators were mostly at the Local Government Area (LGA) level. However, in
instances where LGA-level data was unavailable, wider collection areas were investigated to draw on a
wider range of indicators and as a result provide a more complete picture of Ryde’s community wellbeing.
Similarly, this would allow Council and stakeholders to use this research as a guide to pursue data at a local
level for the purpose of monitoring further progress in these areas.
The indicators have been divided using the City of Ryde’s seven outcome areas. These are:
Liveable Neighbourhoods
Wellbeing
Prosperity
Environmental Sensitivity
Connections
Harmony and Culture
Progressive Leadership
During the course of this research, several key themes emerged as significant for Ryde. These key themes
form the following chapters in the report:
A sustainable local economy
Housing options
Healthy communities
Community participation and leadership

Quality of Life Indicators Comprehensive Report: City of Ryde
5
This report presents data on indicators that are relevant to understanding the above themes, and are
intended to form a useful evidence base for community engagement and discussion on how to enhance
community wellbeing in Ryde, now and into the future.

Quality of Life Indicators Comprehensive Report: City of Ryde
6
Approach, Methodology and Scope
The City of Ryde is a vibrant and diverse area to live and work. With a flourishing local economy and
connections within and to other parts of metropolitan Sydney, there are many opportunities for the people of
Ryde. Set between the Parramatta and Lane Cove Rivers, Ryde is fortunate to have a variety of natural
landscapes, beautiful parks, scenic waterways and areas of historical significance. To ensure all Ryde
residents benefit from these opportunities and attributes, there are some social challenges in the area that
need to be understood and addressed in an evidence-based manner. This report uses the lens of social
inclusion to examine the health of the community in Ryde.
Social inclusion is a broad concept that captures many aspects of individual and community life. A socially
inclusive community values all of its members. In such a community, all have the opportunity to participate
fully in life and in society (Australian Social Inclusion Board 2009).
This report will consider a number of areas that contribute to social inclusion, namely:
Connectivity
Prosperity
Liveable neighbourhoods
Wellbeing
Harmony and culture
Environmental sensitivity
Progressive leadership
These chapters align with the outcomes framework of the City of Ryde 2021 Community Strategic Plan.
The emphasis on social inclusion also supports and values organisations and individuals working together to
build a better community. It fosters policy approaches and programs that are coordinated and
complementary rather than focussing on a single issue in isolation. This report follows this logic by
presenting a range of indicators which, individually, highlight particular aspects of social inclusion but which,
when considered together, provide a much more comprehensive picture of social inclusion.
This report employs an indicator-based framework to address the issue of social inclusion in Ryde. Social
indicators measure social issues with quantitative statistics that can be tracked over time. Social indicators
provide a useful summary of important aspects of social inclusion, in a way that is accessible both to policy
makers and the general public. This approach allows the study to be evidence-based, while still capturing the

Quality of Life Indicators Comprehensive Report: City of Ryde
7
multifarious and inter-related nature of social inclusion, and also allows community engagement in policy
making and achieving results. At the same time, it is also possible within this approach to identify and
highlight problem areas. Moreover, employing a carefully-chosen set of indicators allows consideration of
outputs, outcomes and processes as well as inputs (Saunders 2003).
The indicator approach has been used in previous studies of social inclusion of varying scopes and
purposes. These studies are useful in establishing a set of reliable and accepted indicators of social
inclusion that are available on a suitable scale and are comparable over time:
Australian Social Inclusion Board (2009). A Compendium of Social Inclusion Indicators.
Commonwealth of Australia, Canberra.
Centre for Social Impact (forthcoming). Awareness for Action: Parramatta. Centre for Social Impact,
Sydney.
Community Foundations of Canada (2010). Vital Signs. Community Foundations of Canada, Ontario.
Haski-Leventhal, D., Lyons, M. and Adams, S. (2009). The Common Cause Report into Sydney’s
key social issues. United Way and the Centre for Social Impact, Sydney.
Community Indicators Victoria (2006). Measuring Wellbeing: Engaging Communities. VicHealth,
Melbourne
Vinson, T. (2007). Dropping off the Edge: The distribution of disadvantage in Australia. Jesuit Social
Services and Catholic Social Services, Melbourne.
Informed by these resources, this report groups the indicators in a format that is suitable for integration with
the City of Ryde 2021 Community Strategic Plan. This includes chapters related to connections; prosperity;
liveable neighbourhoods; wellbeing; harmony and culture; environmental sensitivity; and progressive
leadership. Each chapter includes an array of indicators, as well as a discussion of some of the key themes
identified through the research. This structure allows individual issues to be isolated, as well as examining
themes between indicators and chapters.
The indicators in this report are supported by secondary data analysis. The project uses official data sources
and information collected by other stakeholders involved in the process of improving social inclusion. Some
of these sources include:
Australian Bureau of Statistics, including the 2006 Census of Population and Housing, NSW In
Focus and the Sydney Social Atlas;
Publication and reports by governmental departments (both national and NSW) as well as reports
from the City of Ryde;
Reports from independent and not-for-profit, organisations;

Quality of Life Indicators Comprehensive Report: City of Ryde
8
Academic studies;
Other reputable data online and in print form.
Data was collected for each indicator, and where possible this was specific for the City of Ryde.
Comparisons with other areas are useful in understanding the information contained in each indicator. This
report includes comparisons with four neighbouring LGAs: City of Canada Bay (to the south, across the
Parramatta river), Parramatta City (to the west), Hornsby Shire (north-west) and Ku-ring-gai (north-east).

Quality of Life Indicators Comprehensive Report: City of Ryde
9
Benchmarking Where possible and appropriate, the indicators presented in this report have been benchmarked so that
those reading it can quickly assess Ryde’s performance in the context of a number of frameworks. These
are:
Ryde’s performance in relation to the goals identified in the City of Ryde 2021 Community Strategic
Plan; and
Ryde’s performance on key goals identified in the NSW State Plan.
For each identified indicator, Ryde is compared with the above-mentioned LGAs. To do this, the least
performing comparator LGA’s score is placed at 0 on the scale, and the best performing LGA’s score at 100.
Ryde’s score is placed on this scale to provide a relative score. Ryde’s score is also compared to either
NSW or Sydney’s Statistical Division (SD) score, depending on the available data, to produce a second
relative score. These two relative scores are averaged to create an overall relative score between 1 and 100.
To provide a headline assessment, Ryde’s comparative performance on each assessable indicator is rated
as one of the following:
Very Good (81-100)
Good (61-80)
Average (40-60)
Fair (20-39)
Poor (0-19)
While this comparison allows readers to make a rapid assessment of Ryde’s performance, it is important to
keep in mind that for such indicators to be properly understood, each indicator needs to be fully explored, as
there are often complex factors underlying the results of each indicator that cannot be appreciated through
glancing at a rating. This understanding is vital to help Ryde achieve the goals identified in the Community
Strategic Plan, many of which contribute to the progress of NSW.

Quality of Life Indicators Comprehensive Report: City of Ryde
10
Spheres of Council Influence As the level of government closest to its people, the City of Ryde recognises it has a major responsibility to
deliver a wide range of services and programs that contribute to community wellbeing. For those policy
areas that it is not directly responsible, local government realises it has a leadership role in developing
partnerships, influencing, advocating and lobbying for the activities of other agencies to be directed toward
achieving community wellbeing.
This report presents key indicators that provide a valuable measure on a range of complex and challenging
policy areas that impact community wellbeing. The idea of utilising community indicators is that they
measure issues of relevance to the community, regardless of whether Council has direct responsibility.
There are a number of policy areas in this report where it may be appropriate for Council to take some kind
of (new or ongoing) action. This may entail direct action (such as provision of services or programs) or
indirect activities (such as lobbying other levels of government, undertaking advocacy, or supporting the
activities of other stakeholders).
On the other hand, there could be indicators for which the most appropriate response by Council could be to
monitor any changes that occur as part of the general goal of maintaining awareness and understanding the
conditions and experiences in the local community.
Indicated in the figure below, the City of Ryde 2021 Community Strategic Plan is concerned with the full
range of issues that impact the wellbeing of the City and its communities. The indicators in this report have
been identified to demonstrate the spheres of influence local government has on each of the policy areas.
These spheres are represented by the following figure.
Adapted from the Community Strategic Planning Indicators Resource (2011). Division of Local Government (DLG) of the NSW
Department of Premier and Cabinet.
I N T E R E S T

Quality of Life Indicators Comprehensive Report: City of Ryde
11
Limitations of the Study There are limitations to the research methods employed in this study. Primarily, this study has been affected
by limited data availability. In particular, collection areas for some data sources vary considerably. While
preference has been given to data collected in the LGA of the City of Ryde, data limitations required the
inclusion of some statistics based on alternative geographical areas. This has included the Northern Sydney
Area, the North Sydney and Central Coast area, Sydney and sometimes even NSW. The relevant location
for each statistic is clearly indicated in the report.
Information broken down into smaller areas has been possible through the 2006 Census data collected by
the Australian Bureau of Statistics. Data from this resource is reliable and detailed; however, as this
information is nearly five years old the relevance of these statistics may be limited. Attempts have been
made to update these figures, but often this is only possible on a larger scale (i.e. for Sydney SD or for
NSW). A major concern in relying on 2006 data is the failure of these statistics to capture the ramifications of
the turbulence of the global economic slowdown that commenced in 2008. Deteriorating economic conditions
will have impacts not only in the area of prosperity, specifically in the areas of income, employment and
unemployment, but also across the range of other indicators, including housing affordability, financial
stressors and education, and even health, well-being and participation. To develop a more accurate picture
of social inclusion in Ryde it is important that these indicators are updated with the data from the 2011
Census, collected in 2011 and released from mid-2012 onwards.
Secondary data collection alone does not allow any progressive statistical analysis to be performed, and
restricts the reporting of statistically significant differences and correlations for the indicators. This was
mainly due to a lack of access to raw and standardised data across the key areas; however, secondary data
analysis facilitates wide coverage of issues in a relatively short period of time. Some indicators have also
relied on averages for the purposes of comparisons over time, and between areas. Averages can be
inaccurate, as they can be skewed by outlying figures. In addition, averages fail to capture the spread and
diversity of results.

Quality of Life Indicators Comprehensive Report: City of Ryde
12
Key Discussion Issues
Some key issues have emerged from the social and community indicators presented in this report. The first
key theme focuses on understanding and articulating the future of the local Ryde economy. Secondly, the
adequacy and affordability of housing options for current and future residents is considered. Next, the key
theme of supporting healthy communities and discouraging unhealthy behaviour is presented. The final key
theme is a consideration of community participation and social engagement in Ryde.
One of the key issues across all parts of this report and these discussion points are the implications of the
demographic changes predicted to affect Ryde in the coming decades. This demographic change may have
many potential ramifications, and some of these consequences are discussed throughout the key issues
below.
Key issue: A sustainable local economy The qualified workforce of Ryde have enjoyed excellent employment opportunities in recent years. While
lower than some neighbouring areas, wage earners in Ryde earn more than the average income across
Sydney, and income distribution is relatively even. Unemployment rates are low and more stable than
neighbouring areas, whilst participation levels are relatively high. Local employment ratios show that the
local area is an employment hub, particularly for skilled workers, with many local jobs and increased
numbers of businesses entering the area rather than leaving it. A strong local economy has also contributed
to good quality education in Ryde, and low levels of crime. Generally, residents in Ryde are well-educated,
engaged in the workforce, and earn adequate incomes.
In addition, Ryde has excellent connections within the LGA and to Sydney. Ryde is an employment hub and
easily accessible to the Sydney CBD. Future transport investments seem likely to further consolidate links
between Ryde, Sydney and other suburbs. This may be demonstrated by the decrease in cars per person
and the higher take-up of public transport. Forecasts suggest, however, that the increase in jobs growth to
2026 may not match the increase in workers in Ryde.
How sustainable is Ryde’s current local economy?
Age forecasts (as summarised by the dependency ratio forecasts) clearly identify an ageing trend in Ryde in
the next two decades, indicating that the area will soon face losing a large part of the economically
productive population. While employment participation rates of older people in the Lower Northern Sydney
region are slightly higher than that of Sydney, this is unlikely to counteract the burden of losing an
experienced workforce, as well as the increasing demands in terms of economic resources, health costs and
maintaining local community services. In addition, the rate of older people claiming an aged pension in Ryde
is higher than some neighbouring areas.
Quality of Life Indicators Comprehensive Report: City of Ryde
13
Can the current levels of prosperity continue, given an ageing population in Ryde? How can we
reduce the potential impact of an ageing population?
There are also indications of complexity in economic opportunities across Ryde. The suburb of Macquarie
Park has a unique profile, with concentrations of both commerce and industry (through the Macquarie Park
Employment Area) and large institutions (Macquarie University). The existence of these institutions has been
attributable to a unique demographic profile within the suburb such as; 40.3% of the population within this
suburb is aged between 20-35 years, compared with 23.1% for the rest of Ryde. Despite being a source of
economic activity and prosperity, the area has experienced some indicators associated with disadvantage,
including higher unemployment and lower levels of home ownership and purchasing. These indicators all
point to the complexity of economic and prosperity patterns across Ryde.
What are some of the patterns of economic prosperity across Ryde? What are the implications
of this complexity?
Key theme: Housing options A dramatic increase in average house prices is evidence of the popularity and desirability to live in the City
of Ryde. Median sales prices in Ryde in June 2010 increased by 32.3% in a 12 month period, leap-frogging
both Hornsby and Canada Bay to become the second highest of comparator LGAs. Purchasing affordability
has been a priority for the federal government recently, with two initiatives (Housing Affordability Fund and
the First Home Buyers Grant) aimed at improving the options for home purchasers. In the period following
the boost to the first home-buyers grant increase, median prices increased in all LGAs; however those in
Ryde dramatically outpaced the other markets and prevailed, even after the withdrawal of the boost
payment. Many households are paying considerably high mortgages, with limited options for affordable
home purchasing options for those with moderate to very low incomes. Other ‘executive belt’ areas
experience similar tight home purchase markets.
Is it important to encourage a variety of purchasers into Ryde’s housing market through
addressing affordability? What is the profile of residents likely to be if affordability continues to
deteriorate in the area? Is this desirable?
Rental stress is also a significant and persistent problem in Ryde. The scale of rental stress among very low,
low and medium income households is greater than for home purchasing, and affordable rental stock options
are limited. Rental stress is particularly significant among single person households, couples with children
and single parents. Rental affordability has also been the target of federal government policy through the

Quality of Life Indicators Comprehensive Report: City of Ryde
14
National Rental Affordability Scheme and the National Partnership Agreement on Social Housing. These
policies have seen significant investments in expanding affordable rental options as well as in social housing
options; however both are soon due to expire.
Should addressing rental stress and rental affordability be priorities in Ryde? Is public policy an
important instrument for expanding housing affordability and reducing rental stress, and what are
complementary community-based initiatives for public policy?
The predominant housing type in Ryde is medium density, these include: semi-detached, row, terrace,
townhouse, villas, in addition to flats and apartments in blocks of 1 or 2 storeys, as well as flats attached to
houses. Population forecasts predict a dramatic increase in lone person households as well as an ageing
population in Ryde, particularly amongst people aged between 65 to 74 years. Fewer aged care places are
available (per 1,000 population) in Ryde compared to some neighbouring areas. The majority of aged care
places are in high-level residential care, supplemented by low-level residential care and community care
places. Older people with a profound or severe disability tend to live in the community, more so than those
that do not live in the community.
What will be the housing demands of an ageing population and of more lone person
households? How will the available housing options in Ryde accommodate these predicted
demographic changes?
Key theme: Healthy communities Ryde has a significant proportion of the population living with a profound or severe disability that is slightly
higher than the Sydney average; however, data analysis also identifies a relatively low percentage (9.6%) of
the adult population to be considered as a carer for a person with a disability. This indicates that the burden
on carers in Ryde is higher than most neighbouring areas. Of the total population living in Ryde 1.8% were
older people with a profound or severe disability who were living in the community. A relatively large
proportion of younger people with a profound or severe disability in Ryde do not live in the community.
How can we support people with a disability, and their carers, in our community?
The Ryde community is surrounded by an endowment of many natural resources and environmental assets;
they also have access to many additional green spaces in neighbouring LGAs. Ryde residents value their
parks, open spaces and bushland highly, and record high levels of satisfaction with them. There are 122
exercise and sport services and 253 health and accessibility services available to them.
Quality of Life Indicators Comprehensive Report: City of Ryde
15
Despite these assets and strengths, many residents make lifestyle choices that put their wellbeing at risk.
Just over half of the NSW population engage in sport and recreational physical activity, with females less
likely to participate than males. Amongst the population of Ryde, 32.1 % are considered physically inactive:
this rate is higher than neighbouring LGAs. Only 37.3% of males and 45.4% of females are within a healthy
weight range, with one in three adults being overweight and an additional 16% classified as obese. 12.9% of
Ryde residents reported to have fair or poor health.
What actions can the community of Ryde take to reduce the effects of adverse health
behaviours? How can we further connect residents to the natural resources available to them?
The indicators also show that young people have high rates of risk taking behaviour and poor lifestyle
choices. The current rate of smokers in Ryde remains high, particularly for young males, yet it remains lower
than the Sydney average and some comparative LGAs. A low proportion of adults consume alcohol at
harmful levels to their health, however young males are at increased risk of hospitalisation due to
significantly high levels of alcohol related behaviours. A low proportion of young adults consume adequate
fruit and vegetables each day.
How can we address the risk taking behaviours of young people in Ryde, and increase their
uptake of good nutrition and physical activity?
It is also important to frame this issue in the context of the future population profile of Ryde. The trend of an
ageing population in Ryde could place increasing demands on the health care system. There are also some
indications of reduced participation levels amongst the older population in activities such as sporting events,
as well as an increased likelihood of older people self-reporting their health as fair or poor.
How do we ensure that green spaces and leisure facilities are accessible to older people to
promote their continued health?
Key theme: Community participation and leadership As education levels increase and income levels remain high, most residents in Ryde may be considered to
be economically secure. These factors have been associated with greater levels of civic participation (Wilson
2000). Nonetheless, taking a broad perspective on community participation, there is a mixed picture of
participation and engagement across Ryde:
Quality of Life Indicators Comprehensive Report: City of Ryde
16
16.8% of adults in Ryde spent time volunteering.
18.3% of the population in NSW participate in civic and political groups and 29.0% felt able to have a
say within the community on important issues all or most of the time.
There are 382 hobby, club and further education services in Ryde.
Ryde residents are more actively engaged in recycling (the relative proportion of recycling compared
to landfill has been increasing in Ryde has been increasing since 2003).
Nearly one-quarter of Ryde’s population provides unpaid child-care and 9.6% of adults care for
people with a disability.
While many of these rates are increasing, and can be higher than averages across the Sydney SD,
participation is lower than some neighbouring areas, such as Hornsby Shire and Ku-ring-gai. Moreover, each
of these indicators suggests only a minority of the population actively participate in the community, implying
that there is scope for increased levels of community engagement.
The significance of these social indicators becomes more pronounced in the context of the forecast future
population in Ryde. Lone person households are forecast to increase dramatically over the next 20 years
(an increase of 43.8% between 2007 and 2027), becoming the predominant household type in Ryde at
around 2019. People living in lone person households can be socially isolated; and some form of community
participation can represent an important source of socialisation and contribution to a community that benefits
both the community, as well as the individual involved.
Is it important to ensure the community participation of the emerging demographic group of lone
person households? If they are at risk of social exclusion, how do we ensure they maintain their
social relationships and community involvement?
Moreover, Ryde is subject to an ageing population. Not only do people over the age of 55 years participate
at greater levels in voluntary work, but they also contribute an invaluable source of experience, social capital
and leadership skills. This demographic shift provides enormous potential for continued development of
community engagement, social and professional skills as well as social capital to Ryde. Across NSW,
however, this age group feels least able to influence and guide decision-makers and are less likely to
participate in social activities.
How best may Ryde leverage the skills, experience and social capital of an ageing population?

Quality of Life Indicators Comprehensive Report: City of Ryde
17
Limitations to data availability and collection directly impact the conclusions that can be drawn from
indicators of community participation and social engagement. Many indicators in these areas are collected
for large areas (e.g. Northern Sydney or NSW) rather than by LGA, or smaller regions. Much of the data is
out dated (i.e. from 2006) and infrequently updated. It is also challenging to measure the outcomes and
impacts of investments in the community (such as community services), so there is a reliance on measures
of inputs. Having said this, there is much scope for expanding knowledge of these issues through capturing
additional data.
How can we obtain more detailed, relevant and reliable data on community participation and
social engagement?
Quality of Life Indicators Comprehensive Report: City of Ryde
18
Geography, Demographics and Population
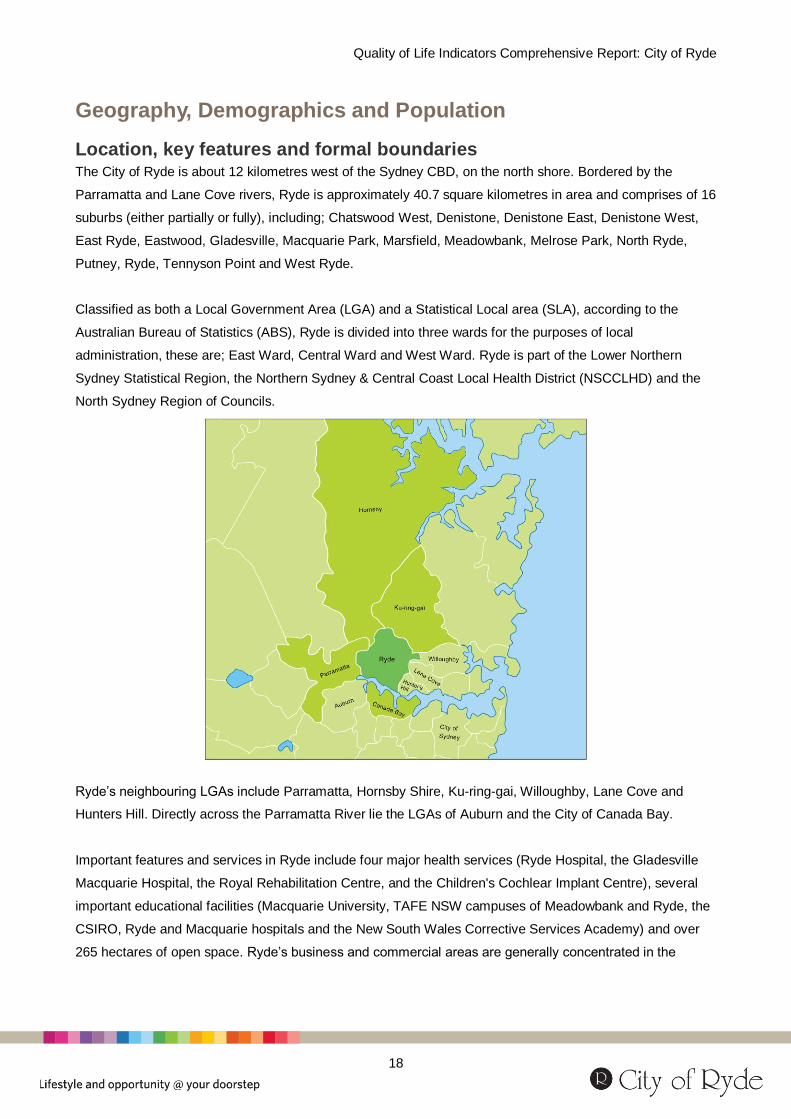
Location, key features and formal boundaries The City of Ryde is about 12 kilometres west of the Sydney CBD, on the north shore. Bordered by the
Parramatta and Lane Cove rivers, Ryde is approximately 40.7 square kilometres in area and comprises of 16
suburbs (either partially or fully), including; Chatswood West, Denistone, Denistone East, Denistone West,
East Ryde, Eastwood, Gladesville, Macquarie Park, Marsfield, Meadowbank, Melrose Park, North Ryde,
Putney, Ryde, Tennyson Point and West Ryde.
Classified as both a Local Government Area (LGA) and a Statistical Local area (SLA), according to the
Australian Bureau of Statistics (ABS), Ryde is divided into three wards for the purposes of local
administration, these are; East Ward, Central Ward and West Ward. Ryde is part of the Lower Northern
Sydney Statistical Region, the Northern Sydney & Central Coast Local Health District (NSCCLHD) and the
North Sydney Region of Councils.
Ryde’s neighbouring LGAs include Parramatta, Hornsby Shire, Ku-ring-gai, Willoughby, Lane Cove and
Hunters Hill. Directly across the Parramatta River lie the LGAs of Auburn and the City of Canada Bay.
Important features and services in Ryde include four major health services (Ryde Hospital, the Gladesville
Macquarie Hospital, the Royal Rehabilitation Centre, and the Children's Cochlear Implant Centre), several
important educational facilities (Macquarie University, TAFE NSW campuses of Meadowbank and Ryde, the
CSIRO, Ryde and Macquarie hospitals and the New South Wales Corrective Services Academy) and over
265 hectares of open space. Ryde’s business and commercial areas are generally concentrated in the

Quality of Life Indicators Comprehensive Report: City of Ryde
19
suburbs of Ryde, Gladesville, West Ryde and Eastwood, with a concentration of technology industries in
North Ryde and Macquarie Park. The City is served by the M2 Motorway and the main northern railway line.
Population, family and households
Ryde’s population, as estimated by the Australian Bureau of Statistics, was 104,955 people in 2009, making
it the 21st largest LGA in the state (ABS 2010). As shown in the figure below, population growth in Ryde in
the past few years has not been rapid.
Figure 1: Population Growth, Ryde 2004-
2009
Source: Australian Bureau of Statistics 2010. A
Between 2004 and 2009, the population of Ryde increased by an average annual rate of 1.0%, significantly
lower than the rates in the neighbouring LGAs of the City of Canada Bay (3.1%) and Parramatta (2.3%),
however, these did remain similar to Ku-ring-gai (0.9%) and Hornsby Shire (0.8%). Slow growth rates in the
Ryde area have led to a ranking in NSW of 112 out of 152 LGAs in terms of the speed of growth, however,
with a relatively large population, Ryde ranks slightly higher (45 out of 152) in terms of overall population
growth in numbers (ABS 2010).
According to the ABS (2007: 2010) there are 2,591 persons per km2 in Ryde, indicating a lower population
density than Canada Bay (3,838 persons per km2) and Parramatta (2,744 persons per km
2), yet is more
dense than both Hornsby (2,155 persons per km2) and Ku-ring-gai (1,304 persons per km
2)
Rates of internal migration in Ryde are similar to that across the Sydney SD and neighbouring LGAs. In
2006, 14.5% of Ryde residents had lived in a different address one year prior, while 37.6% lived in a different
location 5 years ago. Between 2001 and 2006, 55.7% of Ryde residents did not move residence, with the
majority of those moving coming from within NSW (16.6%), other locations in the LGA (9.6%) and overseas
(9.3%), (ABS 2007).

Quality of Life Indicators Comprehensive Report: City of Ryde
20
Figure 2: Population distribution by age, Ryde and Sydney, 2009
Source: Australian Bureau of Statistics, 2010.
Figure 2, above, shows the age distribution across Ryde in comparison with the Sydney SD. Ryde had a
relatively high proportion of young people aged 20-24 years (9.0% and 7.8% respectively) and 25-29 years
(9.1% and 8.3% respectively). Ryde also had a relatively high proportions of people in the older age groups
in comparison to the Sydney SD; that is, 70-74
years (3.0% vs. 2.8%); 75-79 years (2.7% vs.
2.3%); 80-84 years (2.5% 1.8%) and those aged
85 years and over (2.3% vs. 1.7%). According to
the ABS (2010), Ryde also had comparatively low
numbers of children and teens: children aged 0-4
years (5.9% compared with 6.6%); 5-9 years
(5.2% vs. 6.1%); 10-14 years (4.9% vs. 6.0%) and
15-19 years (5.7% vs. 6.6%).
In total numbers, the age group seeing the largest
growth between 2004 and 2009 were those aged
25-34 years (1,450 persons) and those aged 55-64
years (1,383 persons). The age group 35-44 years
saw a decrease of 320 persons over this period
(ABS 2010).
Focus on... Macquarie Park The suburb of Macquarie Park has a unique age
profile with a mix of land uses including commercial
and industrial areas (including the Macquarie Park
Employment Area), institutional areas (Macquarie
University) and residential areas. A higher proportion
( 23.4%) of the residents in Macquarie Park are
attending a tertiary institution (TAFE or university),
compared with 9.6% across other parts of Ryde (ABS
2007). In addition, a high proportion (40.3%) of the
Macquarie Park population is aged 20-34 years; the
comparative value for other parts of Ryde is 23.1%
(ID Consulting Pty Ltd 2010).

Quality of Life Indicators Comprehensive Report: City of Ryde
21
There were 37,842 households in Ryde in 2006, of these, 64.5% were families. This proportion is lower than
all comparator LGAs, that is; Ku-ring-gai (80.6%), Hornsby (77.1%), Parramatta (66.7%) and Canada Bay
(66.2%), (ABS 2007).
Of all families in Ryde, 19.2% were single-parent families with dependents; this rate is lower than Parramatta
(24.5%), yet higher than Canada Bay (18.7%), Hornsby (15.5%) and Ku-ring-gai (11.8%) according to the
Public Health Information Development Unit (2010). A relatively high proportion of Ryde’s households were
lone person households (25.1%), compared with much lower rates across the other LGAs (Parramatta
23.2%; Canada Bay 22.6%; Hornsby 17.6% and Ku-ring-gai 15.9%). Group households comprised of 4.7%
of all households in Ryde according to the ABS (2007).
References
Australian Bureau of Statistics 2007, 2006 Census Tables, Cat No 2068.0, Australian Bureau of Statistics, Canberra.
Australian Bureau of Statistics 2010, Regional Population Growth, Australia 2008-2009, Cat No 3218.0, Australian
Bureau of Statistics, Canberra.
ID Consulting Pty Ltd 2010, Forecast.ID: City of Ryde Population Forecasts, ID Consulting Pty Ltd, Sydney.
Public Health Information Development Unit 2010, Social Health of Australia Atlas, Public Health Information
Development Unit, Adelaide.

Quality of Life Indicators Comprehensive Report: City of Ryde
22
Demographic change Population forecasts vary in approach and method, and this report considers two forecasts for Ryde.
Forecasts from the Department of Health and Ageing (DoHA 2008) predict Ryde’s population to increase by
21.4% to reach 124,188 persons in 2027. Similarly, population data by the Department of Infrastructure,
Planning and Natural Resources have predicted a more modest 12.0% increase to 114,498 persons by the
year 2027 (ID Consulting 2010). The predicted increase in population over time will be mainly attributable to
an increase in the natural birth rate, with net migration predicted to be negative between 2008 and 2027,
whilst the scale of this migration is predicted to decline though this period (ID Consulting 2010).
Figure 3: Population Estimates, Ryde, by age structure, 2026/2027.
Source: Department of Health and Ageing, 2008; ID Consulting, 2010.
Figure 3, above, identifies a growth prediction with significant changes in the age profile of Ryde residents to
occur between 2008 and 2027.

Quality of Life Indicators Comprehensive Report: City of Ryde
23
Figure 4: Forecast change in age structure, the City of Ryde, 2007 to 2027.
Source: Department of Health and Ageing, 2008 ID Consulting Pty Ltd, 2010.
Figure 4, above, demonstrates the comparative significance of the change between age groups. Significant
change is shown, in particular, in the age brackets of 55 years and over. Both prediction models identify the
age group 65 to 74 years as likely to have the greatest change in age structure, increasing by 2.2 to 2.5%.
Relative to this, the increase in the age groups of 55 to 64 years (1.1% and 0.9%); 75 to 84 years (0.7% and
1.1%); and 85 and over (0.4% and 1.6%) are of a smaller magnitude. These figures provide clear predictions
of an ageing population in Ryde, particularly in the 65 to 74 year age brackets. This long term trend is
generally in keeping with national predictions of an ageing population.
Figure 5: Family type projections, selected types, Ryde, 2007-2027
Source: ID Consulting Pty Ltd, 2010.

Quality of Life Indicators Comprehensive Report: City of Ryde
24
In addition to transformations in the age profile of Ryde, changes are also predicted in the profile of
household types, as shown in Figure 5. Figure 5 shows a weighty 43.8% increase in lone person households
forecast to 2027, where this becomes the dominant housing type by 2019. There is also a marked increase
in the number of households of couples without dependants, increasing by 30.9% between 2007 and 2027.
Single-parent families will also increase (by 20.5%; however this household type remains relatively small
scale). In comparison, the number of couple families with dependents is predicted to increase by 1.1%
across this 20-year period. Group households and ‘other’ families will increase by 16.1% and 11.7% during
this time (ID Consulting 2010).
References
Australian Bureau of Statistics 2007, 2006 Census Tables, Cat No 2068.0, Australian Bureau of Statistics, Canberra.
Australian Bureau of Statistics 2010, Regional Population Growth, Australia 2008-2009, Cat No 3218.0, Australian
Bureau of Statistics, Canberra.
Department of Health and Ageing 2008, The Australian Population, Statistical Local Area Population Projections, 2007-
2027, Department of Health and Ageing, Canberra.
ID Consulting Pty Ltd. (2010). Forecast.ID: City of Ryde Population Forecasts, ID Consulting Pty Ltd, Sydney.

Quality of Life Indicators Comprehensive Report: City of Ryde
25
A City of Liveable Neighbourhoods Outcome
A range of well-planned neighbourhoods and public spaces designed with a strong sense of identity and place which are clean and safe
Introduction This chapter considers the adequacy and safety of the neighbourhoods in Ryde. Access to adequate
housing is well understood as a basic human right and is considered to be an integral factor in the enjoyment
of other economic, social and cultural rights. Suitable and adequate housing can provide a sense of physical
and emotional security and safety, contribute to a sense of identity, and provide a means to receive services,
seek employment and maintain a social life. The first part of this chapter addresses dwelling characteristics
by examining the quality and adequacy of housing available for the residents of Ryde.
Society places a vast importance on home ownerships, or at least the tenancy of a decent place for a
reasonable price. The affordability of other basic necessities is compromised when the majority of a
household’s income is spent on housing. Accordingly, liveability is also examined through the lenses of
affordability and the incidence of housing stress. Finally, the availability of housing for people most
dislocated from the housing market is examined by considering the use of public and community housing
and homelessness.
The level of comfort felt in a neighbourhood goes beyond the function of housing resources; it is also about
feeling and being safe. To identify these factors , this chapter will address the incidence of crime and safety
within the Ryde LGA. Evidence has shown a direct correlation between crime and socio-economic
disadvantage, as well as social exclusion, therefore, it may be considered as an important measure in its
own right? Some crimes in particular, may be associated with other specific indicators of disadvantage such
as financial stress and food insecurity. This chapter considers the incidence of crime. In particular, it will
discuss the effects of alcohol and crime, youth crime, and victims of crimes. Given there may be limitations
within crime data1, this chapter will balance the available data on crime with measures of perceived safety,
which may provide a more robust measure of community safety and wellbeing, as well as ensure safety data
is related to its social context. The information in this chapter should be considered in the context of other
chapters on prosperity, wellbeing, harmony and culture.
References
Bureau of Crime Statistics and Research (2010). NSW Recorded Crime Statistics 2005-2009. Bureau of Crime Statistics
and Research, Sydney.
1 Caution must be exercised when analysing crime data. Incidence figures are for crimes reported to the NSW Police and

Quality of Life Indicators Comprehensive Report: City of Ryde
26
Key indicator: Dwelling and tenure characteristics Related 2021 Goals
Ryde 1.3 Our neighbourhoods thrive and grow through sustainable design, planning and regulation that support community needs.
NSW 5 Place downward pressure on the cost of living.
About this indicator
This indicator considers the resources and
characteristics of dwellings, and their linkage
to the profile of residents in an area (NSW
Department of Housing, 2010). In addition,
the extent to which housing meets the needs
of residents is an important part of the
quality of life of occupants and developing
social relationships and personal identity
(ABS, 2001).
In 2006, there were 39,995 dwellings in Ryde. The majority of these dwellings are separate houses (54.5%);
this represents a smaller proportion than in Ku-ring-gai (85.4%) and Hornsby (75.0%), yet is similar to
Parramatta (56.2%) and higher than in Canada Bay (51.2%). In comparison to comparator LGAs, a larger
proportion of dwellings in Ryde were semi-detached, row, town or terrace houses (15.1%), compared with
12.4% in Parramatta, 10.6% in Canada Bay, 8.0% in Hornsby and 2.9% in Ku-ring-gai. The proportion of
flats, units and apartments (30.3%) was similar to Parramatta (30.7%) and slightly lower than Canada Bay
(37.6%). Figure 1 and 2 (below) show these figures as considerably higher than both Hornsby (16.5%) and
Ku-ring-gai (11.5%) (ABS 2007). This reflects a notable increase in the number of medium density dwellings2
in Ryde since 2001, that is, 89% of the total increase in dwellings occurred between 2001 and 2006
according to the NSW Department of Housing (2010).
2 Medium density dwellings include semi-detached, row, terrace, townhouse, villa in addition to flats and apartments in
blocks of 1 or 2 storeys, and flats attached to houses.

Quality of Life Indicators Comprehensive Report: City of Ryde
27
Figure 1: Housing types, LGA comparison, 2006
Source: Australian Bureau of Statistics, 2007.
Figure 2: Dwelling type, total number, Ryde, 2006
Source: Australian Bureau of Statistics, 2007.
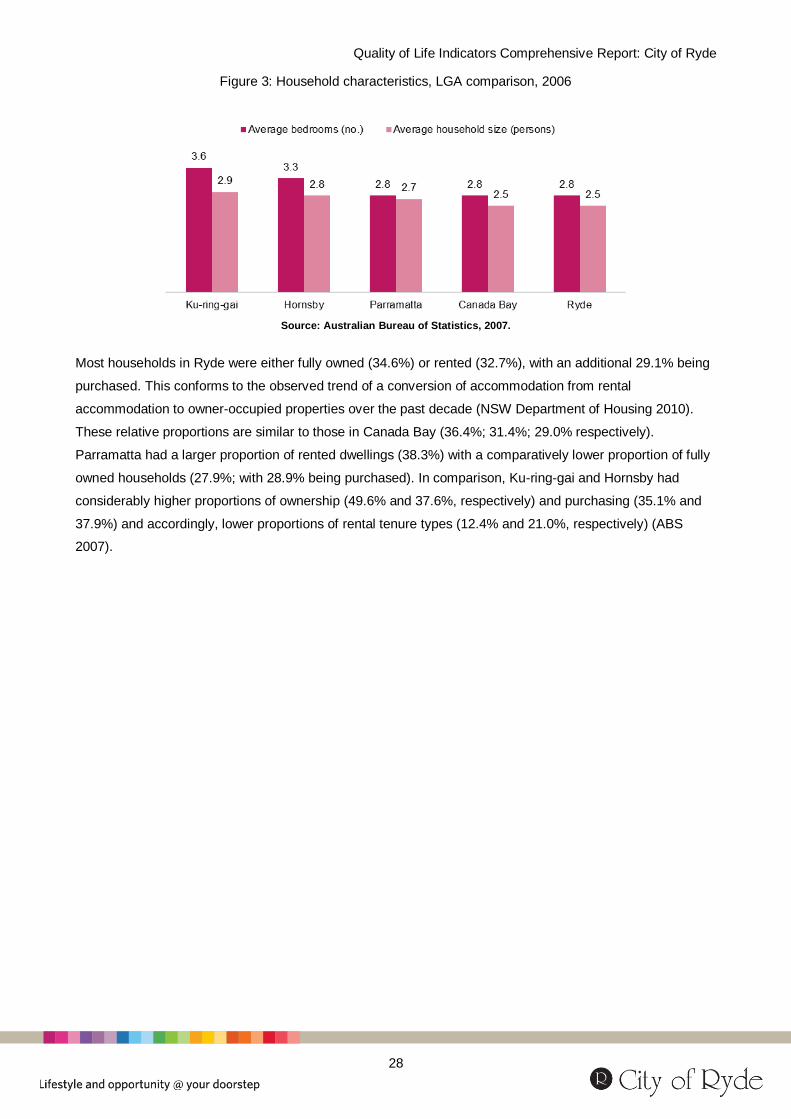
The average household size in Ryde has decreased slightly from 2.6 persons in 1996 to 2.5 in 2006. Figure
3, below, compares the 2006 average household size with the number of bedrooms, which provides a rough
proxy for dwelling size adequacy, and shows that there are an average of 2.8 bedrooms in Ryde households,
the same rate as for Canada Bay. According to the ABS (2007), in contrast, households in Hornsby and Ku-
ring-gai contained more bedrooms than the average number of members in each household, for example:
3.3 bedrooms to 2.8 persons, and 3.6: 2.9, respectively. The number of bedrooms in Parramatta households
was only slightly higher than the average number of persons (2.8: 2.7).
Quality of Life Indicators Comprehensive Report: City of Ryde
28
Figure 3: Household characteristics, LGA comparison, 2006
Source: Australian Bureau of Statistics, 2007.
Most households in Ryde were either fully owned (34.6%) or rented (32.7%), with an additional 29.1% being
purchased. This conforms to the observed trend of a conversion of accommodation from rental
accommodation to owner-occupied properties over the past decade (NSW Department of Housing 2010).
These relative proportions are similar to those in Canada Bay (36.4%; 31.4%; 29.0% respectively).
Parramatta had a larger proportion of rented dwellings (38.3%) with a comparatively lower proportion of fully
owned households (27.9%; with 28.9% being purchased). In comparison, Ku-ring-gai and Hornsby had
considerably higher proportions of ownership (49.6% and 37.6%, respectively) and purchasing (35.1% and
37.9%) and accordingly, lower proportions of rental tenure types (12.4% and 21.0%, respectively) (ABS
2007).

Quality of Life Indicators Comprehensive Report: City of Ryde
29
Figure 4: Dominant tenure type, the City of Ryde, 2006
.
Source: Australian Bureau of Statistics, 2007.
Figure 4, above, shows that ownership and purchasing dominates most areas of Ryde, with pockets of high
levels of rented dwellings around Marsfield, Eastwood, West Ryde, and the Ryde town centre (ABS 2007).
Macquarie Park, in particular, had a high 54.8 % rate of home rentals, compared with 29.7% across all other
parts of Ryde. Many dwellings around Macquarie University were rented, which points to accommodation
types catering for the largely transient student population based in this area.
References
Australian Bureau of Statistics 2001, Measuring Wellbeing: Mapping the conceptual basis of Australian social statistics,
Cat. No. 4160.0, Australian Bureau of Statistics, Canberra.
Australian Bureau of Statistics 2007, 2006 Census Tables, Cat. No. 2068.0, Australian Bureau of Statistics, Canberra.
NSW Department of Housing 2010, Information on Ryde Housing Market, NSW Department of Housing, Sydney.

Quality of Life Indicators Comprehensive Report: City of Ryde
30
Key indicator: Housing affordability Related 2021 Goals
NSW 5 Place downward pressure on the cost of living.
Housing purchase affordability Poor
Housing rental affordability Good
About this indicator
Housing becomes unaffordable when
dwelling prices are too high, when incomes
fall too low, or some combination of both.
Housing affordability can be a good indicator
to overall and individual economic conditions
and to the way society includes or excludes
low-income earners in some areas.
Accordingly, high levels of housing
affordability are often found in more
expensive areas: where residents tend to
have comparatively high levels of income,
especially in comparison with suburbs that
contain cheaper housing alternatives.
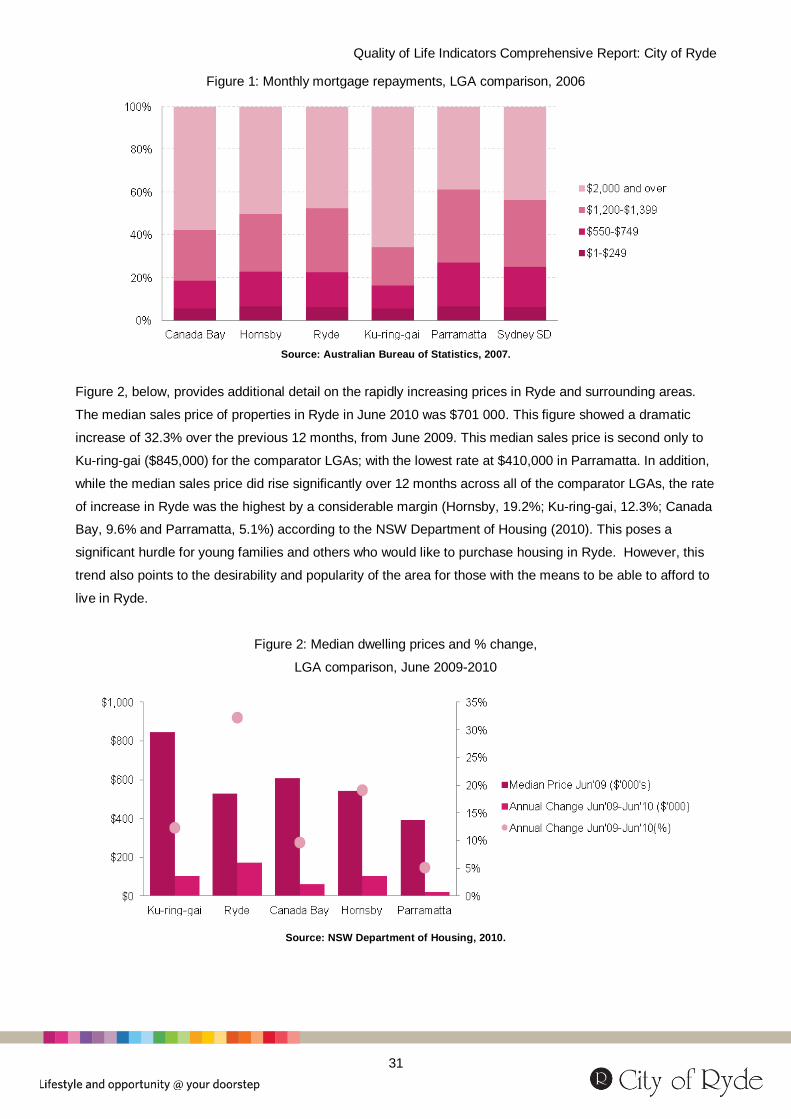
A lack of affordable home purchasing options characterises many parts of Sydney, including Ryde (NSW
Department of Housing 2010). Figure 1, below, shows that while nearly half (47.6%) of Ryde’s purchasing
households were spending more than $2,000 a month on mortgage repayments, this rate is lower than many
of the neighbouring LGAs, such as Ku-ring-gai (65.9%), Canada Bay (57.5%) and Hornsby (50.0%). The
proportion of affordable home purchasing in Ryde is higher than Parramatta (38.8%) and slightly higher than
for all of the Sydney SD. This indicates the overall high prices of properties in this part of Sydney (43.6%)
(ABS 2007).
Quality of Life Indicators Comprehensive Report: City of Ryde
31
Figure 1: Monthly mortgage repayments, LGA comparison, 2006
Source: Australian Bureau of Statistics, 2007.
Figure 2, below, provides additional detail on the rapidly increasing prices in Ryde and surrounding areas.
The median sales price of properties in Ryde in June 2010 was $701 000. This figure showed a dramatic
increase of 32.3% over the previous 12 months, from June 2009. This median sales price is second only to
Ku-ring-gai ($845,000) for the comparator LGAs; with the lowest rate at $410,000 in Parramatta. In addition,
while the median sales price did rise significantly over 12 months across all of the comparator LGAs, the rate
of increase in Ryde was the highest by a considerable margin (Hornsby, 19.2%; Ku-ring-gai, 12.3%; Canada
Bay, 9.6% and Parramatta, 5.1%) according to the NSW Department of Housing (2010). This poses a
significant hurdle for young families and others who would like to purchase housing in Ryde. However, this
trend also points to the desirability and popularity of the area for those with the means to be able to afford to
live in Ryde.
Figure 2: Median dwelling prices and % change,
LGA comparison, June 2009-2010
Source: NSW Department of Housing, 2010.

Quality of Life Indicators Comprehensive Report: City of Ryde
32
These figures indicate the relatively high price of home purchases in Ryde and neighbouring LGAs. The
implications of this are the limited availability of affordable housing stock for purchase by people with very
low, low and moderate incomes3. As of September 2010, only 4.1% of dwellings were considered affordable
for households with moderate incomes, a rapid decline from 24.2 % in June 2009. This rate is very low,
especially in comparison to neighbouring Parramatta (19.1%) and the Sydney SD (15.7%), yet is similar to
the unaffordable nature of the housing market in the ‘executive belt’ and other north shore LGAs such as
Hornsby (2.0%); Canada Bay (0.3%) and Ku-ring-gai (0.1%). There is very little affordable housing available
for purchase for households on low and very low incomes. This is the case for all of the comparator LGAs
and further indicates the challenge of affordable housing in this area (Centre for Affordable Housing 2010).
Considering the low rates of available rental dwellings, it would seem that households with moderate or
lower incomes are being excluded from purchasing homes in the area.
The housing market has been the source of significant government policy intervention and has been
susceptible to the economic turbulence of the previous few years. Figure 3, below, shows the impact of the
2008/09 boost in the first-home buyer’s grant, indexed to the median sales price at March 2006. Up to
December 2008, house prices in Ryde were subject to a series of small fluctuations but maintained an
average close to the start rate. In the period following the boost to the first home-buyers grant increase,
median prices increased in all LGAs; however those in Ryde dramatically outpaced the other markets. This
grant contributed to stimulating these housing markets, and by June 2010, prices were 150% of those in
December 2008, despite the end of the boost payments (ABS 2010).
Figure 3: Median sales prices, all properties, indexed time series 2006-10
Source: Australian Bureau of Statistics, 2010.
3 Very low incomes are classified as those incomes below 50% of the Census Median Equivalised Income; Low incomes
are those within 50-80% of the Census Median Equivalised Income; Moderate incomes are 80% - 120% of Census Median Equivalised Income (Centre for Affordable Housing, 2010).
Quality of Life Indicators Comprehensive Report: City of Ryde
33
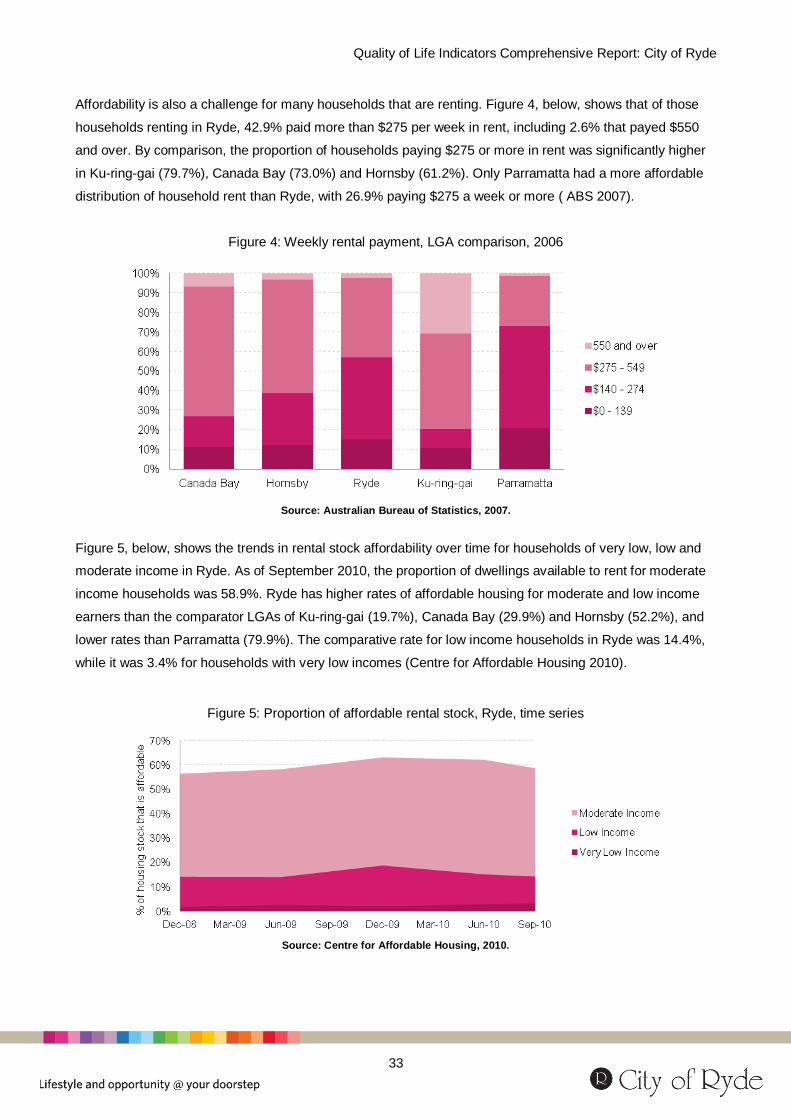
Affordability is also a challenge for many households that are renting. Figure 4, below, shows that of those
households renting in Ryde, 42.9% paid more than $275 per week in rent, including 2.6% that payed $550
and over. By comparison, the proportion of households paying $275 or more in rent was significantly higher
in Ku-ring-gai (79.7%), Canada Bay (73.0%) and Hornsby (61.2%). Only Parramatta had a more affordable
distribution of household rent than Ryde, with 26.9% paying $275 a week or more ( ABS 2007).
Figure 4: Weekly rental payment, LGA comparison, 2006
Source: Australian Bureau of Statistics, 2007.
Figure 5, below, shows the trends in rental stock affordability over time for households of very low, low and
moderate income in Ryde. As of September 2010, the proportion of dwellings available to rent for moderate
income households was 58.9%. Ryde has higher rates of affordable housing for moderate and low income
earners than the comparator LGAs of Ku-ring-gai (19.7%), Canada Bay (29.9%) and Hornsby (52.2%), and
lower rates than Parramatta (79.9%). The comparative rate for low income households in Ryde was 14.4%,
while it was 3.4% for households with very low incomes (Centre for Affordable Housing 2010).
Figure 5: Proportion of affordable rental stock, Ryde, time series
Source: Centre for Affordable Housing, 2010.
Quality of Life Indicators Comprehensive Report: City of Ryde
34
Overall, the NSW Department of Housing (2010) ranked Ryde as high in housing need, along with the
comparator LGAs of Hornsby and Parramatta, while Canada Bay and Ku-ring-gai were rated as moderately
high. As housing affordability in Sydney deteriorates, and social housing fails to meet demand, some of the
most disadvantaged individuals and families are turning to caravan parks as a ‘last resort’ housing option.
According to Wensing, Holloway and Wood (2003), disadvantaged members in society include the elderly,
itinerant workers, and people without other housing options such as ex-prison inmates. In 2006, there were
66 people living in caravans in Ryde, this is slightly higher than the 60 recorded in 2001, according to the
NSW Department of Housing (2010). Living conditions in caravan parks are often inadequate for long-term
occupancy in terms of available facilities, services, tenancy rights and safety.
References
Australian Bureau of Statistics 2007, 2006 Census Tables, Cat. No. 2068.0, Australian Bureau of Statistics, Canberra.
Australian Bureau of Statistics, 2010, NSW State and Regional Indicators 2009, Cat No. 1338.1. Canberra: Australian
Bureau of Statistics.
Centre for Affordable Housing 2010, Local Government Housing Kit Database, retrieved December 15, 2010, from
http://www.housing.nsw.gov.au/Centre+For+Affordable+Housing/NSW+Local+Government+Housing+
Kit/Local+Government+Housing+Kit+Database/2006+Census+Database.htm
NSW Department of Housing 2010, Information on Ryde Housing Market, NSW Department of Housing, Sydney.
Wensing, E., Holloway, D. and Wood, M. 2003, On the Margins? Housing risk among caravan park residents, Australian
Housing and Urban Research Institute, Sydney.

Quality of Life Indicators Comprehensive Report: City of Ryde
35
Key indicator: Housing stress Related 2021 Goals
NSW 5 Place downward pressure on the cost of living.
Housing stress occurs when mortgage payments (mortgage stress) or rental payments (rental stress) are
30% or more of the gross household income. Overall, figures for those under mortgage stress are higher
than for rental stress. Figure 1, below, shows the incidence of home purchase stress for very low, low and
medium income households. In Ryde, as in the comparator LGAs, mortgage stress occurs across all income
types, but is generally associated with lower household incomes. In 2006, 96.7% of very low income
households in Ryde that were purchasing were under mortgage stress. This rate is similar to Canada Bay
(97.3%); Hornsby (97.1%) and Ku-ring-gai (98.2%) and higher than for Parramatta (91.1%). The proportion
of low income earners in Ryde with housing stress (70.0%) was lower than all comparator LGAs (Ku-ring-gai,
88.0%; Canada Bay, 80.0%; Hornsby, 74.0%) with the exception of Parramatta (53.0%). According to the
Centre for Affordable Housing (2010) figures for moderate income earners under stress were similar to those
of low income home purchasers, being lower than Canada Bay (47.0%); Hornsby (34.0%) and Ku-ring-gai
(56.0%) and higher than Parramatta (23.0%) according to the Centre for Affordable Housing (2010).
About this indicator
Housing stress refers to households where a
large proportion of total income is spent on
housing costs, which limits the discretionary
income available to spend on food, clothing,
transportation, education, recreation or other
life necessities. The benchmark commonly
employed to measure housing stress is
where housing is costing at least 30% of
pre-tax household income for households
with very low, low and moderate incomes.
Related to measures of housing affordability,
this indicator can point to the high costs of
housing, low levels of income or both.

Quality of Life Indicators Comprehensive Report: City of Ryde
36
Figure 1: Home purchase stress, LGA comparisons, 2006
Source: Centre for Affordable Housing, 2010.
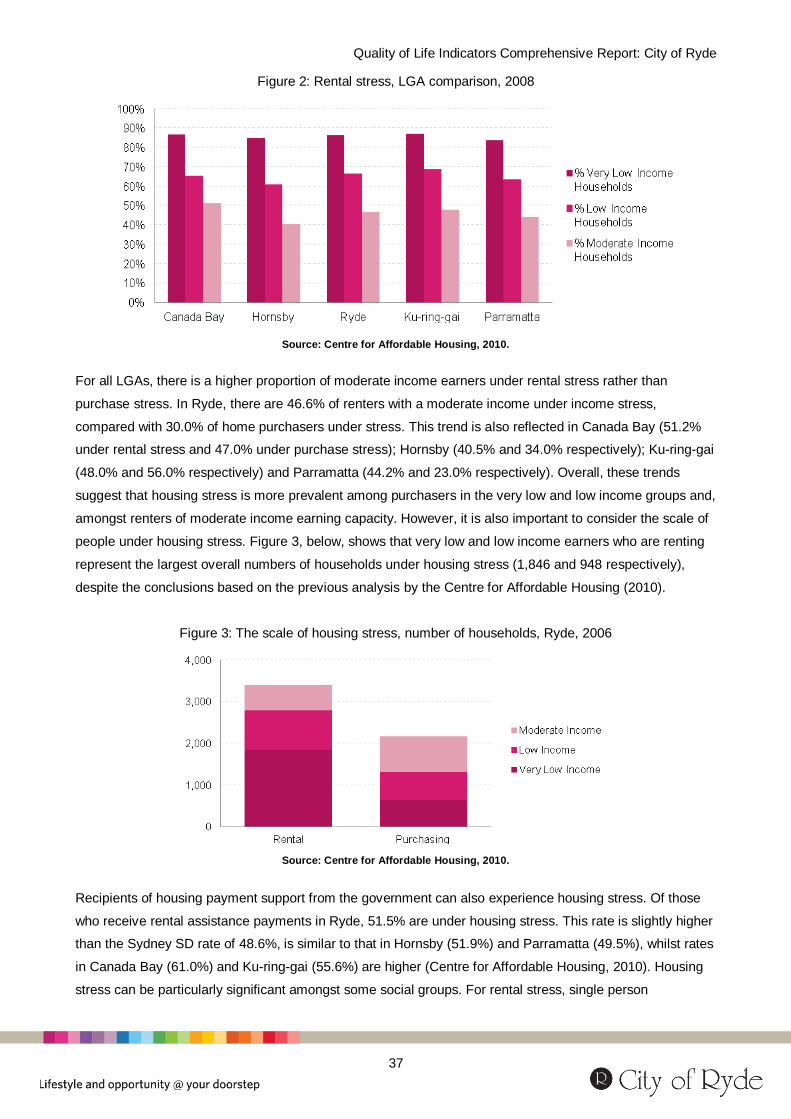
Figure 2, below, shows the level of rental stress for Ryde and surrounding LGAs. Whilst the overall levels of
very low and low income renters in stress (86.4% and 66.6% respectively) were lower than their purchasing
counterparts, nearly half (46.6%) of all moderate income earners that rented, continued to experience rental
stress. The proportion of low income earners under rental stress was consistently high across the LGAs (Ku-
ring-gai, 87.1%; Canada Bay, 86.9%; Hornsby, 84.8%; and Parramatta, 83.8%). These rates were all slightly
lower than those for home purchasers (see Figure 1 above). In Ryde, one-third of low income earners
experienced rental stress (66.6%), slightly lower than Ku-ring-gai (68.9%) and slightly higher than the LGAs
of Canada Bay (65.3%), Parramatta (63.6%) and Hornsby (60.9%). According to the Centre for Affordable
Housing (2010), Ryde and Parramatta LGAs indicate there are a greater proportion of low income earners
under purchasing stress than those under rental stress. In Ryde, 70.0% of low income households were
under purchasing stress compared to 66.6% under rental stress, and 63.6% renting and 53.0% purchasing in
Parramatta.
Quality of Life Indicators Comprehensive Report: City of Ryde
37
Figure 2: Rental stress, LGA comparison, 2008
Source: Centre for Affordable Housing, 2010.
For all LGAs, there is a higher proportion of moderate income earners under rental stress rather than
purchase stress. In Ryde, there are 46.6% of renters with a moderate income under income stress,
compared with 30.0% of home purchasers under stress. This trend is also reflected in Canada Bay (51.2%
under rental stress and 47.0% under purchase stress); Hornsby (40.5% and 34.0% respectively); Ku-ring-gai
(48.0% and 56.0% respectively) and Parramatta (44.2% and 23.0% respectively). Overall, these trends
suggest that housing stress is more prevalent among purchasers in the very low and low income groups and,
amongst renters of moderate income earning capacity. However, it is also important to consider the scale of
people under housing stress. Figure 3, below, shows that very low and low income earners who are renting
represent the largest overall numbers of households under housing stress (1,846 and 948 respectively),
despite the conclusions based on the previous analysis by the Centre for Affordable Housing (2010).
Figure 3: The scale of housing stress, number of households, Ryde, 2006
Source: Centre for Affordable Housing, 2010.
Recipients of housing payment support from the government can also experience housing stress. Of those
who receive rental assistance payments in Ryde, 51.5% are under housing stress. This rate is slightly higher
than the Sydney SD rate of 48.6%, is similar to that in Hornsby (51.9%) and Parramatta (49.5%), whilst rates
in Canada Bay (61.0%) and Ku-ring-gai (55.6%) are higher (Centre for Affordable Housing, 2010). Housing
stress can be particularly significant amongst some social groups. For rental stress, single person
Quality of Life Indicators Comprehensive Report: City of Ryde
38
households comprise of 61.0% of all households under housing stress, with an additional 14.2% who were
couples with children, and 14.2% single parents (NSW Department of Housing, 2010).
References
Centre for Affordable Housing 2010, Local Government Housing Kit Database, retrieved December 15, 2010, from
http://www.housing.nsw.gov.au/Centre+For+Affordable+Housing/NSW+Local+Government+Housing+
Kit/Local+Government+Housing+Kit+Database/2006+Census+Database.htm
NSW Department of Housing 2010, Information on Ryde Housing Market, NSW Department of Housing, Sydney.

Quality of Life Indicators Comprehensive Report: City of Ryde
39
Key indicator: Public and community housing and homelessness Related 2021 Goals
Ryde 1.3 Our neighbourhoods thrive and grow through sustainable design, planning and regulation that support community needs.
NSW 13 Better protect the most vulnerable members of our community and break the cycle of disadvantage
About this indicator
Social disadvantage is strongly associated
with public housing in Sydney (Randolph &
Holloway 2005). Social housing takes many
forms, but public housing operates as a last
resort for those who are unable to secure
their own access to suitable housing.
In September 2010, the total public housing stock in Ryde was 1,704 dwellings, or 2.1% of the total public
housing available in Sydney. Total public housing stock in Ryde has increased by 21.9% since 2006. The
proportion of Sydney’s public housing stock in Parramatta was 6.8%, while the proportion for Canada Bay,
Hornsby, and Ku-ring-gai were all under 1% (0.9%, 0.9% and 0% respectively) according to the Centre for
Affordable Housing (2010). This overall trend is further reflected in the 2006 data shown in Figure 1 below,
where 3.9% of dwellings in Ryde were rented from public housing authorities, below the average of 4.8% for
the Sydney SD. This rate is significantly lower than the 8.3% of dwellings in Parramatta, and higher than the
rates in Canada Bay (2.6%), Hornsby (1.2%) and Ku-ring-gai (0.1%) (Public Health Information Development
Unit, 2010). In 2006, 18.5% of total social housing dwellings in Ryde, that is, both public and community
housing options were provided by housing cooperatives, community groups and churches (Centre for
Affordable Housing, 2010).
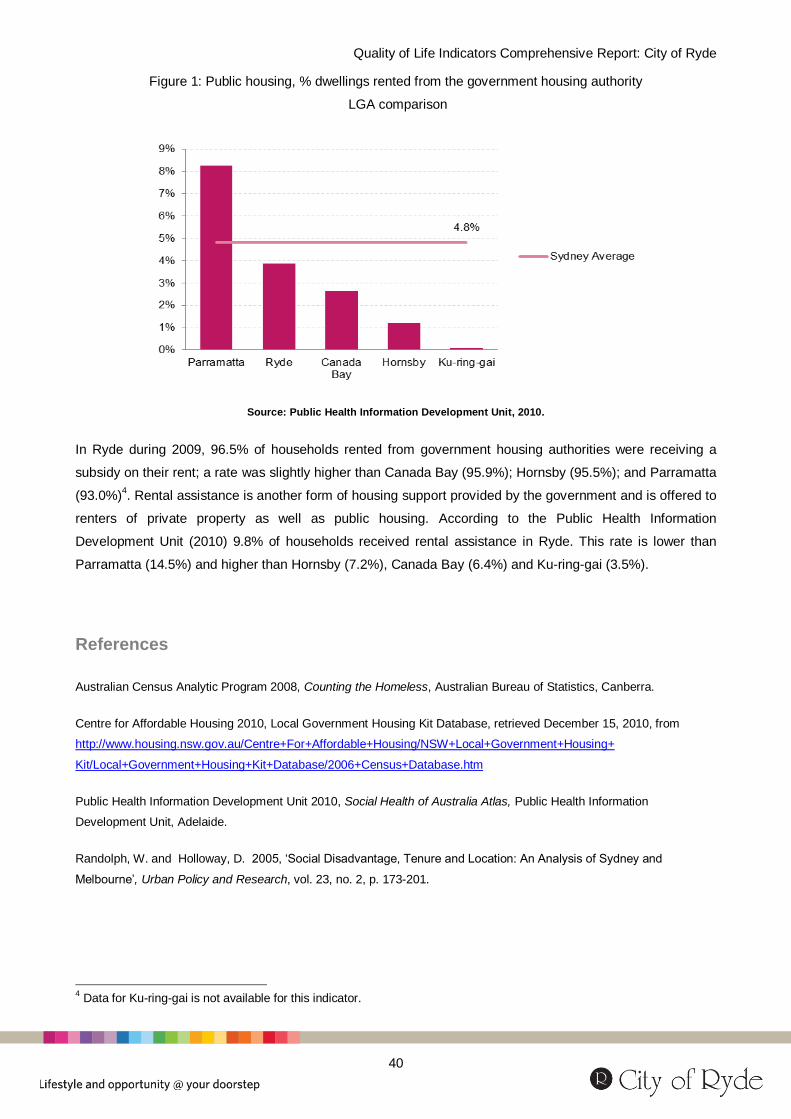
Quality of Life Indicators Comprehensive Report: City of Ryde
40
Figure 1: Public housing, % dwellings rented from the government housing authority
LGA comparison
Source: Public Health Information Development Unit, 2010.
In Ryde during 2009, 96.5% of households rented from government housing authorities were receiving a
subsidy on their rent; a rate was slightly higher than Canada Bay (95.9%); Hornsby (95.5%); and Parramatta
(93.0%)4. Rental assistance is another form of housing support provided by the government and is offered to
renters of private property as well as public housing. According to the Public Health Information
Development Unit (2010) 9.8% of households received rental assistance in Ryde. This rate is lower than
Parramatta (14.5%) and higher than Hornsby (7.2%), Canada Bay (6.4%) and Ku-ring-gai (3.5%).
References
Australian Census Analytic Program 2008, Counting the Homeless, Australian Bureau of Statistics, Canberra.
Centre for Affordable Housing 2010, Local Government Housing Kit Database, retrieved December 15, 2010, from
http://www.housing.nsw.gov.au/Centre+For+Affordable+Housing/NSW+Local+Government+Housing+
Kit/Local+Government+Housing+Kit+Database/2006+Census+Database.htm
Public Health Information Development Unit 2010, Social Health of Australia Atlas, Public Health Information
Development Unit, Adelaide.
Randolph, W. and Holloway, D. 2005, ‘Social Disadvantage, Tenure and Location: An Analysis of Sydney and
Melbourne’, Urban Policy and Research, vol. 23, no. 2, p. 173-201.
4 Data for Ku-ring-gai is not available for this indicator.

Quality of Life Indicators Comprehensive Report: City of Ryde
41
Key indicator: Incidence of crime Related 2021 Goals
Ryde 1.1 All residents enjoy living in a clean, safe, friendly and vibrant neighbourhoods
NSW 16 Prevent and reduce the level of crime
Rate of major offences Good
About this indicator
The rate of crime, especially violent crime
such as assault and robbery, can impact on
the sense of safety in a community. By
studying the comparative rates of crimes, we
can see where crime problems exist in a
community and develop programs and plans
for addressing these problems, and any
underlying issues.
Figure 1 below, shows the rate of major offences for Ryde and comparator LGAs. In 2010, the rate of major
offences in Ryde was 32.3 per 1,000 people, which was lower than both Parramatta (62.2) and Canada Bay
(36.4), yet slightly higher than Hornsby (28.0) and Ku-ring-gai (26.2). According to the Bureau of Crime
Statistics and Research (BOCSAR 2010) only the rate for Parramatta was higher than the NSW average of
56.2.
Figure 1: Rate of major offences, per 1,000 population
LGA comparison, 2009
Source: Bureau of Crime Statistics and Research, 2010.
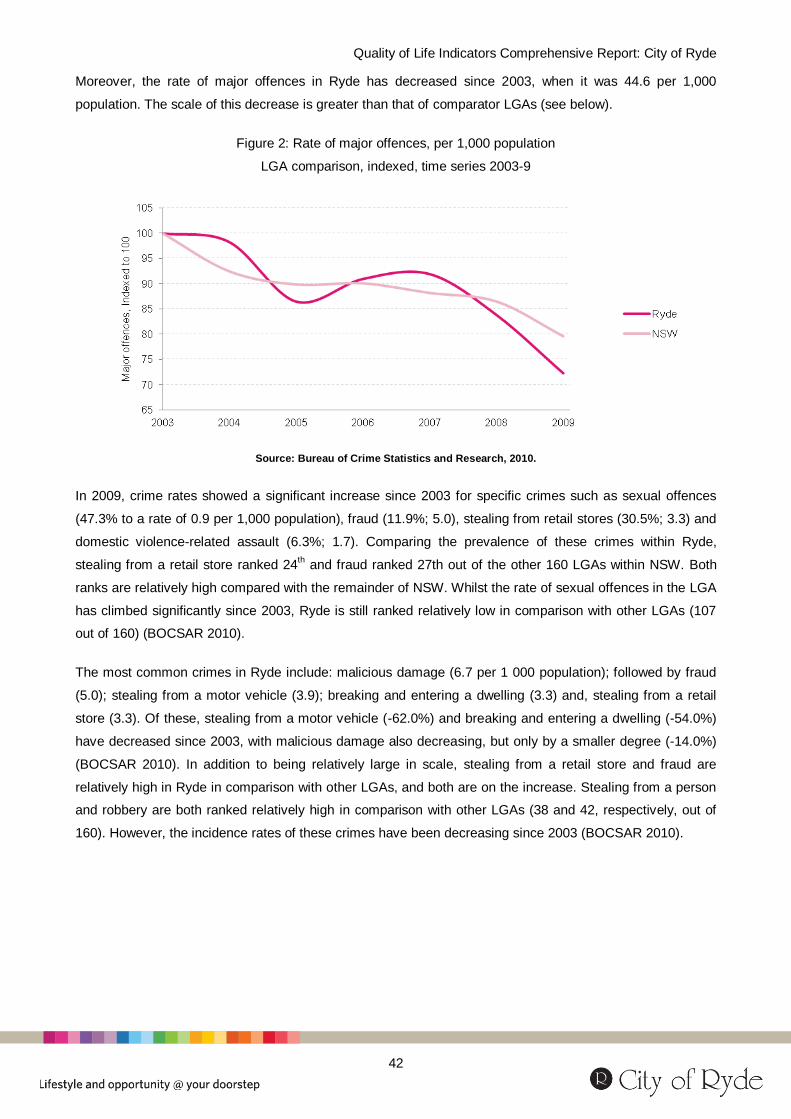
Quality of Life Indicators Comprehensive Report: City of Ryde
42
Moreover, the rate of major offences in Ryde has decreased since 2003, when it was 44.6 per 1,000
population. The scale of this decrease is greater than that of comparator LGAs (see below).
Figure 2: Rate of major offences, per 1,000 population
LGA comparison, indexed, time series 2003-9
Source: Bureau of Crime Statistics and Research, 2010.
In 2009, crime rates showed a significant increase since 2003 for specific crimes such as sexual offences
(47.3% to a rate of 0.9 per 1,000 population), fraud (11.9%; 5.0), stealing from retail stores (30.5%; 3.3) and
domestic violence-related assault (6.3%; 1.7). Comparing the prevalence of these crimes within Ryde,
stealing from a retail store ranked 24th and fraud ranked 27th out of the other 160 LGAs within NSW. Both
ranks are relatively high compared with the remainder of NSW. Whilst the rate of sexual offences in the LGA
has climbed significantly since 2003, Ryde is still ranked relatively low in comparison with other LGAs (107
out of 160) (BOCSAR 2010).
The most common crimes in Ryde include: malicious damage (6.7 per 1 000 population); followed by fraud
(5.0); stealing from a motor vehicle (3.9); breaking and entering a dwelling (3.3) and, stealing from a retail
store (3.3). Of these, stealing from a motor vehicle (-62.0%) and breaking and entering a dwelling (-54.0%)
have decreased since 2003, with malicious damage also decreasing, but only by a smaller degree (-14.0%)
(BOCSAR 2010). In addition to being relatively large in scale, stealing from a retail store and fraud are
relatively high in Ryde in comparison with other LGAs, and both are on the increase. Stealing from a person
and robbery are both ranked relatively high in comparison with other LGAs (38 and 42, respectively, out of
160). However, the incidence rates of these crimes have been decreasing since 2003 (BOCSAR 2010).

Quality of Life Indicators Comprehensive Report: City of Ryde
43
Figure 3: Total number of crimes, selected major offences, Ryde, 2009
Source: Bureau of Crime Statistics and Research, 2010.
In 2009, the most common location for the incidence of crimes occurred to residences in Ryde (33.0%),
where the most common offences were malicious damage (37.1%) and domestic violence assaults (24.6%).
BOCSAR (2010) reported that outdoor and public areas were recorded as the location of an additional
26.2% of crimes, with most incidents being malicious damage (29.6%); stealing from motor vehicles (28.7%);
and assault (non-domestic violence: 15.2%).
Criminal offences in Ryde were most commonly committed by males, with 71.2% of offenders or persons of
interest proceeded against being male. Of all male offenders, the age groups most dominant were those
aged between 10-17 years and those aged 40 years and above (25.7% each). For females, 33.5% of
offenders were aged between 10-17 years, and 24.7% were aged 20-29 years (BOCSAR 2010).
References
Bureau of Crime Statistics and Research 2010, NSW Recorded Crime Statistics 2005-2009, Bureau of Crime Statistics
and Research, Sydney.

Quality of Life Indicators Comprehensive Report: City of Ryde
44
Key indicator: Alcohol-related crime and domestic violence Related 2021 Goals
Ryde 1.1 All residents enjoy living in a clean, safe, friendly and vibrant neighbourhoods
NSW 16 Prevent and reduce the level of crime
About this indicator
There is considerable evidence of a strong
association between alcohol consumption
and violent behaviour, although there are
usually a number of other contributing
factors in crimes involving alcohol. Alcohol-
related violence can have a negative impact
on feelings of safety within a community,
and alcohol abuse is considered a risk factor
in domestic violence and child abuse and
neglect (Morgan & McAtamney 2009).
The NSW government aims to collect data on those instances where alcohol is involved in a crime; however
this collection process is not entirely accurate, especially when the identity of the offender is unknown
(BOCSAR 2010).
Figure 1: Involvement of alcohol in non-domestic and domestic violence
LGA comparison, 2009
Source: Bureau of Crime Statistics andResearch, 2010.
During 2009, 38.0% of all domestic violence incidents in Ryde were considered alcohol-related (see above).
This proportion is slightly higher than comparative rates from Hornsby (32.4%), Canada Bay (31.0%),

Quality of Life Indicators Comprehensive Report: City of Ryde
45
Parramatta (27.7%) and Ku-ring-gai (27.0%), but lower than the NSW rate of 44.0%. In comparison, the
proportion of non-domestic violence incidence involving alcohol in the Ryde was 29.4%, lower than that of
Hornsby (39.6%), Canada Bay (36.1%) and Parramatta (31.9%), and the NSW rate (45.4%) ( BOCSAR
2010).
Figure 2: Involvement of alcohol in assault police and offensive behaviour
LGA comparison, 2009
Source: Bureau of Crime Statistics and Research, 2010.
As shown above, alcohol was more likely to be involved in the crimes of assault police in Ryde (66.7%) than
in all the comparator LGAs except Hornsby (75.0%). Ryde also had a higher proportion of alcohol
involvement in offensive behaviour (62.2%) than Ku-ring-gai (50.0%) and Parramatta, but a lower proportion
than Canada Bay (70.8%) and Hornsby (71.0%) according to BOCSAR (2010).
References
Bureau of Crime Statistics and Research 2010, NSW Recorded Crime Statistics 2005-2009, Bureau of Crime Statistics
and Research, Sydney.
Morgan, A. and Mc Atamney, A. 2009, Key issues in alcohol-related violence, Australian Institute of Criminology,
Canberra.

Quality of Life Indicators Comprehensive Report: City of Ryde
46
Key indicator: Victims of crime Related 2021 Goals
Ryde 1.1 All residents enjoy living in a clean, safe, friendly and vibrant neighbourhoods
About this indicator
Being the victim of a crime can be a
traumatic and at times life-threatening
experience, with a risk of poorer mental and
physical health outcomes. Furthermore,
being victim to a crime, especially a violent
crime, can reduce feelings of safety for the
victim and also for others who become
aware of the incident. While perceptions are
not strongly associated with actual
incidence, reducing the number of crimes
against the person, and therefore victims,
could improve perceptions of safety within
an area.
Figure 1 below, provides a break-down of the victims of crime. Females were identified as more likely to be
victims of domestic violence assaults (68.4%) and stealing from a person (71.9%). In comparison, males
were more likely to be victims of crimes of assault (non-domestic violence) (77.1%) and robbery (81.8%).
These trends are similar to those seen in other LGAs (BOCSAR 2010).
Figure 1: Victims of crime, by crime and gender, Ryde, 2009
Source: Bureau of Crime Statistics and Research, 2010.
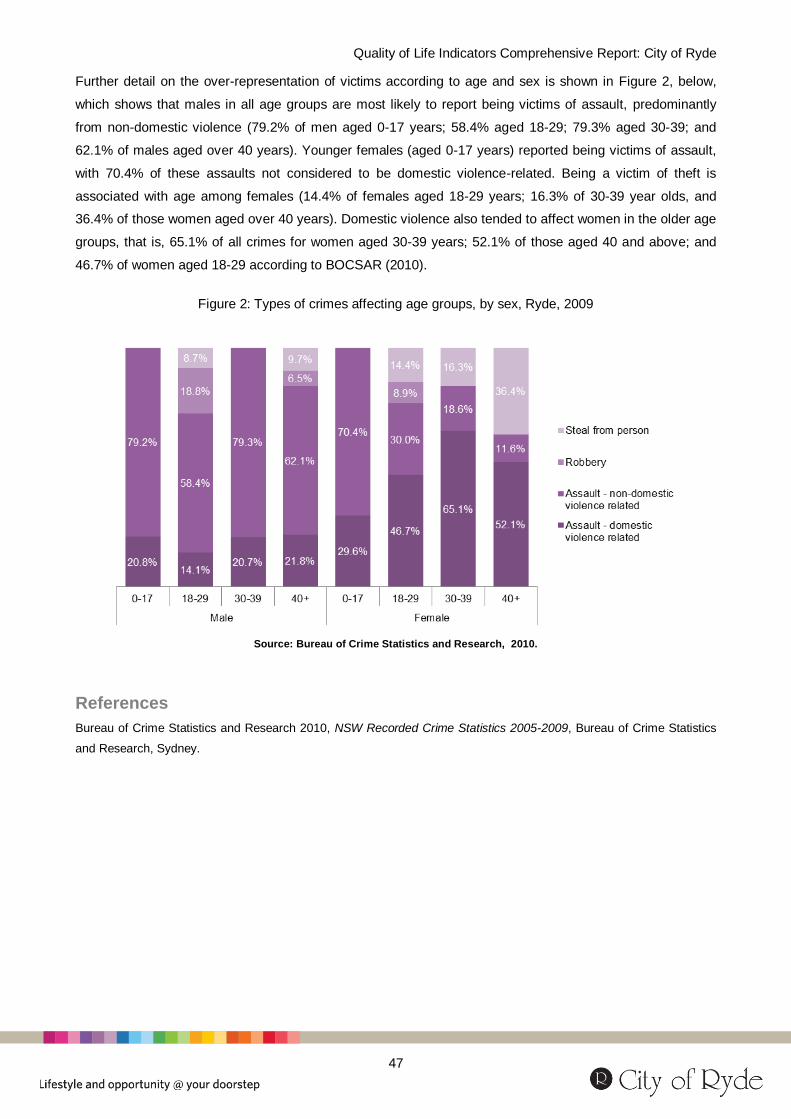
Quality of Life Indicators Comprehensive Report: City of Ryde
47
Further detail on the over-representation of victims according to age and sex is shown in Figure 2, below,
which shows that males in all age groups are most likely to report being victims of assault, predominantly
from non-domestic violence (79.2% of men aged 0-17 years; 58.4% aged 18-29; 79.3% aged 30-39; and
62.1% of males aged over 40 years). Younger females (aged 0-17 years) reported being victims of assault,
with 70.4% of these assaults not considered to be domestic violence-related. Being a victim of theft is
associated with age among females (14.4% of females aged 18-29 years; 16.3% of 30-39 year olds, and
36.4% of those women aged over 40 years). Domestic violence also tended to affect women in the older age
groups, that is, 65.1% of all crimes for women aged 30-39 years; 52.1% of those aged 40 and above; and
46.7% of women aged 18-29 according to BOCSAR (2010).
Figure 2: Types of crimes affecting age groups, by sex, Ryde, 2009
Source: Bureau of Crime Statistics and Research, 2010.
References
Bureau of Crime Statistics and Research 2010, NSW Recorded Crime Statistics 2005-2009, Bureau of Crime Statistics
and Research, Sydney.

Quality of Life Indicators Comprehensive Report: City of Ryde
48
Key indicator: Children at risk and child protection Related 2021 Goals
NSW 13 Better protect the most vulnerable members of our community and break the cycle of disadvantage
NSW 17 Prevent and reduce the level of reoffending
Low rate of juvenile offending Excellent
About this indicator
There is increasing concern about the abuse
and neglect of children in Australia, which
causes not only immediate suffering, but can
also lead to long-term problems in the
sufferer’s adult future (Australian Centre for
Child Protection, 2010). Both child abuse
and juvenile crime can have an on-going
negative impact on a community and can
often be an indication of underlying societal
issues.
The number of child protection reports, as well as the number of children involved in these reports, has been
increasing over the past eight years. Since 2001/02 the number of reports per the same size of population
has increased by 94.0%. In 2008/09, 83.5 of every 1,000 children were the subject of a report to the
Department of Community Services (now called the Department of Family and Community Services, FACS),
compared with 52.7 in 2001/02. The most prevalent reported issues for these referrals included domestic
violence (29.8%), emotional abuse (27.2%), physical abuse (23.7%), neglect (22.4%) and drug and alcohol
abuse by carer (20.9%) (NSW Department of Community Services 2010).
FACS has seven regional divisions. Ryde falls within the Metro Central region, whereby in 2008/09 there
were 15,195 children that were involved in protection reports to the Department. These protection reports
comprised of 13.2% of all referrals to FACS. This is slightly lower than comparative proportions in Metro
West (16.7%) and Metro South West (13.5%). When scaled by total population, the rate per 1,000 children in
Metro Central (33.7) was far lower than for Metro West (61.9), Metro South West (64.7) and all other regions
of NSW. The number of children deemed to be harmed or at risk of harm in Metro Central was 1,664, or 3.9
per 1,000 children, a rate that significantly lower than NSW (8.9), Metro West (6.6) and Metro South West
(7.0). The number of children in out-of-home care in Metro Central (1,602) has increased over time (from
1,288 children in 2007, to 1,416 in 2008). This equates to a rate of 3.8 per 1,000 children, however, this rate
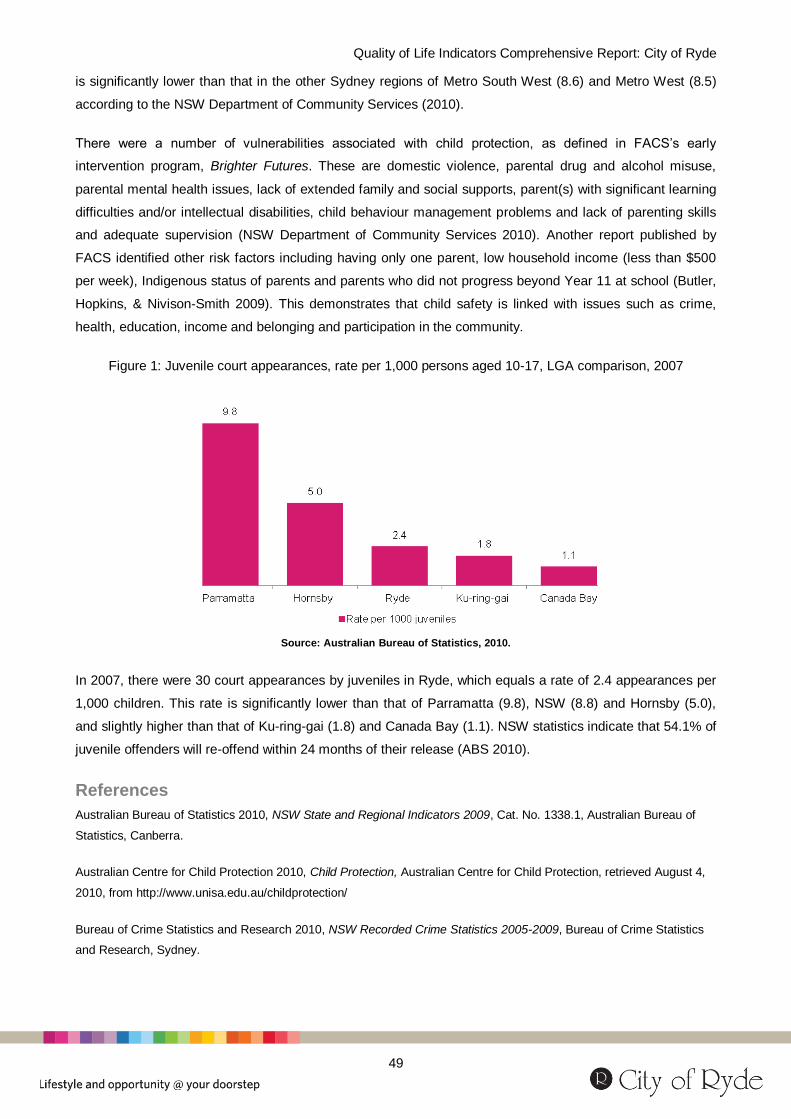
Quality of Life Indicators Comprehensive Report: City of Ryde
49
is significantly lower than that in the other Sydney regions of Metro South West (8.6) and Metro West (8.5)
according to the NSW Department of Community Services (2010).
There were a number of vulnerabilities associated with child protection, as defined in FACS’s early
intervention program, Brighter Futures. These are domestic violence, parental drug and alcohol misuse,
parental mental health issues, lack of extended family and social supports, parent(s) with significant learning
difficulties and/or intellectual disabilities, child behaviour management problems and lack of parenting skills
and adequate supervision (NSW Department of Community Services 2010). Another report published by
FACS identified other risk factors including having only one parent, low household income (less than $500
per week), Indigenous status of parents and parents who did not progress beyond Year 11 at school (Butler,
Hopkins, & Nivison-Smith 2009). This demonstrates that child safety is linked with issues such as crime,
health, education, income and belonging and participation in the community.
Figure 1: Juvenile court appearances, rate per 1,000 persons aged 10-17, LGA comparison, 2007
Source: Australian Bureau of Statistics, 2010.
In 2007, there were 30 court appearances by juveniles in Ryde, which equals a rate of 2.4 appearances per
1,000 children. This rate is significantly lower than that of Parramatta (9.8), NSW (8.8) and Hornsby (5.0),
and slightly higher than that of Ku-ring-gai (1.8) and Canada Bay (1.1). NSW statistics indicate that 54.1% of
juvenile offenders will re-offend within 24 months of their release (ABS 2010).
References
Australian Bureau of Statistics 2010, NSW State and Regional Indicators 2009, Cat. No. 1338.1, Australian Bureau of
Statistics, Canberra.
Australian Centre for Child Protection 2010, Child Protection, Australian Centre for Child Protection, retrieved August 4,
2010, from http://www.unisa.edu.au/childprotection/
Bureau of Crime Statistics and Research 2010, NSW Recorded Crime Statistics 2005-2009, Bureau of Crime Statistics
and Research, Sydney.
Quality of Life Indicators Comprehensive Report: City of Ryde
50
Butler, M., Hopkins, J., and Nivison-Smith, I. 2009, Resilient communities: Socio-demographic factors associated with
lower than expected rates of child protection reporting in small areas in NSW, NSW Department of Community Services,
Sydney.
NSW Department of Community Services 2009, Annual Statistical Report 2007/08, NSW Department of Community
Services, Sydney.
Quality of Life Indicators Comprehensive Report: City of Ryde
51
Discussion
This chapter examined liveability in Ryde through housing and safety – the ability to live in an affordable and
safe neighbourhood is a good indicator of social advantage. In general, this chapter identified that while
Ryde was becoming less affordable, particularly to people with very low to medium incomes, representing a
significant proportion of the population, it provided its residents with a relatively good quality of living.
Housing in Ryde is predominantly medium density, in comparison with neighbouring areas. The increasing
desirability and popularity of Ryde among home purchasers is seen by dramatically increasing house prices.
During June 2010, median sale prices in Ryde increased by a significant 32.3% in a 12 month period,
upsurging both Hornsby and Canada Bay to become the second highest of the comparator LGAs. In the
period following the boost to the first home-buyers grant increase, median prices increased in all comparator
LGAs as well as greater Sydney. Furthermore, sale prices in Ryde dramatically outpaced the other markets
and prevailed even after the withdrawal of the boost payment.
Nearly half of all purchasing households in Ryde were spending more than $2,000 a month on mortgage
repayments. The proportion of dwellings available for purchase to households of moderate income was only
4%, a dramatic decrease from the previous year (24.2% in June 2009), and far lower than neighbouring
areas. There is a significant lack of affordable housing available for purchase by people with low and very
low incomes, reinforcing their pre-existing experience of home purchasing stress.
These figures suggest a hurdle for home purchasers looking to enter the area - especially by
people of medium, low and very low incomes – how can we support these purchasers? Are
housing types available in Ryde an important factor in affecting the housing purchase
affordability challenges outlined in this chapter?
This chapter showed there is a greater scale of very low, low and moderate households under rental stress
than those under mortgage stress. This is most likely attributable to high income earners moving into the
area to purchase housing, whilst lower income earners are finding themselves more and more excluded from
the market. Rental stress is a persistent problem, especially among moderate income earners. Affordable
housing stock was 58.9%, 14.4% and 3.4% for households of moderate, low and very low income. 9.8% of
households received rental assistance from the government, and 51.5% of these are under housing stress.
Rental stress is particularly significant among households with lone persons, couples with children and single
parents.
How can we improve rental affordability across Ryde? In particular, how can we target
vulnerable groups with suitable housing options?

Quality of Life Indicators Comprehensive Report: City of Ryde
52
Crime does not appear to be a significant problem in Ryde. The rate of major offences in Ryde was 32 per
1,000 persons, and has been decreasing since 2003. The most common crimes include malicious damage,
fraud, steal from motor vehicle, break and entering a dwelling, and stealing from a retail store. Crimes that
have been increasing in Ryde such as stealing from a retail store and fraud are significant compared with
comparative rates across NSW. Sexual offences have become more common across Ryde; however they
remain less prevalent than rates across NSW. Residences were the most common location of reported
criminal incidents.
How can we ensure the overall level of crime in Ryde remains low and limits effects on the
liveability of our local area?

Quality of Life Indicators Comprehensive Report: City of Ryde
53
A City of Wellbeing Outcome
A healthy community, with all supported throughout their life by services, facilities and people.
Introduction Physical and psychological wellbeing operate as useful indicators of social inclusion, as levels of health can
shape life opportunities such as education, employment, housing, income levels and personal relationships.
Wellbeing is associated with many other indicators of exclusion including inadequate housing, poverty,
educational development and personal relationships. Vinson (2007) identified high rates of physical and
mental ill-health among groups that suffered multiple sources of disadvantage and were likely to be socially
excluded. Health and wellbeing can therefore be part of a reinforcing cycle of entrenched disadvantage.
This chapter will examine aspects of well-being that focus on the health of the community and individuals,
including an individual’s self-assessment of health and life expectancy, which can be a useful indicator and
predictor of future health problems. Self-assessed health is complemented by considering the commonly
accepted and documented indicators on life expectancy, disease burdens and mortality. This is followed by
examining indicators of health risks and behaviours that are strongly associated with poor health outcomes
including obesity, nutrition, smoking, drinking alcohol and drug abuse.
A further three important areas of well-being are included, that is, looking at people with a disability, the
increasingly significant issue of mental health, as well as children’s health indicators and fertility rates.
Finally, wellbeing also captures the support provided to the community through services, facilities and people
and is examined here by considering levels of access to health services as well as the role of carers in the
community.
The final aspect of an understanding of wellbeing is the social participation of individuals beyond the
formalised institutions of education and employment. Social participation is believed to have positive impacts
on the health of individuals and on the strength of communities, and can be associated with many factors,
including access for people with a disability, access to services, access to transport and open space, and
access to technology. To explore social participation in Ryde, this chapter examines the indicators of social
relationships and the level of participation in recreational and leisure activities. Social participation in the form
of volunteering will be explored in the chapter on Progressive Leadership.
References
Vinson, T. 2007, Dropping off the edge: the distribution of disadvantage in Australia, Jesuit Social Services and Catholic
Social Services Australia, Sydney

Quality of Life Indicators Comprehensive Report: City of Ryde
54
Key indicator: Self-reported health Related 2021 Goals
Ryde 2.1 Our residents are encouraged to live healthy and active lives
NSW 11 Keep people healthy and out of hospital
Fair or poor self-reported health Average
About this indicator
Self-reported health is a useful measure of
wellbeing that reflects physical health
problems as well as health behaviours and
mental health problems. While self-
assessment may not be as reliable as one
measured by a health professional, it does
provide useful information on the
perceptions of an individual, and has been
shown to be a predictor of mortality and
morbidity (NSW Department of Health
2008).
Figure 1, below, shows the proportion of the population of Ryde that reporting fair or poor health, rather than
excellent, very good or good health, (12.9%). This rate is below the Sydney SD rate of 15.9%, Parramatta
(18.5%) and Canada Bay (13.3%), yet it is higher than those in Hornsby (10.2%) and Ku-ring-gai (8.7%)
according to the Public Health Information Development Unit (2010).
Figure 1: Fair or poor health, % of people aged 15 years and over
LGA comparison, 2004/5
Source: Public Health Information Development Unit, 2010.

Quality of Life Indicators Comprehensive Report: City of Ryde
55
Data from the Northern Sydney & Central Coast Area Health Service (NSCCAHS 2010), currently called the
Northern Sydney Central Coast Local Health District, identified that males were slightly more likely to report
their health as excellent, very good or good (85.4%) compared with 82.2% of females. Younger people were
also more likely to report better health, with 86.1% of all persons aged between 16-24 years reporting their
health to be excellent, very good or good, compared with 72.0% of people aged 75 years and above
(NSCCAHS 2010).
Other trends observed in self-reported health data, includes the tendency for health to decrease with a
person’s socioeconomic background, that is, individuals living in more disadvantaged situations tend to
report their health to be poorer than those in more advantaged situations. In addition, higher income and
possession of higher-level qualifications, and possessing secure employment tend to be associated with
higher self-reported health (ABS 2007).
References
Australian Bureau of Statistics 2007, Self-assessed Health in Australia: A Snapshot, 2004-05, Australian Bureau of
Statistics, Canberra.
Public Health Unit, NSCCAHS 2010, Northern Sydney Central Coast Health e-profile, NSW Department of Health,
Sydney.
Population Health Division 2008, The health of the people of New South Wales - Report of the Chief Health Officer, NSW
Department of Health, Sydney.
Public Health Information Development Unit 2010, Social Health of Australia Atlas, Public Health Information
Development Unit, Adelaide.

Quality of Life Indicators Comprehensive Report: City of Ryde
56
Key indicator: Life expectancy Related 2021 Goals
Ryde 2.1 Our residents are encouraged to live healthy and active lives
NSW 11 Keep people healthy and out of hospital
About this indicator
Life expectancy is one of the most widely
used indicators of population health. Life
expectancy at birth can measure how long a
person born in a particular year might expect
to live, if mortality patterns for that year
remain unchanged over their lifetime. Life
Expectancy focuses on length rather than
quality of life, yet it represents a useful
summary indicator. In addition, as death
rates do change over time, life expectancy at
65 years is a reasonable summary indicator
of the many factors that influence death
rates amongst older people, such as
lifestyle, nutritional and environmental
factors, as well as the quality of and access
to health services (NSW Department of
Health 2008).
Figure 1, below, shows the life expectancy at birth and at 65 years of age for the residents of the Northern
Sydney and Central Coast area (including Ryde). This figure shows that in 2006, the life expectancy of a
newborn was 82.5 years. This rate is slightly higher than the NSW average of 81.3 years and was higher
than neighbouring areas of Sydney West (81.2 years) and Sydney South West (81.1 years). The graph also
shows that females had a significantly higher life expectancy than males at birth; a 4.2 year difference. This
trend is mirrored across all areas of NSW and is also a common trend in the Western World; with an average
5.0 years difference in NSW (NSCCAHS 2010).

Quality of Life Indicators Comprehensive Report: City of Ryde
57
Figure 1: Life expectancy at birth, and 65 years, Northern Sydney and Central Coast Area, 2006
Source: NSW Department of Health, 2008.
Life expectancy is greater once a person reaches 65 years, and for the Northern Sydney and Central Coast
Area life expectancy was 85.6 years, which was again higher than that for NSW (85.0 years) and for Sydney
West (84.9) and Sydney South West (84.8). The life expectancy at 65 was also higher for females (87.0)
than for males (84.0), however the differences between the sexes are closer (only 3.0 years difference),
which reflects the fact that males are at greater risk than women of dying before they reach the age of 65,
primarily from injury, suicide or cardiovascular disease (NSW Department of Health 2008).
References
Public Health Unit, NSCCAHS 2010, Northern Sydney Central Coast Health e-profile, NSW Department of Health,
Sydney.
Population Health Division 2008, The health of the people of New South Wales - Report of the Chief Health Officer, NSW
Department of Health, Sydney.
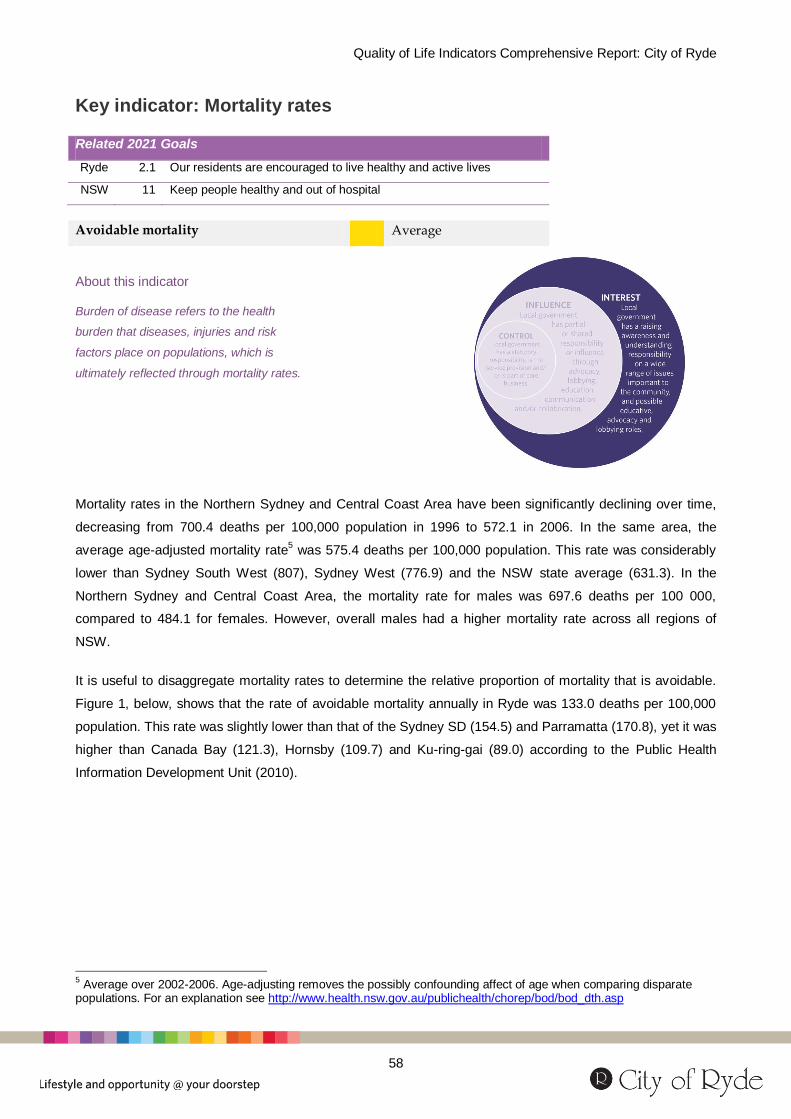
Quality of Life Indicators Comprehensive Report: City of Ryde
58
Key indicator: Mortality rates Related 2021 Goals
Ryde 2.1 Our residents are encouraged to live healthy and active lives
NSW 11 Keep people healthy and out of hospital
Avoidable mortality Average
About this indicator
Burden of disease refers to the health
burden that diseases, injuries and risk
factors place on populations, which is
ultimately reflected through mortality rates.
Mortality rates in the Northern Sydney and Central Coast Area have been significantly declining over time,
decreasing from 700.4 deaths per 100,000 population in 1996 to 572.1 in 2006. In the same area, the
average age-adjusted mortality rate5 was 575.4 deaths per 100,000 population. This rate was considerably
lower than Sydney South West (807), Sydney West (776.9) and the NSW state average (631.3). In the
Northern Sydney and Central Coast Area, the mortality rate for males was 697.6 deaths per 100 000,
compared to 484.1 for females. However, overall males had a higher mortality rate across all regions of
NSW.
It is useful to disaggregate mortality rates to determine the relative proportion of mortality that is avoidable.
Figure 1, below, shows that the rate of avoidable mortality annually in Ryde was 133.0 deaths per 100,000
population. This rate was slightly lower than that of the Sydney SD (154.5) and Parramatta (170.8), yet it was
higher than Canada Bay (121.3), Hornsby (109.7) and Ku-ring-gai (89.0) according to the Public Health
Information Development Unit (2010).
5 Average over 2002-2006. Age-adjusting removes the possibly confounding affect of age when comparing disparate
populations. For an explanation see http://www.health.nsw.gov.au/publichealth/chorep/bod/bod_dth.asp
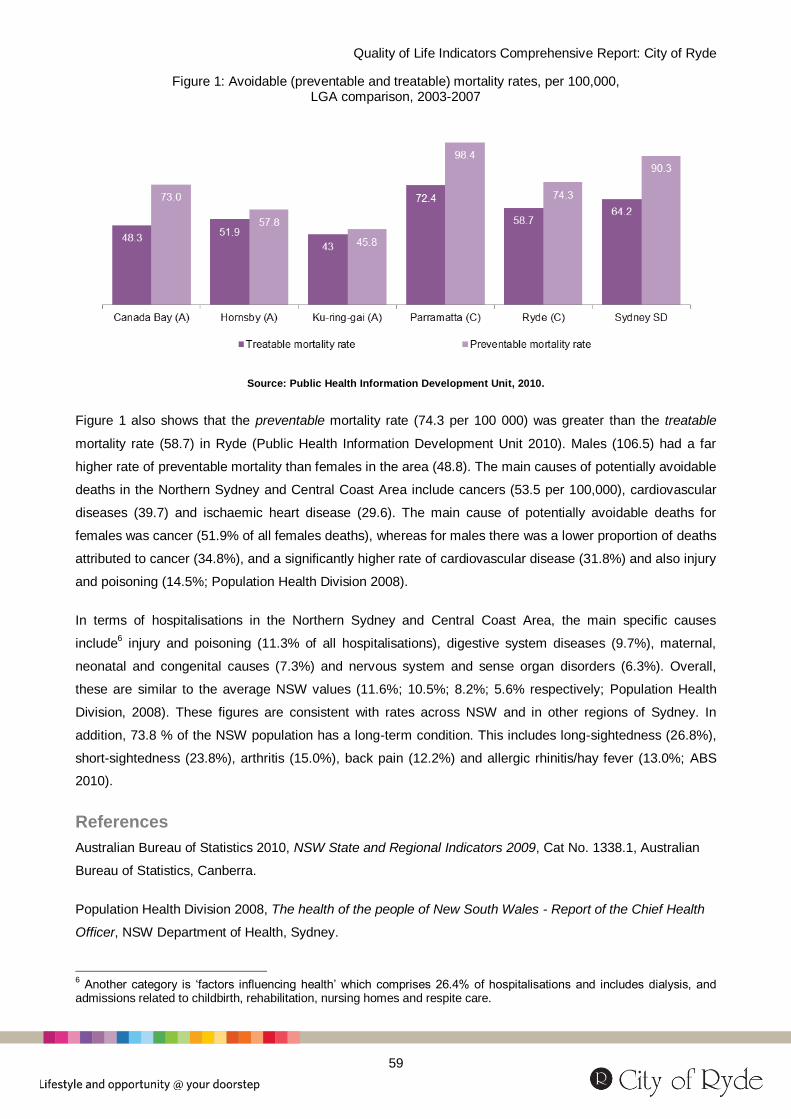
Quality of Life Indicators Comprehensive Report: City of Ryde
59
Figure 1: Avoidable (preventable and treatable) mortality rates, per 100,000, LGA comparison, 2003-2007
Source: Public Health Information Development Unit, 2010.
Figure 1 also shows that the preventable mortality rate (74.3 per 100 000) was greater than the treatable
mortality rate (58.7) in Ryde (Public Health Information Development Unit 2010). Males (106.5) had a far
higher rate of preventable mortality than females in the area (48.8). The main causes of potentially avoidable
deaths in the Northern Sydney and Central Coast Area include cancers (53.5 per 100,000), cardiovascular
diseases (39.7) and ischaemic heart disease (29.6). The main cause of potentially avoidable deaths for
females was cancer (51.9% of all females deaths), whereas for males there was a lower proportion of deaths
attributed to cancer (34.8%), and a significantly higher rate of cardiovascular disease (31.8%) and also injury
and poisoning (14.5%; Population Health Division 2008).
In terms of hospitalisations in the Northern Sydney and Central Coast Area, the main specific causes
include6 injury and poisoning (11.3% of all hospitalisations), digestive system diseases (9.7%), maternal,
neonatal and congenital causes (7.3%) and nervous system and sense organ disorders (6.3%). Overall,
these are similar to the average NSW values (11.6%; 10.5%; 8.2%; 5.6% respectively; Population Health
Division, 2008). These figures are consistent with rates across NSW and in other regions of Sydney. In
addition, 73.8 % of the NSW population has a long-term condition. This includes long-sightedness (26.8%),
short-sightedness (23.8%), arthritis (15.0%), back pain (12.2%) and allergic rhinitis/hay fever (13.0%; ABS
2010).
References
Australian Bureau of Statistics 2010, NSW State and Regional Indicators 2009, Cat No. 1338.1, Australian
Bureau of Statistics, Canberra.
Population Health Division 2008, The health of the people of New South Wales - Report of the Chief Health
Officer, NSW Department of Health, Sydney.
6 Another category is ‘factors influencing health’ which comprises 26.4% of hospitalisations and includes dialysis, and
admissions related to childbirth, rehabilitation, nursing homes and respite care.

Quality of Life Indicators Comprehensive Report: City of Ryde
60
Public Health Information Development Unit 2010, Social Health of Australia Atlas, Public Health Information
Development Unit, Adelaide.

Quality of Life Indicators Comprehensive Report: City of Ryde
61
Key indicator: Health-related behaviours and risk factors Related 2021 Goals
Ryde 2.1 Our residents are encouraged to live healthy and active lives
NSW 11 Keep people healthy and out of hospital
Risky lifestyle choices Average
About this indicator
Some behaviour is strongly associated with
poorer health outcomes and can
dramatically increase an individual’s risk of
personal harm or death and may also
decrease their quality of life. Smoking and
risky alcohol consumption can lead to poor
short-term and long-term health outcomes
as well as premature death. Obesity and
poor nutrition are increasing national and
international trends, which have been
labelled an ‘epidemic’. Risk taking behaviour
is also correlated to other indicators of social
disadvantage, such as poverty and
unemployment.
In 2008, 14.9% of the adult population in Ryde were current smokers, compared with 18.2% in Sydney.
Smoking rates in Parramatta (18.3%) and Canada Bay (16.0%) were higher than this rate; however the rates
for both Hornsby and Ku-ring-gai were significantly lower (12.5% and 7.8%, respectively). A common trend
across all comparator LGAs was that males were more likely to be smokers than females (17.4% to 12.6% in
Ryde; Public Health Information Development Unit 2010). The age groups most likely to smoke were
persons aged between 35-44 years (18.5%) as well as between 45-54 years (16.7%). It is young people
(92.3% of people aged 16-24 years) that were least likely to live in smoke-free households, compared with
all other age groups (NSCCAHS 2010). In 2006-2008, there was an average of 226 hospital separations (per
year) due to smoking in Ryde, representing a rate of 222.1 hospitalisations per 100,000 population. The
annual number of deaths related to smoking over this period was 64, equalling a rate of 60.6 per 100,000
population. Hospitalisation rates due to smoking in Ryde were lower than both Parramatta (289.3) and
Hornsby (226.1), and death rates were lower than Parramatta (74.5) and Canada Bay (65.3) (Population
Health Division 2008)

Quality of Life Indicators Comprehensive Report: City of Ryde
62
Figure 1: Health risk behaviours, by type and proportion with at least 1 health risk
LGA comparison, 2008
Source: Public Health Information Development Unit, 2010.
Figure 1, above, shows the prevalence of smoking and other harmful health behaviours across all
comparator LGAs. In Ryde, 3.9% of adults consumed alcohol at a high risk to their health, lower than the
Sydney SD rate of 4.5%. Risky alcohol consumption was at a similar level to Ryde in Parramatta (3.8%) and
Ku-ring-gai (3.8%), while there were higher levels of this behaviour in both Canada Bay (4.4%) and Hornsby
(4.1%; Public Health Information Development Unit 2010). Younger people, especially males, were more
likely to engage in risky drinking, for example, 61.6% of males aged 16-24 years and 54.2% of males aged
25-34 years (NSCCAHS 2010).
The rate of hospitalisations attributable to drinking in Ryde was 643.0 per 100,000 population. The rates for
both Ku-ring-gai (872.4) and Parramatta (680.1) were higher; however the rates in Hornsby Shire (620.0)
and Canada Bay (492.4) were lower. The annual death rate attributable to alcohol in Ryde was 13.7 per
100,000 population, lower than the rates in Canada Bay (16.6), Parramatta (16.5) and Hornsby (14.2;
Population Health Division 2008).
In Ryde, 16.7% of males aged over 15 years were obese and 37.6% of males were overweight. Among
females aged over 15 years, 11.5% were obese and 20.9% were overweight. This leaves an estimated
37.3% of males in Ryde that were within a normal weight range, which was higher than all of the comparator
LGAs of Ku-ring-gai (37.0%), Hornsby (36.9%), Parramatta (34.7%) and Canada Bay (34.4%), as well as the
Sydney SD rate of 33.0%. For females, 45.4% were in a normal weight range, higher than both the Sydney
SD and Parramatta (43.3% each), but lower than Ku-ring-gai (51.0%), Hornsby (49.1%) and Canada Bay
(46.8%). Obesity is associated with several chronic diseases, such as Type 2 diabetes (which affects 3.2%
of Ryde’s population) and high cholesterol (5.3%; Public Health Information Development Unit 2010).

Quality of Life Indicators Comprehensive Report: City of Ryde
63
Other indicators of health behaviour include nutrition and physical activity, which are also linked with obesity
and being overweight. In Ryde, 32.1% of the population are considered physically inactive. This rate is
higher than most LGAs (Canada Bay, 30.6%; Hornsby, 28.8%; and Ku-ring-gai, 24.0%) with the exception of
Parramatta (37.2%). It remains lower than the Sydney SD rate of 34.0%.
Of children aged 5-17 years in Ryde, 62.0% received an adequate daily intake of fruit, higher than the
Sydney SD rate of 59.3%. The corresponding value for adults was 53.5%, again higher than the Sydney SD
rate of 51.3% (Public Health Information Development Unit 2010). A lower proportion of young adults
consume adequate fruit each day (54.6% aged 16-24 compared with 60.0% for all age groups). Young
people were also the age group least likely to receive adequate serves of vegetables, that is, only 36.3% of
people aged 16-24 years compared with an overall average of 44.3% total population in the North Sydney
and Central Coast Area (NSCCAHS 2010).
Current and reliable data on illicit substance use is limited. Data from NSW suggests that 12.1% of the NSW
population have recently used an illicit drug, with the most common drug types being cannabis (8.0%),
ecstasy (3.4%), cocaine (2.0%), pain-killers (for non-medical purposes 2.2%) and meth/amphetamines
(1.8%). The death rate from illicit drug use has been decreasing since 1999 (to a rate of 3.3 per 100,000
adult population in 2006 (Population Health Division 2008).
References
Public Health Unit, NSCCAHS 2010, Northern Sydney Central Coast Health e-profile, NSW Department of Health,
Sydney.
Population Health Division 2008, The health of the people of New South Wales - Report of the Chief Health Officer, NSW
Department of Health, Sydney.
Public Health Information Development Unit 2010, Social Health of Australia Atlas, Public Health Information
Development Unit, Adelaide.

Quality of Life Indicators Comprehensive Report: City of Ryde
64
Key indicator: Mental health Related 2021 Goals
Ryde 2.1 Our residents are encouraged to live healthy and active lives
NSW 11 Keep people healthy and out of hospital
Incidence of high psychological distress Average
About this indicator
Psychological distress is a significant
component of wellbeing that can have a
major impact on the ability of people to work,
study and manage their day-to-day activities.
This indicator uses data from the NSW
Health Survey, which collects data from an
interview, to measure negative emotional
states experienced by respondents. Mental
health issues are also associated with many
other indicators in areas such as housing,
employment, and justice, as well as
community involvement.
The growing scale and significance of mental health disorders are increasingly recognised in Australia,
especially in terms of funding (Department of Health and Ageing 2010). The Northern Sydney and the
Central Coast has the lowest rate of reported mental distress in all of NSW (7.9% of all persons). The
corresponding value for NSW was 12.1%, the neighbouring area of Sydney West (14.6% of all people) and
Sydney South West (14.3%). In neighbouring areas of Sydney, females reported higher levels of distress
than males (16.6% female/12.4% male in Sydney West; 14.6%/13.9% in Sydney South West), whereas in
the Northern Sydney and the Central Coast, the rates for females and males were nearly equal (8.0%/7.9%)
(Population Health Division 2008).
Estimations for 2007/08 suggested that the rate of high or very high psychological distress in Ryde was
10.8%. This rate was higher than Hornsby (8.8%) and Ku-ring-gai (6.9%), but lower than Parramatta
(13.2%), Canada Bay (11.0%) and also the Sydney SD (12.0%). The rate of mental and behavioural
problems in Ryde is estimated to be 8.4% for males and 10.2% among females, and the respective rate for
affective mood problems is 5.4% for males and 6.8% for females (Public Health Information Development
Unit 2010).
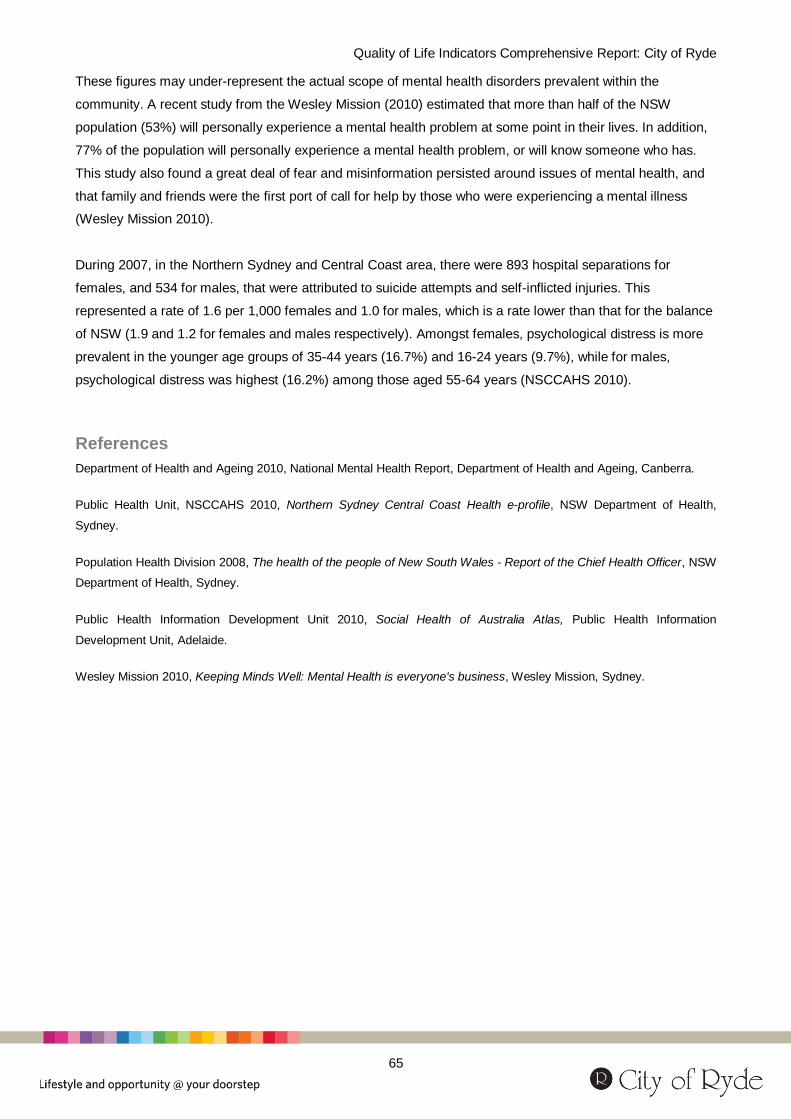
Quality of Life Indicators Comprehensive Report: City of Ryde
65
These figures may under-represent the actual scope of mental health disorders prevalent within the
community. A recent study from the Wesley Mission (2010) estimated that more than half of the NSW
population (53%) will personally experience a mental health problem at some point in their lives. In addition,
77% of the population will personally experience a mental health problem, or will know someone who has.
This study also found a great deal of fear and misinformation persisted around issues of mental health, and
that family and friends were the first port of call for help by those who were experiencing a mental illness
(Wesley Mission 2010).
During 2007, in the Northern Sydney and Central Coast area, there were 893 hospital separations for
females, and 534 for males, that were attributed to suicide attempts and self-inflicted injuries. This
represented a rate of 1.6 per 1,000 females and 1.0 for males, which is a rate lower than that for the balance
of NSW (1.9 and 1.2 for females and males respectively). Amongst females, psychological distress is more
prevalent in the younger age groups of 35-44 years (16.7%) and 16-24 years (9.7%), while for males,
psychological distress was highest (16.2%) among those aged 55-64 years (NSCCAHS 2010).
References
Department of Health and Ageing 2010, National Mental Health Report, Department of Health and Ageing, Canberra.
Public Health Unit, NSCCAHS 2010, Northern Sydney Central Coast Health e-profile, NSW Department of Health,
Sydney.
Population Health Division 2008, The health of the people of New South Wales - Report of the Chief Health Officer, NSW
Department of Health, Sydney.
Public Health Information Development Unit 2010, Social Health of Australia Atlas, Public Health Information
Development Unit, Adelaide.
Wesley Mission 2010, Keeping Minds Well: Mental Health is everyone's business, Wesley Mission, Sydney.

Quality of Life Indicators Comprehensive Report: City of Ryde
66
Key indicator: People with a disability Related 2021 Goals
Ryde 2.2 All residents feel supported and cared for in their community through the provision of ample services and facilities.
NSW 14 Increase opportunities for people with a disability by providing supports that meet their individual needs and realise their potential
About this indicator
People with disabilities may be more likely
to experience economic hardship,
unemployment, family breakdown and social
isolation. Profound or severe disability
means that a person may need help or
assistance in one or more of three core
activity areas: self-care, mobility and
communication. Assisting people with a
disability to gain meaningful employment
that accommodates their disability is
important for keeping people connected to
their community, maintaining their economic
contribution and giving them a measure of
independence.
In 2006, 4.1% of Ryde’s total population was living with a profound or severe disability. Among the
comparator LGAs, only Parramatta had a higher rate (4.6%), while Ryde’s rate was slightly higher than that
in Canada Bay (3.5%), Hornsby (3.4%) and Ku-ring-gai (2.7%), as well as in the Sydney SD (3.8%). Figure 1
below, breaks down these proportions by age, and living situation, where in Ryde 2.3% are aged 64 and
under, and 2.5% are aged 65 and over.
As shown in Figure 1, Ryde also has a relatively high proportion of people aged 64 years and under who do
not live in the community (0.3%), which refers to people living in long-term residential accommodation in
nursing homes, accommodation for the retired or aged (not self-contained), hostels for the disabled and
psychiatric hospitals. The rate of older people not living in the community is 0.7%, similar to that in the
comparator LGAs (Hornsby, 1.0%; Parramatta, 0.8%; Ku-ring-gai, 0.7%; and Canada Bay, 0.5%) (Public
Health Information Development Unit 2010).
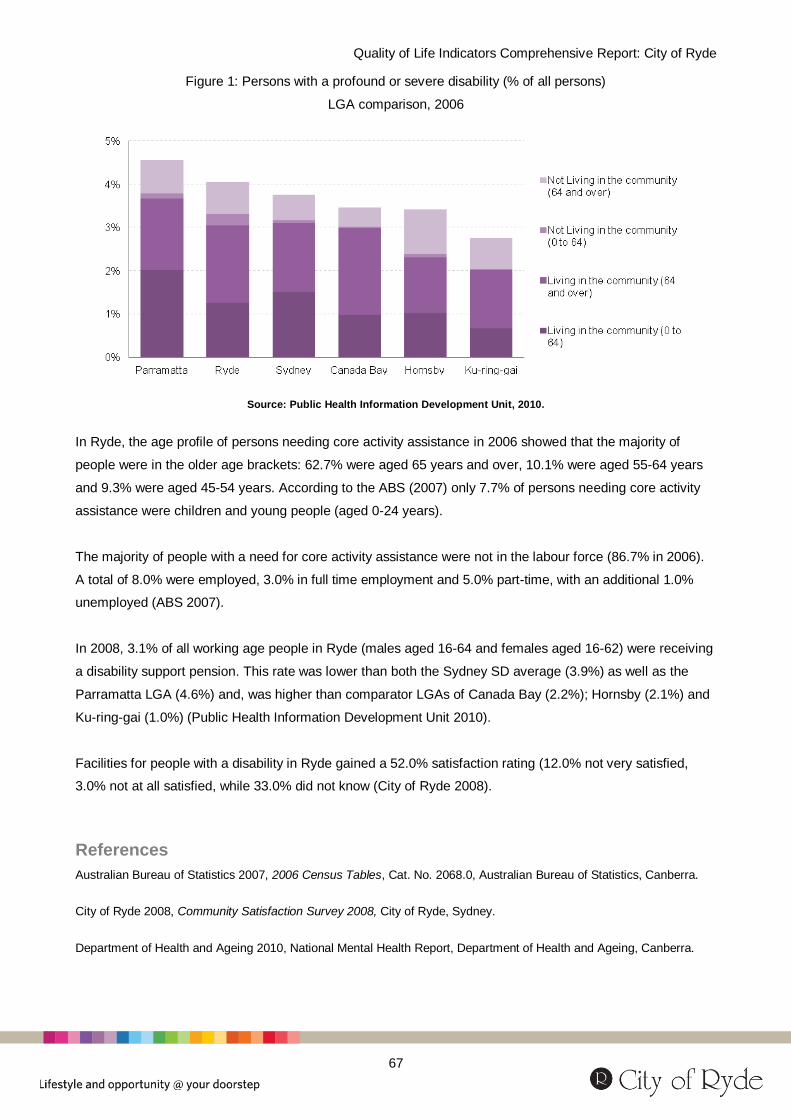
Quality of Life Indicators Comprehensive Report: City of Ryde
67
Figure 1: Persons with a profound or severe disability (% of all persons)
LGA comparison, 2006
Source: Public Health Information Development Unit, 2010.
In Ryde, the age profile of persons needing core activity assistance in 2006 showed that the majority of
people were in the older age brackets: 62.7% were aged 65 years and over, 10.1% were aged 55-64 years
and 9.3% were aged 45-54 years. According to the ABS (2007) only 7.7% of persons needing core activity
assistance were children and young people (aged 0-24 years).
The majority of people with a need for core activity assistance were not in the labour force (86.7% in 2006).
A total of 8.0% were employed, 3.0% in full time employment and 5.0% part-time, with an additional 1.0%
unemployed (ABS 2007).
In 2008, 3.1% of all working age people in Ryde (males aged 16-64 and females aged 16-62) were receiving
a disability support pension. This rate was lower than both the Sydney SD average (3.9%) as well as the
Parramatta LGA (4.6%) and, was higher than comparator LGAs of Canada Bay (2.2%); Hornsby (2.1%) and
Ku-ring-gai (1.0%) (Public Health Information Development Unit 2010).
Facilities for people with a disability in Ryde gained a 52.0% satisfaction rating (12.0% not very satisfied,
3.0% not at all satisfied, while 33.0% did not know (City of Ryde 2008).
References
Australian Bureau of Statistics 2007, 2006 Census Tables, Cat. No. 2068.0, Australian Bureau of Statistics, Canberra.
City of Ryde 2008, Community Satisfaction Survey 2008, City of Ryde, Sydney.
Department of Health and Ageing 2010, National Mental Health Report, Department of Health and Ageing, Canberra.

Quality of Life Indicators Comprehensive Report: City of Ryde
68
Public Health Unit, NSCCAHS 2010, Northern Sydney Central Coast Health e-profile, NSW Department of Health,
Sydney.
Population Health Division 2008, The health of the people of New South Wales - Report of the Chief Health Officer, NSW
Department of Health, Sydney.
Public Health Information Development Unit 2010, Social Health of Australia Atlas, Public Health Information
Development Unit, Adelaide.

Quality of Life Indicators Comprehensive Report: City of Ryde
69
Key indicator: Infant mortality and child health Related 2021 Goals
Ryde 2.1 Our residents are encouraged to live healthy and active lives
NSW 11 Keep people healthy and out of hospital
Infant mortality Fair
Low birth weight babies Average
Smoking during pregnancy Good
Child immunisation Fair
About this indicator
A child’s first few years are of paramount
importance, and play a critical role in
establishing good health and the skills and
attitudes that allow an individual to achieve
optimum wellbeing throughout their life. Low
birth weight and malnutrition is associated
with poor health outcomes and potential
impairments to the long-term health of
children (Australian Bureau of Statistics
2001).
The rate of infant mortality in Ryde was 4.0 per 1,000 births between 2003 and 2007 (see Figure 1, below).
This rate is slightly lower than that for the Sydney SD and Parramatta (both 4.1). In comparison, Ku-ring-gai
(3.2), Canada Bay (3.1) and Hornsby (3.1) have lower infant mortality rates. Over this period, the total
number of infant deaths in Ryde was 25, which is lower than both Parramatta (47) and Hornsby (27) (Public
Health Information Development Unit 2010).

Quality of Life Indicators Comprehensive Report: City of Ryde
70
Figure 1: Annual average infant mortality rate, per 1,000 live births
LGA comparison, 2003-07
Source: Public Health Information Development Unit, 2010.
Babies born with a low birth weight are at a higher risk of mortality, and are more likely to develop poor
health outcomes in the long term. Figure 2, below, shows the proportion of all babies that were considered to
be of low birth weight in Ryde (5.3%). This rate is lower than Parramatta (5.9%) and the Sydney SD (6.1%),
but slightly higher than Canada Bay (5.0%), Hornsby (5.0%) and Ku-ring-gai (4.9%).
Smoking during pregnancy is also associated with poorer child health outcomes. The proportion of mothers
smoking during their pregnancy in Ryde (2.3%) is lower than most comparator LGAs (Parramatta, 5.7%;
Canada Bay, 3.3%; and Hornsby, 2.6%). Smoking during pregnancy is significantly less prevalent in all of
these LGAs in comparison with the Sydney SD rate of 8.8% (Public Health Information Development Unit
2010).
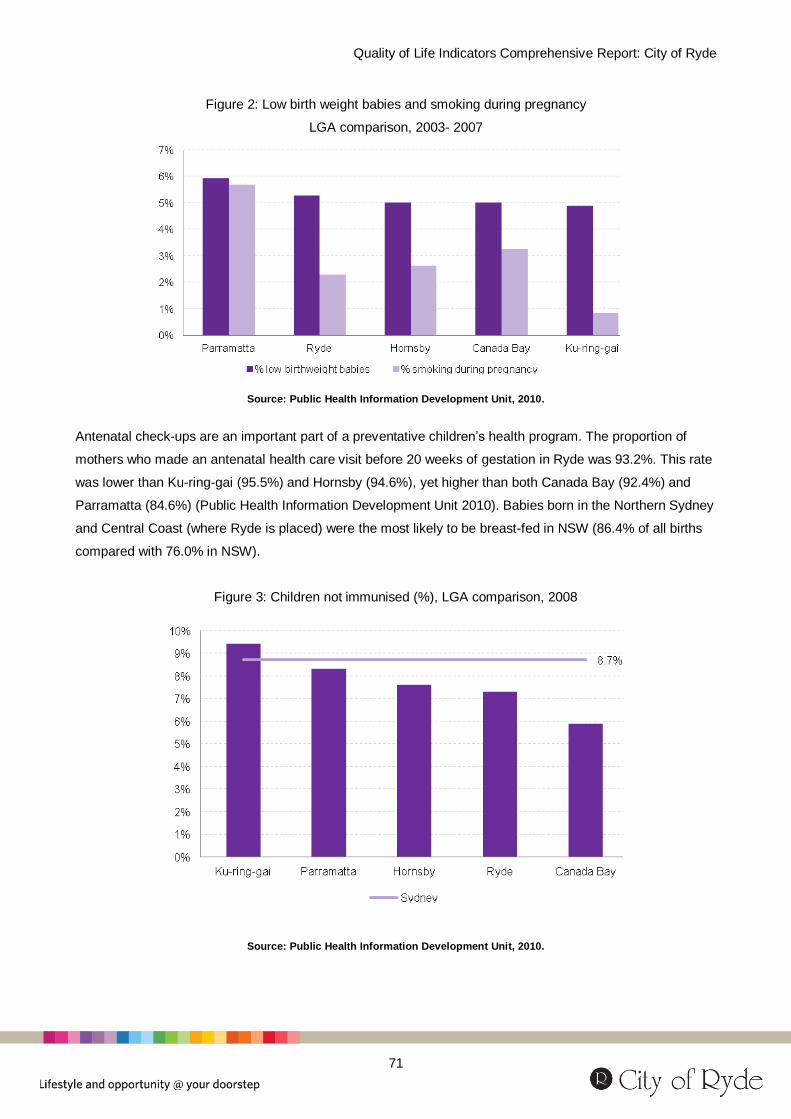
Quality of Life Indicators Comprehensive Report: City of Ryde
71
Figure 2: Low birth weight babies and smoking during pregnancy
LGA comparison, 2003- 2007
Source: Public Health Information Development Unit, 2010.
Antenatal check-ups are an important part of a preventative children’s health program. The proportion of
mothers who made an antenatal health care visit before 20 weeks of gestation in Ryde was 93.2%. This rate
was lower than Ku-ring-gai (95.5%) and Hornsby (94.6%), yet higher than both Canada Bay (92.4%) and
Parramatta (84.6%) (Public Health Information Development Unit 2010). Babies born in the Northern Sydney
and Central Coast (where Ryde is placed) were the most likely to be breast-fed in NSW (86.4% of all births
compared with 76.0% in NSW).
Figure 3: Children not immunised (%), LGA comparison, 2008
Source: Public Health Information Development Unit, 2010.
Quality of Life Indicators Comprehensive Report: City of Ryde
72
A child’s health can be improved by immunising against major communicable diseases. In Ryde during 2008,
only 7.3% of children were not immunised. This rate is lower than Ku-ring-gai (9.4%), Parramatta (8.3%),
Hornsby (7.6%) and the Sydney SD (8.7%; see Figure 3, above). Only Canada Bay had a lower rate of non-
immunisation (5.9%; Public Health Information Development Unit 2010).
References
Australian Bureau of Statistics 2001, Measuring Wellbeing, Cat. No. 4160.0, Australian Bureau of Statistics, Canberra.
Public Health Information Development Unit 2010, Social Health of Australia Atlas, Public Health Information
Development Unit, Adelaide.

Quality of Life Indicators Comprehensive Report: City of Ryde
73
Key indicator: Fertility rate Related 2021 Goals
Ryde 2.1 Our residents are encouraged and supported to live healthy and active lives.
About this indicator
The total fertility rate is the average number
of babies a woman can be expected to bear
during her reproductive life (15-49 years).
Higher fertility rates are usually associated
with social disadvantage. Fertility rate can
also help identify future needs of the
community.
During 2008 in Ryde, the total fertility rate was 1.6 children per female; this rate is slightly lower than the
Sydney SD rate of 1.8 (see Figure 1, below). In addition, this rate is also lower than all of the comparator
LGAs; Parramatta (1.9), Hornsby (1.8), Canada Bay (1.7) and Ku-ring-gai (1.7). Whilst this rate is lower, the
total number of births in Ryde was 1,431, lower only than Parramatta (2,827) and Hornsby (1,768), and
higher than Canada Bay (1,171) and Ku-ring-gai (844).
Figure 1: Total fertility rate, LGA comparison, 2008
Source: Australian Bureau of Statistics, 2008.
References
Australian Bureau of Statistics 2008, National Regional Profiles, Cat. No. 1379.0.55.001, Australian Bureau of Statistics,
Canberra.

Quality of Life Indicators Comprehensive Report: City of Ryde
74
Key indicator: Carers and aged care Related 2021 Goals
Ryde 2.2 All residents feel supported and cared for in their community through the provision of ample services and facilities.
NSW 14 Increase opportunities for people with a disability by providing supports that meet their individual needs and realise their potential.
Aged care places Average
About this indicator
Carers make a significant contribution to
society, and the reasons for requiring a
carer are vast. The physical and emotional
demands, as well as the economic
significance of carers is very large. This
indicator examines available data for two
types of care. Firstly, it considers the levels
of assistance provided to people with a
disability and secondly, it considers the care
provided to older people through residential
and community care facilities.
In 2006, 9.6% of the adult population of Ryde were carers for people with a disability. This rate was slightly
lower than the Sydney SD rate (9.8%), and that of comparator LGAs Ku-ring-gai (11.2%), Hornsby (10.4%)
and Canada Bay (9.9%; see Figure 1, below). Figure 1 also shows the relative ratio of carers to persons
with a severe disability. According to the Public Health Information Development Unit (2010), for Ryde this
ratio is 2.0 which is lower than the corresponding ratios in Ku-ring-gai (3.2), Hornsby (2.4), and Canada Bay
(2.4), but is higher than that for Parramatta (1.7).

Quality of Life Indicators Comprehensive Report: City of Ryde
75
Figure 1: People providing assistance to persons with a disability (%).
LGA comparison, 2006
Source: Public Health Information Development Unit, 2010.
In Ryde, carers were most likely to be in the middle age bracket, with the greatest proportion of carers aged
between 45-54 years (23.6%), followed by those aged 35-44 years (20.3%) and 55-64 years (19.5%). Of
those with a severe disability in Ryde, the majority (63.4%) were aged 65 years and over (Public Health
Information Development Unit 2010).
Carers in the community also play an important role in providing assistance and care for other older people.
Figure 2, below, indicates the prevalence of aged care places (by LGA), and shows that there were 112.8
aged care places per 1,000 population for persons aged 70 and over in Ryde. There were significantly more
places per 1,000 persons aged over 70 in Parramatta (175.5) and Hornsby (161.0). In Ryde, the majority of
aged care places are high-level residential care (53.7 per 1,000 people aged 70 and over), with a smaller
proportion low-level residential care (44.8), supplemented by 16.0 in community care places (Public Health
Information Development Unit 2010).

Quality of Life Indicators Comprehensive Report: City of Ryde
76
Figure 2: Aged care places per 1,000 population aged 70 and over,
various types, LGA comparison, 2009
Source: Public Health Information Development Unit, 2010.
References
Public Health Information Development Unit 2010, Social Health of Australia Atlas, Public Health Information
Development Unit, Adelaide.

Quality of Life Indicators Comprehensive Report: City of Ryde
77
Key indicator: Social participation Related 2021 Goals
Ryde 2.3 Residents feel secure and included in an environment where they can connect socially and are supported by their neighbours.
NSW 24 Make it easier for people to be involved in their communities
About this indicator
Social participation is an important part of
promoting harmony in a community. Contact
with friends and family is widely thought to
be important in that it provides individuals
with an identity, social roles and social
support mechanisms, helping increase their
happiness, health and longevity (ABS 2001).
Social participation is considered a positive
factor in the wellbeing of individuals and
communities alike.
There was no LGA-level data available on this topic. Data collection was undertaken on a state level, and
therefore this indicator only considers data from NSW. Given the strong growth in the use of social media,
smartphones and all other forms of digital communication since 2006, it is likely that there will be a significant
change to the data in this area as a result.
The most common type of social activity undertaken in 2006 was visiting or being visited by friends (92.3% of
people in NSW over a three month period). Figure 1, below, shows that this is a popular activity across all
age groups, which slightly declines in the older age groups of 65-74 (86.7%) and 75 or over (86.3%).
Outdoor and indoor activities with friends were also popular across most age groups, with participation
slightly decreasing in the older age groups (see Figure 1). According to the ABS (2006) internet social
activities were also more common among younger people (39.3% of people aged 18-24 years and 29.9% of
people aged 35-44).

Quality of Life Indicators Comprehensive Report: City of Ryde
78
Figure 1: Social Activity in the last 3 months, by age, NSW, 2006
Source: Australian Bureau of Statistics, 2006.
In 2006, the dominant form of communication in NSW remained as a fixed telephone line (used by 89.6% of
respondents), followed by mobile or SMS (77.3%), email or online chat (46.5%) and finally, mail or fax
(28.2%). Communication formats varied according to age groups, with mobiles or SMS most common for
people aged 18-24 years and those aged 25-34 years (93.9% and 95.4%), while fixed phone lines were the
most common form for all age groups over 35 years (well over 90% for all age groups). According to the ABS
(2006) the popularity of using a mobile phone SMS, email or online chat decreases significantly with age
(that is, 27.3% and 25.6% respectively, for those aged 75 and over).
Social relationships can also extend to a support network from people outside the household. According to
the ABS General Social Survey, in 2006 residents in NSW generally had a high level of certainty that they
could ask people living outside of their household for small favours. Persons aged between 25-34 years had
the highest degree of certainty (96.1%), while those aged between 65-74 years had the lowest confidence
(87.0%). Similar results were observed when it came to asking people living outside the household for
support in times of crisis. Residents aged between 25-34 years had the highest certainty of asking for
support (96.1%), while those aged 45-54 years had the lowest (90.8%). Family members (78.4%) and
friends (67.8%) were the preferred sources of support in times of crisis, followed by neighbours (35%) and
work colleagues (20.4%).
References
Australian Bureau of Statistics 2001, Measuring Wellbeing, Cat No. 4160.0, Australian Bureau of Statistics, Canberra.
Australian Bureau of Statistics 2006, General Social Survey, Cat. No. 4159.0, Australian Bureau of Statistics, Canberra.

Quality of Life Indicators Comprehensive Report: City of Ryde
79
Discussion There are many positive indicators of wellbeing in Ryde. For instance, a low proportion of the population
reports their health to be fair or poor, compared with people living in surrounding areas. However, some
indicators also show some troubling trends in risky behaviour and avoidable mortality. The rate of avoidable
mortality in Ryde was relatively high, especially among males, and preventable mortality was the major
contributor to this high rate. Adult’s show some risky health behaviours, that is, 16% of adults are medically
classified as obese, another one in three are overweight, and 32.1% of the population are considered
physically inactive. There are also indications of inadequate nutrition and unhealthy eating.
These all suggest there is room for improvement in eliminating health risks and improving
personal health and wellbeing. How can we encourage people to be more proactive in improving
their own health and wellbeing, whilst at the same time avoiding preventable health risks?
There are some people living in Ryde that need assistance and care. This includes the 4.1% of the
population living with a profound or severe disability, a rate higher than the Sydney SD rate of 3.8%. These
indicators have also shown that a low proportion of the population in Ryde are carers for people with a
profound or severe disability, however the burden on these carers is relatively high. A low rate (3.1%) of the
working age population receives a disability support payment.
How can we support and ease the burden on carers whilst also assisting those in need of care?
A significant proportion of those people who need care are older people. Ryde has significantly fewer aged
care places than both Parramatta and Hornsby per 1,000 persons aged over 70 years. Of these places, the
majority are high-level care facilities, with far fewer community care positions. However, a much greater
proportion of older people with a profound or severe disability are living in the community, than people who
are not.
Is the profile of aged care options appropriate in Ryde? Should aged care be more of a priority?
Quality of Life Indicators Comprehensive Report: City of Ryde
80
A City of Prosperity Outcome
Creating urban centres which champion business, innovation and technology to stimulate economic growth and local jobs
Introduction Measures of prosperity usually revolve around indicators of economic resources and opportunities. It is
increasingly accepted, however, that economic measures are only a partial indicator of individual wellbeing
and of social progress (Stiglitz, Sen and Fitoussi 2009; Costanza, Hart, Posner and Talberth 2009).
Recognising the limitations of purely economic statistics, new approaches to measuring social progress have
been developed, including in Australia, that incorporate a wide variety of measures of wellbeing (ABS 2010).
Accordingly, while this chapter focuses on measures of economic resources and stability as indicators of
prosperity, these results should be considered within the context of the findings of other measures of
personal wellbeing included in other chapters of this report.
There are many ways to measure economic prosperity. By using a variety of indicators, this chapter aims to
explore the concept of prosperity in detail and from multiple perspectives. This chapter begins by considering
composite measures of socio-economic wellbeing, and then moves to disaggregating socio-economic
measures into some of the most useful measures of economic prosperity, including income, employment and
unemployment. These measures are useful because living standards of individuals and families are strongly
associated with prosperity and their command over economic resources. People with limited economic
resources can experience hardship and may fail to meet the basic costs of living, while greater levels of
economic resources are associated with greater opportunities. Social wellbeing is also affected by the
quantity, distribution and sufficiency of economic resources. Finally, this chapter probes further into
indicators of the lack of prosperity among specific social groups. This includes young people, older people,
and examining joblessness, income support and children in jobless and welfare-dependent families.
When reading this chapter and interpreting the results, it is important to keep in mind that there are some
limitations to some of the data sources from a timeliness perspective. Specifically, available data for some of
the indicators in this chapter may not capture the economic and social effects that have resulted from the
global financial crisis. Despite Australia’s national economy remaining strong throughout this crisis, the
ramifications on individuals and families are not fully understood, and may not yet be captured in the data
employed in this research.
References
Australian Bureau of Statistics 2010, Measures of Australia’s Progress, Australian Bureau of Statistics, Canberra.
Costanza, R., Hart, M., Posner, S. and Talberth, J. 2009, Beyond GDP: The need for new measures of progress, Boston
University, Boston.

Quality of Life Indicators Comprehensive Report: City of Ryde
81
Stiglitz, J., Sen, A. and Fitoussi, J.-P. 2009, Report by the Commission on the Measurement of Economic Performance
and Social Progress, Commission on the Measurement of Economic Performance and Social Progress, Paris.

Quality of Life Indicators Comprehensive Report: City of Ryde
82
Key indicator: SEIFA Related 2021 Goals
Ryde 3.1 Our community and businesses flourish and prosper in an environment of innovation, progression and economic growth.
NSW 13 Better protect the most vulnerable members of our community and break the cycle of disadvantage
Socio-economic Disadvantage Average
About this indicator
Socio-Economic Indexes for Areas (SEIFA)
produced by the Australian Bureau of
Statistics (ABS) summarises a range of
socio-economic variables associated with
disadvantage, as well as a lack of
advantage, and ranks areas according to
these results. While a higher score for an
index denotes a better result, a higher
relative ranking (within the state or Australia)
indicates a worse score because the most
disadvantaged areas are ranked highest.
SEIFA’s Index of Relative Socio-economic Disadvantage condenses a range of social and economic
indicators that are associated with disadvantage, for example, unemployment and low educational
attainment. Scores for LGAs in the north and north-western parts of Sydney were generally very high,
indicating a positive result. Ryde attained a score of 1054 (8th decile), which indicates a greater concentration
of disadvantage in this LGA than for neighbouring LGAs of Canada Bay (1077), Hornsby (1100) and Ku-ring-
gai (1143). However, Ryde’s score is higher than that for Parramatta (987).

Quality of Life Indicators Comprehensive Report: City of Ryde
83
Figure 1: SEIFA scores, comparator LGAs, 2006
Source: Australian Bureau of Statistics, 2008.
The more complex indicator (Index of Relative Socio-economic Advantage and Disadvantage) captures
measures of advantage that is, attaining a tertiary education, as well as disadvantage. As Ryde had a higher
relative score (1097, in the 9th decile) than that for disadvantage only, this indicates a concentration of
advantage in the LGA (ABS 2008).
The Index of Economic Resources focuses on access to the economic resources of income, wealth as well
as measures of consumption, for example housing expenditure. Ryde performed well in the rankings when
compared with other NSW LGAs (129 out of 153 LGAs, where the higher the ranking the worse off the LGA),
but Ryde’s score of 1046 was lower than the comparator LGAs of Canada Bay (1081), Hornsby (1114) and
Ku-ring-gai (1178). However, this score was higher than that of Parramatta (977).
The Index of Education and Occupation provides an overall measure of the educational and occupational
characteristics of communities (e.g. proportion of people in a skilled occupation). Ryde ranked relatively well
in the state (138 of 153 LGAs, and in the 9th decile), however Ryde’s score of 1104 was slightly lower than
that of the other LGAs with the exception of Parramatta.
References
Australian Bureau of Statistics 2001, Census of Population and Housing: Socio-Economic Indexes for Areas (SEIFA),
Cat. No. 2033.0.55.001, Australian Bureau of Statistics, Canberra.

Quality of Life Indicators Comprehensive Report: City of Ryde
84
Key indicator: Dependency ratio Related 2021 Goals
Ryde 3.1 Our community and businesses flourish and prosper in an environment of innovation, progression and economic growth.
NSW 1 Better protect the most vulnerable members of our community and break the cycle of disadvantage
Dependency ratio Good
About this indicator
This indicator is an approximate measure of
the burden to support economic dependents
by those who may be engaged in the
workforce. As the proportion of people
engaged in the workforce decreases in
relation to those who are not, there is
increased strain on the economically
productive to support the upbringing and
income support of the economically
dependent (such as children, or the elderly).
It is important to note, however, that this
measure does not consider whether or not
those over 65 are actually economically
dependent on those of working age.
According to Vinson (2007), the dependency ratio is:
A higher ratio represents more people of working age for every individual who is not of working age, and thus
implies a lower dependency burden.
In Ryde, there were 2.3 working age persons for every person who may be considered economically
dependent (under 15 and over 65; ABS, 2007). This represents a slightly lower burden on the working age
population of Ryde than that for most of the comparator LGAs (Parramatta, 2.2; Hornsby, 2.1; and Ku-ring-
gai, 1.7) with the exception of Canada Bay (2.4), as well as the dependency ratios for the Sydney SD (2.2)
and for NSW (2.0). Furthermore, there were 4.2 working age persons per child under 15, representing a
lower burden for Ryde than comparator LGAs, with a similar ratio for Canada Bay. There were 5.0 working

Quality of Life Indicators Comprehensive Report: City of Ryde
85
age people per older person (over 65) in Ryde, which is a ratio lower (representing a relatively higher
burden) than all other comparator LGAs other than Ku-ring-gai.
Figure 1: Dependency ratio forecast, Ryde, 2006
Source: ID Consulting Pty Ltd, 2010 and the Department of Health and Ageing, 2008.
Figure 1, above, shows the trend in the dependency ratio predicted to 2027, using two alternative forecast
methods. This shows a clear decrease in the dependency ratio over time, implying that there will be fewer
people of working age per ‘dependent’ person, causing a steady rise in the burden placed on those of
working age to support those not able to work over the next decades (ID Consulting Pty Ltd 2010 and the
Department of Health and Ageing 2008).
References
Department of Health and Ageing 2008, The Australian Population, Statistical Local Area Population Projections, 2007-
2027, Department of Health and Ageing, Canberra.
ID Consulting Pty Ltd 2010, Forecast.ID: City of Ryde Population Forecasts, ID Consulting Pty Ltd, Sydney.
Vinson, T. 2007, Dropping off the edge: the distribution of disadvantage in Australia, Jesuit Social Services and Catholic
Social Services Australia, Sydney

Quality of Life Indicators Comprehensive Report: City of Ryde
86
Key indicator: Average income and incidence of low income Related 2021 Goals
Ryde 3.1 Our community and businesses flourish and prosper in an environment of innovation, progression and economic growth.
NSW 13 Better protect the most vulnerable members of our community and break the cycle of disadvantage
Average income Fair
About this indicator
Income plays an important part in shaping
life opportunities. Levels of income, and the
incidence of low incomes, can be used to
indicate social health, improve an
individual’s participation and personal quality
of life, including their ability to access basic
needs and also recreation and discretionary
expenses. This indicator includes only wage
and salary earners.
Figure 1, below, shows that in 2007/08, the average annual income for the 52,147 employees in Ryde was
$50,417. This average income is slightly higher than that of workers in Parramatta, who earned on average
$43,837. The other comparator LGAs of Ku-ring-gai ($73,484), Canada Bay ($58,705) and Hornsby
($54,128) had average incomes that were higher than those earned in Ryde.
Figure 1: Average annual wage & salary income ($) LGA comparison, 2008
Source: Australian Bureau of Statistics, 2010.

Quality of Life Indicators Comprehensive Report: City of Ryde
87
The trend in income over time for Ryde is shown below. According to the ABS (2010), the average income
has been increasing steadily since 2004 at an overall rate of 3.8% p.a.
Figure 2: Average annual income, time series, Ryde, 2008
Source: Australian Bureau of Statistics, 2010.
Average income levels do not capture the diversity, distribution and equality of incomes for a region. Figure 3
below, provides an additional indicator on the distribution of income in Ryde in 2008. The incidence of low
income levels is a common method of mapping disadvantage; however there is no common consensus on
measuring poverty or low incomes. Data from the Australian Bureau of Statistics uses a figure of $249 or
less per week as a measure of low income. According to this definition, 17.3% of the population were low
income earners (ABS 2010). The majority of workers in the LGA (67.5%) earn moderate incomes of between
$250 and $1,599 per week.
Figure 3: Individual income distribution, Ryde, 2008
Source: Australian Bureau of Statistics, 2010.
In Ryde, low income earners were predominantly younger people, that is, 41.5% of all low income earners
were aged between 15-24 years, whilst a further 20.9% were aged between 25-34 years. Females were
much more likely to earn low incomes, with 20.2% of females in Ryde earning $249 or less per week,
compared with 14.6% of males (ABS 2010). The 2006 Census revealed that workers in the retail (24.2%);

Quality of Life Indicators Comprehensive Report: City of Ryde
88
arts and recreation (19.4%); and accommodation (33.6%) industries were the most likely to earn incomes
below the benchmark of $249 or less per week (ABS 2007).
References
Australian Bureau of Statistics 2007, 2006 Census Tables, Cat. No. 2068.0, Australian Bureau of Statistics, Canberra.
Australian Bureau of Statistics 2010, Wage and Salary Earner Statistics, Cat. No. 5673.0.55.003, Australian Bureau of
Statistics, Canberra.

Quality of Life Indicators Comprehensive Report: City of Ryde
89
Key indicator: Financial stress and depth of deficient income Related 2021 Goals
Ryde 3.1 Our community and businesses flourish and prosper in an environment of innovation, progression and economic growth.
NSW 5 Place downward pressure on the cost of living
Food insecurity Average
About this indicator
Financial stress measures how households
and families can meet their necessary and
discretionary financial commitments.
Financial stress is considered to have
significant impacts on family relationships
and the ability to make decisions and think
clearly (Wesley Mission 2010). Low income
is one factor leading to high financial stress;
however high-income households often also
feel financial stress to meet an array of extra
demands on their financial resources.
Understanding how many people are in high
financial stress indicates those most likely to
have trouble accessing resources and
provides a broader picture when examining
the impact of resources on social exclusion.
Food insecurity is one measure of financial stress, measuring the ability of individuals and households to
acquire appropriate and nutritious food on a regular and reliable basis, using socially acceptable means.
According to the NSW Centre for Public Health Nutrition (2003) recorded statistics on food security is very
limited and is often considered to underestimate the true scale of food insecurity in Australia. The Centre for
Social Impact developed an indicator that measures the risk of food insecurity, which is a composite of a
number of measures of socio-economic risk factors, associated with food insecurity. According to this
indicator, 4.5% of Ryde’s population is at risk of food insecurity (Centre for Social Impact (forthcoming). This
rate is lower than that for Parramatta (5.6%). however it is higher than that of LGAs of Canada Bay (4.0%),
Hornsby (3.9%) and Ku-ring-gai (3.1%). These are displayed in Figure 1, below.

Quality of Life Indicators Comprehensive Report: City of Ryde
90
Figure 1: Risk of food security (%), LGA comparison, 2010
Source: Centre for Social Impact (forthcoming).
The above indicator assesses the risk of food insecurity, not its actual occurrence. Accurate data on the
incidence of food insecurity is limited; however, the Centre for Epidemiology and Research collects regional
data on childhood health indicators, including food insecurity. Ryde is part of the Northern Sydney and
Central Coast Local Health District, where 4.4% of 0-8 year olds are estimated to have suffered from food
insecurity in the last 12 months: this rate is equal to that of Sydney West (4.4%) and lower than that of
Sydney South West (7.3%). For children aged 9-15 years, incidence of food insecurity is 5.3%, a rate lower
than neighbouring areas of Sydney West (7.9%) or Sydney South West (6.5%). Food insecurity also tends to
be concentrated in areas of socioeconomic disadvantage, as indicated by the Centre for Epidemiology and
Research (2010).
The ABS (2006) uses three measures of financial stress for metropolitan areas in NSW (not by LGA): a
household’s capacity to raise emergency cash, incidence of cash flow problems and taking dissaving
actions. Of the populations within the major cities of NSW, 14.8% were unable to raise $2,000 within a week
in an emergency. An even greater proportion of people had cash flow problems, or took a dissaving action in
2006 (18.4% and 19.6% repectively). These proportions have increased slightly since 2002, however they do
not capture the effects of the financial turmoil of the recent few years (ABS 2006). A significant factor in
Sydney is the high cost of housing.
Wesley Mission has evaluated the effects of this crisis in detail and suggests that financial stress has
increased significantly across Sydney since 2006. Despite this, rates of financial stress in Sydney’s North
(including Ryde, Ku-ring-gai and Hornsby) has actually decreased (from 31% in 2002 to 24% in 2010), which
contrasts with the very high increases in other areas of Sydney such as South West and Outer West, and
Mid and North West Sydney (including Parramatta: this area show rates of up to 42% of the population under
financial stress in 2010). This study by Wesley Mission (2010) showed that financial stress tends to be
concentrated in single parent families; people aged 45-54 years and those who have attained lower levels of
education. The study also emphasises the association between financial stress and anxiety, health, social
problems and relationship issues.

Quality of Life Indicators Comprehensive Report: City of Ryde
91
Financial stress is associated with levels of debt, which, according to the report by Welsey Mission found that
those who are financially stressed are more exposed to debt than those not under stress. People under
financial stress are more likely to have one or more credit cards, this includes 55% of the financially stressed.
In addition, households under financial stress have different types of debt compared with those not under
stress, that is, stressed housholds are seen to have over three types of debt on average, with not-stressed
households having approximately two types of debt (Wesley Mission 2010).
References
Australian Bureau of Statistics 2006, General Social Survey, Cat. No. 4159.0, Australian Bureau of Statistics, Canberra.
Centre for Epidemiology and Research. (2010). New South Wales Population Health Survey: 2007-2008 Report on Child
Health. NSW Department of Health.
Centre for Social Impact (forthcoming), Measuring domestic food insecurity in Australia: A proxy indicator approach,
Centre for Social Impact, Sydney.
NSW Centre for Public Health Nutrition 2003, Food security options paper: A planning framework and menu of options
for policy and practice interventions, NSW Department of Health and The University of Sydney, Sydney.
Wesley Mission 2010, Making ends meet: Financial stress is not just about money, Wesley Mission, Sydney.

Quality of Life Indicators Comprehensive Report: City of Ryde
92
Key indicator: Labour force participation Related 2021 Goals
Ryde 3.1 Our community and businesses flourish and prosper in an environment of innovation, progression and economic growth.
NSW 1 Better protect the most vulnerable members of our community and break the cycle of disadvantage
About this indicator
Employment is the main way people obtain
the economic resources needed for day-to-
day living, and to support their living
standards. Participation in the labour force is
a useful measure of social inclusion, and
provides more information than
unemployment figures alone. This indicator
is also recognised as important for building
self-esteem, personal networks and skills
and supporting the community. However,
lack of participation in the labour force can
also be an indicator of prosperity where, for
example, one partner is able to remain at
home to perform home or child-rearing
duties due to the income of the other partner
being sufficient for supporting the family.
Some people may not participate in the labour force due to discouragement or self-perception of being too
young or too old; because they lack skills, knowledge and training; because they have a severe disability or
long-term illness; or because they believe there are no jobs available. People may also self-exclude from the
labour force through acting as a carer or taking up full-time parenting or home duties. Participation in the
work force in Ryde was at 64.5% of the working age population, a rate that is similar to that of the Sydney
SD (67.4%), higher than in Parramatta (61.6%) and Ku-ring-gai (62.5%), but lower in Canada Bay (69.7%)
and Hornsby (68.0%; see Figure 1).

Quality of Life Indicators Comprehensive Report: City of Ryde
93
Figure 1: Labour force participation,
LGA comparison, 2008
Source: Public Health Information Development Unit, 2010.
The demands of raising a family often contribute to lower rates of female participation in the labour force. In
2008, female participation in the labour force in Ryde was 55.4%. This rate of participation is higher than that
of the Sydney SD (54.5%); Ku-ring-gai (53.1%) and Parramatta (50.6%), however the rate for Ryde is lower
than that in Canada Bay (58.6%) and Hornsby (58.9%; Public Health Information Development Unit 2010).
Figure 2: Female labour force participation,
LGA comparison, 2008
Source: Public Health Information Development Unit, 2010.
Similarly, family commitments are often associated with limits to workplace engagement for many women. In
Ryde in 2006, only 59% of employed women worked full-time, with 41% working part-time. By comparison,
82% of employed males were employed in a full-time capacity (ABS 2007). The profile of employment also
tends to vary with age, with workers in the middle age brackets (25-64) more likely to work full-time (ABS
2007).
Quality of Life Indicators Comprehensive Report: City of Ryde
94
References
Australian Bureau of Statistics 2007, 2006 Census Tables, Cat. No. 2068.0, Australian Bureau of Statistics, Canberra.
Public Health Information Development Unit 2010, Social Health of Australia Atlas, Public Health Information
Development Unit, Adelaide.

Quality of Life Indicators Comprehensive Report: City of Ryde
95
Key indicator: Local employment and employing businesses Related 2021 Goals
Ryde 3.2 Our city is well designed and planned to encourage new investment, local jobs and business opportunities.
NSW 20 Build liveable centres
About this indicator
Employment is important for building social
networks and feeling part of a local space or
community. When people work locally, they
are more inclined to contribute to the social
life of the community and retail spending is
retained. Local employment is also desirable
as it minimises the personal and
environmental costs of travel. This ratio is
calculated as the number of local jobs
compared to local workers.
Figure 1 below, shows local employment ratios for Ryde and comparator LGAs. The positive ratio for Ryde
shows that there were more jobs in the LGA than workers, indicating that there is an inflow of workers each
day. This indicates that there are many opportunities for local employment for residents of Ryde. Parramatta
also has a high local employment ratio, which indicates that it also attracts a large number of workers relative
to residents. In comparison, Ku-ring-gai, Hornsby and Canada Bay have more residents than workers, with a
net outflow of workers from the area.
Figure 1: Ratio of local jobs to local workers, LGA comparison, 2006.
Source: Australian Bureau of Statistics, 2007.

Quality of Life Indicators Comprehensive Report: City of Ryde
96
Ryde is particularly self-sufficient in white-collar occupations, with over 50% more jobs in Ryde than resident
workers. This percentage includes employment ratios of 1.49 for managers, 1.35 for professionals and 1.27
for technicians and trades workers (Mecone Pty Ltd 2009).
The majority of workers in Ryde are employees, not business owners (89%). Proportionally, there are a
relatively higher number of business owners and managers living in Ryde than working in Ryde (ABS 2007).
Additionally, a study in 2009 by Baum and Mitchell showed that the suburbs of Ryde are ‘low risk’ with
respect to potential job loss. ‘High risk’ suburbs in Sydney tended to be located around the western, south-
western and northern beaches areas.
References
Australian Bureau of Statistics 2007, 2006 Census Tables, Cat. No. 2068.0, Australian Bureau of Statistics, Canberra.
Baum, S., and Mitchell, W. 2009, Red alert suburbs: An employment vulnerability index for Australia's major urban
regions, Centre of Full Employment and Equity, University of Newcastle and Urban Research Program, Griffith
University, Newcastle.
Mecone Pty Ltd 2009, Employment and Centres Study for the City of Ryde, Mecone Pty Ltd, Sydney.
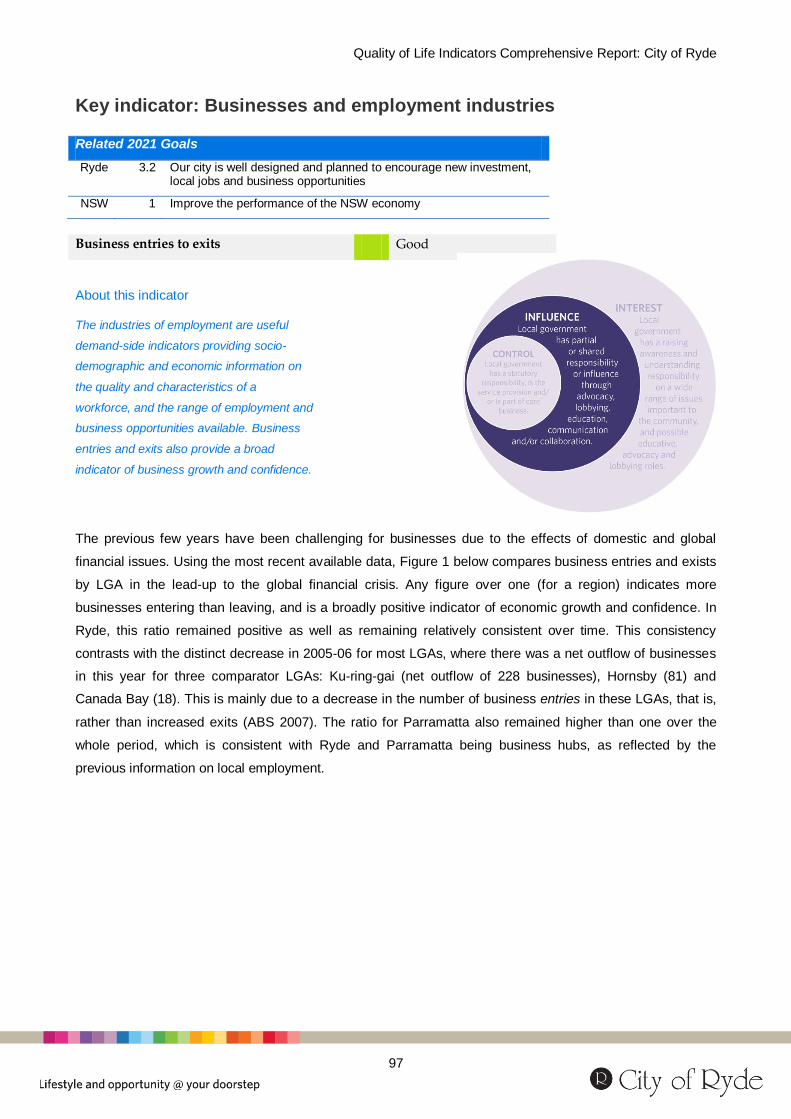
Quality of Life Indicators Comprehensive Report: City of Ryde
97
Key indicator: Businesses and employment industries Related 2021 Goals
Ryde 3.2 Our city is well designed and planned to encourage new investment, local jobs and business opportunities
NSW 1 Improve the performance of the NSW economy
Business entries to exits Good
About this indicator
The industries of employment are useful
demand-side indicators providing socio-
demographic and economic information on
the quality and characteristics of a
workforce, and the range of employment and
business opportunities available. Business
entries and exits also provide a broad
indicator of business growth and confidence.
The previous few years have been challenging for businesses due to the effects of domestic and global
financial issues. Using the most recent available data, Figure 1 below compares business entries and exists
by LGA in the lead-up to the global financial crisis. Any figure over one (for a region) indicates more
businesses entering than leaving, and is a broadly positive indicator of economic growth and confidence. In
Ryde, this ratio remained positive as well as remaining relatively consistent over time. This consistency
contrasts with the distinct decrease in 2005-06 for most LGAs, where there was a net outflow of businesses
in this year for three comparator LGAs: Ku-ring-gai (net outflow of 228 businesses), Hornsby (81) and
Canada Bay (18). This is mainly due to a decrease in the number of business entries in these LGAs, that is,
rather than increased exits (ABS 2007). The ratio for Parramatta also remained higher than one over the
whole period, which is consistent with Ryde and Parramatta being business hubs, as reflected by the
previous information on local employment.

Quality of Life Indicators Comprehensive Report: City of Ryde
98
Figure 1: Business entried to business exits
LGA comparison, time series 2004-07
Source: Australian Bureau of Statistics, 2007.
Looking at these figures in detail, the proportion of employing firms exiting the LGA is increasing relative to
the number of non-employing firms (from 6% of all exiting businesses in 2004, 7% in 2005 to 26% of all
exiting businesses in 2006 and 27% in 2007). This may have further ramifications on overall employment as
well as other socio-economic aspects of employment in Ryde.
Figure 2: Business Types by industry, Ryde, 2007
Source: Australian Bureau of Statistics, 2007.
Figure 2 above, details the type of industries that operate in Ryde. The majority (53.2%) of businesses are
service-oriented. Property and business services is by far the most dominant type (34.8% of all businesses);
followed by education, health, community and culture services (8.2%); and financial and insurance services

Quality of Life Indicators Comprehensive Report: City of Ryde
99
(5.6%). Other major industries include retail and wholesale trade (16.9%) and construction (15.0%). Overall,
these relative proportions are similar to that of the comparator LGAs, and the relative proportions have
remained similar since 2004 (ABS 2007).
References
Australian Bureau of Statistics 2007, Counts of Australian Businesses, including Entries and Exits, Cat. No. 8165.0,
Australian Bureau of Statistics, Canberra.

Quality of Life Indicators Comprehensive Report: City of Ryde
100
Key indicator: Unemployment and labour underutilisation Related 2021 Goals
Ryde 3.1 Our Community and businesses across the city flourish and prosper in an environment of innovation progression and economic growth.
NSW 1 Improve the performance of the NSW economy
Unemployment Average
About this indicator
Obtaining gainful employment for those
seeking it is an important part of personal
well-being and contribution to the economy.
Unemployment is a very commonly used
indicator of the health of a society, as it is
associated with several negative social
outcomes including, low economic resources
and skill loss; as well as susceptibility to loss
of self-esteem, illness and mental stress. A
failure for an individual to find employment
also implies that an economic region is not
fully utilising all available resources.
Recent financial turmoil had ramifications on the employment and financial position of many Australians over
the past couple of years (Wesley Mission 2010). Figure 1, below, shows that Ryde has remained largely
insulated from increasing unemployment between December 2008 and June 2010. Over this period,
unemployment in Ryde was approximately 5%, and unlike some of the comparator LGAs, remained stable
(as opposed to rising) during difficult financial periods. Despite this, the local unemployment rate for Ryde
was consistently higher than that of Canada Bay, Hornsby and Ku-ring-gai over this period (ABS 2010a).
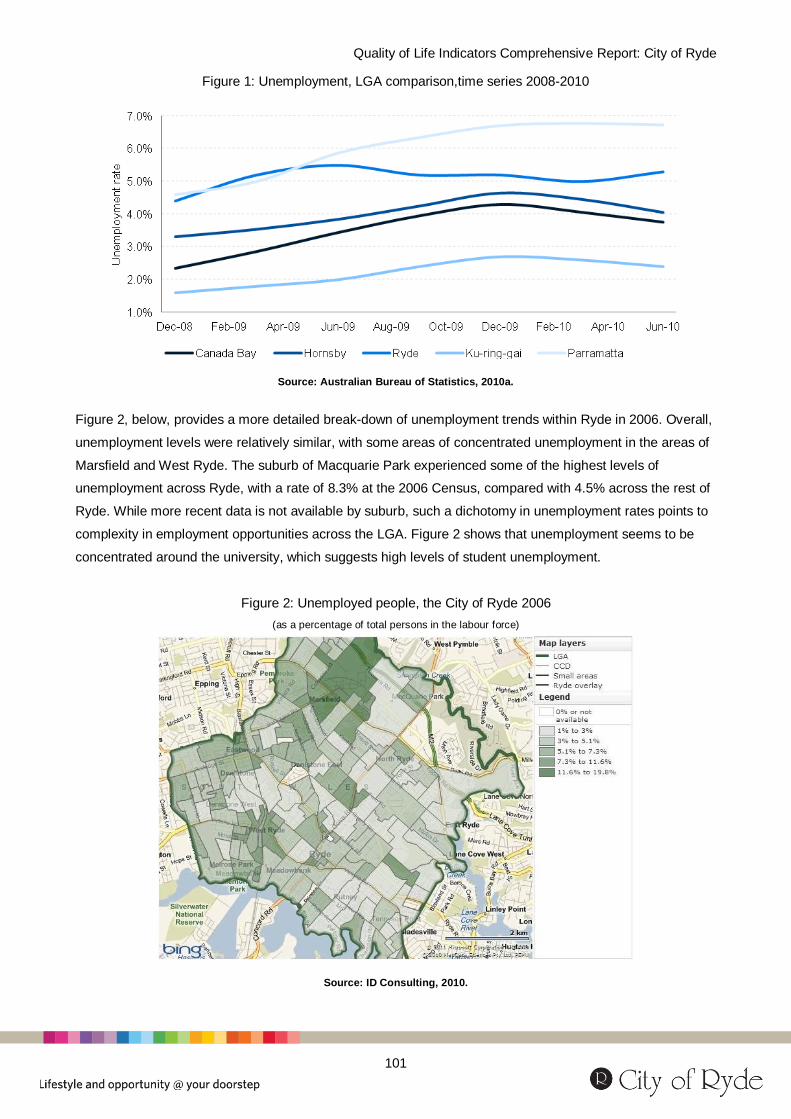
Quality of Life Indicators Comprehensive Report: City of Ryde
101
Figure 1: Unemployment, LGA comparison,time series 2008-2010
Source: Australian Bureau of Statistics, 2010a.
Figure 2, below, provides a more detailed break-down of unemployment trends within Ryde in 2006. Overall,
unemployment levels were relatively similar, with some areas of concentrated unemployment in the areas of
Marsfield and West Ryde. The suburb of Macquarie Park experienced some of the highest levels of
unemployment across Ryde, with a rate of 8.3% at the 2006 Census, compared with 4.5% across the rest of
Ryde. While more recent data is not available by suburb, such a dichotomy in unemployment rates points to
complexity in employment opportunities across the LGA. Figure 2 shows that unemployment seems to be
concentrated around the university, which suggests high levels of student unemployment.
Figure 2: Unemployed people, the City of Ryde 2006
(as a percentage of total persons in the labour force)
Source: ID Consulting, 2010.

Quality of Life Indicators Comprehensive Report: City of Ryde
102
Unemployment is only a partial indicator of disconnection from the workforce, and should be considered in
combination with labour force underutilisation. This measure includes both unemployment and
underemployment, which captures people who are currently employed but are seeking additional work, or
are available to do additional work. This forms a more robust measure of how an area is leveraging its labour
resources. Overall, labour force underutilisation has been consistent since 2001 in NSW at around 12% of
the labour force. Underemployment has broadly remained constant since 2001 (at around 6.5% of the total
labour force), with a spike in 2009 to over 7%. Females are much more likely to be underemployed than
males: in 2009, over 9% of females in the labour force were underemployed. The main reasons for marginal
attachment to the workforce for males was attending an educational facility, and personal long-term health
conditions and disability; for women the most commonly reported reasons for marginal attachment was
caring for children and attending an educational institution (ABS 2010b). Data on underemployment and
underutilisation are not available by LGA.
References
Australian Bureau of Statistics 2010a, Labour Force, 2010, Cat. No. 6202.0, Australian Bureau of Statistics, Canberra.
Australian Bureau of Statistics 2010b, NSW State and Regional Indicators 2009, Cat. No. 1338.1, Australian Bureau of
Statistics, Canberra.
ID Consulting Pty Ltd 2010, Forecast.ID: City of Ryde Population Forecasts, ID Consulting Pty Ltd, Sydney.
Wesley Mission 2010, Making ends meet: Financial stress is not just about money, Wesley Mission, Sydney.

Quality of Life Indicators Comprehensive Report: City of Ryde
103
Key indicator: Employment of older workers Related 2021 Goals
Ryde 3.1 Our Community and businesses across the city flourish and prosper in an environment of innovation progression and economic growth.
NSW 1 Improve the performance of the NSW economy
People claiming age pension Fair
About this indicator
Regardless of age, having paid work
contributes to a person’s sense of identity
and self-esteem and provides opportunities
for self-development and social interaction.
Allowing older people to participate in the
workforce is important for social inclusion of
this at times socially excluded group. In
addition, with a healthy life expectancy and
ageing population, the nation needs to
maximise skills and labour resources of all
workers, including older workers. There are
individual, communal and national
advantages resulting from sustaining an
income into older age; thus, it is important to
consider the employment and engagement
of older workers in addition to overall
employment figures.
Involvement in the paid workforce varies with age, as labour force involvement tends to decrease towards
retirement years. Recent figures on the participation of older people in the workplace indicate that only
57.3% of people aged 55-64 years participated in the workforce in the Sydney SD. In the 65 years and over
age group, only 8.9% were engaged in the workplace. The ABS (2010) reported that in the Lower Northern
Sydney Statistical Region, 69% of people aged over 55 participated in the workforce, a rate slightly above
the 66 % for Western Sydney. Over time, the participation rates of older people in the workforce have
increased steadily, however the participation of females remains lower than that of males. This is seem by
the 65.8 % participation rate by males aged over 55 in NSW during 2009, in comparison to 49% for females,
according to ABS data (2010).
Trends in Ryde are similar to NSW, that is, 2006 data showed that age is strongly associated with workforce
participation, for example, 61.3% of people aged 55-64 participated in the workforce, as well as only 16.4%

Quality of Life Indicators Comprehensive Report: City of Ryde
104
of people aged 65-74years; 2.1% of people aged 75-84 years; and only 1.0% of people aged 85 years and
older (ABS 2007).
Employment is only a partial indicator of financial security, and income support pensions are available to
older people with limited personal economic resources. In Ryde, the proportion of older people that claimed
an age pension was 64.7%. This rate is comparable to that of Canada Bay (63.8%), Parramatta (66.5%) and
the Sydney SD (66.2%). These rates are significantly higher than that of Hornsby (50.4%) and Ku-ring-gai
(32.5%), (Public Health Information Development Unit 2010).
References
Australian Bureau of Statistics 2007, 2006 Census Tables, Cat. No. 2068.0, Australian Bureau of Statistics, Canberra.
Australian Bureau of Statistics 2010, NSW State and Regional Indicators 2009, Cat. No. 1338.1, Australian Bureau of
Statistics, Canberra.
Public Health Information Development Unit 2010, Social Health of Australia Atlas, Public Health Information
Development Unit, Adelaide.
Quality of Life Indicators Comprehensive Report: City of Ryde
105
Key indicator: Long-term unemployment and income support Related 2021 Goals
Ryde 3.1 Our community and businesses flourish and prosper in an environment of innovation, progression and economic growth
Long-term unemployment benefit recipients Good
About this indicator
People that are unemployed for a long time
may experience prolonged economic
hardship, lose connections with their
community and have more difficulty finding
employment because of the loss of relevant
skills. Australia has a system of income
support to provide a safety net to those who
are not able to support themselves. Long-
term reliance on this income support,
however, indicates reduced connections with
the workforce resulting in lower incomes,
loss of skills and networks and can lead to
social exclusion.
In Ryde in 2008, 891 working-age people (1.2% of the population of working age) received an
unemployment benefit. This rate was lower than that for two neighbouring LGAs (Parramatta 3.2% and
Canada Bay 1.3%) and higher than for Hornsby (0.9%) and Ku-ring-gai (0.4%). Overall numbers indicated
that there were considerably more unemployment benefit recipients in Parramatta (3,525) than Ryde and the
other comparator LGAs (Public Health Information Development Unit 2010).

Quality of Life Indicators Comprehensive Report: City of Ryde
106
Figure 1: People receiving unemployment benefits long-term (%) LGA comparison, 2008
Source: Public Health Information Development Unit, 2010.
Not all income support recipients receive a benefit for a long time. Figure 1, above, shows the relative rates
of long-term unemployment benefits between comparator LGAs. At 0.8% the rate for Ryde as lower than that
of Canada Bay (0.9%) and Parramatta (2.3%) as well as the Sydney SD (2.0%), and higher than that of
Hornsby (0.5%) and Ku-ring-gai (0.3%), (Public Health Information Development Unit 2010).
References
Australian Bureau of Statistics 2007, 2006 Census Tables, Cat. No. 2068.0, Australian Bureau of Statistics, Canberra.
Australian Bureau of Statistics 2010, NSW State and Regional Indicators 2009, Cat. No. 1338.1, Australian Bureau of
Statistics, Canberra.
Public Health Information Development Unit 2010, Social Health of Australia Atlas, Public Health Information
Development Unit, Adelaide.

Quality of Life Indicators Comprehensive Report: City of Ryde
107
Key indicator: Jobless households and children in jobless households Related 2021 Goals
Ryde 3.1 Our community and businesses flourish and prosper in an environment of innovation, progression and economic growth
NSW 13 Better protect the most vulnerable members of our community and break the cycle of disadvantage
Children in jobless households Good
About this indicator
Families with no employed parent are at risk
of economic disadvantage and reduced
social opportunities. Children living without
employed parents or guardians are
vulnerable to financial hardship and poverty.
As future economic success is considered to
largely depend on access to economic
resources during the first 15 years of life,
prolonged joblessness in families creates
the risk of intergenerational transmission of
joblessness. These processes undermine
both equality of outcomes and equality of
opportunity for parents and children in
jobless families.
Jobless households and children living within these households are a priority for the national approach to
social inclusion. Families with no employed parent are at risk of economic disadvantage and reduced social
opportunities, which may in turn impact on the wellbeing of the family members. In Ryde, 776 families (8.3%)
were considered jobless families, this rate is higher than all comparator LGAs of Ku-ring-gai (4.8%), Hornsby
(5.5%) and Canada Bay (6.2%), with the exception of Parramatta (17.5%). 4.7% of families in Ryde were
welfare-dependant and low income7, higher than comparator LGAs of Ku-ring-gai (1.8%), Hornsby (3.5%)
and Canada Bay (3.6%), however it is lower than that of Parramatta (10.5%), (Public Health Information
Development Unit 2010).
Figure 1, below, illustrates the prevalence of children in jobless families. In Ryde, 7.8% of all children (1,194
children) were in families with no employed parent. This rate is higher than that of neighbouring LGAs of Ku-
ring-gai (4.3%), Hornsby (5.2%) and Canada Bay (5.9%), but significantly lower than that of Parramatta
(19.0%). Overall, the number of children in jobless families was lower than that of Parramatta (5,051) and
7 The definition of family in this case differs – and refers to all family groups, not just those with children under 15 years.

Quality of Life Indicators Comprehensive Report: City of Ryde
108
Hornsby (1,490), but higher than that of Ku-ring-gai (848) and Canada Bay (586), (Public Health Information
Development Unit 2010). The alternative indicator –children in welfare-dependent and other low income
families – provides a similar picture (Public Health Information Development Unit 2010).
Figure 1: Children in jobless families, LGA comparison, 2008
Source: Public Health Information Development Unit, 2010.
A large proportion of welfare-dependent, low-income and jobless families are those with sole parents. In
2006, 1,321 Ryde families (5.3%) were single-parent families, slightly higher than comparator LGAs of Ku-
ring-gai (3.3%), Hornsby (4.7%) and Canada Bay (4.7%) and lower than Parramatta (7.6%; Public Health
Information Development Unit, 2010). Females are the majority of sole parents eligible for a Parenting
Payment from Centrelink; in Ryde, 2.0% of females aged 15-54 years are claiming this pension (Public
Health Information Development Unit 2010).
References
Public Health Information Development Unit 2010, Social Health of Australia Atlas, Public Health Information
Development Unit, Adelaide.

Quality of Life Indicators Comprehensive Report: City of Ryde
109
Discussion This chapter considered prosperity through indicators of income, employment and financial resources.
Overall, the indicators provide a picture of a prosperous local economy in Ryde. Local employment ratios
show that there were more jobs in the LGA than workers. This is a positive indication of the opportunities for
local employment for residents of Ryde, especially for skilled, white-collar occupations. In addition, there
have been more business entries than exits in the area since 2004, despite a general decreasing and
negative trend across neighbouring LGA’s in the same period. Moreover, Ryde has remained largely
insulated from the increasing unemployment between December 2008 and June 2010 seen in neighbouring
areas.
These points all indicate the resilience and strength of the local economy - how can this success
be sustained? Is economic strength the reality across all parts of Ryde, or is the picture more
complex? And how can opportunities be provided for key workers to support the local economy’s
long-term sustainability?
Ryde’s overall economic strength tends to be reflected in individual prosperity. Average income has been
increasing steadily since 2004 (overall at a rate of 3.8%). This suggests that increasing incomes have kept
pace with the steady increase in the number of workers in the LGA since 2004. Ryde has a relatively even
distribution of income, with only 17.3% of the population low income earners (who were mostly younger
people). The majority of workers in the LGA (67.5%) earn middle incomes of between $250 and $1,599 per
week. Wesley Mission’s findings also suggest that the incidence of financial stress in Northern Sydney has
decreased in recent years. However, this may be an indication of gentrification within the area, rather than
improved outcomes for long-term residents.
These figures may not capture the full effects of the financial downturn in 2008, what
implications may this downturn have? The forecasted increase in dependency ratio suggests an
increased economic burden on workers in Ryde, what are the implications of this?
Ryde has some social groups that may be considered to be more vulnerable in terms of prosperity. 776
families (8.3%) have no employed parent, higher than all comparator LGAs with the exception of Parramatta.
1,194 children (7.8%) are in jobless families. A large proportion of welfare-dependent, low-income and
jobless families are with sole parents. In 2006, 1,321 Ryde families (5.3%) were single parent families.
Single parent families had lower average incomes than couple families. A lower SEIFA ranking for Ryde
compared with its neighbours suggest there are some concentrations of disadvantage in the LGA.
How can we target economically vulnerable families and individuals to break the cycle of
entrenched disadvantage?

Quality of Life Indicators Comprehensive Report: City of Ryde
110
A City of Environmental Sensitivity Outcome
Working together as a community to protect and enhance our natural and built environments for the future.
Introduction Australians are fortunate to live in an environment of diversity and beauty; and our attention is increasingly
directed at maintaining and sustaining this environment. This chapter examines environmental issues in the
local area of Ryde, by focussing on the interaction between the community and its local environment. The
environment is not only an important issue in politics and policy; it also plays an important role in the
community due to its links with many aspects of social inclusion such as health, wellbeing, economic activity,
as well as accessibility.
There are three parts to this analysis in this chapter. Firstly, the chapter concentrates on the atmosphere as
one of the most important parts of the Australian environment whose vulnerability to human activity is
increasingly recognised. Climate change poses an enormous threat to the atmosphere, and this chapter
considers the local contribution as well as mitigation of this global problem, by looking at both carbon
emissions and abatement efforts. Local temperatures and rainfall also provide a useful measure of the
atmosphere; an important additional measure of the local atmosphere’s health is found in measuring air
quality.
Human settlement has a large impact on natural resources. This chapter provides local statistics on the use
and conservation of energy and water; waste management and recycling; and the impacts on the biodiversity
of local flora and fauna. Furthermore, access to open and green spaces form important measures of the
availability of environmental resources to local residents. The final indicator - environmental expenditure by
local government - is a useful measure that recognises the important influences on local environments by
local councils (2006 Australian State of the Environment Committee 2006).
This chapter has used data from a variety of sources, but it is important to note that data on environmental
indicators, especially on a local level, are still limited8 (ABS 2010). Where data for Ryde was not available,
data for larger areas was used, such as the Sydney SD.
References
Australian Bureau of Statistics 2010, Measures of Australia’s Progress, Australian Bureau of Statistics, Canberra.
8 In particular, data limitations have restricted the choices of comparator LGAs for many measures in this chapter.
Quality of Life Indicators Comprehensive Report: City of Ryde
111
2006 Australian State of the Environment Committee 2006, Australia State of the Environment 2006: Independent report
to the Australian Government Minister for the Environment and Heritage, Australian Government Department of
Sustainability, Environment, Water, Population and Communities, Canberra.

Quality of Life Indicators Comprehensive Report: City of Ryde
112
Key indicator: Air quality Related 2021 Goals
Ryde 4.1 Our residents, businesses and visitors collaborate in the protection and enhancement of our natural environment
NSW 22 Protect our natural environment
About this indicator
The National Environment Protection
Measures (NEPM) for ambient air quality
dictates standards for pollutants in the air.
Exceeding these levels of pollutants has an
adverse effect on human health and
wellbeing. This indicator focuses on both
ozone and other particulate concentrations,
which have harmful effects on health,
including effects on lung function, and
aggravation of existing respiratory and
cardiovascular disease. They have also
been associated with increased mortality
(Environment Protection and Heritage
Council 2003).
Air quality is of particular concern in urban areas, however overall air quality in Australian cities has been
improving, with concentrations of sulphur dioxide, nitrogen dioxide and lead generally within permissible
levels in urban areas, including those measured for the Magdala Park (West) community monitoring station
in Ryde (2006 Australian State of the Environment Committee, 2006; Northern Sydney Regional
Organisation of Councils 2009).

Quality of Life Indicators Comprehensive Report: City of Ryde
113
Figure 1: Days per year NEPM standards exceeded, ozone and
particulate concentrations, Sydney, time series 2000-09
Source: Australian Bureau of Statistics, 2010.
Photochemical smog remains an issue in Sydney due to population pressure and over-reliance on private
cars, and is indicated by high ozone levels (2006 Australian State of the Environment Committee 2006).
Figure 1, above, shows a time series for Sydney of the number of days for which NEPM standards have
been exceeded. Recent years indicate a decreasing incidence in this form of air pollution (from 21 days in
2001 down to 2 days in 2008), which may be associated with the tightening of fuel quality standards (2006
Australian State of the Environment Committee 2006). The Magdala Park (West) community monitoring
station in Ryde did not record any days in 2008/9 where the NEPM standard for ozone concentration was
exceeded (Northern Sydney Regional Organisation of Councils 2009).
Figure 1 also shows the time series trend in particulate matter concentrations, which have been relatively low
in Sydney in recent years (4 days in 2007; 3 days in 2008). It is important to note however, that this measure
is affected by severe weather: for example the very high rate in 2002 (26 days) is associated with the severe
bushfires that occurred at that time. The Magdala Park (West) community monitoring station in Ryde did not
record any days over the 2008/09 period where the NEPM standards for particulate concentration (for both
small PM2.5 and larger particles PM10) were exceeded (Northern Sydney Regional Organisation of Councils
2009).
References
Australian Bureau of Statistics 2010, NSW State and Regional Indicators 2009, Cat. No. 1338.1, Australian Bureau of
Statistics, Canberra.
2006 Australian State of the Environment Committee 2006, Australia State of the Environment 2006: Independent report
to the Australian Government Minister for the Environment and Heritage, Australian Government Department of
Sustainability, Environment, Water, Population and Communities, Canberra.

Quality of Life Indicators Comprehensive Report: City of Ryde
114
Environment Protection and Heritage Council 2003, National Environment Protection Measures, Commonwealth of
Australia, Adelaide.
Northern Sydney Regional Organisation of Councils 2009, State of the Environment Report 2008/2009, Northern Sydney
Regional Organisation of Councils, Sydney.

Quality of Life Indicators Comprehensive Report: City of Ryde
115
Key indicator: Energy use, climate change and carbon abatement Related 2021 Goals
Ryde 4.2 To encourage and enable all our residents to live a more environmentally sensitive life
NSW 5 Place downward pressure on the cost of living
About this indicator
Energy is fundamental to the operation of
modern urban environments, by supporting
the production and provision of goods and
services, as well as for transport and
household comfort. Using less energy is
generally more environmentally beneficial
due to the wastes generated during energy
production and use, and because of the
discernible impact of greenhouse gas
concentration related to energy uses. This
indicator considers the local efforts to reduce
energy consumption and carbon emissions
(Australian and New Zealand Environment
and Conservation Council (ANZECC) 2000;
Environment Protection and Heritage
Council 2003).
The most dominant source of carbon emissions in NSW is energy (75%), with far smaller proportions from
agriculture (10%), industrial processes (7%), land use and land use changes (5%) and finally, waste (3%).
Figure 1, below, shows the trend over time for carbon dioxide emissions attributable to energy over time.
This shows a trend of increasing emissions for NSW, with an increase of 25.7% in emissions between 1990
and 2008 (Australian National Greenhouse Accounts 2010).

Quality of Life Indicators Comprehensive Report: City of Ryde
116
Figure 1: Carbon dioxide emissions from energy use(t). NSW time series 1990-2008
Source: Australian National Greenhouse Accounts, 2010.
Reliable and comparable data is limited in availability for carbon emissions on a local scale (Community
Indicators Victoria 2009). The most recent data for Ryde estimates carbon emissions at a level of 1,624,556
tonnes of CO2 in 2001; this level is equivalent to 0.3% of Australia’s greenhouse gas emissions. Of total
energy use by the community, 44% is attributed to the industrial sector, 20% for both commercial and
residential areas, and 14% for transportation (City of Ryde 2007).
Electricity use in 2009/10 attributable to businesses in Ryde (over 650,000 kWh) is nearly double that
associated with residential uses (over 280,000 kWh). By comparison, the inverse is true for the neighbouring
LGAs of Hornsby Shire (375,000 kWh for businesses and 450,000 kWh for residents) and Ku-ring-gai
(200,000 kWh and 425,000 kWh, respectively; Northern Sydney Regional Organisation of Councils 2009).
Almost all of Sydney households access mains electricity, while under half (45.7%) use mains gas. Non-
mains sources of energy in Sydney include 6.3% of households using bottled gas; 6.5% wood; 4.4% solar
power. Electricity was the predominant form of energy used to heat water 51.3% (39.1% off-peak), followed
by mains gas (30.5%). Ownership of whitegoods was common across Sydney – 99.8% of households had a
refrigerator, 95.3% a washing machine, 72.3% a heater, 61.3% clothes dryer, 56.0% a cooler and 48.4% a
dishwasher (ABS 2010).
The use of energy saving lights has been promoted as a simple method to reduce energy use, and can
provide a useful indicator of efforts towards reducing energy consumption. The ABS (2010) reported that
63.9% of Sydney households used energy saving lights in 2008, a rate slightly lower than that of the other
parts of NSW (68.5%).
For the City of Ryde Council (2007), the total production of Council activities in 2003/04 was estimated to be
15 321 tonnes of CO2 with the majority sourced from electricity (70%). The greatest source of greenhouse
gas emissions was for buildings (43%), followed by streetlights (32%), waste (16%) and vehicle fleet
(9%2007). In 2009/10 the top three sites of Council activities created 5,504 tonnes of CO2, this figure has
decreased slightly since 2006/07 (from 5,569, or a decrease of 1.2%). The amount of CO2 saved through all

Quality of Life Indicators Comprehensive Report: City of Ryde
117
projects from the Council was 2 092 in 2009/10, an increase in savings of 381% of the 2006/07 value (City of
Ryde 2007).
References
Australian Bureau of Statistics 2010, NSW State and Regional Indicators 2009, Cat. No. 1338.1, Australian Bureau of
Statistics, Canberra.
Australian and New Zealand Environment and Conservation Council (ANZECC) 2000, Core Environmental Indicators for
Reporting on the State of the Environment, Australian Government Department of Sustainability, Environment, Water,
Population and Communities, , Canberra.
Australian National Greenhouse Accounts 2010, National Greenhouse Gas Inventory, Australian Government
Department of Climate Change and Energy Efficiency, Canberra.
2006 Australian State of the Environment Committee 2006, Australia State of the Environment 2006: Independent report
to the Australian Government Minister for the Environment and Heritage, Australian Government Department of
Sustainability, Environment, Water, Population and Communities, Canberra.
City of Ryde 2007, Greenhouse Gas Reduction Action Plan 2007-2010, City of Ryde, Sydney.
Community Indicators Victoria 2009, A Resource Guide for Using CIV as a Tool for Council Planning, Community
Indicators Victoria, Melbourne.
Environment Protection and Heritage Council 2003, National Environment Protection Measures, Commonwealth of
Australia, Adelaide.
Northern Sydney Regional Organisation of Councils 2009, State of the Environment Report 2008/2009, Northern Sydney
Regional Organisation of Councils, Sydney.

Quality of Life Indicators Comprehensive Report: City of Ryde
118
Key indicator: Climate, temperature and rainfall Related 2021 Goals
Ryde 4.2 To encourage and enable all our residents to live a more environmentally sensitive life
NSW 5 Place downward pressure on the cost of living
About this indicator
Because of the potential for global warming
due to the enhanced greenhouse effect, it is
useful to measure surface temperature-,
particularly temperature extremes which
have a large impact on the ecosystem.
Australia’s highly variable rainfall has
substantial effects on ecosystems and
human activities, and will be used as
another indicator of climate (Environment
Protection and Heritage Council 2003).
Figure 1, below, shows the mean minimum and maximum temperatures for Ryde’s nearest weather station,
Parramatta North (Masons Drive)9, in comparison to the Sydney average. Recent temperature trends in
Parramatta North tended to mirror those seen for the Sydney SD (which was an average of 22.6oC in 2010).
The mean maximum temperature for Parramatta North in 2010 was 23.4oC, slightly higher than the historical
mean for this station (recorded since 1965) of 23.3oC. This trend is mirrored across Sydney SD, with mean
maximum temperatures being above average for the previous 18 years (Bureau of Meteorology 2011a).
9 This is the nearest weather station with comprehensive and time-series weather observations available to Ryde. Data
has been collected at this station since 1965.

Quality of Life Indicators Comprehensive Report: City of Ryde
119
Figure 1: Average minimum and maximum temperatures (C),
Sydney and Parramatta North (Masons Drive), time series 2001-2010
Source: Australian Bureaur of Statistics, 2010 and Bureau of Meteorology, 2011b.
Figure 1 also shows that the mean minimum temperature recorded at the Parramatta North station was
consistently lower than that for the Sydney SD (12.2oC for Parramatta North compared with 15.0
oC in
Sydney SD). Mean minimum temperatures have also been above average across Sydney SD in recent
years, with the historical mean minimum temperature for Sydney SD being 13.9oC. The year 2010 was is the
equal 4th warmest on record for Sydney SD, with the decade 2001 to 2010 the warmest on record for
minimum temperatures (Bureau of Meteorology, 2011a; Bureau of Meteorology 2011a).

Quality of Life Indicators Comprehensive Report: City of Ryde
120
Figure 2: Average daily rainfall (mm), Parramatta North (Masons Drive)
Weather Station, time series, 1990-2010
Source: Bureau of Meteorology, 2011b.
The total amount of rainfall at the Parramatta North (Masons Drive) Weather Station was 932.1 mm in 2010;
this was slightly below the annual average across all years of available data (962.1 mm, for the period 1965-
2010). This equals an average daily rate of 2.5 mm, which is shown in Figure 2, above. The wettest month in
2010 was February, with 189.4 mm collected in that month, which included two days with over 50 mm of rain.
For all of Sydney, 2010 had a year of average rainfall, with a slightly wetter winter. In Sydney’s Warragamba
Dam water levels increased from 53% in early January to 72% at the end of December, with largest inflows
during December. This reflects the overall increase in rain across Australia in 2010, associated with the
emergence of the La Niña weather conditions after nearly a decade of drought (Bureau of Meteorology
2011b; Bureau of Meteorology 2011a).
References
Australian Bureau of Statistics 2010, NSW State and Regional Indicators 2009, Cat. No. 1338.1, Australian Bureau of
Statistics, Canberra.
Bureau of Meteorology 2011a, Climate Data online, retrieved January 12, 2011 from
http://www.bom.gov.au/climate/data/
Bureau of Meteorology 2011b, Annual Australian Climate Statement 2010, retrieved January 16. 2011 from
http://www.bom.gov.au/announcements/media_releases/climate/change/20110105.shtml
Environment Protection and Heritage Council 2003, National Environment Protection Measures, Commonwealth of
Australia, Adelaide.

Quality of Life Indicators Comprehensive Report: City of Ryde
121
Key indicator: Water use and conservation Related 2021 Goals
Ryde 4.2 To encourage and enable all our residents to live a more environmentally sensitive life
NSW 21 Secure potable water supplies
About this indicator
Allocation of water is a major issue in
Australia, due to its aridity and highly
variable rainfall. The need to maintain and
conserve water is very important, and
measuring the extraction and use of water is
an integral part of understanding this
invaluable resource (Environment Protection
and Heritage Council 2003).
Data sourced from the ABS (2010) identified that for the majority of households in Sydney (99.6%)water
predominantly came from mains sources. However, 43.8% also came from grey water sources, 18.3% of all
households also purchased water and 6.9% used rainwater tanks.
Houses were the main users of total water in Ryde (46.5%). Houses in the neighbouring LGAs of Hornsby
(66.0%) and Ku-ring-gai (79.7%) consumed a relatively higher proportion of water in comparison to other
types of building. Units and flats (26.8%), and commercial properties (15.6%) in Ryde consumed relatively
higher proportions of total water use in comparison to the proportion of usage by these types of buildings in
other LGAs (Hornsby, 6.9% and 11.1%; and Ku-ring-gai, 6.9% and 5.3% respectively), which reflects the
more urbanised nature of Ryde (Northern Sydney Regional Organisation of Councils 2009).

Quality of Life Indicators Comprehensive Report: City of Ryde
122
Figure 1: Percentage of dwellings conserving water, Sydney, 2007
Source: Australian Bureau of Statistics, 2010.
Figure 1, above, shows the proportion of dwellings actively conserving water in Sydney in 2007. Of all
dwellings, the most common places to conserve water were in the bathroom (64.8%) and in the laundry
(62.7%), (ABS 2010).
References
Australian Bureau of Statistics 2010, NSW State and Regional Indicators 2009, Cat. No. 1338.1, Australian Bureau of
Statistics, Canberra.
Environment Protection and Heritage Council 2003, National Environment Protection Measures, Commonwealth of
Australia, Adelaide.
Northern Sydney Regional Organisation of Councils 2009, State of the Environment Report 2008/9, Northern Sydney
Regional Organisation of Councils, Sydney.
Quality of Life Indicators Comprehensive Report: City of Ryde
123
Key indicator: Waste and recycling Related 2021 Goals
Ryde 4.2 To encourage and enable all our residents to live a more environmentally sensitive life
NSW 23 Increase opportunities for people to look after their own neighbourhoods and environments
About this indicator
Waste is an indicator of the volume of
resources being consumed in a community,
as well as inefficiencies in resource use.
Recycling diverts materials from landfill,
saves space and minimises input resources
in production. This indicator provides a
useful indicator of community commitment to
sustainable practices (Community Indicators
Victoria 2009).
In the Sydney SD in 2007, there is 287 kg of municipal waste per person per year (this amount has
decreased since 2001 when it was 349 kg). Per person, there is also 338 kg of construction and demolition
waste and 549 kg of commercial/industrial waste (ABS 2010). The total proportion of waste that is recycled
was 54.3% in 2007, a rate which has been increasing since 2003 (48.4%). In addition, nearly all Sydney SD
households recycle some of their waste (97.5%; ABS 2010).
Figure 1, below, compares the generation of landfill, and recycling per person across three of the comparator
LGAs. This shows that there is more landfill generated in Ryde than in the other LGAs (235 kg vs. 206 kg in
Hornsby and 198 kg in Ku-ring-gai). There is also a relatively lower proportion of recycling in Ryde (117 kg).

Quality of Life Indicators Comprehensive Report: City of Ryde
124
Figure 1: Landfill and recycling per person (kgs), LGA comparison, 2009/10
Source: Northern Sydney Regional Organisation of Councils, 2009.
Figure 2, below, shows that the relative proportion of recycled waste compared to landfill has been
increasing in Ryde; in 2004/05 22.9% of the waste stream was recycled, increasing to 46.1% in 2009/10.
This proportion has levelled in the previous few years (Northern Sydney Regional Organisation of Councils
2009). However, the level of green waste (that is, waste that is recyclable or compostable but which is
instead entering the waste stream) is also significant in Ryde, representing 32.4% of the total stream in 2008
(City Of Ryde 2008).
Figure 2: Total landfill and recycling, Ryde, time series 2004-2010
Source: Northern Sydney Regional Organisation of Councils, 2009.

Quality of Life Indicators Comprehensive Report: City of Ryde
125
Figure 3, below, examines the recycling and green waste generated across Ryde in 2008, where, on
average 47.4% of the waste stream was recycling and green waste. The City of Ryde (2008) reported that
recycling and green waste was higher in the suburbs of North Ryde (58%); Gladesville (55.0%) and
Eastwood (55.0%), and lower in the suburbs of West Ryde (47%) and Marsfield (37.0%).
Figure 3: Recycling and green waste as a % of total waste, Ryde suburbs, 2008
Source: City of Ryde, 2008.
There were also considerable differences in the types of waste reduction activities undertaken by
Sydneysiders. The most common activity was sorting out recyclable waste, performed by 87.9% of Sydney
residents ‘all or most of the time’, with a further 8.6% ‘some of the time’. The ABS (2010) reported on the
type of other recycling activities that were less prevalent such as; using recyclable shopping bags (38.0% ‘all
or most of the time’ and 31.5% ‘some of the time’) and recycling garden waste (30.3% and 15.3%,
respectively, however 22.6% of the population indicate this activity was not applicable). The least common
activity was recycling kitchen or food waste (24.3%; 13.9%).
References
Australian Bureau of Statistics 2010, NSW State and Regional Indicators 2009, Cat. No. 1338.1, Australian Bureau of
Statistics, Canberra.
City of Ryde 2008, Waste and Recycling Statistics Report, City of Ryde, Sydney.
Community Indicators Victoria 2009, A Resource Guide for Using CIV as a Tool for Council Planning, Community
Indicators Victoria, Melbourne.
Northern Sydney Regional Organisation of Councils 2009, State of the Environment Report 2008/9, Northern Sydney
Regional Organisation of Councils, Sydney.
Quality of Life Indicators Comprehensive Report: City of Ryde
126
Key indicator: Biodiversity Related 2021 Goals
Ryde 4.1 Our residents, businesses and visitors collaborate in the protection and enhancement of our natural environment.
NSW 22 Protect our natural environment
About this indicator
Biological diversity is extremely hard to
quantify, and available indicators are
considered inadequate, especially on a
small scale. The number of threatened
species is the best available proxy for the
loss of species (Environment Protection and
Heritage Council 2003).
Ryde’s landscape has been modified significantly due to the urban expanse of the metropolitan area of
Sydney. Clearing of land and destruction of habitats remain the most significant pressures on biodiversity in
Australia, including in urban areas (2006 Australian State of the Environment Committee 2006). Bushland
areas in Ryde have been found to vary significantly in size and condition, however all reserves have been
impacted upon by clearing, land filling and replanting. A significant proportion of Ryde’s bushland includes
vegetation types listed nationally as critically endangered ecological communities, including five sites
confirmed as Turpentine-Ironbark Forest (Marsfield Park, Denistone Park, Wilga Park, Tyrell Park and
Yurrah Reserve) and one site as Blue Gum High Forest (ELS Hall Park). Other vegetation types (not listed
as endangered or critically endangered) in the LGA include Western Sydney Gully Forest; Turpentine-
Ironbark Margin Forest; Mangrove-Saltmarsh complex; and Shale Sandstone Transition Forest (Biosphere
Environmental Consultants Pty Ltd 2008).
In Ryde’s bushland, there are some 13 species of flora listed as threatened in 2009, of which 3 are
considered endangered. This number has increased since 2005, as shown in Figure 1, below, (Northern
Sydney Regional Organisation of Councils 2009). Many bushland areas and reserves in Sydney have large
numbers of exotic or non-native plants in them, and some species require particular monitoring and
protection, including styphelia long folia, mangrove and saltmarsh (Biosphere Environmental Consultants Pty
Ltd 2008).

Quality of Life Indicators Comprehensive Report: City of Ryde
127
Figure 1: Threatened and endangered flora (number of species) LGA comparison, 2009
Source: Northern Sydney Regional Organisation of Councils, 200910
.
Urbanisation and changed land use has also had a large impact on native fauna in Ryde. Bushland studies
found ten threatened fauna species in Ryde in 2005 (two of which are endangered). This figure increased to
13 threatened species, and four endangered species, in 2009 (Northern Sydney Regional Organisation of
Councils 2009). The fauna most affected by urban development include terrestrial mammals, large reptiles
and frogs. Many terrestrial mammal species have almost completely disappeared from the area, which can
be attributed to both land clearing and predation by exotic animals (such as cats, dogs, and foxes). Large
reptiles have also been extensively eliminated through accidental and deliberate killing by humans or
predation by domestic animals. The decline of frogs in Ryde has been described as ‘precipitous’, and is
associated with loss of habitat, poor water quality and introduced predatory fish. Ground-nesting and ground-
frequenting birds have been found to be conspicuously absent, likely due to the large number of exotic
predators in parks. Despite many parks and reserves being dominated by exotic bird fauna, forest and
woodland birds are still in abundance. Invertebrates have also reduced in abundance in the smaller and
more urbanised reserves (Biosphere Environmental Consultants Pty Ltd 2008).
References
2006 Australian State of the Environment Committee 2006, Australia State of the Environment 2006: Independent report
to the Australian Government Minister for the Environment and Heritage, Australian Government Department of
Sustainability, Environment, Water, Population and Communities, Canberra.
Biosphere Environmental Consultants Pty Ltd 2008, Ryde Flora and Fauna Study 2008, Ryde City Council, Sydney.
Environment Protection and Heritage Council 2003, National Environment Protection Measures, Commonwealth of
Australia, Adelaide.
Northern Sydney Regional Organisation of Councils 2009, State of the Environment Report 2008/9, Northern Sydney
Regional Organisation of Councils, Sydney.
10
As no figures are available for total number of species in this area, and because of large differences in land types, these figures are not easily comparable between LGAs.

Quality of Life Indicators Comprehensive Report: City of Ryde
128
Key indicator: Urban green spaces Related 2021 Goals
Ryde 4.3 As we grow, we protect and enhance the natural and built environments for future enjoyment
NSW 20 Build liveable centres
National parks and open space are prevalent across some of the Northern LGAs in Sydney. The pattern of
land use between comparator LGAs is shown in Figure 1, below. In Ryde, 15.6% of land is national park and
open space. According to the Northern Sydney Regional Organisation of Councils (2009) this proportion is
less than that in neighbouring LGAs of Hornsby (55.1%) and Ku-ring-gai (36.2%). The greatest land use in
Ryde was residential and road uses (60.2%), higher than both Ku-ring-gai (56.1%) and Hornsby (9.4%.
About this indicator
Open public spaces provide a place for
recreation, relaxation, and community
gathering as well as contributing to the
urban aesthetic. Limited access to open
space may negatively affect physical
exercise habits and not allow for the forming
of connections with people in the community
outside one’s household, contributable to
belonging and community participation.

Quality of Life Indicators Comprehensive Report: City of Ryde
129
Figure 1: Land Use, LGA comparison, 2009/10
Source: Northern Sydney Regional Organisation of Councils, 2009.
Figure 2, below, shows that there are 355 hectares of open space under Council management in Ryde. This
rate is lower than that in both Hornsby (1,285 ha) and Ku-ring-gai (1,161 ha). On a per person basis, the
amount of open space is again lowest in Ryde (34 m2 per person), compares with Hornsby (170 m
2) and Ku-
ring-gai (114 m2) as well as the average for the Northern Sydney Region (72 m
2), (Northern Sydney Regional
Organisation of Councils 2009).
Figure 2: Open space, per person and under management
LGA comparison, 2009/10
Source: Northern Sydney Regional Organisation of Councils, 2009.
Ryde has 559 hectares of bushland, this total amount is smaller than neighbouring LGAs of Hornsby (38,089
ha) and Ku-ring-gai (1,161 ha). Despite this, the proportion of bushland under Council control in Ryde
(37.4%) was higher than the comparators of Ku-ring-gai (36.9%) and Hornsby (15.1%), (Northern Sydney
Quality of Life Indicators Comprehensive Report: City of Ryde
130
Regional Organisation of Councils 2009).
References
Northern Sydney Regional Organisation of Councils 2009, State of the Environment Report 2008/9, Northern Sydney
Regional Organisation of Councils, Sydney.

Quality of Life Indicators Comprehensive Report: City of Ryde
131
Key indicator: Importance of and satisfaction with green spaces Related 2021 Goals
Ryde 4.3 As we grow, we protect and enhance the natural and built environments for future enjoyment
About this indicator
This indicator measures how the community
evaluates the importance and quality of local
environmental resources, including parks,
open space, heritage buildings and
bushlands. The community’s valuing of the
environment is an important part of effecting
behavioural change among residents.
A 2008 survey by the City of Ryde on community satisfaction in Ryde indicated that residents ranked the
importance of parks and open spaces very highly (4th most important issue out of 40). Satisfaction with
Ryde’s parks and open spaces is 90% (63% satisfied, 26% very satisfied). Levels of satisfaction were
consistent across the three wards (West 90%; Central 89%; East 90%).
Satisfaction with the maintenance of parks in Ryde is high, and has increased (from 82% in 2006 to 88% in
2008). Residents in the Western Ward report slightly higher levels of satisfaction (90%), compared with the
East Ward (88%) and Central Ward (86%). Satisfaction with the conservation of heritage buildings was 62%
in 2008, representing an increase from 54% in 2006 (City of Ryde 2008).
Efforts to protect the natural bushland in Ryde have seen significantly increasing levels of satisfaction, from
69% in 2006 to 81% in 2008. Residents in the West Ward (85%) rated higher levels of satisfaction (85%),
compared with 78.0% in both the Central and Eastern Wards. In the Central Ward 13% of residents are ‘not
at all satisfied’ with the protection of natural bushland (City of Ryde 2008).
Concern about the protection of environmental resources by local residents is also shown by the level of
Bushcare volunteering in Ryde. However the number of volunteers has decreased significantly since
2005/06, from 900 volunteers down to 146 in 2009/10. The total value of the work of these volunteers in
2009/10 was $86,825 in labour contributed to conserving and protecting bush areas in Ryde. This represents
a significant decrease since the peak of $246,000 in 2005. Despite a relatively low number of Bushcare
volunteers in Ryde, the average number of hours contributed per volunteer in 2009/10 was 23.8 hours -
considerably higher than neighbouring LGAs of Hornsby (19.5 hours) and Ku-ring-gai (13.5 hours; Northern
Sydney Regional Organisation of Councils 2009).

Quality of Life Indicators Comprehensive Report: City of Ryde
132
References
City of Ryde 2008, Community Satisfaction Survey 2008, City of Ryde, Sydney.
Northern Sydney Regional Organisation of Councils 2009, State of the Environment Report 2008/9, Northern Sydney
Regional Organisation of Councils, Sydney.

Quality of Life Indicators Comprehensive Report: City of Ryde
133
Discussion
This chapter examines environmental issues in Ryde, by focussing on the interaction between the
community and its local environment.
People in Ryde are increasingly active in resource conservation; however there is still plenty of scope for
improvement. Residents are more active in recycling, however landfill per person is higher than neighbouring
areas, and recycling per person is lower. Water use is predominantly for residential purposes; however
energy use for commercial purposes is higher than that used in residential areas.
How can we further our efforts towards resource conservation?
Ryde’s landscape has been modified significantly due to the urban expanse of the metropolitan area and
reserves have been impacted upon by clearing, land filling and replanting. In Ryde’s bushland, there are
some 13 flora and 10 fauna species listed as threatened.
How can we encourage people to be active in conservation and reducing their own impact on
local ecosystems?

Quality of Life Indicators Comprehensive Report: City of Ryde
134
A City of Connections Outcome
Access and connection to, from and within the City of Ryde. Providing safe, reliable and affordable public and private travel, transport and safe communication infrastructure
Introduction This chapter explores indicators of connectivity and access for the residents of Ryde. Social exclusion is
associated with lack of services as well as a lack of access to services. The issues of transport and
accessibility in this chapter are related to other social issues such as participation, housing alternatives and
affordability; employment; education; health and personal wellbeing.
Travel and transport options are a key part of connectivity. A lack of transport options affects participation in
economic, educational and social activities. This chapter first considers transport options for Ryde residents,
including public transport usage, and accessibility for those with a disability. It then delves deeper into the
most popular form of private transport – motor vehicles – by considering private motor vehicle usage and
safety.
A broader understanding of connectivity incorporates accessibility to services and to communication
infrastructure. To investigate this dimension, this chapter includes indicators of people’s ability to access
information, services and the internet as well as considering the availability and usage of other community
services. This provides a broader understanding of the social dimensions of connectivity.

Quality of Life Indicators Comprehensive Report: City of Ryde
135
Key indicator: Transport options and public transport
Related 2021 Goals
Ryde 5.1 Our residents, visitors and workers are able to easily and safely travel on public transport to, from and within the City of Ryde
NSW 8 Grow patronage on public transport by making it a more attractive choice
Public transport use Good
About this indicator
Connectivity includes understanding the
transport options available in Ryde.
Transport is seen as a key indicator of
community and individual wellbeing, as it
provides a means of greater access to
services, work, social, cultural and
recreational activities, and it helps to
maintain connections and networks.
Reliable, safe, fast and frequent transport is
important as it helps maximise the time an
individual can spend on activities and with
family and friends.
Ryde residents cited work-related commitments as the main motivation for travel (27.5%). Other significant
reasons for travel included social and recreational reasons (22.7%); accommodating the travel needs of
others as passengers (15.8%) shopping (15.5%) and education and child care (8.2%; NSW Transport Data
Centre 2007). Ryde residents took an average of 3.4 transport trips each weekday, and 3.9 trips per
weekend. This contrasts with the comparator LGAs where residents took more trips on weekdays than on
weekends: Hornsby (3.9 weekend and 3.7 weekday), Ku-ring-gai (4.4/3.8) and Parramatta (3.7/3.5). Canada
Bay residents took a similar number of trips on weekdays and weekends (4.0/4.1), (NSW Transport Data
Centre 2007).
As work responsibilities were the main reason for travel in Ryde, it is useful to further disaggregate methods
of travel to work. In Ryde, the main form of transport was private motor transport, used by some 68.9% of
employed people. The proportion of workers that took public transport in Ryde was 21.0%; the remaining
methods of travel include walking or cycling (4.8%) and multiple transport methods (5.4%), (ABS 2007).
Ryde residents in 2008 rated pedestrian access around shopping centres and community facilities as
important (rated 3.55 in importance out of 4), and 82% recorded their satisfaction with the quality of these
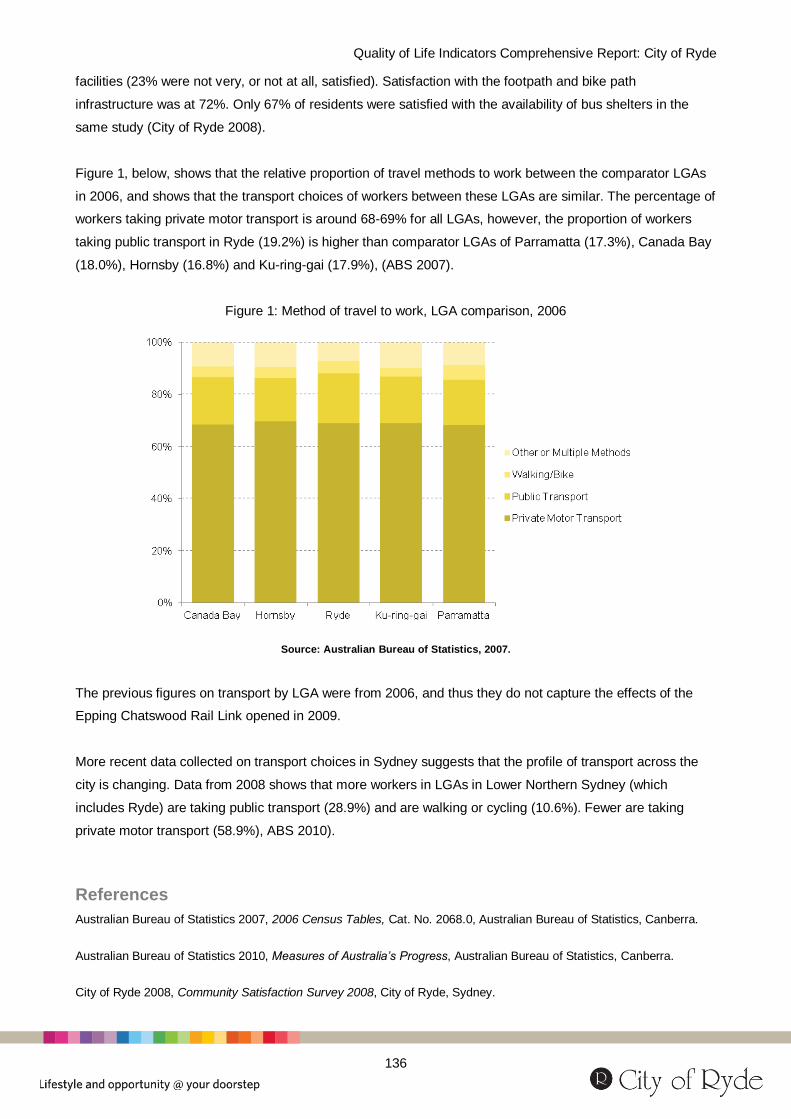
Quality of Life Indicators Comprehensive Report: City of Ryde
136
facilities (23% were not very, or not at all, satisfied). Satisfaction with the footpath and bike path
infrastructure was at 72%. Only 67% of residents were satisfied with the availability of bus shelters in the
same study (City of Ryde 2008).
Figure 1, below, shows that the relative proportion of travel methods to work between the comparator LGAs
in 2006, and shows that the transport choices of workers between these LGAs are similar. The percentage of
workers taking private motor transport is around 68-69% for all LGAs, however, the proportion of workers
taking public transport in Ryde (19.2%) is higher than comparator LGAs of Parramatta (17.3%), Canada Bay
(18.0%), Hornsby (16.8%) and Ku-ring-gai (17.9%), (ABS 2007).
Figure 1: Method of travel to work, LGA comparison, 2006
Source: Australian Bureau of Statistics, 2007.
The previous figures on transport by LGA were from 2006, and thus they do not capture the effects of the
Epping Chatswood Rail Link opened in 2009.
More recent data collected on transport choices in Sydney suggests that the profile of transport across the
city is changing. Data from 2008 shows that more workers in LGAs in Lower Northern Sydney (which
includes Ryde) are taking public transport (28.9%) and are walking or cycling (10.6%). Fewer are taking
private motor transport (58.9%), ABS 2010).
References
Australian Bureau of Statistics 2007, 2006 Census Tables, Cat. No. 2068.0, Australian Bureau of Statistics, Canberra.
Australian Bureau of Statistics 2010, Measures of Australia’s Progress, Australian Bureau of Statistics, Canberra.
City of Ryde 2008, Community Satisfaction Survey 2008, City of Ryde, Sydney.
Quality of Life Indicators Comprehensive Report: City of Ryde
137
NSW Transport Data Centre 2007, Household Travel Survey, NSW Transport Data Centre, Sydney.

Quality of Life Indicators Comprehensive Report: City of Ryde
138
Key indicator: Private motor vehicle travel Related 2021 Goals
Ryde 5.2 Our community has the option to safely and conveniently drive, park, cycle or walk around their city.
About this indicator
Private motor vehicles were the most
commonly used method of transport in
Ryde, and the reliability and ease of this
mode of transport is an important part of
connectivity for Ryde. This indicator looks at
the number of vehicles as well as overall
levels of congestion and usage.
In Ryde, 82.3% of people aged 15 years and over have a driver’s licence. This rate is lower than that in Ku-
ring-gai (94.5%) and Hornsby (89.8%), higher than Parramatta (77.5%) and similar to Canada Bay (82.7%;
ABS 2007).
Figure 1: Proportion of dwellings with vehicle(s), LGA comparison, 2006
Source: Australian Bureau of Statistics, 2010a.
Figure 1, above, shows that despite the relatively high population density, and rate of licence holders, the
proportion of dwellings in Ryde with vehicles (86.0%) is slightly lower than the LGAs of Ku-ring-gai (95.3%),
Hornsby (92.0%) and Canada Bay (88.9%), and slightly higher than Parramatta (83.3%). The average
number of vehicles per dwelling in Ryde was equal to that of Parramatta (1.4 per dwelling), and lower than
Canada Bay (1.5), Hornsby (1.7) and Ku-ring-gai (1.9; ABS 2010a).
Figure 2, below, examines this indicator over time, and shows that motor vehicle ownership is consistently
decreasing in Ryde. The annual rate of motor vehicle registrations has been consistently decreasing in Ryde

Quality of Life Indicators Comprehensive Report: City of Ryde
139
since 2005 (in 2009, there were 2.68% fewer cars than in 2008 registered in Ryde). In comparison, the
comparator LGAs have tended to be more positive, with some negative rates in Parramatta (-2.6% in 2009),
Hornsby (-1.9%) and Canada Bay (-1.0%), (ABS 2010b). This may be due to increasing density of housing
and improved public transport in the area.
Figure 2: Change in registered motor vehicles, rate per 1,000 people,
time series, 2005-2009
Source: Australian Bureau of Statistics, 2010b.
Traffic management and regulation in Ryde is considered important by its residents, with 62% reporting
satisfaction in this area. The Central Ward of Ryde reported a higher level of satisfaction with these services
(72%) compared with the West and East Ward (57% each). Satisfaction with road maintenance and repair
was 67% in 2008, with higher satisfaction in the West Ward (72%) compared with 67% in the Central Ward,
and 61% in the East Ward (City of Ryde 2008).
References
Australian Bureau of Statistics 2007, 2006 Census Tables, Cat. No. 2068.0, Australian Bureau of Statistics, Canberra.
Australian Bureau of Statistics 2010a, NSW State and Regional Indicators 2009, Cat. No. 1338.1, Australian Bureau of
Statistics, Canberra.
Australian Bureau of Statistics 2010b National Regional Profile, Cat. No. 1379.0.55.001, Australian Bureau of Statistics,
Canberra.
City of Ryde 2008, Community Satisfaction Survey 2008, City of Ryde, Sydney.
NSW Transport Data Centre 2007, Household Travel Survey, NSW Transport Data Centre, Sydney.

Quality of Life Indicators Comprehensive Report: City of Ryde
140
Key indicator: Transport safety Related 2021 Goals
Ryde 5.2 Our community has the option to safely and conveniently drive, park, cycle or walk around our city
NSW 10 Improve road safety
Reduced deaths from road traffic accidents Good
About this indicator
Safety is an important part of effective
connectivity, and this indicator considers the
safety of the community during transport.
This indicator complements later figures on
personal wellbeing and health (see
Wellbeing chapter). Safety and accidents
are associated with health problems,
physical and personal costs and even death.
During 2008, in Ryde, just over one-third of car crashes caused an injury or death (34.7%) with the
remaining 65.3% of crashes not involving casualties. This rate is similar to that of Ku-ring-gai (34.2%), and
lower than that of the other comparator LGAs (Canada Bay, 44.4%; Hornsby, 37.2%; and Parramatta,
38.1%; NSW Centre for Road Safety 2009). Figure 1, below, tracks the trends in crashes involving
casualties, and shows that the rate of persons killed and injured in Ryde has been at a rate just over 50 per
10,000 licenses since 2004. In 2008 the value dropped to 45.3 per 10,000 licenses. According to the NSW
Centre for Road Safety (2009), the rate in Ryde has generally been lower than that in Parramatta (61.3 in
2008) and Canada Bay (56.0), but higher than that of Hornsby (36.9) and Ku-ring-gai (31.0 2009).
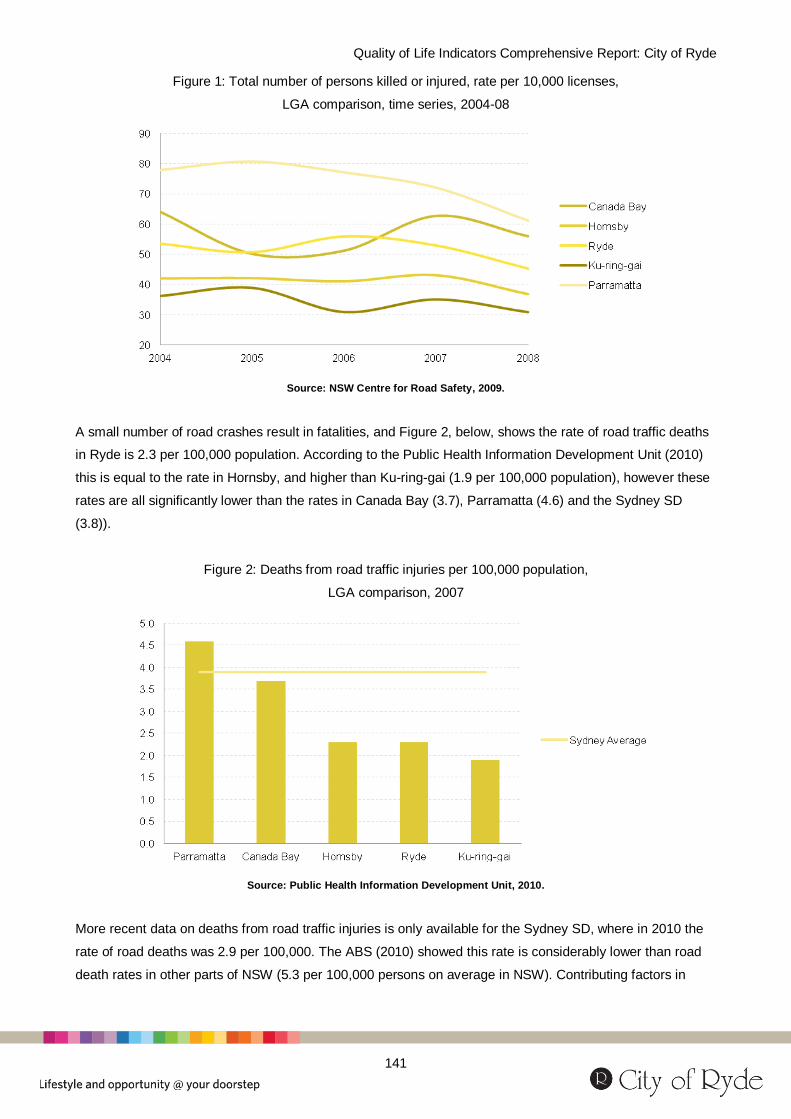
Quality of Life Indicators Comprehensive Report: City of Ryde
141
Figure 1: Total number of persons killed or injured, rate per 10,000 licenses,
LGA comparison, time series, 2004-08
Source: NSW Centre for Road Safety, 2009.
A small number of road crashes result in fatalities, and Figure 2, below, shows the rate of road traffic deaths
in Ryde is 2.3 per 100,000 population. According to the Public Health Information Development Unit (2010)
this is equal to the rate in Hornsby, and higher than Ku-ring-gai (1.9 per 100,000 population), however these
rates are all significantly lower than the rates in Canada Bay (3.7), Parramatta (4.6) and the Sydney SD
(3.8)).
Figure 2: Deaths from road traffic injuries per 100,000 population,
LGA comparison, 2007
Source: Public Health Information Development Unit, 2010.
More recent data on deaths from road traffic injuries is only available for the Sydney SD, where in 2010 the
rate of road deaths was 2.9 per 100,000. The ABS (2010) showed this rate is considerably lower than road
death rates in other parts of NSW (5.3 per 100,000 persons on average in NSW). Contributing factors in

Quality of Life Indicators Comprehensive Report: City of Ryde
142
accidents and crashes include speed (11.2% of cases), followed by alcohol (10%) and fatigue (7.5%). The
rates for these in Sydney were lower than those in other parts of the state (ABS 2010).
References
NSW Centre for Road Safety 2009, Statistical Statement and Fatality Rates, Transport Roads & Maritime Services,
Sydney.
Australian Bureau of Statistics 2010, Measures of Australia’s Progress, Australian Bureau of Statistics, Canberra.
Public Health Information Development Unit 2010, Social Health of Australia Atlas, Public Health Information
Development Unit, Adelaide.

Quality of Life Indicators Comprehensive Report: City of Ryde
143
Key indicator: Access to the internet and IT Related 2021 Goals
Ryde 5.3 Our residents, visitors, workers and businesses are able to communicate locally and globally
Broadband internet connections Average
About this indicator
Connectivity includes effective and
accessible communication infrastructure.
Internet access is an increasingly common
way of connecting with information and
services as well as social participation.
Access to the internet can also be seen as
an enabler of improved wellbeing, through
increased access to a variety of services,
social opportunities, education and
information. There is evidence, however,
that a digital divide is developing that
excludes some of our most vulnerable
individuals who could benefit considerably
from access (McLaren and Zappala 2002).
Correlations can be found between limited
computer use and access to the internet,
and other indicators of social disadvantage
(Vinson 2007).
In 2007/08, two-thirds of all households in NSW had an internet connection; over half of these connections
were broadband (53%). The propensity to have an internet connection is higher among families (the rate
among families with children aged under 15 years was 84% compared to 61% of households with no
children aged less than 15 years). Households in metropolitan areas were also more likely to have internet
connections (79% compared with 59% in non-metropolitan areas). Internet access is also strongly
associated with income, with higher income households more likely to have internet connections than those
with lower incomes, and higher income households were also more likely to have a broadband connection
(ABS 2010).
The most recent data available by LGA is from the 2006 Census. Figure 1, below, compares internet
connections between LGAs in 2006. Over half of the households in Ryde (53.7%) had a broadband internet
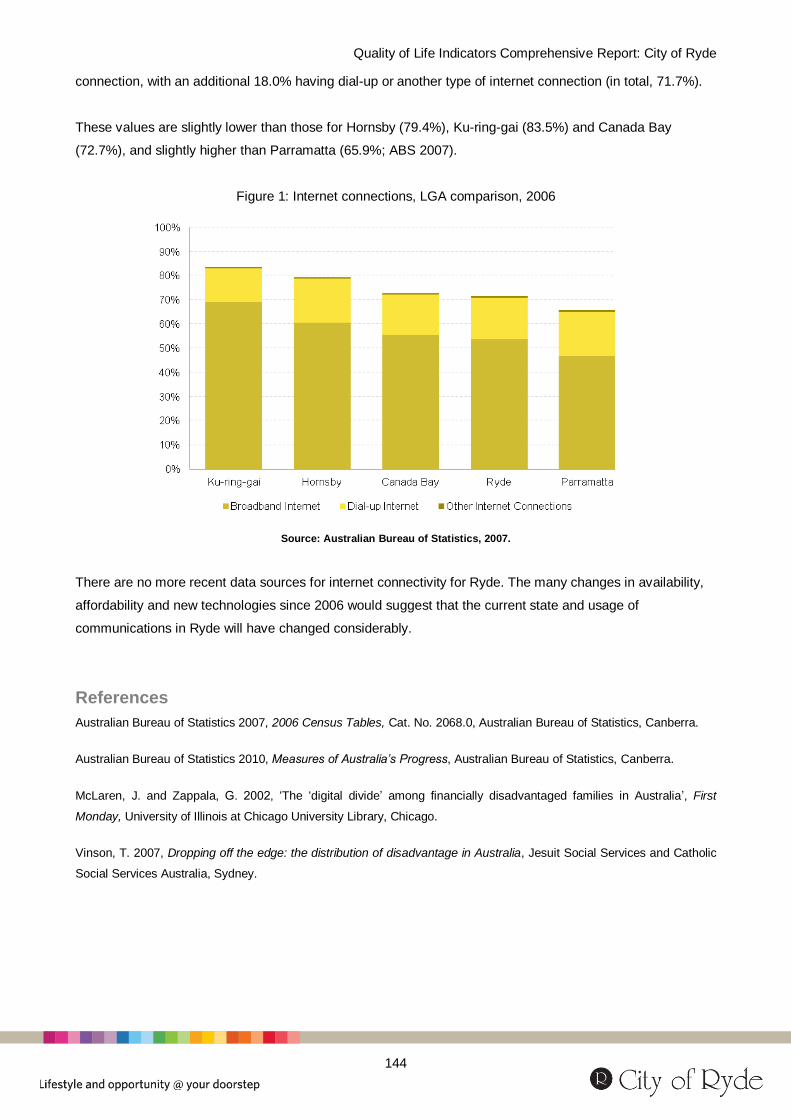
Quality of Life Indicators Comprehensive Report: City of Ryde
144
connection, with an additional 18.0% having dial-up or another type of internet connection (in total, 71.7%).
These values are slightly lower than those for Hornsby (79.4%), Ku-ring-gai (83.5%) and Canada Bay
(72.7%), and slightly higher than Parramatta (65.9%; ABS 2007).
Figure 1: Internet connections, LGA comparison, 2006
Source: Australian Bureau of Statistics, 2007.
There are no more recent data sources for internet connectivity for Ryde. The many changes in availability,
affordability and new technologies since 2006 would suggest that the current state and usage of
communications in Ryde will have changed considerably.
References
Australian Bureau of Statistics 2007, 2006 Census Tables, Cat. No. 2068.0, Australian Bureau of Statistics, Canberra.
Australian Bureau of Statistics 2010, Measures of Australia’s Progress, Australian Bureau of Statistics, Canberra.
McLaren, J. and Zappala, G. 2002, ‘The ‘digital divide’ among financially disadvantaged families in Australia’, First
Monday, University of Illinois at Chicago University Library, Chicago.
Vinson, T. 2007, Dropping off the edge: the distribution of disadvantage in Australia, Jesuit Social Services and Catholic
Social Services Australia, Sydney.

Quality of Life Indicators Comprehensive Report: City of Ryde
145
Discussion Connectivity is about having access to premises, services, and information. This chapter considers
connectivity by examining data regarding the usage of different types of transportation methods and how
safe it is to travel; access to the internet; and access to services. These types of accessibility ensure social
inclusion and equal opportunities.
Ryde residents mainly travel due to work-related commitments and social and recreational reasons. They
take an average of 3.4 transport trips each weekday, and 3.9 trips per weekend. Similar to other LGAs, 68%
of Ryde residents used their private motor vehicle, but public transport is an increasingly popular option for
the area. There were 19.2% of workers from Ryde who used public transport to travel to work, a rate higher
than that across the other LGA’s11
, and there are suggestions that public transport is increasing in popularity
across Sydney in recent years. Ryde also has a relatively high proportion of people with a disability electing
to take public transport, mainly buses. Moreover, most people aged 15 years and over in Ryde (82%) have a
driver’s license, but the proportion of dwellings in Ryde with vehicles (86.0%) is slightly lower than all other
LGAs, and motor vehicle ownership is consistently decreasing. These figures provide a picture of a
‘connected’ local area with public transport a feasible and popular option for many.
Is encouraging public transport an important priority for communities in the City of Ryde? How
will the proposed North West Rail Link or Parramatta-to-Epping Rail Line affect the transport
options available for people living and working in the City of Ryde? How can we articulate the
identity of our city, balancing the identities of a connected commuter city, with a thriving local
community?
In 2006, over half of the households in Ryde (53.7%) have a broadband internet connection, with an
additional 18.0% having dial-up or another type of internet connection (in total, 71.7%). These values are
slightly lower than other LGAs. There are no more recent figures reflecting the great changes made in
information technology since 2006, however it is likely that a great many changes have affected this aspect
of connectivity. This should be further investigated.
How can we develop a better picture of communications availability and accessibility in Ryde?
11
These figures do not include the effects of the Epping Chatswood Rail Link that was opened in 2009.

Quality of Life Indicators Comprehensive Report: City of Ryde
146
A City of Harmony and Culture Outcome
A welcoming and diverse community, celebrating our similarities and differences, in a vibrant city of learning and culture.
Introduction In this chapter, the intertwined community outcomes of harmony and culture are examined. Learning and
educational attainment form the first focus of this chapter. Good quality education and learning is an integral
part of social inclusion, creating a harmonious community as well as being crucial to individual success
(Vinson 2006). Education is one of the most powerful indicators of social inclusion and personal wellbeing
and has been associated with income levels, skills, financial disadvantage, and employment, as well as
physical and psychological wellbeing. This chapter considers participation and attainment in education at all
ages, including the commencement of formal learning at the preschool level, child literacy and development,
participation in education, youth engagement and finally post-school qualifications.
A second part of fostering harmonious communities is the celebration of diversity and culture. Ryde is a very
diverse LGA, and an analysis of its multicultural nature forms an important indicator in this chapter. The
social inclusion of these diverse communities is also examined by looking at the level of participation,
communication, attainment in learning, employment and income among them.
The final aspect of an understanding of community harmony is participation in cultural, recreational and
sporting activities. Such participation not only impacts positively on an individual’s physical health, but also
often involves social participation (see the chapter on wellbeing) thus delivering a dual benefit.
References
Vinson, T. 2006, The education and care of our children: Good beginnings, Public Education Day, Sydney

Quality of Life Indicators Comprehensive Report: City of Ryde
147
Key indicator: Preschool attendance and childcare Related 2021 Goals
Ryde 6.3 Our community is able to learn and grow through a wealth of art, culture and lifelong learning opportunities
NSW 15 Improve education and learning outcomes for all students
About this indicator
This indicator considers indicators for some
of the first phases of learning. Preschool is
one of the earliest stages for building a
child’s education and creating future
opportunities, but it also allows parents to go
back to work and increase their own income
and social advantage. Studies by Karoly,
Kilburn and Cannon (2005) showed that
children who attended preschool were more
likely to complete their schooling.
Unfortunately, childcare costs can be very
high and therefore children’s preschool
participation in Australia tends to increase in
line with household income.
In 2007/08, 71.3% of children aged 0-5 years had participated in any early childhood activities in the
Northern Sydney and Central Coast area. This proportion was significantly higher than the NSW average of
60.8%, and neighbouring areas of Sydney West (52.2%) and Sydney South West (50.8%). For the same
group of children, 40.9% currently attend early childhood activities; again this rate is higher than
neighbouring areas (Sydney South West 29.2% and Sydney West 28.9%) as recorded by the Centre for
Epidemiology and Research (2010). Much of the data on preschool attendance and early childcare is
collected through NSW Health, and this data is collected at the health service area level only. Therefore,
there is no data on this available for Ryde.
Childcare is a popular choice for many parents in the Northern Sydney and Central Coast area, where 58.6%
of children aged 0-5 years had ever been to childcare, and of these children 44.2% currently attends
childcare. Of those children aged 3-4 years 91.7% attend a preschool or childcare with a preschool program.
These rates decrease in Sydney South West, where 50.6% of children aged 0-5 years had ever been to
childcare, 37.4% currently attend and 77.4% of those children aged 3-4 years attend a preschool or childcare
with a preschool program. These values for Sydney West were 41.3%, 31.2% and 80.8%, respectively
(Centre for Epidemiology and Research 2010).

Quality of Life Indicators Comprehensive Report: City of Ryde
148
Figure 1, below, shows that the proportion of the population of Ryde providing unpaid childcare. The rate in
Ryde is the equal lowest (with Parramatta 24.5%), slightly below that of the Sydney SD (26.3%), Ku-ring-gai
(30.3%), Hornsby (29.5%) and Canada Bay (24.8%), (Public Health Information Development Unit 2010).
Figure 1: Unpaid childcare, % of population aged 15 years and over
undertaking, LGA comparison, 2006
Source: Public Health Information Development Unit, 2010.
The proportion of parents and carers of children aged 0-5 years who read daily to their child in the Northern
Sydney and Central Coast area was 78.0%. This rate was the highest for all areas in NSW and significantly
higher than the NSW average of 70.6%. By comparison, the rates for both Sydney South West (66.4%) and
Sydney West (62.2%) were the lowest in the state (Centre for Epidemiology and Research 2010).
References
Centre for Epidemiology and Research 2010, New South Wales Population Health Survey: 2007-2008 Report on Child
Health, NSW Department of Health, North Sydney.
Karoly, L., Kilburn, R. and Cannon, J. 2005, Early childhood interventions: Proven results, future promise, RAND
Corporation, Santa Monica.
Public Health Information Development Unit 2010, Social Health of Australia Atlas, Public Health Information
Development Unit, Adelaide.

Quality of Life Indicators Comprehensive Report: City of Ryde
149
Key indicator: Early childhood development Related 2021 Goals
Ryde 6.3 Our community is able to learn and grow through a wealth of art, culture and lifelong learning opportunities
NSW 13 Better protect the most vulnerable members of our community and break the cycle of disadvantage
About this indicator
Early childhood development indicators are
important markers of the welfare of children
and can predict future social inclusion
outcomes. Investing in resources to support
children in their early years brings long-term
benefits to them and the whole community
(Karoly, Kilburn, and Cannon 2005). There
are five areas of early childhood
development, measured in the Australian
Early Development Index. Data on this
indicator is not available for the comparator
LGA of Ku-ring-gai.
Figure 1, below, compares the progress of Ryde’s children across the five Australian Early Development
Index (AEDI) developmental domains. The domains where the greatest proportion of Ryde children are
considered ‘on track’ (i.e. not developmentally at risk or developmentally vulnerable) were school-based
language and cognitive skills (90.4% of children) and physical health and well-being (83.0%). The Australian
Early Development Index (2010) identified a similarly high rate of children were on track in the school-based
language and cognitive skills domain as reflected in the other LGAs (Hornsby, 90.6%; Canada Bay, 90.0%;
and Parramatta, 84.9%), however, a greater proportion of Ryde children were ‘on track’ in physical health
and wellbeing in comparison with Hornsby (80.1%); Canada Bay (79.9%) and Parramatta (75.7%).

Quality of Life Indicators Comprehensive Report: City of Ryde
150
Figure 1: Children at developmental risk and vulnerability,
AEDI domains, Ryde, 2010
Source: Australian Early Development Index, 2010.
In three social domains – social competence, emotional maturity and communication skills - there were a
greater proportion of children in Ryde considered either developmentally at risk or developmentally
vulnerable. For social competence, 7.6% of Ryde children were considered developmentally vulnerable, with
an additional 13.2% considered developmentally at risk. For emotional maturity, 5.8% in Ryde were
developmentally vulnerable and 13.1% developmentally at risk. In the final domain, communication skills and
general knowledge, the figures were 9.5% developmentally vulnerable and 12.2% developmentally at risk
(Australian Early Development Index 2010).
Children born overseas and children speaking English as a second language are more likely to be
considered developmentally vulnerable. Parramatta has the highest proportion of children born overseas, as
well as who speak English as a second language, and also has the highest rate of children considered
vulnerable in at least one of the domains (27.5%). Hornsby has a larger proportion of children born overseas
than Ryde, however fewer of these are from non-English-speaking backgrounds; the percentage of children
in Hornsby considered developmentally vulnerable is lower than for Ryde (17.0%). Ryde has a slightly
greater proportion of children born overseas and who speak English as a second language than Canada
Bay, and the rate of children considered developmentally vulnerable in one domain in Canada Bay is lower
than in Ryde (17.5%). Some children face particular development challenges when they are considered
vulnerable on multiple domains. In Ryde, this proportion was 7.6% of all children, a rate similar to that in
Hornsby (7.7%) and Canada Bay (7.5%), and lower than Parramatta (12.8%), (Australian Early Development
Index 2010).

Quality of Life Indicators Comprehensive Report: City of Ryde
151
References
Australian Early Development Index 2010, Australian Early Development Index Data, Department of Education,
Employment and Workplace Relations, Melbourne.
Karoly, L., Kilburn, R. and Cannon, J. 2005, Early childhood interventions: Proven results, future promise, RAND
Corporation, Santa Monica.

Quality of Life Indicators Comprehensive Report: City of Ryde
152
Key indicator: Child literacy and numeracy Related 2021 Goals
Ryde 6.3 Our community is able to learn and grow through a wealth of art, culture and lifelong learning opportunities
NSW 15 Improve education and learning outcomes for all students
About this indicator
Achieving adequate literacy and numeracy
standards are an important part of reaching
learning outcomes. National minimum
standards record those levels of education
below which a child has difficulty
progressing satisfactorily at school. The
NAPLAN (National Assessment Program –
Literacy and Numeracy) indicates levels of
achievement as a student progresses from
years 3-9 across both literacy and numeracy
(Australian Curriculum, Assessment and
Reporting Authority 2009).
Data for this indicator is only available by the collection districts used by the NSW Department of Education.
Ryde is part of the Northern Sydney region.
Figure 1, below, shows the very high proportions of students meeting NAPLAN minimum standards in
Northern Sydney: 99.0% of Year 3 students met the benchmark, 98.4% of Year 5 students, 98.2% of Year 7
students and 96.7% of students at Year 9. Also, younger students in Northern Sydney showed slight
improvements since 2007/08 (0.1% increase for Year 3; 0.6% for Year 5) while those in older age groups
tended to decrease (Year 7: 0.7% decrease and Year 9: 0.6% decrease). Despite some minor decreases,
the reading NAPLAN standards in North Sydney remain higher than students across Sydney – and Western
Sydney in particular – in all age groups (Australian Curriculum, Assessment and Reporting Authority 2009).

Quality of Life Indicators Comprehensive Report: City of Ryde
153
Figure 1: Students sitting NAPLAN at or above Minimum Standards (%),
reading and numeracy, Sydney, 2009
Source: Australian Curriculum, Assessment and Reporting Authority, 2009.
Figure 1 also shows that numeracy among children in Northern Sydney is high, with 98.8% of Year 3, 99.5%
of Year 5, 98.7% of Year 7, and 99.0% of Year 9 students meeting the NAPLAN benchmarks. In addition, the
values for both Year 5 and Year 9 have increased since 2007/08 (both increasing 0.6%) while the values for
Year 3 and Year 7 decreased slightly (0.5% and 0.7% decreases, respectively). Despite these slight
decreases the overall numeracy results for the Northern Sydney region remain consistently stronger than
both Sydney and Northern Sydney across all years (Australian Curriculum, Assessment and Reporting
Authority 2009).
References
Australian Curriculum, Assessment and Reporting Authority 2009, National Assessment Program Literacy and Numeracy
Regional Results Summary Report, Department of Education, Employment and Workplace Relations, Canberra.
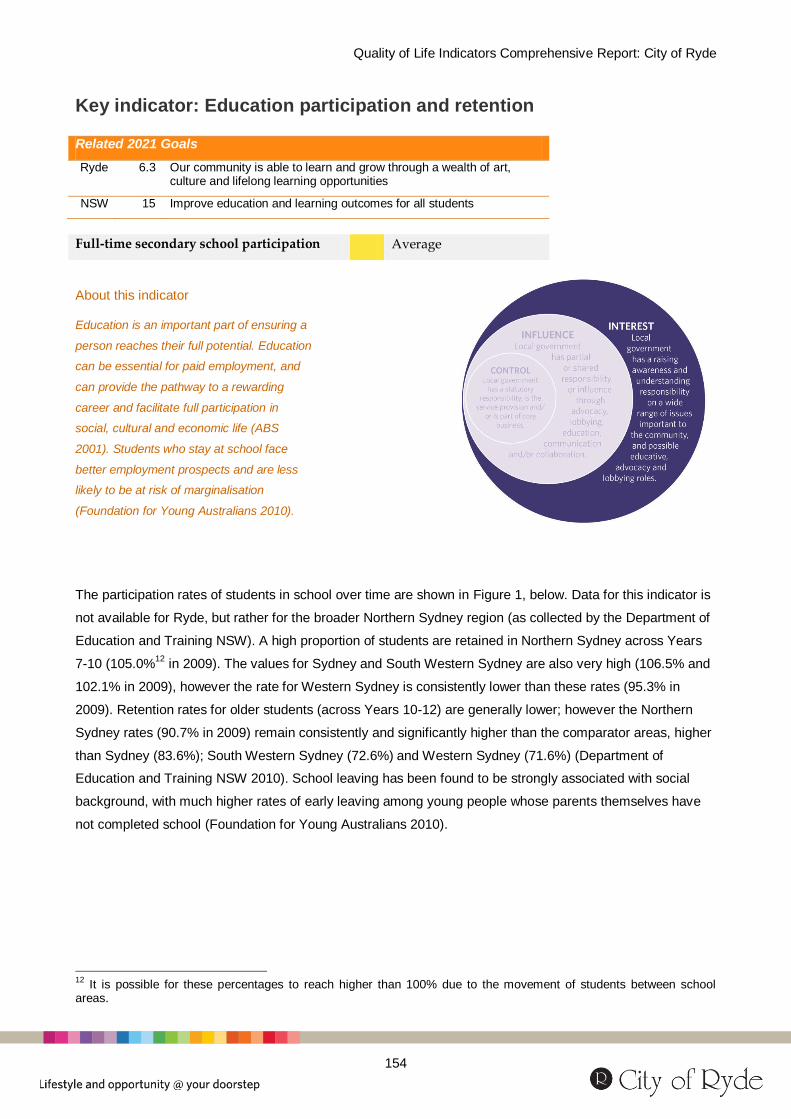
Quality of Life Indicators Comprehensive Report: City of Ryde
154
Key indicator: Education participation and retention Related 2021 Goals
Ryde 6.3 Our community is able to learn and grow through a wealth of art, culture and lifelong learning opportunities
NSW 15 Improve education and learning outcomes for all students
Full-time secondary school participation Average
About this indicator
Education is an important part of ensuring a
person reaches their full potential. Education
can be essential for paid employment, and
can provide the pathway to a rewarding
career and facilitate full participation in
social, cultural and economic life (ABS
2001). Students who stay at school face
better employment prospects and are less
likely to be at risk of marginalisation
(Foundation for Young Australians 2010).
The participation rates of students in school over time are shown in Figure 1, below. Data for this indicator is
not available for Ryde, but rather for the broader Northern Sydney region (as collected by the Department of
Education and Training NSW). A high proportion of students are retained in Northern Sydney across Years
7-10 (105.0%12
in 2009). The values for Sydney and South Western Sydney are also very high (106.5% and
102.1% in 2009), however the rate for Western Sydney is consistently lower than these rates (95.3% in
2009). Retention rates for older students (across Years 10-12) are generally lower; however the Northern
Sydney rates (90.7% in 2009) remain consistently and significantly higher than the comparator areas, higher
than Sydney (83.6%); South Western Sydney (72.6%) and Western Sydney (71.6%) (Department of
Education and Training NSW 2010). School leaving has been found to be strongly associated with social
background, with much higher rates of early leaving among young people whose parents themselves have
not completed school (Foundation for Young Australians 2010).
12
It is possible for these percentages to reach higher than 100% due to the movement of students between school areas.

Quality of Life Indicators Comprehensive Report: City of Ryde
155
Figure 1: Apparent Retention Rate (%), Sydney areas,
time series 2003-2009
Source: Department of Education and Training NSW, 2010.
The incidence of students receiving long suspensions is low in Northern Sydney, at 0.5% of all students in
2008. By comparison, the rate for South Western Sydney was 2.0%, Western Sydney 1.8% and Sydney
0.9%. All of these rates have increased slightly since 2006 (e.g. the rate in 2006 for Northern Sydney was
0.4%). The majority of suspensions in NSW are for secondary students (71% of all suspensions are for
students in years 7-10). The major reasons for long suspensions are violence (47%) and persistent
misbehaviour (39%) (Department of Education and Training NSW 2008).
For primary students, the majority attended a government school (63.7%) compared with 36.3% attending a
non-government school (28.0% in Catholic schools). The ABS (2007) reported there is a slightly lower
proportion (52.5%) of secondary students attend government schools, with 47.5% attending a non-
government school, including 34.1% attending Catholic schools.
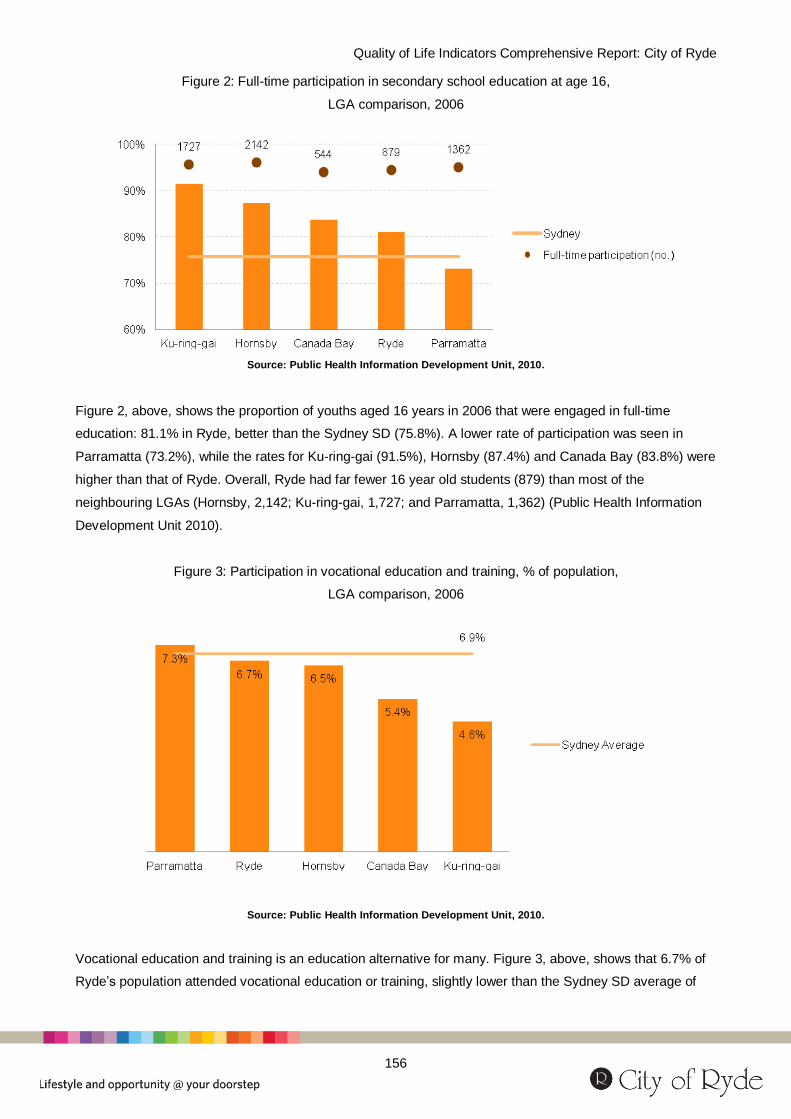
Quality of Life Indicators Comprehensive Report: City of Ryde
156
Figure 2: Full-time participation in secondary school education at age 16,
LGA comparison, 2006
Source: Public Health Information Development Unit, 2010.
Figure 2, above, shows the proportion of youths aged 16 years in 2006 that were engaged in full-time
education: 81.1% in Ryde, better than the Sydney SD (75.8%). A lower rate of participation was seen in
Parramatta (73.2%), while the rates for Ku-ring-gai (91.5%), Hornsby (87.4%) and Canada Bay (83.8%) were
higher than that of Ryde. Overall, Ryde had far fewer 16 year old students (879) than most of the
neighbouring LGAs (Hornsby, 2,142; Ku-ring-gai, 1,727; and Parramatta, 1,362) (Public Health Information
Development Unit 2010).
Figure 3: Participation in vocational education and training, % of population,
LGA comparison, 2006
Source: Public Health Information Development Unit, 2010.
Vocational education and training is an education alternative for many. Figure 3, above, shows that 6.7% of
Ryde’s population attended vocational education or training, slightly lower than the Sydney SD average of
Quality of Life Indicators Comprehensive Report: City of Ryde
157
6.9%. Ryde’s rate is higher than that of Hornsby (6.5%), Canada Bay (5.4%) and Ku-ring-gai (4.6%) but
lower than that of Parramatta (7.3%) (Public Health Information Development Unit 2010). In Ryde, 65.8% of
those attending vocational education or further education participate full-time, with 33.9% attending part-
time. By comparison, 75.0% of those attending university or tertiary education participate full-time (ABS
2007).
References
Australian Bureau of Statistics 2001, Measuring Wellbeing, Cat No. 4160.0, Australian Bureau of Statistics, Canberra.
Australian Bureau of Statistics 2007, 2006 Census Tables, Cat. No. 2068.0, Australian Bureau of Statistics, Canberra.
Foundation for Young Australians 2010, How Young People are Faring, Foundation for Young Australians, Melbourne.
Department of Education and Training NSW 2010, Statistical Bulletin: Schools and Students in New South Wales, 2009,
Department of Education and Training NSW, Sydney.
Public Health Information Development Unit 2010, Social Health of Australia Atlas, Public Health Information
Development Unit, Adelaide.

Quality of Life Indicators Comprehensive Report: City of Ryde
158
Key indicator: Youth engagement Related 2021 Goals
Ryde 6.3 Our community is able to learn and grow through a wealth of art, culture and lifelong learning opportunities
NSW 1 Improve the performance of the NSW economy
Young people earning or learning Average
About this indicator
This indicator considers how engaged young
people are with either the workforce or
education, and allows a more detailed
picture to be presented on the learning being
attained by young people for work and post-
school life. This indicator is a common way
of capturing a community’s position in
preparing its young people. Young people
not in the workforce or education miss out
on important experiences and may suffer
from decreased chances of employment in
the future, as well as lower productivity.
Increasing the proportion of people in
education or work can increase young
people’s resources and build attachment to
the community (Foundation for Young
Australians 2010).
Some young people elect to leave formal schooling for the workforce, so measures of youth engagement
should also capture the number of young people fully engaged in employment (Foundation for Young
Australians 2010). Figure 1, below, shows that in 2006, 85.2% of young people in Ryde were either engaged
fully in the workforce, in education or some combination of the two, a rate similar to that in Canada Bay
(85.1%). This rate is higher than the Sydney SD rate of 80.8%, as well as the proportion in Parramatta
(79.3%). Both Ku-ring-gai and Hornsby had higher rates of youth engagement than Ryde (92.5% and 89.7%,
respectively).

Quality of Life Indicators Comprehensive Report: City of Ryde
159
Figure 1: Learning or Earning, ages 15-19, 2006
Source: Public Health Information Development Unit, 2010.
These figures are for 2006, and more recent studies have indicated that the economic downturn have had
particularly negative impacts on young people. Teenagers not in education faced an unemployment rate of
nearly 18% in Australia in 2010, and males not in education are more likely to be unemployed than females
(females are instead more likely to be not in the labour force). Early school leavers are three times as likely
to be unemployed than degree holders, and less likely to have full-time work. Apprenticeships are an
important training pathway for many teenagers; however they have also been hit by the economic crisis, with
the availability of apprenticeships for teenagers shrinking since 2008 (Foundation for Young Australians
2010). There is no recent data available on these issues at the LGA level.
References
Foundation for Young Australians 2010, How Young People are Faring, Foundation for Young Australians, Melbourne.
Public Health Information Development Unit 2010, Social Health of Australia Atlas, Public Health Information
Development Unit, Adelaide.

Quality of Life Indicators Comprehensive Report: City of Ryde
160
Key indicator: Post-school qualifications Related 2021 Goals
Ryde 6.3 Our community is able to learn and grow through a wealth of art, culture and lifelong learning opportunities
NSW 6 Strengthen the NSW skill base
People with no post-school qualification Average
People with a Bachelor or higher degree Average
About this indicator
Higher levels of education and training can
assist people in developing knowledge and
skills that can be used to improve personal
living standards, as well as the resources
available to a community. For an individual,
educational attainment can assist in finding
and developing a rewarding long-term
career. For the wider community, having a
knowledgeable and well-educated
population is vital for supporting economic
development, improving living conditions
and community networks, and therefore -
social inclusion. Post-school qualifications
refer to those qualifications awarded for
attainments other than pre-primary, primary
and secondary education.
The level of post-school qualifications across comparator LGAs is shown in Figure 1, below. The proportion
of residents holding bachelor degrees in Ryde in 2006 (27.5%) was well above the Sydney SD (20.0%), and
was higher than both Canada Bay (26.9%) and Parramatta (20.8%), but lower than Ku-ring-gai (39.0%) and
Hornsby (29.3%). A similar trend prevailed for Advanced Diplomas and Diplomas (9.5% in Ryde), higher
than Canada Bay (9.2%) and Parramatta (7.7%) but lower than Ku-ring-gai (11.3%) and Hornsby (10.8%).
Vocational qualifications were most common in Hornsby (14.0%); Parramatta (13.6%) and Canada Bay
(13.1%) than for both Ryde (12.9%) and Ku-ring-gai (8.2%), (ABS 2007).

Quality of Life Indicators Comprehensive Report: City of Ryde
161
Figure 1: Level of post-school qualifications, LGA comparison, 2006
Source: Australian Bureau of Statistics, 2007.
Levels of post-school qualifications have increased over time in Ryde. In 1991 the proportion of the
population with a bachelor or higher degree (13.0%) was less than half that in 2006 (27.5%). The proportion
of people holding advanced diplomas or diplomas have also increased (from 6.5% to 9.5%), while vocational
qualifications are somewhat less common (14.5% in 1991 to 12.9% in 2006). Overall the proportion of
people without qualifications has dropped markedly over the 15 years to 2006, from over half the population
52.7%, to 37.3%. Figure 2, below, shows that there were higher concentrations of people without post-school
qualifications between Ryde and North Ryde, while the areas of Denistone and West Ryde tended to have a
lower proportion of people with no post-school qualification (ABS 2007).
In Ryde, slightly more females than males held bachelor degrees or higher (45.4% of all females holding
post-school qualifications and 42.5% of males holding post-school qualifications). This trend was reflected in
Parramatta (38.3% females vs. 34.9% males) and Canada Bay (45.4% vs.40.5%) and to a lesser extent in
Hornsby (45.8% vs. 45.7%). By contrast, males in Ku-ring-gai were much more likely to hold a bachelors or
equivalent than females (61.8% vs. 53.2%). Females in Ryde were also more likely to hold an advanced
diploma (17.6%) compared to males (12.7%). The reverse was true for vocational qualifications: 26.8%
among males and 14.5% among females (ABS 2007).
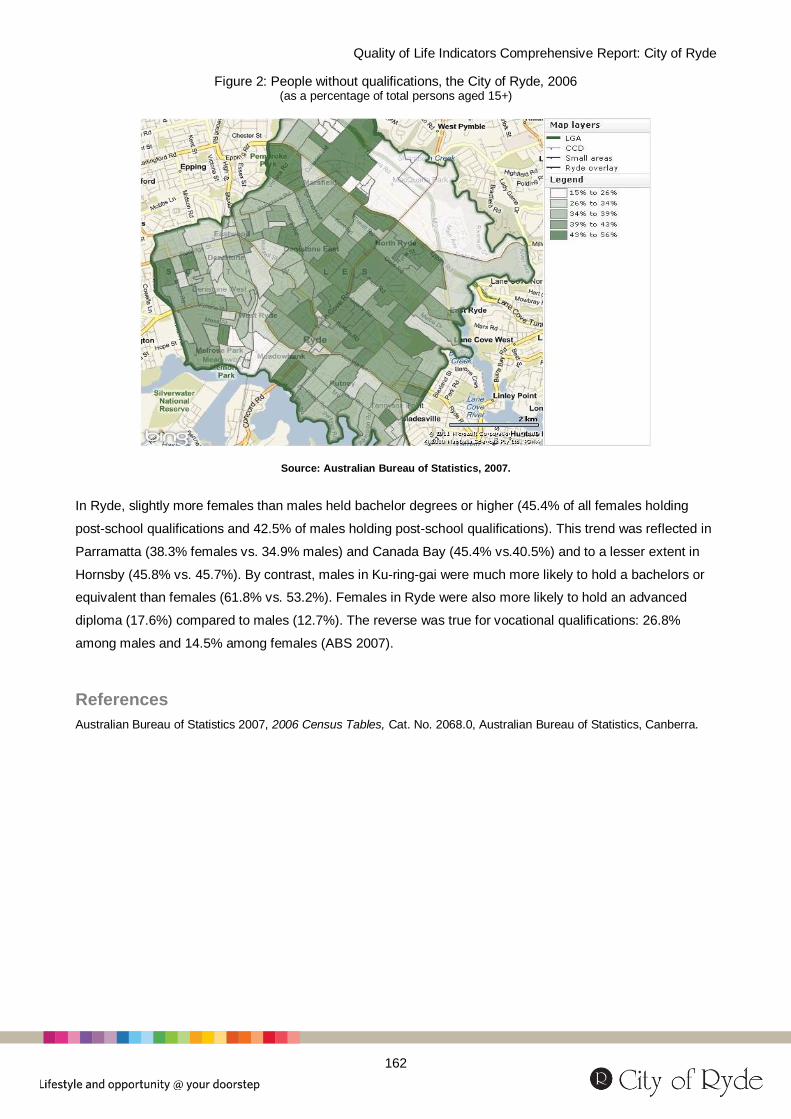
Quality of Life Indicators Comprehensive Report: City of Ryde
162
Figure 2: People without qualifications, the City of Ryde, 2006 (as a percentage of total persons aged 15+)
Source: Australian Bureau of Statistics, 2007.
In Ryde, slightly more females than males held bachelor degrees or higher (45.4% of all females holding
post-school qualifications and 42.5% of males holding post-school qualifications). This trend was reflected in
Parramatta (38.3% females vs. 34.9% males) and Canada Bay (45.4% vs.40.5%) and to a lesser extent in
Hornsby (45.8% vs. 45.7%). By contrast, males in Ku-ring-gai were much more likely to hold a bachelors or
equivalent than females (61.8% vs. 53.2%). Females in Ryde were also more likely to hold an advanced
diploma (17.6%) compared to males (12.7%). The reverse was true for vocational qualifications: 26.8%
among males and 14.5% among females (ABS 2007).
References
Australian Bureau of Statistics 2007, 2006 Census Tables, Cat. No. 2068.0, Australian Bureau of Statistics, Canberra.

Quality of Life Indicators Comprehensive Report: City of Ryde
163
Key indicator: Library use Related 2021 Goals
Ryde 6.3 Our community is able to learn and grow through a wealth of art, culture and lifelong learning opportunities
About this indicator
Libraries are an important educational and
cultural resource. Libraries are an important
service for further education and for
accessing information; they also provide a
venue for social participation, communities
and networks. This indicator measures the
frequency of access of library resources.
There are five libraries for public use in Ryde: Ryde, Eastwood, North Ryde, West Ryde and Gladesville
(jointly funded with the Municipality of Hunters Hill). Membership of libraries in 2009 in Ryde was 50.8% of
the total resident population (see Figure 1, below). This level of access to libraries is similar to that of Ku-
ring-gai (50.3% of the population), greater than that of Parramatta (42.5%) and Hornsby (41.9%), and slightly
lower than that of Canada Bay (52.1%). This access is also higher than the NSW rate of 45.1% (State
Library of New South Wales 2010).
Figure 1: Library membership, LGA comparison, 2009
Source: State Library of New South Wales, 2010.

Quality of Life Indicators Comprehensive Report: City of Ryde
164
Satisfaction with library services in Ryde was 83% in 2008, with 36% being ‘very satisfied’ (City of Ryde
2008).
References
City of Ryde 2008, Community Satisfaction Survey 2008, City of Ryde, Sydney.
State Library of NSW 2010, Library statistics, 2008/09, State Library of NSW, Sydney.

Quality of Life Indicators Comprehensive Report: City of Ryde
165
Key indicator: Ryde’s culturally and linguistically Diverse (CALD) community Related 2021 Goals
Ryde 6.3 Our residents are proud of their diverse community, celebrating their similarities and differences
About this indicator
Australia values its diversity and
multiculturalism. However, being a migrant
from another country can be challenging and
often is related to some indicators of social
disadvantage. This indicator provides an
outline of the culturally and linguistically
diverse communities of Ryde, as well as
trends in migration.
Ryde is a very diverse LGA. Figure 1, below, shows that 40.4% of Ryde residents were born overseas in
2006. The majority of those born overseas were from Asia (22.8%), with smaller proportions from Europe
(9.7%), Africa and the Middle East (4.2%), Oceania (2.3%) and the Americas (1.4%). Among the comparator
LGAs, only Parramatta had a higher proportion of residents from overseas (43.6%). Asia was also the most
common place of birth in Parramatta (22.8%), Hornsby (16.5%) and Ku-ring-gai (12.0%). Canada Bay had
the highest proportion of residents born in Europe (15.7%). In Ryde, 0.3% (267 persons) indicated that they
were Indigenous at the 2006 Census (ABS 2007).
Figure 1: Birthplace of residents, by continent, LGA comparison, 2006
Source: Australian Bureau of Statistics, 2007.
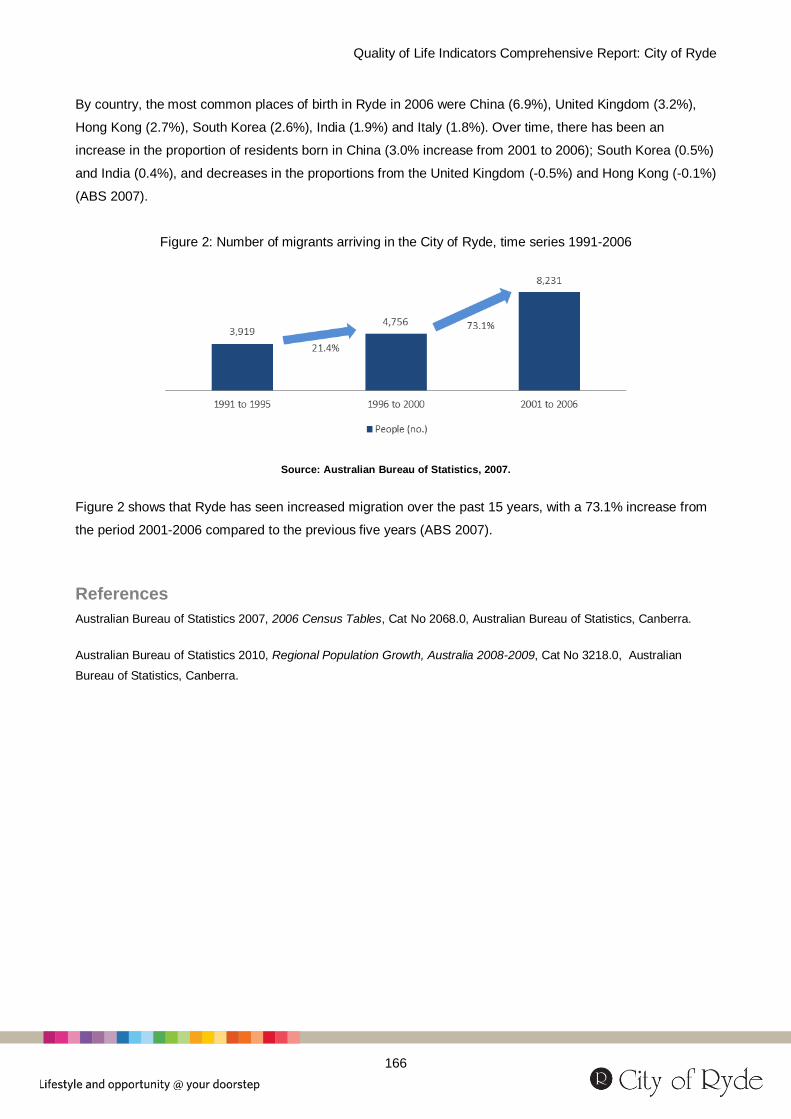
Quality of Life Indicators Comprehensive Report: City of Ryde
166
By country, the most common places of birth in Ryde in 2006 were China (6.9%), United Kingdom (3.2%),
Hong Kong (2.7%), South Korea (2.6%), India (1.9%) and Italy (1.8%). Over time, there has been an
increase in the proportion of residents born in China (3.0% increase from 2001 to 2006); South Korea (0.5%)
and India (0.4%), and decreases in the proportions from the United Kingdom (-0.5%) and Hong Kong (-0.1%)
(ABS 2007).
Figure 2: Number of migrants arriving in the City of Ryde, time series 1991-2006
Source: Australian Bureau of Statistics, 2007.
Figure 2 shows that Ryde has seen increased migration over the past 15 years, with a 73.1% increase from
the period 2001-2006 compared to the previous five years (ABS 2007).
References
Australian Bureau of Statistics 2007, 2006 Census Tables, Cat No 2068.0, Australian Bureau of Statistics, Canberra.
Australian Bureau of Statistics 2010, Regional Population Growth, Australia 2008-2009, Cat No 3218.0, Australian
Bureau of Statistics, Canberra.

Quality of Life Indicators Comprehensive Report: City of Ryde
167
Key indicator: Level of spoken English Related 2021 Goals
Ryde 6.3 Our residents are proud of their diverse community, celebrating their similarities and differences
About this indicator
Language is an important expression of
culture. An inability to communicate with
others because of language barriers can
cause isolation from the community. As
Australia is largely monolingual, poor
English language skills can restrict social
participation, representation, inclusion and
the likelihood of obtaining gainful
employment. This data is collected from the
Census and is self-assessed, or is assessed
by another person.
Attaining adequate command of English can be particularly hard for people from non-English speaking
countries. During 2006 in Ryde, 31.5% of residents were born in a non-English speaking country. This rate is
higher than the Sydney SD average of 23.9%, and those of Canada Bay (24.6%); Hornsby (22.7%) and Ku-
ring-gai (17.7%). Only Parramatta had a higher rate at 35.1% (ABS 2007). Of all those people born in a non-
English speaking country in Ryde, 21.6% had been in Australia less than five years (with the remaining
78.4% having been in Australia five years or more). Parramatta also had a higher proportion of migrants
living in Australia less than five years at nearly one-quarter of the population (24.0%); there were lower rates
in Hornsby (16.1%), Parramatta (12.4%) and Canada Bay (11.9%), (Public Health Information Development
Unit 2010).
Figure 1, below looks at rates of people who do not speak English well or at all across the comparator LGAs,
among people who speak a language other than English at home. Compared with the other LGAs, Ryde has
a very high level of people speaking a language other than English at home (38.4%) which has increased
since 2001 (32.5%). Parramatta also has a high percentage of people not speaking English at home
(47.5%), while the percentages are smaller in Canada Bay (33.7%), Hornsby (24.8%) and Ku-ring-gai
(17.7%). In 2006, 13.4% of Ryde residents were considered to speak English poorly or not at all; this rate
has slightly decreased since 2001 (when it was 13.5%). Both Parramatta (16.4%) and Canada Bay (14.4%)
have higher proportions than Ryde, while the LGAs of Hornsby (8.6%) and Ku-ring-gai (5.3%) have lower
proportions (see Figure 1).

Quality of Life Indicators Comprehensive Report: City of Ryde
168
Figure 1: Level of spoken English, LGA comparison, 2001
Source: Australian Bureau of Statistics, 2007.
The level of English proficiency among people that speak another language at home is lower in older age
groups. In Ryde, speaking English poorly or not at all was most prevalent in the age groups of 85 years and
over (48.8%), 75-84 years (43.9%) and 65-74 years (38.4%) (ABS 2007).
References
Australian Bureau of Statistics 2007, 2006 Census Tables, Cat. No. 2068.0, Australian Bureau of Statistics, Canberra.
Public Health Information Development Unit 2010, Social Health of Australia Atlas, Public Health Information
Development Unit, Adelaide.

Quality of Life Indicators Comprehensive Report: City of Ryde
169
Key indicator: Participation in work and learning by culturally and linguistically diverse (CALD) communities Related 2021 Goals
Ryde 6.1 Our residents are proud of their diverse community, celebrating their similarities and differences
NSW 1 Improve the performance of the NSW economy
About this indicator
Removing barriers to participation by
migrants and people from CALD
backgrounds can contribute to encouraging
culture and harmony. CALD communities
may find it more difficult to secure work or
successfully complete education in Australia,
and this indicator measures how the benefits
and opportunities offered through education
and employment are extended to migrant
communities. This indicator measures
participation by migrants in education and
the workforce.
Although migration is often associated with social disadvantage, the picture in Sydney is somewhat different
with higher rates of education and employment among migrants, particularly from some countries. The same
trend exists in Ryde, as migrants generally hold more qualifications than their Australian-born counterparts
(see Figure 1, below). Compared to migrants from the top five birthplaces for overseas born residents,
Australian-born residents of Ryde have the highest proportion of the population that have not completed year
12 (27.5%) and the lowest rate of tertiary study completed (bachelor degree or higher: 28.9%). Over half of
the migrants from India (74.0%) and China (51.6%) held a bachelor’s degree or higher (although not all are
recognised in Australia). People born in Hong Kong and China had highest proportions of advanced
diplomas or diplomas (15.5% and 15.4%, respectively), while certificate qualifications were the most
common among Australian born residents (15.7%) and those born in the UK (14.0%), (ABS 2007).

Quality of Life Indicators Comprehensive Report: City of Ryde
170
Figure 1: Highest qualification by birthplace, Ryde, 2006
Source: Australian Bureau of Statistics, 2007.
The highest rates of employment in Ryde are seen among people born in India (72.5%), Australia (65.2%),
the United Kingdom (63.0%) and Hong Kong (62.4%). The highest levels of unemployment (but not much
higher than average) was among those born in China (6.0%) and South Korea (5.0%); where there were
also high levels of residents not in the labour force,43.9% and 43.1%, respectively (ABS 2007).
Figure 2: Weekly income by birthplace, Ryde, 2006
Source: Australian Bureau of Statistics, 2007.
Figure 2, above, shows that higher incomes in Ryde tended to be concentrated among people born in the
UK (where 38.8% of employees earn over $1,000 a week), Australia (29.4%) and India (35.7%). There were
similar levels of 'middle incomes' (between $250 and $1000 a week) across all of the groups, with the
highest rate in South Korea (48.6%) and the lowest for people born in China (34.8%). Lower incomes (under
Quality of Life Indicators Comprehensive Report: City of Ryde
171
$250 per week) were most common for people born in China (52.6%), Hong Kong (38.7%) and South Korea
(37.7%), and least common for those born in the United Kingdom (19.3%), Australia (24.5%) and India
(25.7%), (ABS 2007).
References
Australian Bureau of Statistics 2007, 2006 Census Tables, Cat. No. 2068.0, Australian Bureau of Statistics, Canberra.
Public Health Information Development Unit 2010, Social Health of Australia Atlas, Public Health Information
Development Unit, Adelaide.

Quality of Life Indicators Comprehensive Report: City of Ryde
172
Key indicator: Participation in cultural, recreational and leisure activities Related 2021 Goals
Ryde 6.2 People living in and visiting our city have access to an inclusive and diverse range of vibrant community and cultural places and spaces.
NSW 27 Enhance cultural, creative, sporting and recreation opportunities
About this indicator
This indicator considers participation in
cultural and other activities which can
contribute to achieving harmony. In addition
to any physical health benefits, involvement
in recreational and leisure activities often
involves social participation. It provides an
opportunity for meeting new people with
similar interests, and strengthening
relationships through group effort to a
common goal (ABS 2006). Involvement in
such activities can help in the creation of a
sense of belonging for an individual.
In NSW in 2006, 87.0% of all people had attended at least one cultural and leisure event in the last 12
months, with a rate slightly higher for females (88.3%) than males (85.6%). Figure 1, below, shows that,
while participation did generally decrease with age, cultural and leisure activity attendance was common
across all age groups, with well over half (65.0%) of the oldest age group (75 years and over) participating.
Participation in sport or recreational physical activity is also very popular across all age groups (58.7%), as
well as attending sporting events (49.4%), however these activities are more popular among males than
females (62.0% of males participating, compared with 55.5% of females; for attendance the respective
values are 57.6% and 41.3%), see Figure 1, below. Participation in sport of recreational physical activity and
attending a sporting event decreased in popularity among older age groups (ABS 2006).

Quality of Life Indicators Comprehensive Report: City of Ryde
173
Figure 1: Cultural, recreational and leisure activity attendance,
by age NSW, 2006
Source: Australian Bureau of Statistics, 2007.
Participation in groups is another type of leisure activity, with 62.8% of people in NSW actively participating
in social groups and 33.3% participating in community support groups. The most popular types of groups
include sport and physical recreation groups (31.8%), social clubs providing restaurants (23.9%), religious or
spiritual groups (20.7%), and education and training (12.4%; ABS 2006). These are shown in Figure 2,
below.
Figure 2: Participation in groups, by group type, NSW, 2006
Source: Australian Bureau of Statistics, 2006.

Quality of Life Indicators Comprehensive Report: City of Ryde
174
In Ryde, attendance at key events, festivals and programs organised by the Council grew from 93,945 in
2008/9 to 105,470 attendees in 2009/10, an increase of 12.3%. Satisfaction with events and festivals in Ryde
was 79% in 2008, representing an increase since 2009 of 70% (City of Ryde 2010).
References
Australian Bureau of Statistics 2006, General Social Survey, Cat. No. 4159.0, Australian Bureau of Statistics, Canberra.
Australian Bureau of Statistics 2007, 2006 Census Tables, Cat. No. 2068.0, Australian Bureau of Statistics, Canberra.
City of Ryde 2010, Annual Report 2010, City of Ryde, Sydney.

Quality of Life Indicators Comprehensive Report: City of Ryde
175
Discussion This chapter considers the related community outcomes of harmony and culture. A variety of indicators on
learning show that educational performance in Northern Sydney and Ryde is consistently strong. Within the
state, Northern Sydney parents were most likely to read to their children, and preschool attendance was
high. Early childhood development measures showed high attainment by children in Ryde (with low number
of children who are developmentally at risk or vulnerable in terms of social competence, emotional maturity
and communication skills). Literacy and numeracy figures in Northern Sydney remained consistently high,
compared with the state, the Sydney average, and for Western Sydney. School retention figures in Northern
Sydney were also very high, and youth engagement in work or education was higher than Sydney averages.
How do we consolidate the high educational achievements of children in the City of Ryde and
Northern Sydney? There is still scope for further engagement of young people in either work or
education, how can we achieve this?
Ryde is a culturally diverse LGA, with over 40% of the population born overseas, higher than for many
neighbouring areas. Levels of migration are high (73.1% increase 2001 to 2006). A very high proportion of
the population are from a non-English speaking background (31.5%), and 38.4% speak a language other
than English at home. Despite this increasingly diverse cultural composition, the rate of residents who speak
English poorly or not at all has decreased. Moreover, in general migrants (particularly from India and China)
tend to hold both more and higher qualifications than their Australian-born counterparts. Nonetheless, lower
incomes and higher unemployment were concentrated among some migrant groups (including those from
China and South Korea).
What can we do to celebrate cultural diversity in Ryde? How can we support migrant
communities to contribute their skills to our economy and community?
Participation in cultural, recreational and leisure activities is popular among all age groups, but does tend to
decrease with age. Participation was most common in sporting and physical groups, followed by social clubs
and religious clubs. Social activities also tended to decrease with age, and older people feel less confident
seeking support in times of crisis and asking for small favours. These figures are not available for Ryde, with
only state (NSW) data available, and this data is from 2006.
Can we expect these findings to be indicative of the reality of social participation Ryde in 2011?

Quality of Life Indicators Comprehensive Report: City of Ryde
176
The indicators in this chapter are subject to some further data limitations. Much of the indicators on learning
rely upon data from the NSW Department of Health, which is only collected on the basis of Northern Sydney.
Other indicators show that Ryde is distinct from neighbouring LGAs (e.g. early childhood development);
however these comparisons are not available for other indicators and issues. In addition, some findings by
LGA rely on data from 2006.
Is it important that we monitor some of these indicators at the LGA level? Is there reason to
expect there may be differences between Ryde and its Northern Sydney neighbours?

Quality of Life Indicators Comprehensive Report: City of Ryde
177
A City of Progressive Leadership Outcome
A well-led and managed city, supported by ethical organisations, delivering services to our community by listening, advocating and responding to their needs.
Introduction Progressive leadership is able to promote a sense of purpose and achievement in a community. In addition,
an ability to participate in society or to be involved in the decision-making process encourages social
inclusion. Instead of focussing exclusively on barriers to social participation, however, the analysis in this
chapter provides an insight into how residents themselves contribute to the decisions and institutions that
shape their lives in Ryde.
This chapter first turns to considering civic participation and engagement by looking at individuals’
perspectives on their ability to influence decision-makers. This measures the perceived access to decision-
making institutions and formal positions of leadership by the community. Leadership can also be informal,
and indications of the depth of leadership skills in Ryde are examined by considering the proportions of
workers in managerial, administrative and professional roles.
Finally, this chapter turns to the resources available in a community to support its residents. Firstly, this
chapter looks at the number and distribution of community services across the LGA, which provides a
measure of the services available to residents. Volunteering is an important source of support for many
community organisations and individuals, and also has many positive impacts on those people who choose
to volunteer, and is the final main indicator for this chapter.
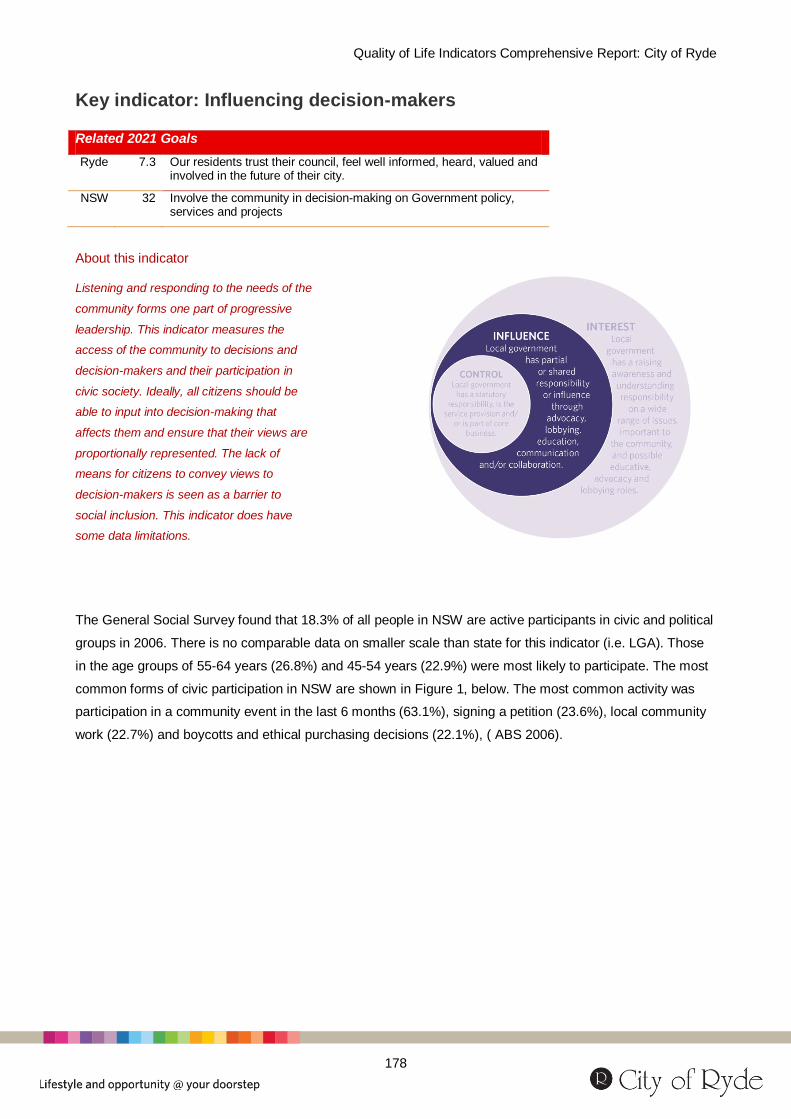
Quality of Life Indicators Comprehensive Report: City of Ryde
178
Key indicator: Influencing decision-makers Related 2021 Goals
Ryde 7.3 Our residents trust their council, feel well informed, heard, valued and involved in the future of their city.
NSW 32 Involve the community in decision-making on Government policy, services and projects
About this indicator
Listening and responding to the needs of the
community forms one part of progressive
leadership. This indicator measures the
access of the community to decisions and
decision-makers and their participation in
civic society. Ideally, all citizens should be
able to input into decision-making that
affects them and ensure that their views are
proportionally represented. The lack of
means for citizens to convey views to
decision-makers is seen as a barrier to
social inclusion. This indicator does have
some data limitations.
The General Social Survey found that 18.3% of all people in NSW are active participants in civic and political
groups in 2006. There is no comparable data on smaller scale than state for this indicator (i.e. LGA). Those
in the age groups of 55-64 years (26.8%) and 45-54 years (22.9%) were most likely to participate. The most
common forms of civic participation in NSW are shown in Figure 1, below. The most common activity was
participation in a community event in the last 6 months (63.1%), signing a petition (23.6%), local community
work (22.7%) and boycotts and ethical purchasing decisions (22.1%), ( ABS 2006).

Quality of Life Indicators Comprehensive Report: City of Ryde
179
Figure 1: Civic participation, % of population, NSW, 2006
Source: Australian Bureau of Statistics, 2006.
Across NSW, 29.0% of the population feels able to have a say within the community on important issues all
or most of the time, 24.2% some of the time, and 46.8% are able to have a say little or none of the time.
Younger people aged 18-24 years (50.8%) and older people aged 65 years and over (50.0%) were the most
likely to respond ‘little or none of the time’. Interestingly, these age groups also reported the highest
percentages for ‘all or most of the time’: 29.6% and 33.1% respectively. Higher levels of people in the middle
age groups of 35-44 years (29.9%) and 45-54 years (30.4%) also reported ‘all or most of the time’ (ABS
2006).
In Ryde, access to main decision-makers at a LGA level is through 12 elected councillors (4 for each ward:
East, Central and West). These councillors attended a total of 381 workshops in 2008/09 (from September
2008-June 2009), and a total 950 council meetings (including council meetings and various committees; City
of Ryde 2009). In the 2009/10 financial year there were 511 workshops and 587 meetings of the City of Ryde
Council (City of Ryde 2010).
Overall performance of management and leadership in the council was rated in 2008 at 6.6 out of 10. This
represents an overall increase since 2006, when the value was 6.3 out of 10. The performance of Ryde in
representing, lobbying and advocating on behalf of the community was 6.2 out of 10. Community
engagement on behalf of Ryde was rated at 6.0 out of 10. The Central Ward in Ryde reported higher
satisfaction with the performance of Ryde in advocacy (6.5) and community engagement (6.4). This measure
was higher than both the West Ward (6.1 for advocacy and 5.7 for community engagement) and East Ward
(5.9 for both advocacy and community engagement) (City of Ryde 2008).

Quality of Life Indicators Comprehensive Report: City of Ryde
180
At the state level, voter turnout in Ryde was 93.0% for the Legislative Assembly elections in 2007, and
93.1% in the Legislative Council. In the House of Representatives, voter turnout in 2010 was 93.5%, a slight
decrease from the 2007 turnout of 95.0%. Voter turnout in Bennelong for the Senate elections was 95.3% in
200713
(Australian Electoral Commission 2010).
References
Australian Bureau of Statistics 2006, General Social Survey, Cat. No. 4159.0, Australian Bureau of Statistics, Canberra.
Australian Electoral Commission 2010, Division of Bennelong, retrieved January 12, 2011 from
http://www.aec.gov.au/profiles/nsw/bennelong.htm
City of Ryde 2008, Community Satisfaction Survey 2008, City of Ryde, Sydney.
City of Ryde 2009, Civic Leadership, City of Ryde, Sydney.
City of Ryde 2010, Annual Report 2010, City of Ryde, Sydney.
13
2007 is the most recent data available on voter turnout for the Senate election.

Quality of Life Indicators Comprehensive Report: City of Ryde
181
Key indicator: Occupation and skills Related 2021 Goals
NSW 6 Strengthen the NSW skill base
Skilled workers Fair
About this indicator
The depth of leadership capital in an area,
and how well it is led and managed may be
associated with the input of the levels of
occupations and skills present in Ryde. The
proportion of the work-force classified as
managers, administrators and professionals
can provide an indication of the presence of
residents in decision-making positions.
In Ryde, 38.2% of the employed labour force was employed as managers, administrators or professionals.
Compared to other areas this rate is relatively low, being smaller than the Sydney SD average of 46.3%.
This figure is also lower than for the comparator LGAs of Ku-ring-gai (52.8%), Hornsby (41.8%) and Canada
Bay (41.5%), but higher than Parramatta (29.3%, see Figure 1; Public Health Information Development Unit
2010). In Ryde, 10.9% of the labour force is made up of managers and administrators, excluding
professionals (ABS 2007).
Figure 1: Managers, administrators and professionals, LGA comparison, 2006
Source: Public Health Information Development Unit, 2010.
Quality of Life Indicators Comprehensive Report: City of Ryde
182
The proportion of unskilled and semi-skilled workers in Ryde was 9.5%, this rate was higher than for Hornsby
(7.7%), Canada Bay (7.0%), the Sydney SD (3.4%) and Ku-ring-gai (3.4%). At 15.1%, Parramatta had the
highest rate of unskilled and semi-skilled workers of the comparator LGAs (Public Health Information
Development Unit 2010).
References
Australian Bureau of Statistics 2007, 2006 Census Tables, Cat. No. 2068.0, Australian Bureau of Statistics, Canberra.
Public Health Information Development Unit 2010, Social Health of Australia Atlas, Public Health Information
Development Unit, Adelaide.
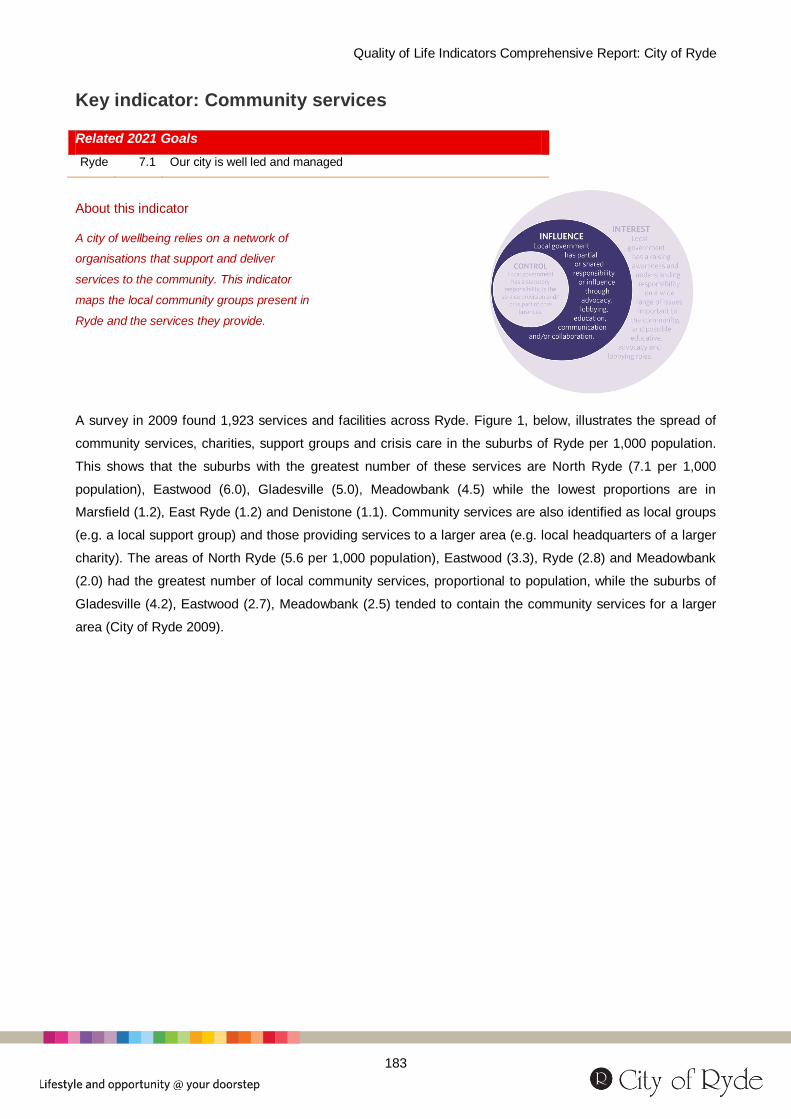
Quality of Life Indicators Comprehensive Report: City of Ryde
183
Key indicator: Community services Related 2021 Goals
Ryde 7.1 Our city is well led and managed
About this indicator
A city of wellbeing relies on a network of
organisations that support and deliver
services to the community. This indicator
maps the local community groups present in
Ryde and the services they provide.
A survey in 2009 found 1,923 services and facilities across Ryde. Figure 1, below, illustrates the spread of
community services, charities, support groups and crisis care in the suburbs of Ryde per 1,000 population.
This shows that the suburbs with the greatest number of these services are North Ryde (7.1 per 1,000
population), Eastwood (6.0), Gladesville (5.0), Meadowbank (4.5) while the lowest proportions are in
Marsfield (1.2), East Ryde (1.2) and Denistone (1.1). Community services are also identified as local groups
(e.g. a local support group) and those providing services to a larger area (e.g. local headquarters of a larger
charity). The areas of North Ryde (5.6 per 1,000 population), Eastwood (3.3), Ryde (2.8) and Meadowbank
(2.0) had the greatest number of local community services, proportional to population, while the suburbs of
Gladesville (4.2), Eastwood (2.7), Meadowbank (2.5) tended to contain the community services for a larger
area (City of Ryde 2009).
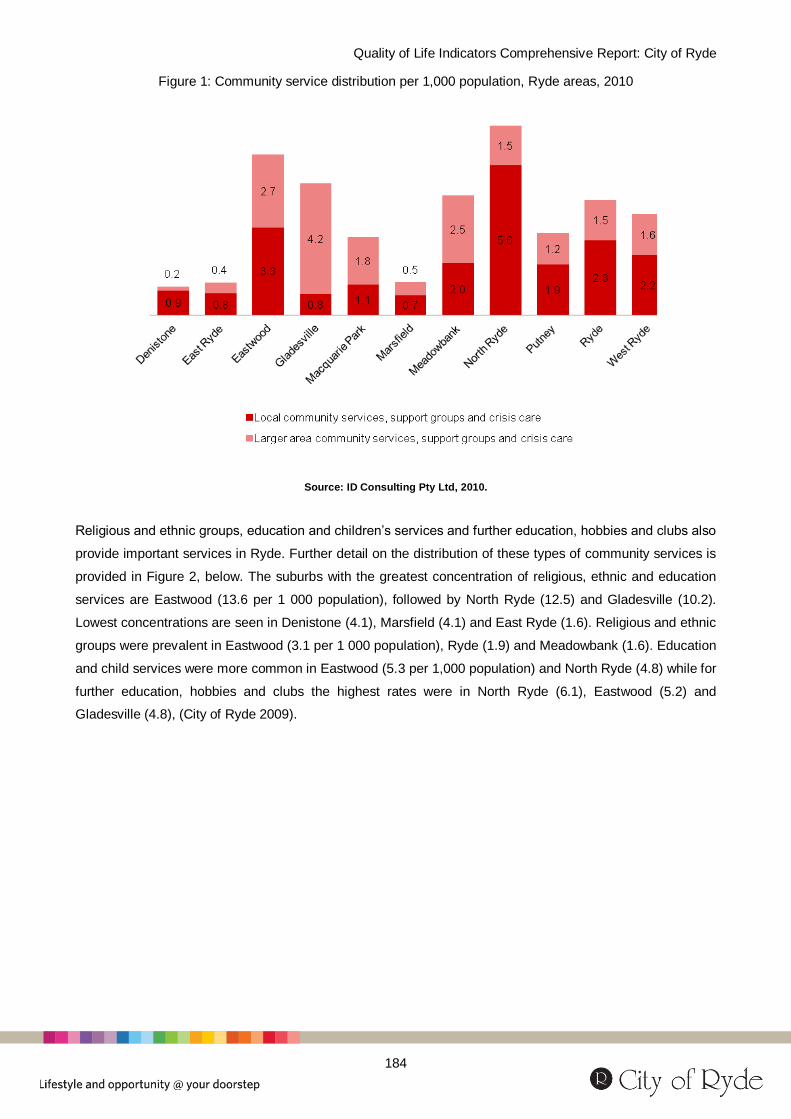
Quality of Life Indicators Comprehensive Report: City of Ryde
184
Figure 1: Community service distribution per 1,000 population, Ryde areas, 2010
Source: ID Consulting Pty Ltd, 2010.
Religious and ethnic groups, education and children’s services and further education, hobbies and clubs also
provide important services in Ryde. Further detail on the distribution of these types of community services is
provided in Figure 2, below. The suburbs with the greatest concentration of religious, ethnic and education
services are Eastwood (13.6 per 1 000 population), followed by North Ryde (12.5) and Gladesville (10.2).
Lowest concentrations are seen in Denistone (4.1), Marsfield (4.1) and East Ryde (1.6). Religious and ethnic
groups were prevalent in Eastwood (3.1 per 1 000 population), Ryde (1.9) and Meadowbank (1.6). Education
and child services were more common in Eastwood (5.3 per 1,000 population) and North Ryde (4.8) while for
further education, hobbies and clubs the highest rates were in North Ryde (6.1), Eastwood (5.2) and
Gladesville (4.8), (City of Ryde 2009).
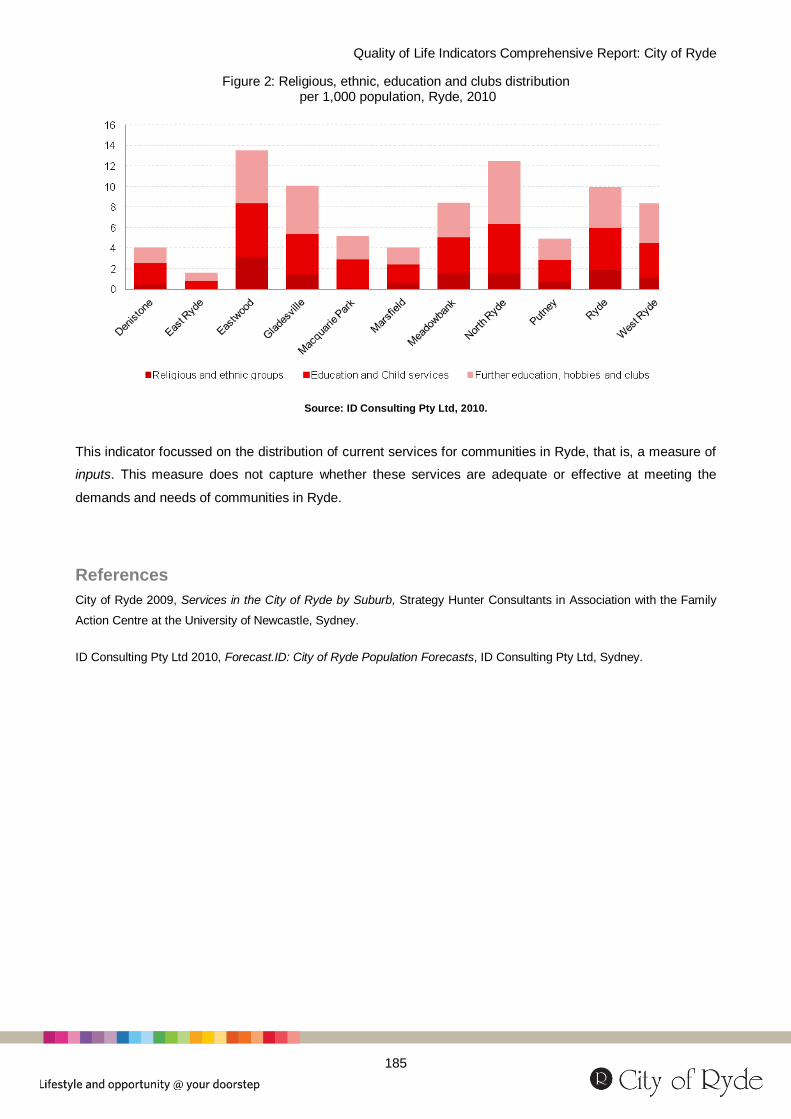
Quality of Life Indicators Comprehensive Report: City of Ryde
185
Figure 2: Religious, ethnic, education and clubs distribution per 1,000 population, Ryde, 2010
Source: ID Consulting Pty Ltd, 2010.
This indicator focussed on the distribution of current services for communities in Ryde, that is, a measure of
inputs. This measure does not capture whether these services are adequate or effective at meeting the
demands and needs of communities in Ryde.
References
City of Ryde 2009, Services in the City of Ryde by Suburb, Strategy Hunter Consultants in Association with the Family
Action Centre at the University of Newcastle, Sydney.
ID Consulting Pty Ltd 2010, Forecast.ID: City of Ryde Population Forecasts, ID Consulting Pty Ltd, Sydney.

Quality of Life Indicators Comprehensive Report: City of Ryde
186
Key indicator: Volunteering Related 2021 Goals
NSW 24 Make it easier for people to be involved in their communities
Volunteering Average
About this indicator
The services and community support
provided by volunteers provides one aspect
of progressive leadership. The extent of
community participation in volunteer work
can be an important indicator of social
capital. Volunteering also represents an
important method of contributing to and
participation in society. Volunteering has
been shown in various studies to have a
positive effect not only on the recipients of
services, but also on the health and
wellbeing of the volunteers themselves.
In Ryde, 16.8% of all adults engaged in voluntary work in 2006. This rate is higher than the rate for Sydney
SD (14.8%), and also the rate in Canada Bay (14.9%) and Parramatta (13.1%). Both Ku-ring-gai (27.1%)
and Hornsby Shire (22.6%) had higher levels of adults volunteering. Figure 1, below, shows that females
(9.6%) tend to volunteer more than males in Ryde (7.2%). This is reflected across all of Sydney SD (8.5% of
females across Sydney volunteer, while only 6.3% of males volunteer) and the comparator LGAs (ABS
2007).
Volunteering is less prevalent among younger people. In Ryde, 22.0% of volunteers were aged 35-44 years
and 19.8% were aged 45-54 years. However, only 15.0% of people aged 15-24 years and 14.6% of people
aged 25-34 years volunteered (ABS 2007).
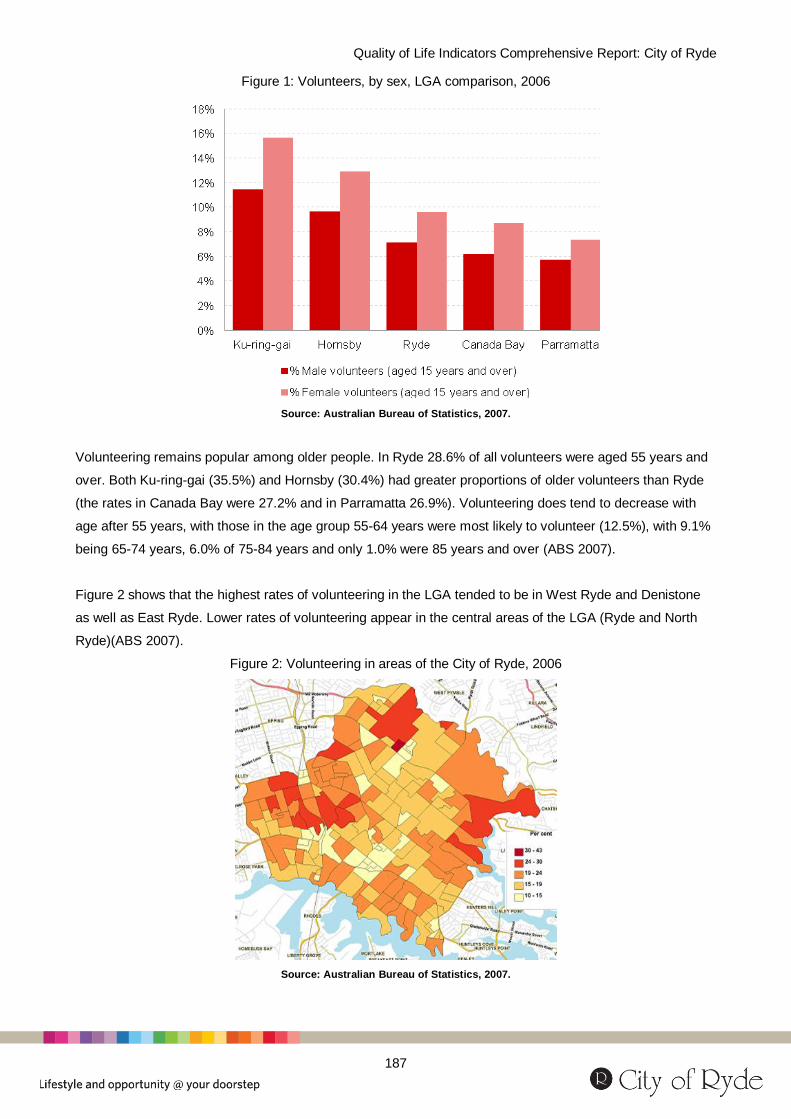
Quality of Life Indicators Comprehensive Report: City of Ryde
187
Figure 1: Volunteers, by sex, LGA comparison, 2006
Source: Australian Bureau of Statistics, 2007.
Volunteering remains popular among older people. In Ryde 28.6% of all volunteers were aged 55 years and
over. Both Ku-ring-gai (35.5%) and Hornsby (30.4%) had greater proportions of older volunteers than Ryde
(the rates in Canada Bay were 27.2% and in Parramatta 26.9%). Volunteering does tend to decrease with
age after 55 years, with those in the age group 55-64 years were most likely to volunteer (12.5%), with 9.1%
being 65-74 years, 6.0% of 75-84 years and only 1.0% were 85 years and over (ABS 2007).
Figure 2 shows that the highest rates of volunteering in the LGA tended to be in West Ryde and Denistone
as well as East Ryde. Lower rates of volunteering appear in the central areas of the LGA (Ryde and North
Ryde)(ABS 2007).
Figure 2: Volunteering in areas of the City of Ryde, 2006
Source: Australian Bureau of Statistics, 2007.

Quality of Life Indicators Comprehensive Report: City of Ryde
188
Figure 3, below, illustrates the association between employment and volunteering in the City of Ryde, across
age groups. In some age groups, volunteers were most likely to be employed full-time, including the age
groups of 25-34 years (73.4%), 35-44 years (63.7%), and 45-54 years (66.9%). In comparison, in the
youngest age group (15-24 years) it was most common for volunteers to be employed part time (53.7%), and
a relatively high proportion in this age groups are unemployed (12.5%), (ABS 2007).
Figure 3: Labour force status of volunteers, by age, Ryde, 2006
Source: Australian Bureau of Statistics, 2007.
References
Australian Bureau of Statistics 2007, 2006 Census Tables, Cat. No. 2068.0, Australian Bureau of Statistics, Canberra.

Quality of Life Indicators Comprehensive Report: City of Ryde
189
Discussion This chapter discusses the indicators of progressive leadership in Ryde by considering the ability to
participate in and influence political decision making; leadership capital, community services; and social
participation through volunteering.
There are challenges in measuring progressive leadership, most significantly the limited data availability.
Measures of civic and social participation and involvement are available only for NSW, which may not
accurately reflect the situation in Ryde. Furthermore, in order to examine the provision of community
services, we must rely on measures of inputs, for example, the number of services available, which does not
measure if these services meet demands. Similarly, there is limited data to identify whether there are any
‘gaps’ in service provision as well as data that measures advocacy by community groups in Ryde.
How else can we develop our understanding of progressive leadership in Ryde? How can we
better measure how adequately community services meet needs and demand, and accurately
evaluate social and civic participation?
The data in this chapter also highlights that there is capacity for expanding social and civic participation
among members of the Ryde community. Available data shows that many adults do not feel able to have a
say in the community on important issues, especially younger and older people. There is room for further
improvement for Ryde in terms of community engagement and advocacy.
What are the best ways to further encourage civic participation and ensuring that people feel
engaged and able to have a say on important issues?
Volunteering is a further form of social participation and interaction that benefits both the care receiver and
care giver and makes an important contribution to communities. Older people represent an important source
of social and leadership capital for a community, and tend to volunteer at greater levels than younger people.
How does the community benefit from volunteering? Does an ageing population represent an
opportunity for increased levels of social participation and the transmission of social and
leadership skills to a new generation?
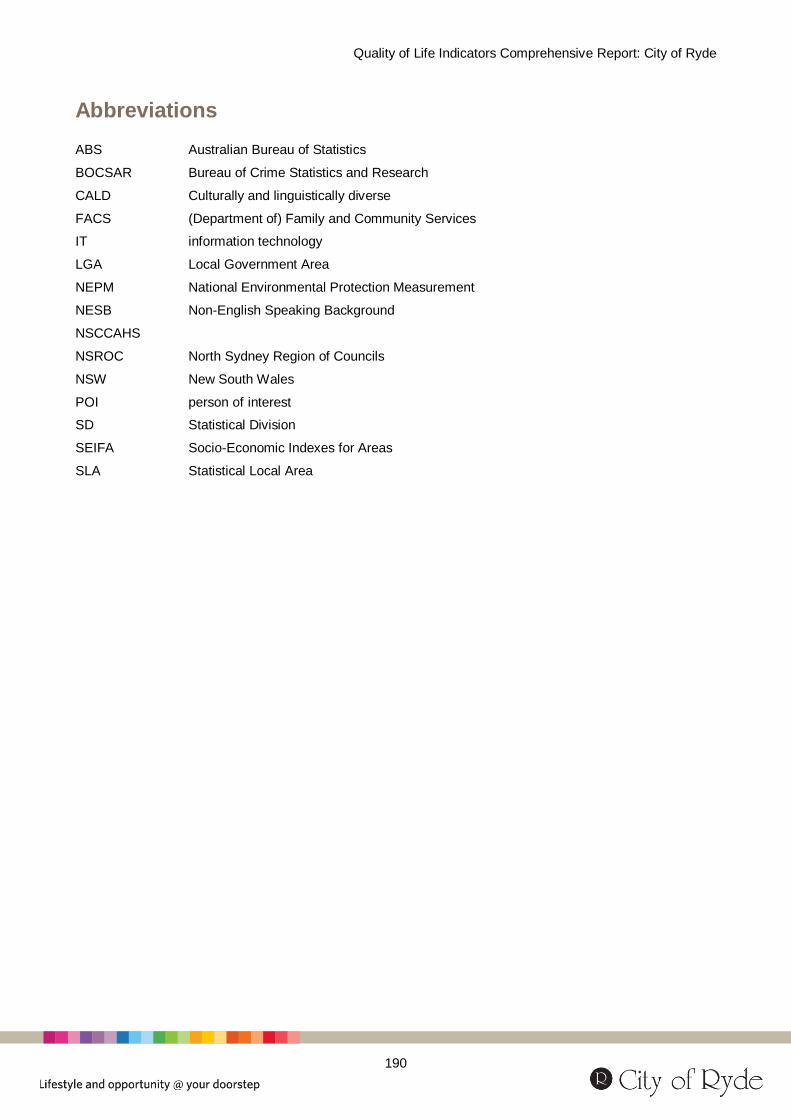
Quality of Life Indicators Comprehensive Report: City of Ryde
190
Abbreviations ABS Australian Bureau of Statistics
BOCSAR Bureau of Crime Statistics and Research
CALD Culturally and linguistically diverse
FACS (Department of) Family and Community Services
IT information technology
LGA Local Government Area
NEPM National Environmental Protection Measurement
NESB Non-English Speaking Background
NSCCAHS
NSROC North Sydney Region of Councils
NSW New South Wales
POI person of interest
SD Statistical Division
SEIFA Socio-Economic Indexes for Areas
SLA Statistical Local Area

Quality of Life Indicators Comprehensive Report: City of Ryde
191
Glossary
alcohol-related (crime) Incident or accident where consumption of alcohol is believed to have played a role. In crime, this is determined where an incident has been flagged by police as alcohol-related.
apparent full-time retention rate The number of students in a designated year/level of secondary education, expressed as a percentage of the number in the year/level below the previous year.
assault Offence classification comprising incidents involving intentional physical harm or threat of immediate intentional physical harm. Assault can be either domestic violence-related or non-domestic violence-related.
average annual income The average wage or salary income in a particular financial year, as reported on an individual’s income tax return.
avoidable death Death from a condition where mortality is generally avoidable either through prevention, treatment or a combination of these, given the health and other systems currently available.
body mass index (BMI) Mass (kg) of a person divided by the square of their height (m).
break and enter Offence classification involving unauthorised forcible entry into a property involving deliberate removal of obstacles e.g. a door or lock.
Broadband connection An 'always on' Internet connection, including ADSL, cable, wireless and satellite internet, where the access (download) speed is equal to or greater than 256 Kilobits per second.
casualty Person injured or killed in an accident.
Central Western Sydney DEEWR geographical boundary comprising the LGAs of Auburb, Bankstown, Fairfield, Holroyd and Parramatta.
child protection report Report made by telephone to the Child Protection Helpline where it is believed a child is at risk of significant harm.
communication skills and general knowledge
One of five AEDI domains, looking a child's ability to communicate with both adults and children, narrate a story and sufficiently articulate themselves.
community housing Low-cost housing provided by a community agency or community housing organisation for low income individuals and families, often to encourage residents employed in key services to live in the area.
core activity limitation Used to determine level of disability. Involves limitations in performing any or all core activities (communication, mobility and self-care). There are four levels of core activity limitation: mild, moderate, severe and profound.

Quality of Life Indicators Comprehensive Report: City of Ryde
192
couple family Family comprising two people of any gender who are married or in a de facto relationship, share a social, economic and emotional bond and reside in the same dwelling. They may or may not have children and/or other related individuals residing with them.
dependency ratio The ratio of those not of working age (under 15 years and over 64 years) to those of working age (15 to 64 years).
dependent A child either aged less than 15 years or between the ages of 15 and 24 years who is a full-time student residing with his/her parent/s or guardian/s.
developmentally vulnerable As measured in the AEDI, a child who shows vulnerability in one or more of the developmental domains, which are: physical health and wellbeing; social competence; emotional maturity; language and cognitive skills; and communication skills and general knowledge.
dial-up connection An Internet connection that utilises the telephone network to establish and maintain a dialled connection to the Internet. Usually slower than a broadband connection.
disability A physical or intellectual impairment lasting (or likely to last) at least six months, that limits an individual’s everyday activities.
dwelling A self-contained suite of rooms, including food preparation and bathing facilities, intended for long-term residential use.
emotional maturity One of five AEDI domains, looking a child's ability to concentrate, help others, display patience and not become aggressive or angry.
employed person An individual aged 15 years or over working for a wage, salary or profit, including those on leave or otherwise temporarily absent, or providing unpaid labour in a family business.
endangered (species) One classification under threatened species. An endangered species is at risk of extinction either because it is few in number or because of its changing environment.
family household Consisting of two or more persons, where at least one person is aged 15 years or above, who are related (by blood, registered or de facto marriage, step, adoption or fostering) and residing in the same household.
fertility rate The average number of children born per woman, if she were to live to the end of her childbearing years and bear children according to current age-specific fertility rates at each age during her reproductive life.
fraud Offence classification involving deceit or dishonest conduct for the purpose of gaining a benefit, obtaining money or to evade a legal responsibility.
full-time employment Where an individual works a total 35 hours per week or more, either in a single job or in multiple jobs.

Quality of Life Indicators Comprehensive Report: City of Ryde
193
Greater Western Sydney Division of the Sydney area comprising the LGAs of Auburn, Bankstown, Blacktown, Blue Mountains, Camden, Campbelltown, Fairfield, Hawkesbury, the Hills Shire, Holroyd, Liverpool, Parramatta, Penrith and Wollondilly.
high income household A household with a gross weekly income of $2,000 or more.
homelessness Where an individual is not considered to have a home. Includes primary homelessness (“sleeping rough” in a public space or derelict building), secondary homelessness (temporarily staying with friends or in crisis accommodation) and tertiary homelessness (where a person stays in a boarding house or similar insecure tenure for the medium- to long-term).
hospital separation The end of an episode of hospital care, through either discharge, transfer to another service, sign-out against medical advice or death.
household Involves one or more persons who usually reside in the same dwelling, where at least one individual is aged 15 years or over, and who make common provision for daily necessities such as food.
household income The total income of a household, calculated as the sum of the incomes of each household member.
housing cost Rent or mortgage repayments for a private dwelling, or site fees for a caravan or manufactured (mobile) home, but excluding rates, maintenance and other fees.
housing stress Defined as when the cost of housing is greater than 30% of the total household income before tax.
indecent assault and acts of indecency
Offence classification involving acts committed that are sexual in nature and against socially acceptable behaviour. Indecent assault is where an act of indecency is committed as part of an assault.
Index of Economic Resources An index that uses fifteen variables, such as income and assets, to reflect the economic resources of households in a geographical area, used to measure financial disadvantage.
Index of education and occupation An index that uses nine variables, such as rates of higher education, to reflect the general level of education and occupational skill in a community.
Index of relative socio-economic advantage and disadvantage
An index to measure relative disadvantage and advantage, using a range of variables on the economic and social resources of individuals and households in a geographical area.
Index of relative socio-economic disadvantage
An index to measure relative disadvantage, using a range of variables on the economic and social resources of individuals and households in a geographical area.
Indigenous (Australian) A person who identifies as being of Aboriginal or Torres Strait

Quality of Life Indicators Comprehensive Report: City of Ryde
194
Islander descent.
infant mortality rate The number of infant (under 12 months of age) deaths per 1,000 live births.
internal migration Migration within Australia, measured when a Census respondent reports having changed address within in the last year or in the last five years.
labour force Comprises those employed, either fully or partially, and those who are unemployed and seeking work.
labour force participation rate Percentage of the population aged 15 years and over that is either employed or unemployed and seeking employment.
language and cognitive skills One of five AEDI domains, looking a child's interest in reading and writing, and ability to count and to recognise numbers and shapes.
life expectancy at birth The average number of years a newborn can be expected to live, if the current death rate continued throughout their lifetime.
Local Government Area geographical area determined by council boundaries.
lone person household A household comprising only an individual who makes separate provision for his or her own necessities for living (including food), without combining with any other person as part of a group household. The individual may live on their own or with others in a shared dwelling.
long term unemployment rate The percentage of the labour force in long-term unemployment. Long-term unemployment is defined as that lasting 12 months or more.
low birthweight baby Baby born weighing less than 2,500 grams.
low income household A household with a gross weekly income of less than $250.
low income individual Person with a gross weekly income of less than $250.
major offence Classification of offences considered the most serious, including those in the categories of murder, sexual assault, indecent assault, act of indecency, assault, robbery, break and enter, motor vehicle theft, steal from motor vehicle, steal from retail store, steal from dwelling, steal from person, fraud and malicious damage to property.
Metro West Department of Family and Community Services geographical boundary that incorporates the LGAs of Auburn, Blacktown, Blue Mountains, Hawkesbury, Hills Shire, Holroyd, Parramatta and Penrith.
moderate individual income A pre-tax income of $250 to $1599 per week.
mortgage stress Defined as when the mortgage repayment for a household is greater than 30% of the total household income before tax.
Quality of Life Indicators Comprehensive Report: City of Ryde
195
National Minimum Standard A NAPLAN band that defines the minimum standard for students in each NAPLAN area. To be considered as performing at the national minimum standard, students must be able to display the necessary skills for their Year as determined by NAPLAN.
non-degree qualification Type of post-school qualification that is not a degree, including postgraduate certificates and diplomas.
obese Defined as a body mass index (BMI) of 30 or more.
out of home care Where a person under the age of 18 years is living in a temporary or permanent placement outside the home of their parent/s or guardian/s either after being assessed as being at risk of harm or where the parent/s or guardian/s are unable to provide the necessary care at that time.
overweight Defined as a body mass index (BMI) of 25 to 29.
part-time employment Where an individual works a total of less than 35 hours per week, either in a single job or in multiple jobs.
perinatal mortality rate The number of foetal and neonatal (newborn in the first week of life) deaths per 1,000 live births.
person of interest An individual recorded by police as being a suspected offender in relation to a criminal incident. An individual can be a person of interest for more than one incident, and a single incident can have multiple persons of interest.
photochemical smog Ground-level ozone and airborn particles triggered by a UV-catalysed reaction between nitrogen oxide and volatile organic chemicals in the atmosphere. Photochemical smog is considered harmful to human health, in particular respiratory health.
physical health and wellbeing One of the five AEDI domains, looking at a child's gross and fine motor skills, and ability to see to their own needs independently.
physically inactive Did not exercise through sport or recreation (including walking) in the fortnight prior to the survey or interview.
post-school qualification Recognised qualification gained after leaving school. Includes university degrees, non-degree qualifications, TAFE qualifications (Certificates I-IV), trade qualifications, adult reeducation courses of the length of one semester or greater.
potentially avoidable death A death that could have been avoided through limitation of causal factors (such as poor diet or smoking), early detection and other preventative measures, and use of currently available health care.
poverty (relative) Exists where an individual or household's income is less than 60% of the median income.
prescribed alcohol limit The legal limit of alcohol concentration in the blood for operating a

Quality of Life Indicators Comprehensive Report: City of Ryde
196
motor vehicle. The limit depends on licence and vehicle type and is measured in grams of alcohol per 100 mL of blood.
preterm birthrate The number of babies born before 37 weeks gestation per 1,000 live births.
primary carer Individual providing the majority of care to a person with a disability.
private dwelling Separate living quarters with a private entrance. Includes houses, flats, caravans, houseboats, living quarters connected to an office or retail space, and tents. Excludes hostels, hotels, hospitals, prisons, non-self-contained aged care accommodation, child care institutions and boarding houses.
profound or severe disability A disability where an individual requires regular assistance or supervision to communicate, move and/or care for themselves for 6 months or more.
pubilc housing Subsidised, low-cost housing provided by a government for low income individuals and families who cannot afford to rent privately.
public transport A type of transport that includes travel by public means such as bus, train, ferry and light rail (but not taxi).
recommended daily intake of fruit The equivalent of two or more serves of fruit (excluding beverages) per day. One serve is approximately 150g fresh fruit or 50g dried fruit.
recommended daily intake of vegetables
For a person aged 16 years and over, the equivalent of five serves of vegetables per day. One serve is equal to ½ cup cooked vegetables or 1 cup salad vegetables.
rent assistance Financial assistance provided by Centrelink to help households meet rental payments.
rental stress Defined as when the rent for a household is greater than 30% of the total household income before tax.
retail theft See steal from retail store
robbery Offence classification comprising incidents involving the unlawful removal of property with violence or threat of violence. Divided into three classifications: with a firearm, with a weapon not a firearm and without a weapon.
single-parent family A family unit consisting of a single parent with at least one child (dependent or non-dependent) residing in the same household.
social capital The benefits created through social networking and the building and maintaining of relationships, both with those in an individual's immediate social group (family, colleagues, peers) and those outside the immediate social group (neighbours, other members of the community).
Quality of Life Indicators Comprehensive Report: City of Ryde
197
social competence One of the five AEDI domains, looking at a child's ability to play, get along with others, act in a socially acceptable manner and display self-confidence.
social disadvantage Barriers that prevent a person from receiving life opportunities and from participating fully in society.
social exclusion Where an individual is not able, to a reasonable degree, to participate in the social, economic, political and cultural systems in which they desire to take part, due to external factors.
social housing Public or community housing
social inclusion Where an individual is readily able to participate in the social, economic, political and cultural systems in which they desire to take part.
Statistical Division (SD) The largest Australian Standard Geographical Classification unit, consisting of one or more SDDs.
Statistical Local Area (SLA) The smallest Australian Standard Geographical Classification unit, except in Census years where the Census Collection District (CD) is the smallest unit, and one or more of these make up an SLA.
Statistical Sub-Division (SDD) An intermediate Australian Standard Geographical Classification unit, consisting of one or more SLAs.
steal from retail store Offence classification involving the unlawful removal of property from a retail premises, without use or threat of violence.
Sydney West NSW Health geographical boundary that incorporates the LGAs of Auburn, Blacktown, Blue Mountains, Greater Lithgow, Hawkesbury, Hills Shire, Holroyd, Parramatta and Penrith.
threatened (species) Used to describe a species of flora or fauna that is vulnerable to extinction, endangered, critically endangered, extinct in the wild or extinct.
total fertility rate The average number of children born per woman, if she were to live to the end of her childbearing years and bear children according to current age-specific fertility rates at each age during her reproductive life.
underemployment Where an individual is employed but is able to and desires to work more hours than he or she is currently working.
unemployed Where an individual is not currently in employment or self-employed, but is capable of work and is seeking employment. This does not include those outside the working age, students in full-time study, single parents with dependents, primary carers of dependents (including people with a disability requiring a carer) or those who are unable to work due to a health problem, mental illness or disability. People who are unemployed are included in the labour force.
Quality of Life Indicators Comprehensive Report: City of Ryde
198
unemployment benefit Generally refers to the NewStart Allowance, a fortnightly payment made by Centrelink to an eligible unemployed person to provide them with financial support while they seek employment. The rate is based on the person's household structure, assets, other income and other circumstances. A person receiving a NewStart Allowance may also be eligible for other benefits such as rent assistance and a healthcare card.
unpaid voluntary work Time, service or skills willingly given (without payment) to an organisation, association or club by a person aged 15 years and over.
vocational qualification Trade qualification, offered by TAFE or a similar training body.