quality of similarity rankings in time series - sstd …sstd2011.cs.umn.edu/files/slides/berc.pdfsnn...
TRANSCRIPT
Quality ofSimilarityRankings
in Time Series
T. Bernecker,M. E. Houle,H.-P. Kriegel,
P. Kröger,M. Renz,
E. Schubert,A. Zimek
Motivation
InterpretingDistance Fct.Distance Functions
Curse of Dimens.
SNN Distance
ExperimentsSNN performance
Histograms
Effects of noise
Conclusions
Quality of Similarity Rankingsin Time Series
12th International Symposium on Spatial and TemporalDatabases (SSTD 2011)
Thomas Bernecker1, Michael E. Houle2,Hans-Peter Kriegel1, Peer Kröger1, Matthias Renz1,
Erich Schubert1, Arthur Zimek1
1 Ludwig-Maximilians-Universität München, Munich, Germany2 National Institute of Informatics, Tokyo, Japan
2011-08-26 — Minneapolis, MN1/18

Quality ofSimilarityRankings
in Time Series
T. Bernecker,M. E. Houle,H.-P. Kriegel,
P. Kröger,M. Renz,
E. Schubert,A. Zimek
Motivation
InterpretingDistance Fct.Distance Functions
Curse of Dimens.
SNN Distance
ExperimentsSNN performance
Histograms
Effects of noise
Conclusions
Time Series Distances
Time series research
. . . has plenty of:I New distance functionsI Dimensionality reductionI Approximations
. . . but:I How big is a distance of 0.432?I How big is a difference of 0.123?
What is the meaning of these values?
2/18
Quality ofSimilarityRankings
in Time Series
T. Bernecker,M. E. Houle,H.-P. Kriegel,
P. Kröger,M. Renz,
E. Schubert,A. Zimek
Motivation
InterpretingDistance Fct.Distance Functions
Curse of Dimens.
SNN Distance
ExperimentsSNN performance
Histograms
Effects of noise
Conclusions
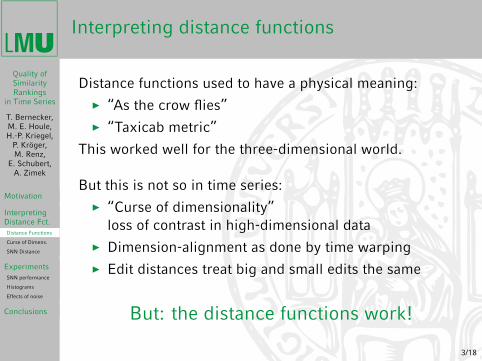
Interpreting distance functions
Distance functions used to have a physical meaning:I “As the crow flies”I “Taxicab metric”
This worked well for the three-dimensional world.
But this is not so in time series:I “Curse of dimensionality”
loss of contrast in high-dimensional dataI Dimension-alignment as done by time warpingI Edit distances treat big and small edits the same
But: the distance functions work!
3/18
Quality ofSimilarityRankings
in Time Series
T. Bernecker,M. E. Houle,H.-P. Kriegel,
P. Kröger,M. Renz,
E. Schubert,A. Zimek
Motivation
InterpretingDistance Fct.Distance Functions
Curse of Dimens.
SNN Distance
ExperimentsSNN performance
Histograms
Effects of noise
Conclusions
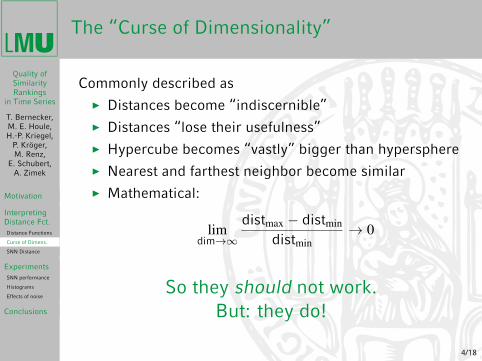
The “Curse of Dimensionality”
Commonly described asI Distances become “indiscernible”I Distances “lose their usefulness”I Hypercube becomes “vastly” bigger than hypersphereI Nearest and farthest neighbor become similarI Mathematical:
limdim→∞
distmax − distmin
distmin→ 0
So they should not work.But: they do!
4/18
Quality ofSimilarityRankings
in Time Series
T. Bernecker,M. E. Houle,H.-P. Kriegel,
P. Kröger,M. Renz,
E. Schubert,A. Zimek
Motivation
InterpretingDistance Fct.Distance Functions
Curse of Dimens.
SNN Distance
ExperimentsSNN performance
Histograms
Effects of noise
Conclusions
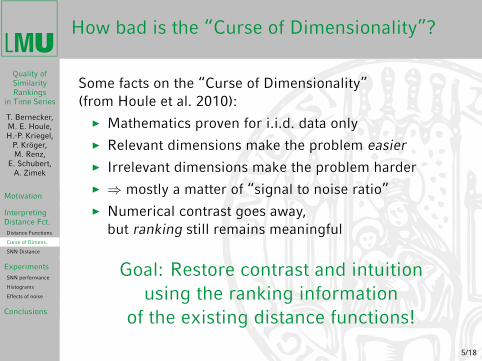
How bad is the “Curse of Dimensionality”?
Some facts on the “Curse of Dimensionality”(from Houle et al. 2010):
I Mathematics proven for i.i.d. data onlyI Relevant dimensions make the problem easierI Irrelevant dimensions make the problem harderI ⇒ mostly a matter of “signal to noise ratio”I Numerical contrast goes away,
but ranking still remains meaningful
Goal: Restore contrast and intuitionusing the ranking information
of the existing distance functions!
5/18

Quality ofSimilarityRankings
in Time Series
T. Bernecker,M. E. Houle,H.-P. Kriegel,
P. Kröger,M. Renz,
E. Schubert,A. Zimek
Motivation
InterpretingDistance Fct.Distance Functions
Curse of Dimens.
SNN Distance
ExperimentsSNN performance
Histograms
Effects of noise
Conclusions
Shared Nearest Neighbor Similarity
Idea: Similar objects have similar neighbors.
SNNs(x, y) = |NNs(x) ∩ NNs(y)|
simcoss(x, y) =SNNs(x, y)
s
Properties:I Intuitive value range from “None” to “All”I Intuitive interpretation (“social”)I Good contrast, good performanceI Needs an “okay” existing rankingI Extra parameter s to chooseI More expensive to use (second order distance)
6/18
Quality ofSimilarityRankings
in Time Series
T. Bernecker,M. E. Houle,H.-P. Kriegel,
P. Kröger,M. Renz,
E. Schubert,A. Zimek
Motivation
InterpretingDistance Fct.Distance Functions
Curse of Dimens.
SNN Distance
ExperimentsSNN performance
Histograms
Effects of noise
Conclusions
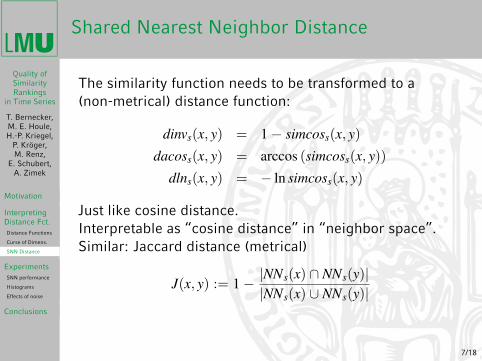
Shared Nearest Neighbor Distance
The similarity function needs to be transformed to a(non-metrical) distance function:
dinvs(x, y) = 1− simcoss(x, y)
dacoss(x, y) = arccos (simcoss(x, y))
dlns(x, y) = − ln simcoss(x, y)
Just like cosine distance.Interpretable as “cosine distance” in “neighbor space”.Similar: Jaccard distance (metrical)
J(x, y) := 1− |NNs(x) ∩ NNs(y)||NNs(x) ∪ NNs(y)|
7/18
Quality ofSimilarityRankings
in Time Series
T. Bernecker,M. E. Houle,H.-P. Kriegel,
P. Kröger,M. Renz,
E. Schubert,A. Zimek
Motivation
InterpretingDistance Fct.Distance Functions
Curse of Dimens.
SNN Distance
ExperimentsSNN performance
Histograms
Effects of noise
Conclusions
Experiments
Experimental results
8/18
Quality ofSimilarityRankings
in Time Series
T. Bernecker,M. E. Houle,H.-P. Kriegel,
P. Kröger,M. Renz,
E. Schubert,A. Zimek
Motivation
InterpretingDistance Fct.Distance Functions
Curse of Dimens.
SNN Distance
ExperimentsSNN performance
Histograms
Effects of noise
Conclusions
Data sets used
Four very different data sets:I Cylinder-Bell-Funnel (CBF): artificialI Synthetic control: artificialI Leaf dataset: outlines of tree leafsI Lightning-7: lightning strike emissions
Each modified in different ways:I Original data setI Extended with noise (irrelevant attributes)I Extended with “signal” (relevant attributes)
9/18

Quality ofSimilarityRankings
in Time Series
T. Bernecker,M. E. Houle,H.-P. Kriegel,
P. Kröger,M. Renz,
E. Schubert,A. Zimek
Motivation
InterpretingDistance Fct.Distance Functions
Curse of Dimens.
SNN Distance
ExperimentsSNN performance
Histograms
Effects of noise
Conclusions
Unmodified data sets
Results on unmodified data sets
Benefits of using SNNExemplary on the Cylinder-Bell-Funnel
(artificial) data set
10/18

Quality ofSimilarityRankings
in Time Series
T. Bernecker,M. E. Houle,H.-P. Kriegel,
P. Kröger,M. Renz,
E. Schubert,A. Zimek
Motivation
InterpretingDistance Fct.Distance Functions
Curse of Dimens.
SNN Distance
ExperimentsSNN performance
Histograms
Effects of noise
Conclusions
Contrast gain using SNN
Visual improvement (unmodified CBF data set):
Euclidean DTW 20% LCSS 20%
DTW s = 70 DTW s = 100 LCSS s = 100
11/18
Quality ofSimilarityRankings
in Time Series
T. Bernecker,M. E. Houle,H.-P. Kriegel,
P. Kröger,M. Renz,
E. Schubert,A. Zimek
Motivation
InterpretingDistance Fct.Distance Functions
Curse of Dimens.
SNN Distance
ExperimentsSNN performance
Histograms
Effects of noise
Conclusions
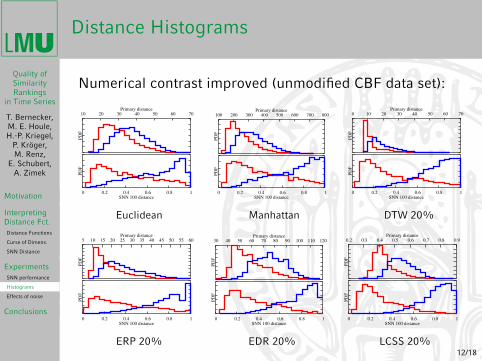
Distance Histograms
Numerical contrast improved (unmodified CBF data set):
10 20 30 40 50 60 70
PD
F
Primary distance
0 0.2 0.4 0.6 0.8 1
PD
F
SNN 100 distance
Euclidean
100 200 300 400 500 600 700 800
PD
F
Primary distance
0 0.2 0.4 0.6 0.8 1
PD
F
SNN 100 distance
Manhattan
0 10 20 30 40 50 60 70
PD
F
Primary distance
0 0.2 0.4 0.6 0.8 1
PD
F
SNN 100 distance
DTW 20%
5 10 15 20 25 30 35 40 45 50 55 60
PD
F
Primary distance
0 0.2 0.4 0.6 0.8 1
PD
F
SNN 100 distance
ERP 20%
30 40 50 60 70 80 90 100 110 120
PD
F
Primary distance
0 0.2 0.4 0.6 0.8 1
PD
F
SNN 100 distance
EDR 20%
0.2 0.3 0.4 0.5 0.6 0.7 0.8 0.9
PD
F
Primary distance
0 0.2 0.4 0.6 0.8 1
PD
F
SNN 100 distance
LCSS 20%12/18

Quality ofSimilarityRankings
in Time Series
T. Bernecker,M. E. Houle,H.-P. Kriegel,
P. Kröger,M. Renz,
E. Schubert,A. Zimek
Motivation
InterpretingDistance Fct.Distance Functions
Curse of Dimens.
SNN Distance
ExperimentsSNN performance
Histograms
Effects of noise
Conclusions
Effect of neighborhood size s:
Effect of variation of SNN size parameter s (CBF):
0.6
0.65
0.7
0.75
0.8
0.85
0.9
0.95
1
0 50 100 150 200
Mean
RO
C A
UC
SNN size
Euclidean
0.6
0.65
0.7
0.75
0.8
0.85
0.9
0.95
1
0 50 100 150 200
Mean
RO
C A
UC
SNN size
Manhattan
0.6
0.65
0.7
0.75
0.8
0.85
0.9
0.95
1
0 50 100 150 200
Mean
RO
C A
UC
SNN size
DTW 20%
0.6
0.65
0.7
0.75
0.8
0.85
0.9
0.95
1
0 50 100 150 200
Mean R
OC
AU
C
SNN size
ERP 20%
0.6
0.65
0.7
0.75
0.8
0.85
0.9
0.95
1
0 50 100 150 200
Mean R
OC
AU
C
SNN size
EDR 20%
0.6
0.65
0.7
0.75
0.8
0.85
0.9
0.95
1
0 50 100 150 200
Mean R
OC
AU
C
SNN size
LCSS 20%
13/18
Quality ofSimilarityRankings
in Time Series
T. Bernecker,M. E. Houle,H.-P. Kriegel,
P. Kröger,M. Renz,
E. Schubert,A. Zimek
Motivation
InterpretingDistance Fct.Distance Functions
Curse of Dimens.
SNN Distance
ExperimentsSNN performance
Histograms
Effects of noise
Conclusions
Modified data sets
Results on modified data sets
Adding noise to the data set,Changing the signal to noise ratio
14/18

Quality ofSimilarityRankings
in Time Series
T. Bernecker,M. E. Houle,H.-P. Kriegel,
P. Kröger,M. Renz,
E. Schubert,A. Zimek
Motivation
InterpretingDistance Fct.Distance Functions
Curse of Dimens.
SNN Distance
ExperimentsSNN performance
Histograms
Effects of noise
Conclusions
Adding noise
Adding noise to the data (Leaf data set)
0.5
0.6
0.7
0.8
0.9
1
1 2 4 8 16
Mea
n R
OC
AU
C
Data set size multiplicator
EuclideanEuclidean SNN 60
Euclidean
0.5
0.6
0.7
0.8
0.9
1
1 2 4 8 16
Mea
n R
OC
AU
C
Data set size multiplicator
ManhattanManhattan SNN 60
Manhattan
0.5
0.6
0.7
0.8
0.9
1
1 2 4 8 16
Mea
n R
OC
AU
C
Data set size multiplicator
DTW 20%DTW 20% SNN 60
DTW 20%
0.5
0.6
0.7
0.8
0.9
1
1 2 4 8 16
Mea
n R
OC
AU
C
Data set size multiplicator
ERP 20%ERP 20% SNN 60
ERP 20%
0.5
0.6
0.7
0.8
0.9
1
1 2 4 8 16
Mea
n R
OC
AU
C
Data set size multiplicator
EDR 20%EDR 20% SNN 60
EDR 20%
0.5
0.6
0.7
0.8
0.9
1
1 2 4 8 16
Mea
n R
OC
AU
C
Data set size multiplicator
LCSS 20%LCSS 20% SNN 60
LCSS 20%
15/18
Quality ofSimilarityRankings
in Time Series
T. Bernecker,M. E. Houle,H.-P. Kriegel,
P. Kröger,M. Renz,
E. Schubert,A. Zimek
Motivation
InterpretingDistance Fct.Distance Functions
Curse of Dimens.
SNN Distance
ExperimentsSNN performance
Histograms
Effects of noise
Conclusions
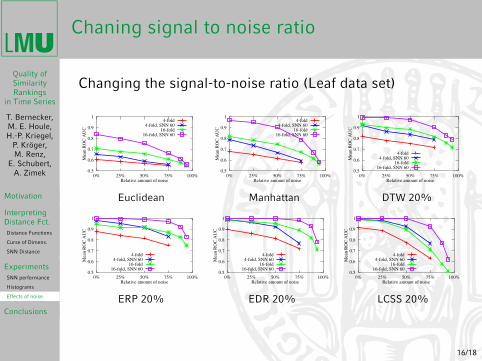
Chaning signal to noise ratio
Changing the signal-to-noise ratio (Leaf data set)
0.5
0.6
0.7
0.8
0.9
1
0% 25% 50% 75% 100%
Mean
RO
C A
UC
Relative amount of noise
4-fold4-fold, SNN 60
16-fold16-fold, SNN 60
Euclidean
0.5
0.6
0.7
0.8
0.9
1
0% 25% 50% 75% 100%
Mean
RO
C A
UC
Relative amount of noise
4-fold4-fold, SNN 60
16-fold16-fold, SNN 60
Manhattan
0.5
0.6
0.7
0.8
0.9
1
0% 25% 50% 75% 100%
Mean
RO
C A
UC
Relative amount of noise
4-fold4-fold, SNN 60
16-fold16-fold, SNN 60
DTW 20%
0.5
0.6
0.7
0.8
0.9
1
0% 25% 50% 75% 100%
Mean
RO
C A
UC
Relative amount of noise
4-fold4-fold, SNN 60
16-fold16-fold, SNN 60
ERP 20%
0.5
0.6
0.7
0.8
0.9
1
0% 25% 50% 75% 100%
Mean
RO
C A
UC
Relative amount of noise
4-fold4-fold, SNN 60
16-fold16-fold, SNN 60
EDR 20%
0.5
0.6
0.7
0.8
0.9
1
0% 25% 50% 75% 100%
Mean
RO
C A
UC
Relative amount of noise
4-fold4-fold, SNN 60
16-fold16-fold, SNN 60
LCSS 20%
16/18

Quality ofSimilarityRankings
in Time Series
T. Bernecker,M. E. Houle,H.-P. Kriegel,
P. Kröger,M. Renz,
E. Schubert,A. Zimek
Motivation
InterpretingDistance Fct.Distance Functions
Curse of Dimens.
SNN Distance
ExperimentsSNN performance
Histograms
Effects of noise
Conclusions
Conclusions
Conclusions
Second order “shared nearest neighbor” distances offer:I Improved performanceI Better numerical contrastI Parameter s is not difficult to chooseI Less sensitive to noiseI . . . but computationally more expensive
17/18

Quality ofSimilarityRankings
in Time Series
T. Bernecker,M. E. Houle,H.-P. Kriegel,
P. Kröger,M. Renz,
E. Schubert,A. Zimek
Motivation
InterpretingDistance Fct.Distance Functions
Curse of Dimens.
SNN Distance
ExperimentsSNN performance
Histograms
Effects of noise
Conclusions
Thank youfor your attention!
18/18