quality report for statistical surveys methodological ... · quality report for statistical surveys...
TRANSCRIPT
Zelenih beretki 71000 Sarajevo Telefon: (033) 22 06 26; telefaks: (033) 22 06 26; e‐mail: [email protected]; www.bhas.ba
QUALITY REPORT FOR STATISTICAL SURVEYS
Methodological Guidelines for Preparation
Sarajevo, 2012
Bosna i Hercegovina AGENCIJA ZA STATISTIKU BOSNE I HERCEGOVINE
Босна и Херцеговина АГЕНЦИЈА ЗА СTATИСTИKU БОСНE И ХЕРЦЕГОВИНE
Bosnia and Herzegovina AGENCY FOR STATISTICS OF BOSNIA AND HERZEGOVINA
Zelenih beretki 71000 Sarajevo Telephone: (033) 22 06 26; faks: (033) 22 06 26; e-mail: [email protected]; www.bhas.ba
2 QUALITY REPORT – Methodological Guidelines
Contents
Introduction ................. ..................................................................................................................................5
1 Introduction to the stastistical process and its outputs – survey methodology ...............................7
2 Relevance ..........................................................................................................................................9
2.1 For all types of statistical processes ........................................................................................... 9
2.2 For statistical processes which use administrative sources ....................................................... 9
2.3 Quality and Performance Indicators – Rate of available statistics (R1) ...................................... 9
3 Accuracy ......................................................................................................................................... 10
3.1 Sampling errors ......................................................................................................................... 10
3.1.1 Sampling error calculation procedure .............................................................................. 10
3.1.2 Sampling error – Quality and Performance Indicator – Coefficient of Variation (A1) ..... 10
3.1.3 Clarifications ..................................................................................................................... 10
3.1.4 Activity to reduce sampling errors ................................................................................... 10
3.2 Non‐sampling errors ................................................................................................................. 10
3.2.2 Measurement errors ........................................................................................................ 11
3.2.3 Nonresponse errors ......................................................................................................... 13
4 Timeliness and Punctualty ............................................................................................................. 16
4.1 Timeliness of release ................................................................................................................. 16
4.1.1 Quality and Performance Indicator – Timeliness of first results (T1) .............................. 16
4.2 Punctuality of publication ......................................................................................................... 17
5 Accessibility and Clarity .................................................................................................................. 17
5.1 Accessibilty ................................................................................................................................ 17
5.1.1 Dissemination channels and means ................................................................................. 17
5.1.2 Quality and Performance Indicator‐Rate of used dissemination channels and means (AC1) ..... 18
5.1.3 Quality and Performance Indicator – Number of accesses to on‐line databases (AC2) .. 19
5.2 Clarity ........................................................................................................................................ 19
5.2.1 Paper publications and web‐based publications ............................................................. 19
5.2.2 Quality and Performance Indicator – Rate of completeness of metadata (AC3) ............ 19
6 Comparability and Coherence ........................................................................................................ 20
6.1 Comparability over Time ........................................................................................................... 20
6.1.1 Quality and Performance Indicator – Lengths of comparable time series (CC1) ............. 20
6.1.2 Breaks in time series ........................................................................................................ 20
6.1.3 Other factors which affect comparability over time ........................................................ 20
6.2 Comparability over Region........................................................................................................ 20
6.2.1 Comparability with other members of the European Statistical System ......................... 20
6.3 Seasonal adjustment ................................................................................................................. 21
6.4 Coherence between preliminary and final data ............................................................................. 21
6.4.1 Preliminary data dissemination policy ................................................................................. 21
6.4.2 Quality Indicator–Coherence between preliminary and final results (CC2) .................... 21
Zelenih beretki 71000 Sarajevo Telephone: (033) 22 06 26; faks: (033) 22 06 26; e‐mail: [email protected]; www.bhas.ba
3 QUALITY REPORT – Methodological Guidelines
6.4.3 Reasons for major differences between preliminary and final data ............................... 21
6.5 Coherence with benchmark survey outputs ............................................................................. 21
6.5.1 Brief description of benchmark survey ............................................................................ 21
6.5.2 Quality and Performance Indicator ‐ Coherence with reference data (CC3) .................. 21
6.5.3 Reasons for major deviations ........................................................................................... 22
9 Costs and respondent/responding unit burden ............................................................................. 23
9.1 Survey costs of Statistical Office ...................................................................................... 23
9.2 Respondent/reporting unit burden and costs .......................................................................... 23
9.3 Measures to reduce cost and burden .......................................................................................... 23
10 Confidentiality, transparenvy and security ........................................................................................ 25
10.1 Confidentiality ............................................................................................................................. 25
10.2 Transparency ............................................................................................................................... 25
10.3 Security ........................................................................................................................................ 25
11 Conclusion .......................................................................................................................................... 25 ANNEXES:
Annex1: Brief description of quality components
Annex 2: Quality and Performance Components and Indicators
Annex 3: User Segmentation
Zelenih beretki 71000 Sarajevo Telephone: (033) 22 06 26; faks: (033) 22 06 26; e-mail: [email protected]; www.bhas.ba
4 QUALITY REPORT – Methodological Guidelines
Introduction
The concept of quality, which is becoming increasingly important over the past years in all segments of life, is being implemented also in the field of production of statistical data outputs. Various international organisations (e.g. Eurostat, IMF, OECD) play the leading role in developing the quality concept, clear methodological guidelines for development, and practical inclusion of these concepts. Also National Statistical Offices are carrying out numerous activities in this field. The European Statistical Office (Eurostat) has prepared, through its Working Group on Quality, various documents (ESS Handbook for Quality Reports and Handbook on Data Quality) in an attempt to identify and elaborate on diverse quality components relevant to statistical data outputs. The general aim of the ESS Standard for Quality Reports (ESQR) is to provide recommendations for preparation of comprehensive quality reports for a full range of statistical processes and their outputs. A key objective of the Standard for Quality Reports is to promote harmonised quality reporting across statistical processes and Member States and hence to facilitate comparisons across processes and outputs. Its focus is on national quality reports and their use in reporting to Eurostat.
The ESS Standard for Quality Reporting may refer to the following types of statistical processes:
1. Sample survey
A survey based on a usually probabilistic sampling procedure, involving direct collection of data from respondents.
2. Census
A survey where all frame units are covered.
3. Statistical processes using administrative source(s) A process making use of data collected for other purposes than direct production of statistics. An example is where statistical tabulations are produced from an administrative database maintained by the Central Election Commission.
4. Statistical processes involving multiple data sources
In many statistical segments the problem of measuring the process of producing statistics is such that a single approach to sampling is not possible or is not appropriate. For example, different units, questionnaire designs, sampling patterns and/or other survey procedures may be used for different survey segments in surveys in the field of business statistics, with aggregated basic economic data (production, finances, etc.) on business.
5. Price and other economic index processes
Involving complex sample surveys, often with non‐probabilistic design, and the target is complex and model‐based.
6. Statistical compilation
This statistical process includes primary sources, including the above‐mentioned ones, in order to obtain an aggregate with a specific conceptual meaning. Mainly, these are economic aggregates like the National Accounts and the Balance of Payments.

Zelenih beretki 71000 Sarajevo Telephone: (033) 22 06 26; faks: (033) 22 06 26; e‐mail: [email protected]; www.bhas.ba
5 QUALITY REPORT – Methodological Guidelines
The Quality Report, i.e. its structure, is organised along the lines of the quality principles contained in the ESS Code of Practice with the following sections:
(1) Introduction to the statistical process and its outputs‐results;
(2) Relevance;
(3) Accuracy;
(4) Timeliness and punctuality;
(5) Accessibility and clarity;
(6) Coherence and comparability;
(7) Trade‐offs between output quality components;
(8) User needs and perceptions;
(9) Costs and respondent/reporting unit burden;
(10) Confidentiality, transparency and security, and
(11) Conclusion
In our case, the conceptual basis for the preparation of quality reports consists of six quality components (relevance, accuracy, timeliness, accessibility, coherence and comparability) defined in the above‐mentioned methodological documents of Eurostat (other above‐mentioned components will be briefly addressed). An additional, seventh component is 'costs and respondent burden', which is not an explicit quality component, although it has a significant impact on all other components. It is necessary to describe in every report all other components, or the quality sub‐components for a specific survey.
The description of components and sub‐components should be divided into two parts.
Part One is a descriptive (narrative) part in which the author of the report gives the required information on a certain component. In preparing the list of required information, we relied on the ESS Standard for Quality Report by EUROSTAT.
Part Two contains the quality indicators which are defined as numerical values and their main objective is to enable comparability of the achieved level of quality for both different surveys and the same surveys conducted at different periods of time.
The Agency drew up a list of standard indicators on the basis of the Standard Quality Indicators of Eurostat. These indicators were developed by a special Working Group set up by Eurostat for the purpose of quality monitoring in the European Statistical System.
The quality report will be user‐friendly, which means that it will be intended primarily for users of survey outputs. For this reason, the reports will be publicised.
In this document we give an instruction for preparation of the Quality Report in a standard format. A brief definition is given one more time for each component and sub‐component, as well as a brief instruction. If a sub‐component is linked to calculation of an indicator, an instruction for calculation is also given.
Quality report is produced annually (annual reports), regardless of the periodicity of conducting statistical survey. Report prepared by statisticians responsible for some statistical survey in cooperation with the staff responsible for sample analysis and IT.
Zelenih beretki 71000 Sarajevo Telephone: (033) 22 06 26; faks: (033) 22 06 26; e-mail: [email protected]; www.bhas.ba
6 QUALITY REPORT – Methodological Guidelines
Indicators, by their definition, may refer to a survey as a whole, to some variables in the survey and to some statistics from the survey. In the first case, in presenting a specific survey in its entirety, there is only one object, which is why there are not many dilemmas over the value that the indicator refers to. This rule does not apply to the other two cases and we can measure multiple variables in a single survey and calculate (estimate) multiple statistics outputs.
This is why the indicators from the second and third groups are calculated only for the key variables and statistics, which have to be defined at the beginning of the report. The quality report should have a standard structure with the content precisely divided into sections. However, the final content and form of the report remains the responsibility of the authority carrying out the survey, which is also responsible for developing a report. The report structure has been prepared with the aim to cover as broad a range of various surveys as possible, while the author of the report is responsible for selecting the relevant parts of the report for a survey. If any section of the standard report is not relevant for a survey, it is necessary to mention it, while the whole section should not be skipped.
It is necessary to give a website address in the report, where appropriate, which will take the user to more detailed information on the presented topic. This is relevant primarily for the chapters on accessibility and clarity (on‐line releases) and also for all sections in which methodological aspects are presented.
Graphic presentation of data is recommended at different places of the instruction, although it is up to the author of the report to decide whether the graphs will be included in the report or not. The authors of quality reports should do their best to produce comprehensive and at the same time easy‐to‐consult, simple and understandable reports.
Zelenih beretki 71000 Sarajevo Telephone: (033) 22 06 26; faks: (033) 22 06 26; e‐mail: [email protected]; www.bhas.ba
7 QUALITY REPORT – Methodological Guidelines
1 Introduction to the statistical process and its outputs – survey methodology The Introduction section contains concise basic information on the survey methodology which provides the user the basic information primarily on why and how the survey is conducted.
Primarily the following information is provided: 1.1 The purpose of the survey
A brief description of the purpose of the statistical survey is provided.
1.2 Legal basis and responsibility of statistical institutions
States explicitly the existing legal basis (law, programs, plans, regulations, etc.) on the basis of which is undertaken employing a statistical study. Then, according to a strict liability statistical institutions in conducting the survey. 1.3 Observation unit
A description of the target population and a unit of that population, e.g. individuals in the sampled household; businesses with their main activities in the area of construction; retail prices of products and services of final consumption with the highest share in the total consumption of an average consumer and which reflect best the price trend for related products or services; public and private primary schools. 1.4 Data collection
The manner in which data are collected, e.g. via a field survey, from administrative sources; via price collectors (field survey questionnaires or telephone interviews); via a questionnaire for a survey designed by the Agency for Statistics.
1.5 Coverage
The following information is provided:
‐ which method (random sample, census, full coverage) has been used to determine an observation unit;
‐ number of observation units, in case of a sample, number of units within a sample, and the data on possible stratification.
1.6 Definitions
Definitions of the key variables. 1.7 Data processing The following is provided:
‐ the information on the procedures undertaken in case of non‐response (imputation, non‐response weighting, telephone re‐interview with the reporting unit)
‐ calculating weights (e.g. sampling weights, calibration, post‐stratification); ‐ information on procedures for automated data editing (visual checks, computer checks)
Zelenih beretki 71000 Sarajevo Telephone: (033) 22 06 26; faks: (033) 22 06 26; e-mail: [email protected]; www.bhas.ba
8 QUALITY REPORT – Methodological Guidelines
1.8 Release of outputs
The following is provided:
‐ the form in which the outputs will be released (e.g. absolute data, indexes, change rates, shares);
‐ whether the data have been seasonally adjusted; ‐ how the data are publicised (e.g. tables, graphs); ‐ when first and final results will be released.
1.9 Key variables
A list and brief description of key variables of surveys. 1.10 Key statistics
A list and brief description of the key statistics from the survey. 1.11 Questionnaire
Link to the web page on which the questionnaire is posted. All questionnaires should be available on http://www.stat.gov.ba/
1.12 Contact Information
The name of the organizational unit ‐ the sector/department is in charge of conducting statistical survey, and contact information for people who are preparing a report on the quality of survey.
Zelenih beretki 71000 Sarajevo Telephone: (033) 22 06 26; faks: (033) 22 06 26; e‐mail: [email protected]; www.bhas.ba
9 QUALITY REPORT – Methodological Guidelines
2 Relevance Definition of the component: Relevance is the degree to which statistical outputs meet current and potential user needs. It depends on whether all the statistics that are needed are produced and the extent to which concepts used (definitions, variables, classifications etc.) reflect user needs.
2.1 For all types of statistical processes
Any difference between the definitions used and internationally recommended definitions should be given for the key variables and statistics mentioned under 1.8 and 1.9. If certain indicators and variables foreseen by the ESS (European Statistical System) or other international regulations/ guidelines are not covered, the statistical outputs are incomplete.
2.2 For statistical processes which use administrative sources
If administrative data are used for statistical purposes, it should be noted that definitions of variables from these sources are in most instances not ideal for statistical purposes. This can lead to some limitations in defining the target population and target variables.
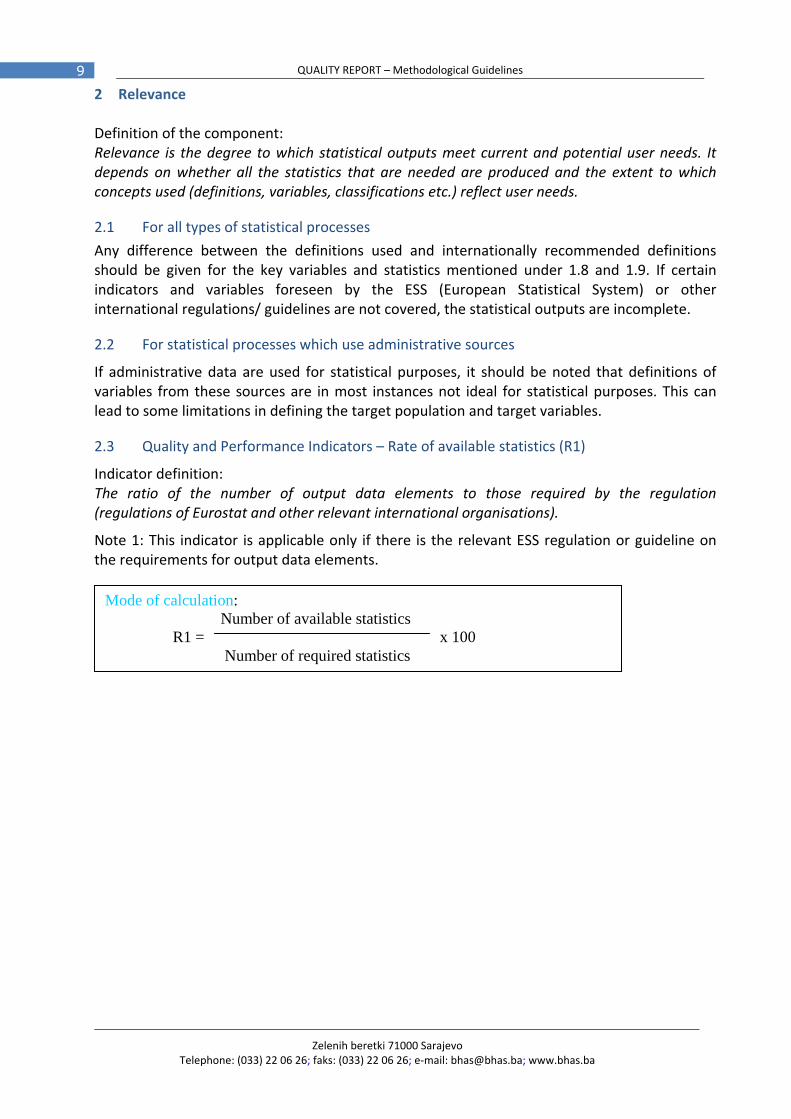
2.3 Quality and Performance Indicators – Rate of available statistics (R1)
Indicator definition: The ratio of the number of output data elements to those required by the regulation (regulations of Eurostat and other relevant international organisations).
Note 1: This indicator is applicable only if there is the relevant ESS regulation or guideline on the requirements for output data elements.
Mode of calculation: Number of available statistics R1 = x 100 Number of required statistics
Zelenih beretki 71000 Sarajevo Telephone: (033) 22 06 26; faks: (033) 22 06 26; e-mail: [email protected]; www.bhas.ba
10 QUALITY REPORT – Methodological Guidelines
3 Accuracy
Component definition: The accuracy of statistical outputs is the degree of closeness of estimates (obtained at the end of the statistical processing) to the true but unknown population values. 3.1 Sampling errors
3.1.1 Sampling error calculation procedure
The sampling errors occur when we do not observe the entire population but only a random sample. In this case, it in necessary to estimate sampling errors for the key statistics. Here, we describe the estimation procedure. It is necessary to mention the method and the software package used to calculate estimates. In case of a “non‐standard” procedure, the procedure (including the possible mathematical formulae) should also be described. 3.1.2 Sampling error – Quality and Performance Indicator – Coefficient of Variation (A1)
First, it is necessary to state briefly the output data and/or variables for which the sampling errors are presented. The sampling errors should be presented in a table. In case of a monthly survey, a monthly value is presented as an average annual value of the sampling error. In case of numerous estimated sampling errors, (too many different output data elements and levels of dissemination), only the errors for the main groups are given, while other results are presented in an annex. In interview/questionnaire surveys in which a household is an observation unit and outputs are often presented as a proportion or a percentage, it is not appropriate to report an error in a random sample in the form of a coefficient of variation, but as a confidence interval. For business surveys, especially where there are great positive numbers (for production, revenues, export, etc.); the best presentation of a sampling error is an estimated coefficient of variation. In case of monthly surveys, we recommend that the “trend” of sampling errors be reported also by way of graphs. 3.1.3 Explanation
A comment is given for a sampling error. It is necessary to mention, first of all, the causes of the sampling errors, above and beyond the pre‐defined, standardised limits of acceptable sampling errors.
If the confidence intervals are not reported, an instruction is given to explain how they can be calculated from the reported sampling errors.
3.1.4 Activity to reduce sampling errors
In case the estimated sampling errors per used criteria are too high, it is necessary to describe actions towards their reduction over time. 3.2 Non‐sampling errors 3.2.1 Coverage errors Coverage errors (or frame errors) are due to divergences between the target population and the frame population. Three types of coverage error are distinguished: (i) undercoverage, (ii) overcoverage and (iii) multiple listings.
Zelenih beretki 71000 Sarajevo Telephone: (033) 22 06 26; faks: (033) 22 06 26; e‐mail: [email protected]; www.bhas.ba
11 QUALITY REPORT – Methodological Guidelines
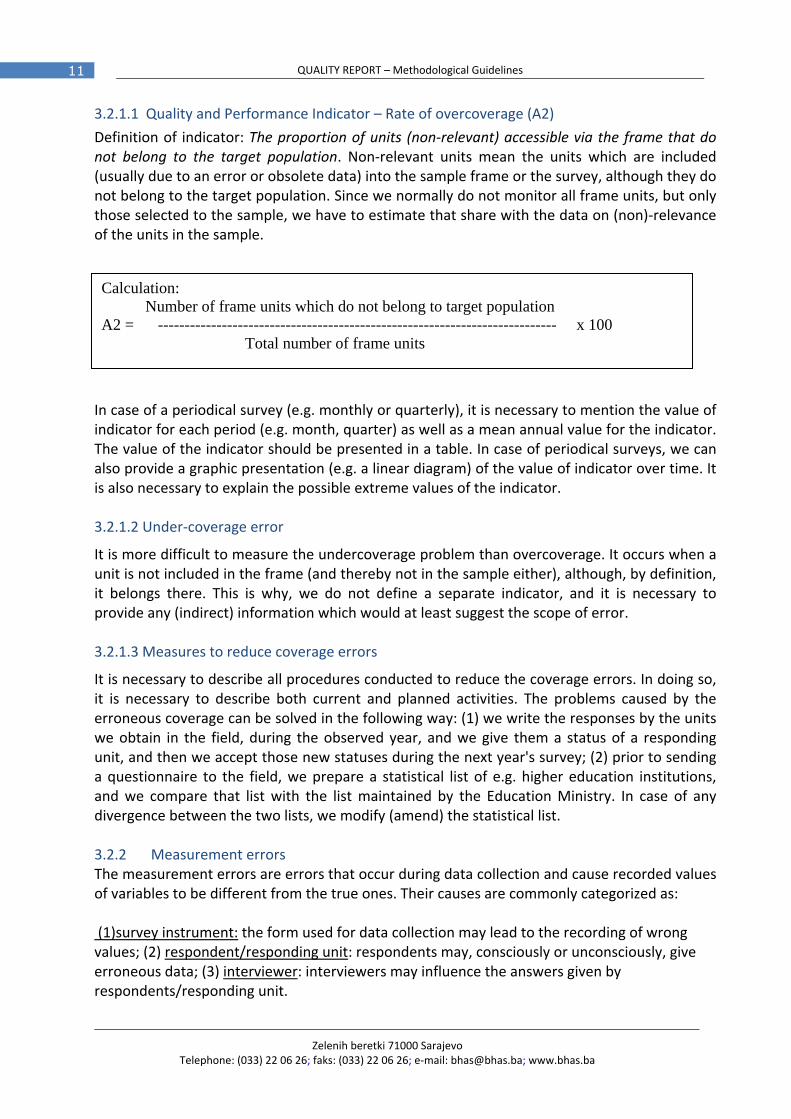
3.2.1.1 Quality and Performance Indicator – Rate of overcoverage (A2)
Definition of indicator: The proportion of units (non‐relevant) accessible via the frame that do not belong to the target population. Non‐relevant units mean the units which are included (usually due to an error or obsolete data) into the sample frame or the survey, although they do not belong to the target population. Since we normally do not monitor all frame units, but only those selected to the sample, we have to estimate that share with the data on (non)‐relevance of the units in the sample. In case of a periodical survey (e.g. monthly or quarterly), it is necessary to mention the value of indicator for each period (e.g. month, quarter) as well as a mean annual value for the indicator. The value of the indicator should be presented in a table. In case of periodical surveys, we can also provide a graphic presentation (e.g. a linear diagram) of the value of indicator over time. It is also necessary to explain the possible extreme values of the indicator. 3.2.1.2 Under‐coverage error
It is more difficult to measure the undercoverage problem than overcoverage. It occurs when a unit is not included in the frame (and thereby not in the sample either), although, by definition, it belongs there. This is why, we do not define a separate indicator, and it is necessary to provide any (indirect) information which would at least suggest the scope of error. 3.2.1.3 Measures to reduce coverage errors
It is necessary to describe all procedures conducted to reduce the coverage errors. In doing so, it is necessary to describe both current and planned activities. The problems caused by the erroneous coverage can be solved in the following way: (1) we write the responses by the units we obtain in the field, during the observed year, and we give them a status of a responding unit, and then we accept those new statuses during the next year's survey; (2) prior to sending a questionnaire to the field, we prepare a statistical list of e.g. higher education institutions, and we compare that list with the list maintained by the Education Ministry. In case of any divergence between the two lists, we modify (amend) the statistical list. 3.2.2 Measurement errors The measurement errors are errors that occur during data collection and cause recorded values of variables to be different from the true ones. Their causes are commonly categorized as: (1)survey instrument: the form used for data collection may lead to the recording of wrong values; (2) respondent/responding unit: respondents may, consciously or unconsciously, give erroneous data; (3) interviewer: interviewers may influence the answers given by respondents/responding unit.
Calculation: Number of frame units which do not belong to target population A2 = --------------------------------------------------------------------------- x 100 Total number of frame units
Zelenih beretki 71000 Sarajevo Telephone: (033) 22 06 26; faks: (033) 22 06 26; e-mail: [email protected]; www.bhas.ba
12 QUALITY REPORT – Methodological Guidelines
The data editing procedure identifies inconsistencies. Normally, they are the consequence of errors in the original data, and can also be processing errors due to coding or data entry. The editing rate thus indicates the quality of data collection and processing and not the quality of final output data. 3.2.2.1 Controls to detect measurement errors
It is necessary to describe the system for detecting errors in the data. It is necessary to mention whether the control system is based on computer‐supported procedures and if so, also the programme tool (e.g. Blaise, SAS) used. For the sake of illustration, it is necessary to mention at least some of the logical controls used to control the data. 3.2.2.2 Reasons for measurement errors
It is necessary to give the main reasons for measurement errors. If there is the feedback from the reporting units, it is necessary, first of all, to state those main reasons for the measurement errors (in their view). In some surveys (especially those conducted in households) notes by interviewers, if any, are also necessary. The most frequent reason for measurement errors are: (1) the person who completes the questionnaire is not trained enough; (2) the person who completes the questionnaire did not read carefully the instructions for completion of the questionnaire; (3) the person who enters the data in a table has not been careful enough; (4) the lack of records in the reporting units; (5) too extensive or too narrow methodological instructions for completion of the questionnaire, and (6) the questionnaire is not precise enough, and the instruction is incomplete.
3.2.2.3 Procedure in case of measurement errors
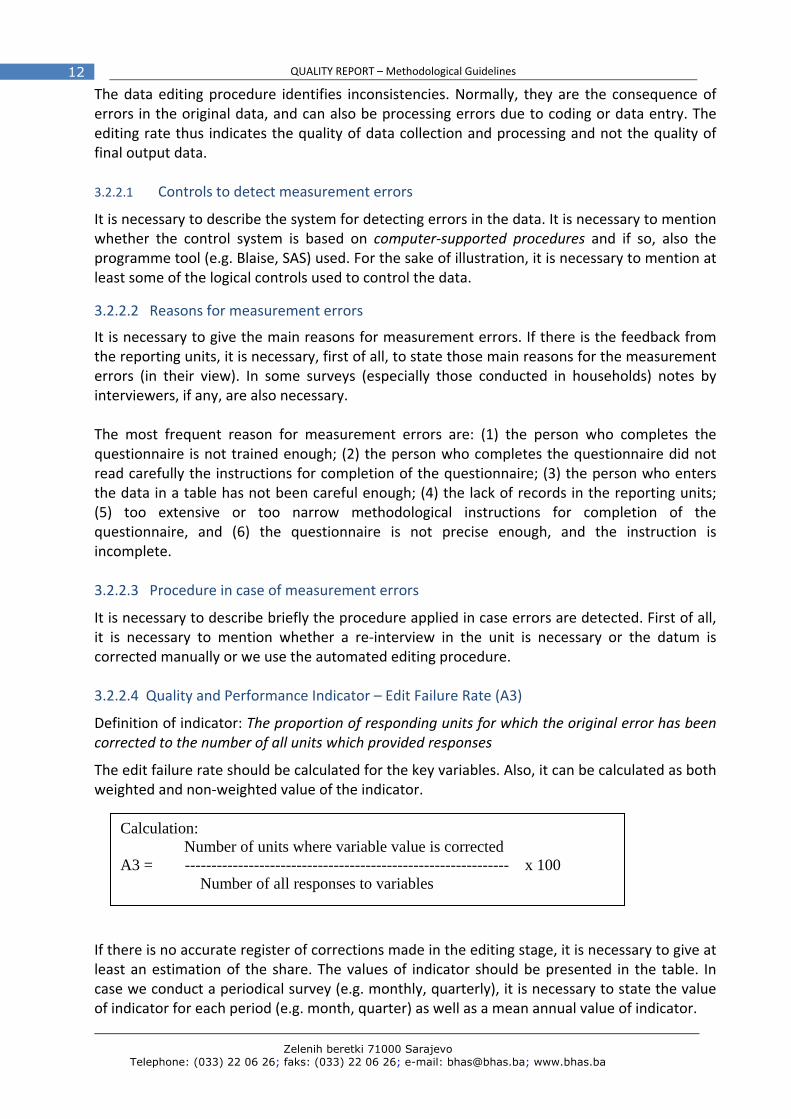
It is necessary to describe briefly the procedure applied in case errors are detected. First of all, it is necessary to mention whether a re‐interview in the unit is necessary or the datum is corrected manually or we use the automated editing procedure. 3.2.2.4 Quality and Performance Indicator – Edit Failure Rate (A3)
Definition of indicator: The proportion of responding units for which the original error has been corrected to the number of all units which provided responses
The edit failure rate should be calculated for the key variables. Also, it can be calculated as both weighted and non‐weighted value of the indicator.
If there is no accurate register of corrections made in the editing stage, it is necessary to give at least an estimation of the share. The values of indicator should be presented in the table. In case we conduct a periodical survey (e.g. monthly, quarterly), it is necessary to state the value of indicator for each period (e.g. month, quarter) as well as a mean annual value of indicator.
Calculation: Number of units where variable value is corrected A3 = ------------------------------------------------------------- x 100 Number of all responses to variables
Zelenih beretki 71000 Sarajevo Telephone: (033) 22 06 26; faks: (033) 22 06 26; e‐mail: [email protected]; www.bhas.ba
13 QUALITY REPORT – Methodological Guidelines
3.2.2.5 Measures to reduce number of measurement errors
It is necessary to state all activities undertaken to reduce measurement errors. The most effective way to reduce the number of measurement errors is to use precise and clear methodological explanations which should not be too extensive, and, naturally, to establish a direct contact with the reporting units. 3.2.3 Nonresponse errors
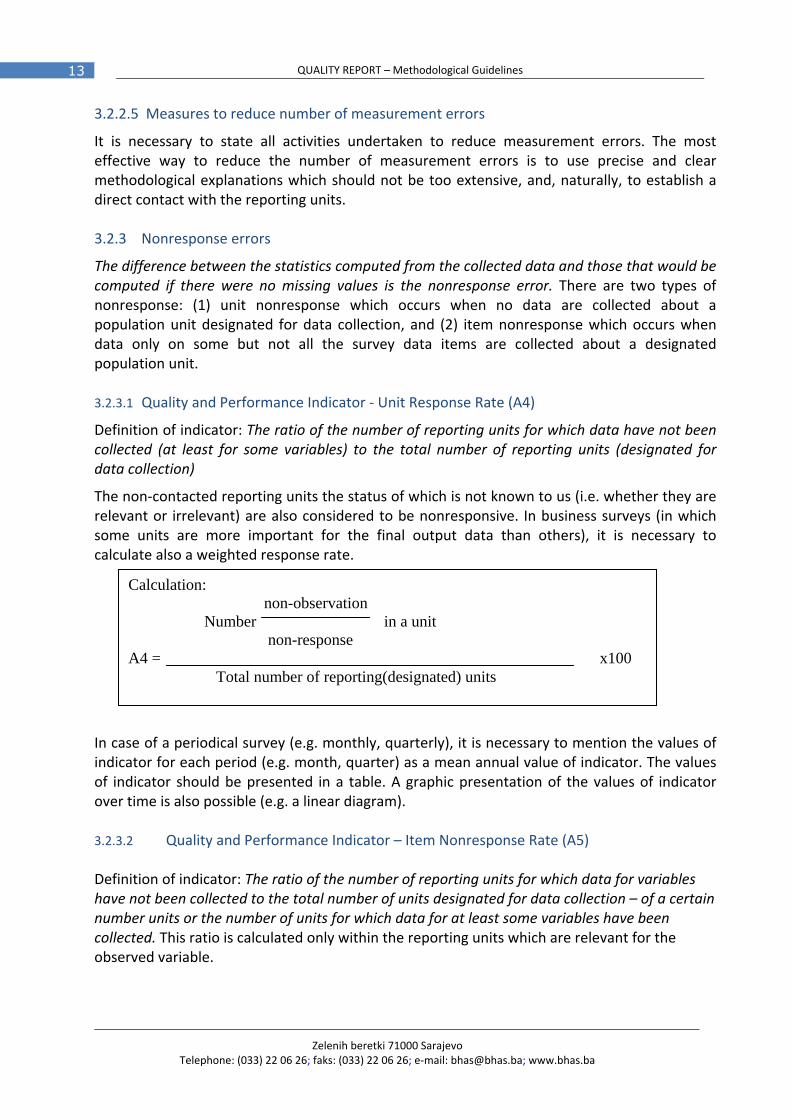
The difference between the statistics computed from the collected data and those that would be computed if there were no missing values is the nonresponse error. There are two types of nonresponse: (1) unit nonresponse which occurs when no data are collected about a population unit designated for data collection, and (2) item nonresponse which occurs when data only on some but not all the survey data items are collected about a designated population unit. 3.2.3.1 Quality and Performance Indicator ‐ Unit Response Rate (A4)
Definition of indicator: The ratio of the number of reporting units for which data have not been collected (at least for some variables) to the total number of reporting units (designated for data collection)
The non‐contacted reporting units the status of which is not known to us (i.e. whether they are relevant or irrelevant) are also considered to be nonresponsive. In business surveys (in which some units are more important for the final output data than others), it is necessary to calculate also a weighted response rate.
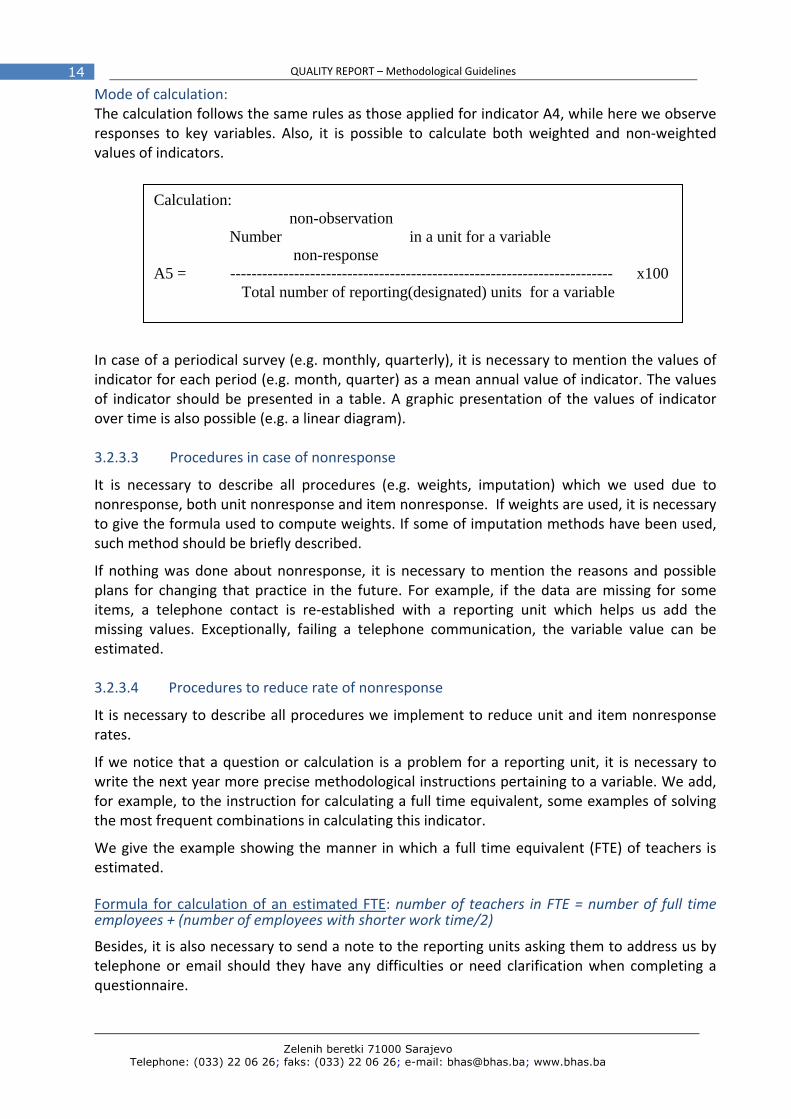
In case of a periodical survey (e.g. monthly, quarterly), it is necessary to mention the values of indicator for each period (e.g. month, quarter) as a mean annual value of indicator. The values of indicator should be presented in a table. A graphic presentation of the values of indicator over time is also possible (e.g. a linear diagram). 3.2.3.2 Quality and Performance Indicator – Item Nonresponse Rate (A5) Definition of indicator: The ratio of the number of reporting units for which data for variables have not been collected to the total number of units designated for data collection – of a certain number units or the number of units for which data for at least some variables have been collected. This ratio is calculated only within the reporting units which are relevant for the observed variable.
Calculation: non-observation Number in a unit non-response A4 = x100 Total number of reporting(designated) units
Zelenih beretki 71000 Sarajevo Telephone: (033) 22 06 26; faks: (033) 22 06 26; e-mail: [email protected]; www.bhas.ba
14 QUALITY REPORT – Methodological Guidelines
Mode of calculation: The calculation follows the same rules as those applied for indicator A4, while here we observe responses to key variables. Also, it is possible to calculate both weighted and non‐weighted values of indicators.
In case of a periodical survey (e.g. monthly, quarterly), it is necessary to mention the values of indicator for each period (e.g. month, quarter) as a mean annual value of indicator. The values of indicator should be presented in a table. A graphic presentation of the values of indicator over time is also possible (e.g. a linear diagram). 3.2.3.3 Procedures in case of nonresponse
It is necessary to describe all procedures (e.g. weights, imputation) which we used due to nonresponse, both unit nonresponse and item nonresponse. If weights are used, it is necessary to give the formula used to compute weights. If some of imputation methods have been used, such method should be briefly described.
If nothing was done about nonresponse, it is necessary to mention the reasons and possible plans for changing that practice in the future. For example, if the data are missing for some items, a telephone contact is re‐established with a reporting unit which helps us add the missing values. Exceptionally, failing a telephone communication, the variable value can be estimated. 3.2.3.4 Procedures to reduce rate of nonresponse
It is necessary to describe all procedures we implement to reduce unit and item nonresponse rates.
If we notice that a question or calculation is a problem for a reporting unit, it is necessary to write the next year more precise methodological instructions pertaining to a variable. We add, for example, to the instruction for calculating a full time equivalent, some examples of solving the most frequent combinations in calculating this indicator.
We give the example showing the manner in which a full time equivalent (FTE) of teachers is estimated. Formula for calculation of an estimated FTE: number of teachers in FTE = number of full time employees + (number of employees with shorter work time/2)
Besides, it is also necessary to send a note to the reporting units asking them to address us by telephone or email should they have any difficulties or need clarification when completing a questionnaire.
Calculation: non-observation Number in a unit for a variable non-response A5 = ------------------------------------------------------------------------ x100 Total number of reporting(designated) units for a variable
Zelenih beretki 71000 Sarajevo Telephone: (033) 22 06 26; faks: (033) 22 06 26; e‐mail: [email protected]; www.bhas.ba
15 QUALITY REPORT – Methodological Guidelines
3.2.3.5 Quality and Performance Indicator ‐ Imputation Rate (A6)
Imputation is a response to the missing elements in the received data. In statistical survey or census‐based surveys, the reason for imputation can be nonresponse (usually an item nonresponse), while, say, in processing the price index, imputation is due to the missing prices.
The rate of imputed data is an indicator which is calculated when some values for the key variables are estimated (imputed) through one of the usual imputation methods. The datum can be imputed due to the missing values or due to inadequate values which we detected during the editing stage.
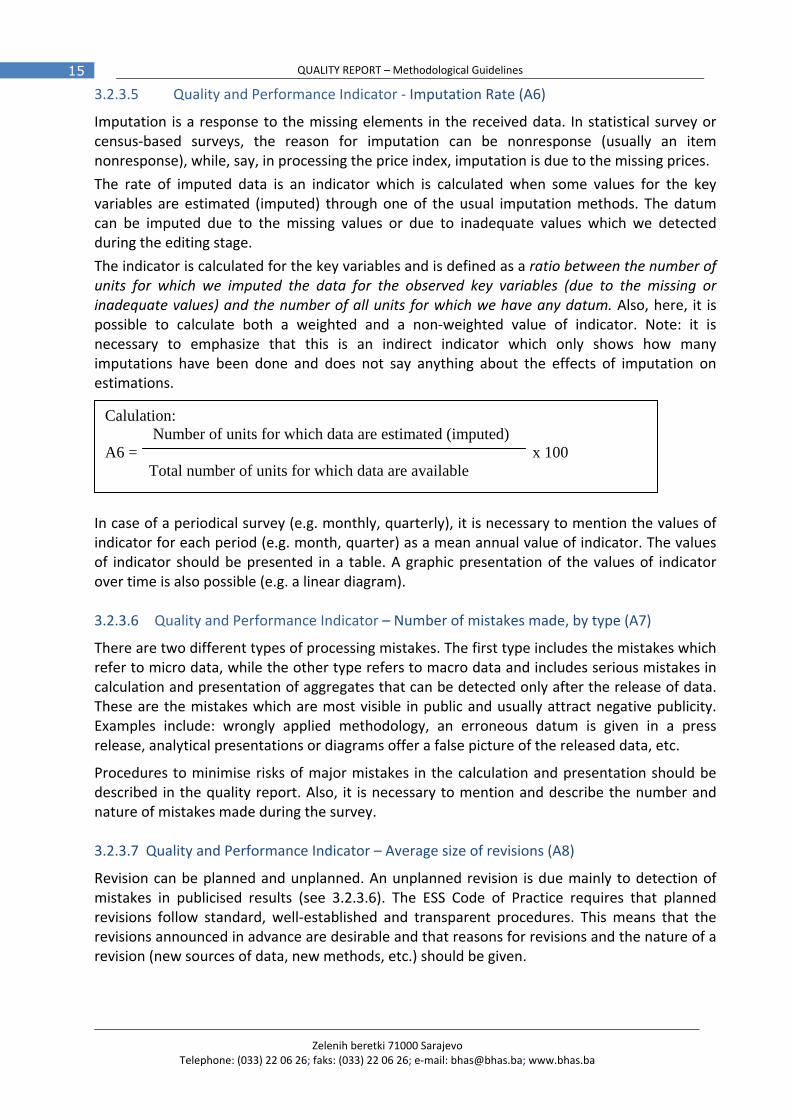
The indicator is calculated for the key variables and is defined as a ratio between the number of units for which we imputed the data for the observed key variables (due to the missing or inadequate values) and the number of all units for which we have any datum. Also, here, it is possible to calculate both a weighted and a non‐weighted value of indicator. Note: it is necessary to emphasize that this is an indirect indicator which only shows how many imputations have been done and does not say anything about the effects of imputation on estimations.
In case of a periodical survey (e.g. monthly, quarterly), it is necessary to mention the values of indicator for each period (e.g. month, quarter) as a mean annual value of indicator. The values of indicator should be presented in a table. A graphic presentation of the values of indicator over time is also possible (e.g. a linear diagram). 3.2.3.6 Quality and Performance Indicator – Number of mistakes made, by type (A7)
There are two different types of processing mistakes. The first type includes the mistakes which refer to micro data, while the other type refers to macro data and includes serious mistakes in calculation and presentation of aggregates that can be detected only after the release of data. These are the mistakes which are most visible in public and usually attract negative publicity. Examples include: wrongly applied methodology, an erroneous datum is given in a press release, analytical presentations or diagrams offer a false picture of the released data, etc.
Procedures to minimise risks of major mistakes in the calculation and presentation should be described in the quality report. Also, it is necessary to mention and describe the number and nature of mistakes made during the survey. 3.2.3.7 Quality and Performance Indicator – Average size of revisions (A8)
Revision can be planned and unplanned. An unplanned revision is due mainly to detection of mistakes in publicised results (see 3.2.3.6). The ESS Code of Practice requires that planned revisions follow standard, well‐established and transparent procedures. This means that the revisions announced in advance are desirable and that reasons for revisions and the nature of a revision (new sources of data, new methods, etc.) should be given.
Calulation: Number of units for which data are estimated (imputed) A6 = x 100 Total number of units for which data are available
Zelenih beretki 71000 Sarajevo Telephone: (033) 22 06 26; faks: (033) 22 06 26; e-mail: [email protected]; www.bhas.ba
16 QUALITY REPORT – Methodological Guidelines
4 Timeliness and Punctuality
Definition of component: The timeliness of statistical outputs is the length of time between the reference period that the data refer to and its availability, i.e. release date. Punctuality is the time lag between the release date of data and the target date on which they were scheduled for release as announced in an official release calendar. If the above‐mentioned dates overlap, we consider that the release was punctual.
4.1 Timeliness of release
It is relatively easy and straightforward to measure timeliness of release. The most relevant measure is the percentage of publications released on time, in accordance with the officially announced release calendar. Some statistics are released in several versions (e.g. preliminary, revised and final). In this case, each release has its own timeliness profile. It is necessary to explain and give reasons for possible delays in release dates and also explain the efforts undertaken to improve the situation. 4.1.1 Quality and Performance Indicator – Timeliness of first results (T1) Definition of indicator: Timeliness of first results is the delay (number of days) from the last day of the reference period (e.g. the last day of a month that the outputs refer to) to the day of publication of first results. The data on timeliness of first results should be presented in a tabular format.
The following has to be mentioned: the reference period; date of publication of first results; the delay as T+x, where T is the end of the reference period and x is the number of days.
It is necessary to describe all procedures (e.g. weighting, imputation) which we used due to nonresponse, both unit nonresponse and item nonresponse. If weighting was used, it is necessary to give the formula used to compute the weight. If some of the imputation methods have been used, such method should be briefly described.
4.1.2 Quality and Performance Indicator – Timeliness of final results (T2) Definition of indicator: Timeliness of final results is the delay (the number of days) from the last day of the reference period (e.g. the last day of a month to which the results refer) to the day of publication of final results of the survey.
The following has to be mentioned: the reference period; date of publication of final results; the delay as T+x, where T is the end of the reference period and x is the number of days.
In case of a periodical survey (e.g. monthly, quarterly), it is necessary to mention the values of indicator for each period (e.g. month, quarter) as a mean annual value of indicator. The values of indicator should be presented in a table. A graphic presentation of the values of indicator over time is also possible (e.g. a linear diagram).
If the first release of the survey results is also the final release, the indicator is not calculated and only a note is given in this section.
Zelenih beretki 71000 Sarajevo Telephone: (033) 22 06 26; faks: (033) 22 06 26; e‐mail: [email protected]; www.bhas.ba
17 QUALITY REPORT – Methodological Guidelines
4.2 Punctuality of publication
4.2.1 Quality and Performance Indicator – Punctuality of publication (T3) Definition of indicator: Timeliness of publication is calculated as a difference (number of days) separating a previously announced date of publication and the actual date. The previously announced date is the date set in the annual release calendar.
The following has to be mentioned: announced/planned date of publication of results; actual date of publication of results; delay as T+x, where T is the previously announced date of publication and x is the number of days. 4.3 Reasons for major delays and measures to improve timeliness and punctuality of
publications
It is necessary to give the reasons and additional explanations in case of high values of time lags for the values of T1, T2 and T3 indicators. It is also necessary to mention the measures taken to improve timeliness and punctuality of the dates announced in the release calendar.
5 Accessibility and Clarity
Definition of component:
Accessibility and clarity of statistical products/results implies a simple and easy way in which users can access statistical data, using simple and easy procedures. Accessibility of statistical outputs/products refers to concrete physical circumstances in which the data are accessible to users: physical location of data; dissemination channels; a release schedule; a clear pricing policy; accessibility of micro and macro data; different formats and media (e.g. paper, computer files, CD‐ROM, Internet). 5.1 Accessibility
5.1.1 Dissemination channels
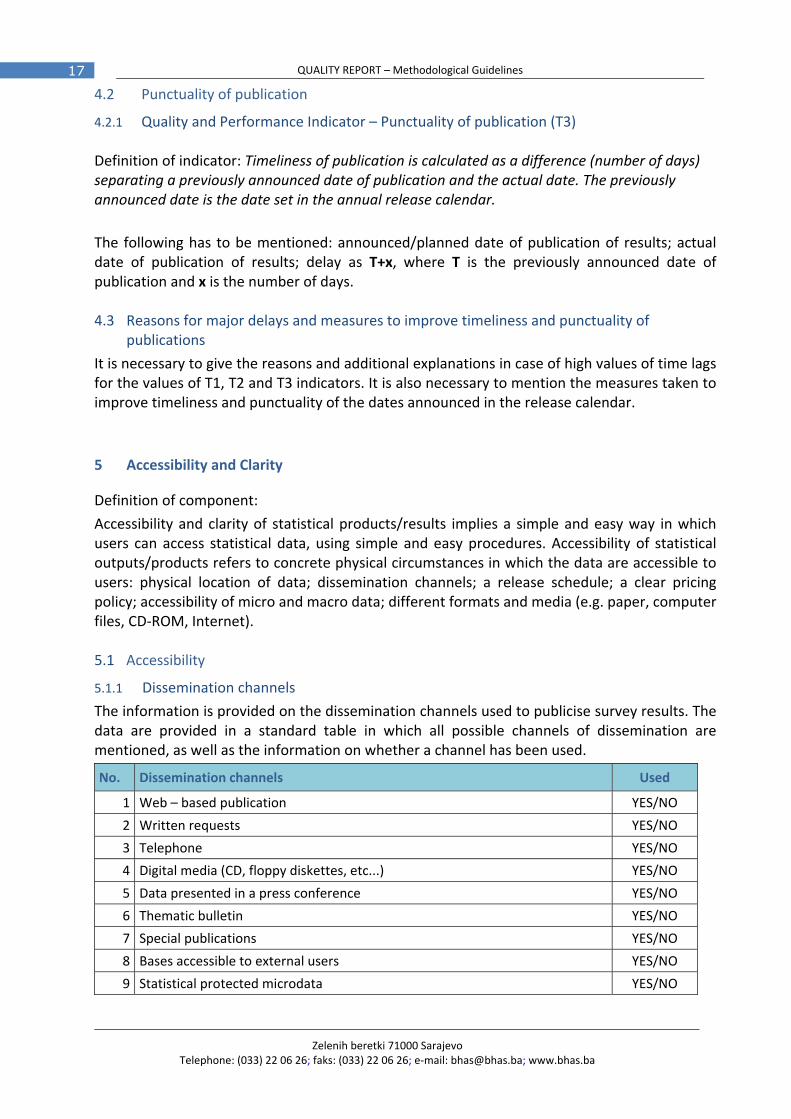
The information is provided on the dissemination channels used to publicise survey results. The data are provided in a standard table in which all possible channels of dissemination are mentioned, as well as the information on whether a channel has been used.
No. Dissemination channels Used
1 Web – based publication YES/NO
2 Written requests YES/NO
3 Telephone YES/NO
4 Digital media (CD, floppy diskettes, etc...) YES/NO
5 Data presented in a press conference YES/NO
6 Thematic bulletin YES/NO
7 Special publications YES/NO
8 Bases accessible to external users YES/NO
9 Statistical protected microdata YES/NO
Zelenih beretki 71000 Sarajevo Telephone: (033) 22 06 26; faks: (033) 22 06 26; e-mail: [email protected]; www.bhas.ba
18 QUALITY REPORT – Methodological Guidelines
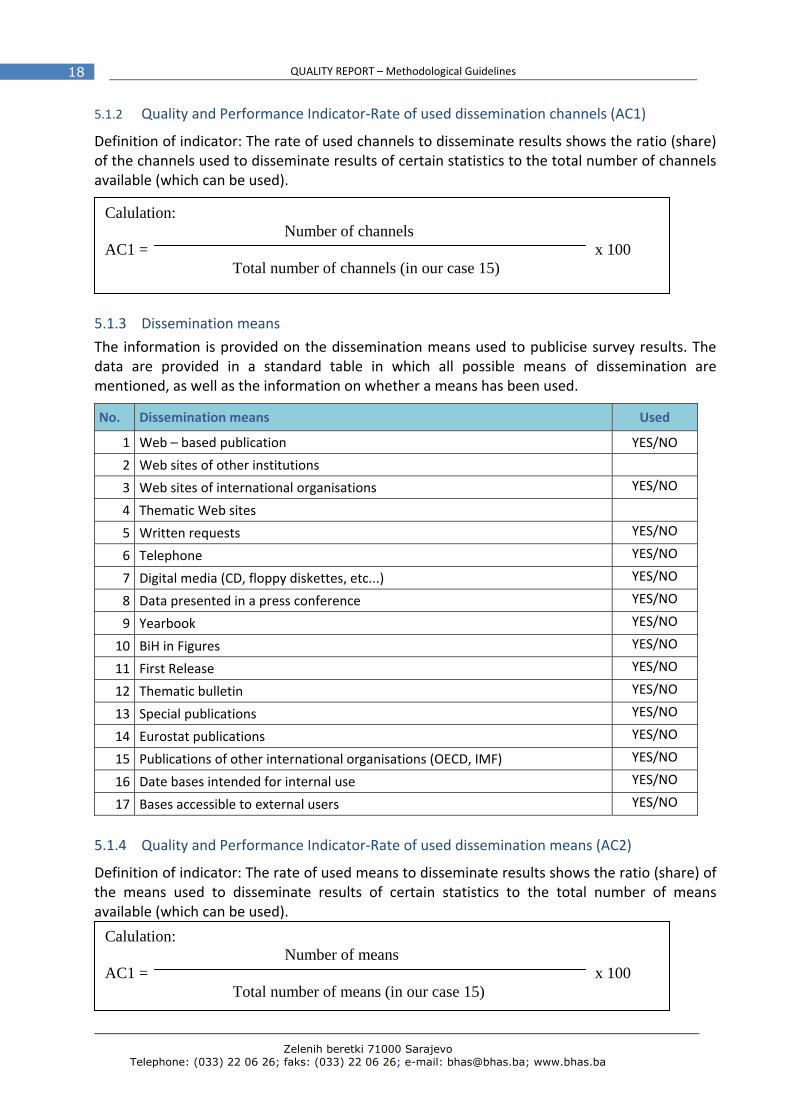
5.1.2 Quality and Performance Indicator‐Rate of used dissemination channels (AC1)
Definition of indicator: The rate of used channels to disseminate results shows the ratio (share) of the channels used to disseminate results of certain statistics to the total number of channels available (which can be used).
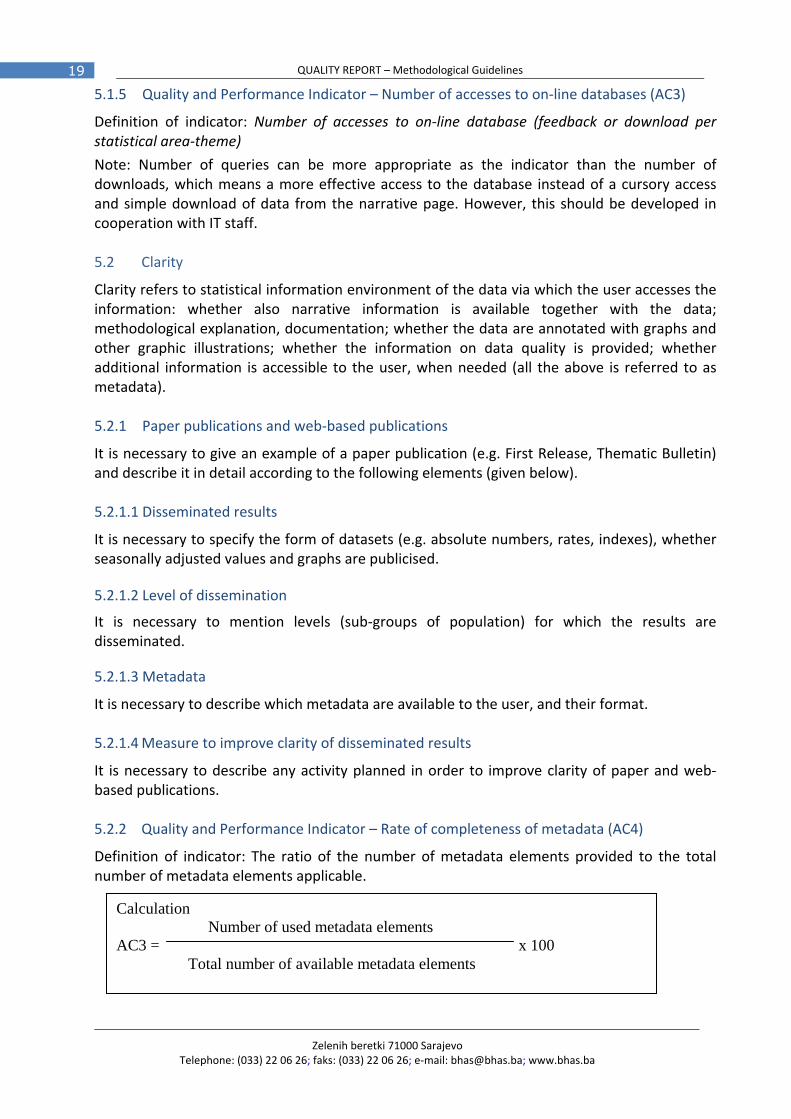
5.1.3 Dissemination means
The information is provided on the dissemination means used to publicise survey results. The data are provided in a standard table in which all possible means of dissemination are mentioned, as well as the information on whether a means has been used.
No. Dissemination means Used
1 Web – based publication YES/NO
2 Web sites of other institutions
3 Web sites of international organisations YES/NO
4 Thematic Web sites
5 Written requests YES/NO
6 Telephone YES/NO
7 Digital media (CD, floppy diskettes, etc...) YES/NO
8 Data presented in a press conference YES/NO
9 Yearbook YES/NO
10 BiH in Figures YES/NO
11 First Release YES/NO
12 Thematic bulletin YES/NO
13 Special publications YES/NO
14 Eurostat publications YES/NO
15 Publications of other international organisations (OECD, IMF) YES/NO
16 Date bases intended for internal use YES/NO
17 Bases accessible to external users YES/NO
5.1.4 Quality and Performance Indicator‐Rate of used dissemination means (AC2)
Definition of indicator: The rate of used means to disseminate results shows the ratio (share) of the means used to disseminate results of certain statistics to the total number of means available (which can be used).
Calulation: Number of means AC1 = x 100 Total number of means (in our case 15)
Calulation: Number of channels AC1 = x 100 Total number of channels (in our case 15)
Zelenih beretki 71000 Sarajevo Telephone: (033) 22 06 26; faks: (033) 22 06 26; e‐mail: [email protected]; www.bhas.ba
19 QUALITY REPORT – Methodological Guidelines
5.1.5 Quality and Performance Indicator – Number of accesses to on‐line databases (AC3)
Definition of indicator: Number of accesses to on‐line database (feedback or download per statistical area‐theme)
Note: Number of queries can be more appropriate as the indicator than the number of downloads, which means a more effective access to the database instead of a cursory access and simple download of data from the narrative page. However, this should be developed in cooperation with IT staff. 5.2 Clarity
Clarity refers to statistical information environment of the data via which the user accesses the information: whether also narrative information is available together with the data; methodological explanation, documentation; whether the data are annotated with graphs and other graphic illustrations; whether the information on data quality is provided; whether additional information is accessible to the user, when needed (all the above is referred to as metadata). 5.2.1 Paper publications and web‐based publications
It is necessary to give an example of a paper publication (e.g. First Release, Thematic Bulletin) and describe it in detail according to the following elements (given below). 5.2.1.1 Disseminated results
It is necessary to specify the form of datasets (e.g. absolute numbers, rates, indexes), whether seasonally adjusted values and graphs are publicised. 5.2.1.2 Level of dissemination
It is necessary to mention levels (sub‐groups of population) for which the results are disseminated. 5.2.1.3 Metadata
It is necessary to describe which metadata are available to the user, and their format. 5.2.1.4 Measure to improve clarity of disseminated results
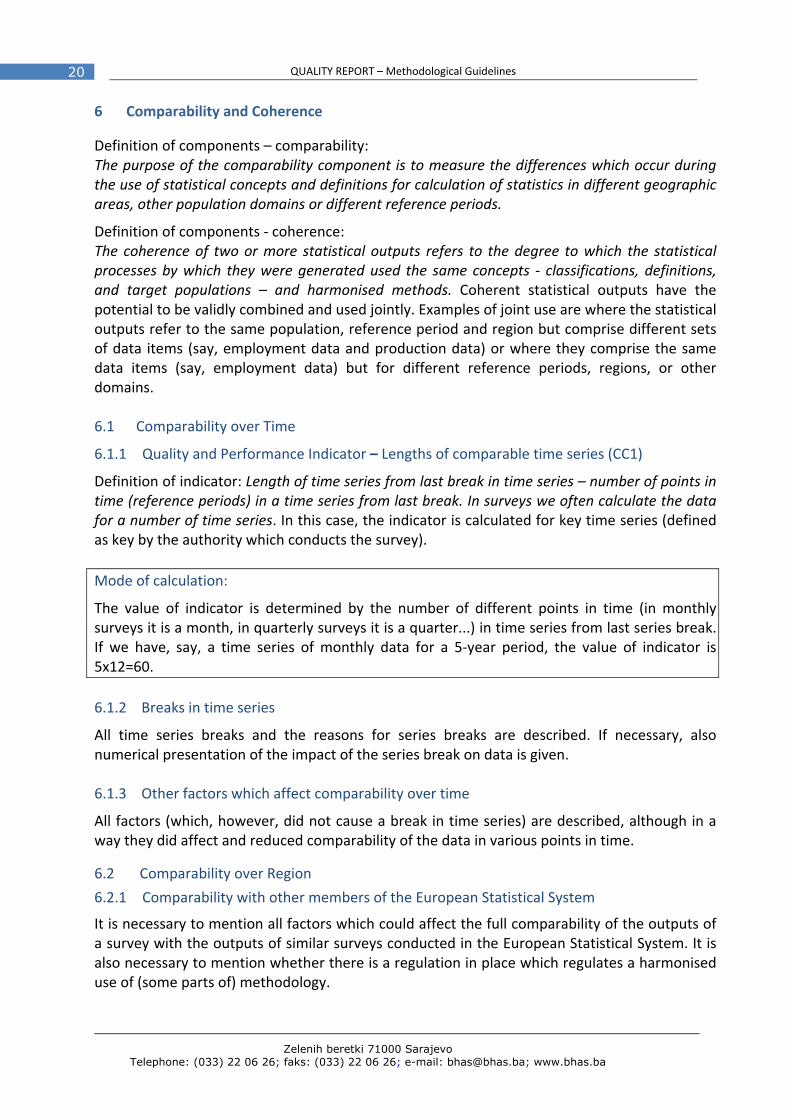
It is necessary to describe any activity planned in order to improve clarity of paper and web‐based publications. 5.2.2 Quality and Performance Indicator – Rate of completeness of metadata (AC4)
Definition of indicator: The ratio of the number of metadata elements provided to the total number of metadata elements applicable.
Calculation Number of used metadata elements AC3 = x 100 Total number of available metadata elements
Zelenih beretki 71000 Sarajevo Telephone: (033) 22 06 26; faks: (033) 22 06 26; e-mail: [email protected]; www.bhas.ba
20 QUALITY REPORT – Methodological Guidelines
6 Comparability and Coherence
Definition of components – comparability: The purpose of the comparability component is to measure the differences which occur during the use of statistical concepts and definitions for calculation of statistics in different geographic areas, other population domains or different reference periods.
Definition of components ‐ coherence: The coherence of two or more statistical outputs refers to the degree to which the statistical processes by which they were generated used the same concepts ‐ classifications, definitions, and target populations – and harmonised methods. Coherent statistical outputs have the potential to be validly combined and used jointly. Examples of joint use are where the statistical outputs refer to the same population, reference period and region but comprise different sets of data items (say, employment data and production data) or where they comprise the same data items (say, employment data) but for different reference periods, regions, or other domains. 6.1 Comparability over Time
6.1.1 Quality and Performance Indicator – Lengths of comparable time series (CC1)
Definition of indicator: Length of time series from last break in time series – number of points in time (reference periods) in a time series from last break. In surveys we often calculate the data for a number of time series. In this case, the indicator is calculated for key time series (defined as key by the authority which conducts the survey). Mode of calculation:
The value of indicator is determined by the number of different points in time (in monthly surveys it is a month, in quarterly surveys it is a quarter...) in time series from last series break. If we have, say, a time series of monthly data for a 5‐year period, the value of indicator is 5x12=60. 6.1.2 Breaks in time series
All time series breaks and the reasons for series breaks are described. If necessary, also numerical presentation of the impact of the series break on data is given. 6.1.3 Other factors which affect comparability over time
All factors (which, however, did not cause a break in time series) are described, although in a way they did affect and reduced comparability of the data in various points in time. 6.2 Comparability over Region
6.2.1 Comparability with other members of the European Statistical System
It is necessary to mention all factors which could affect the full comparability of the outputs of a survey with the outputs of similar surveys conducted in the European Statistical System. It is also necessary to mention whether there is a regulation in place which regulates a harmonised use of (some parts of) methodology.
2
21
6.3 S
One of periodssoftwarand, if pseries. 6.4 C
6.4.1 P
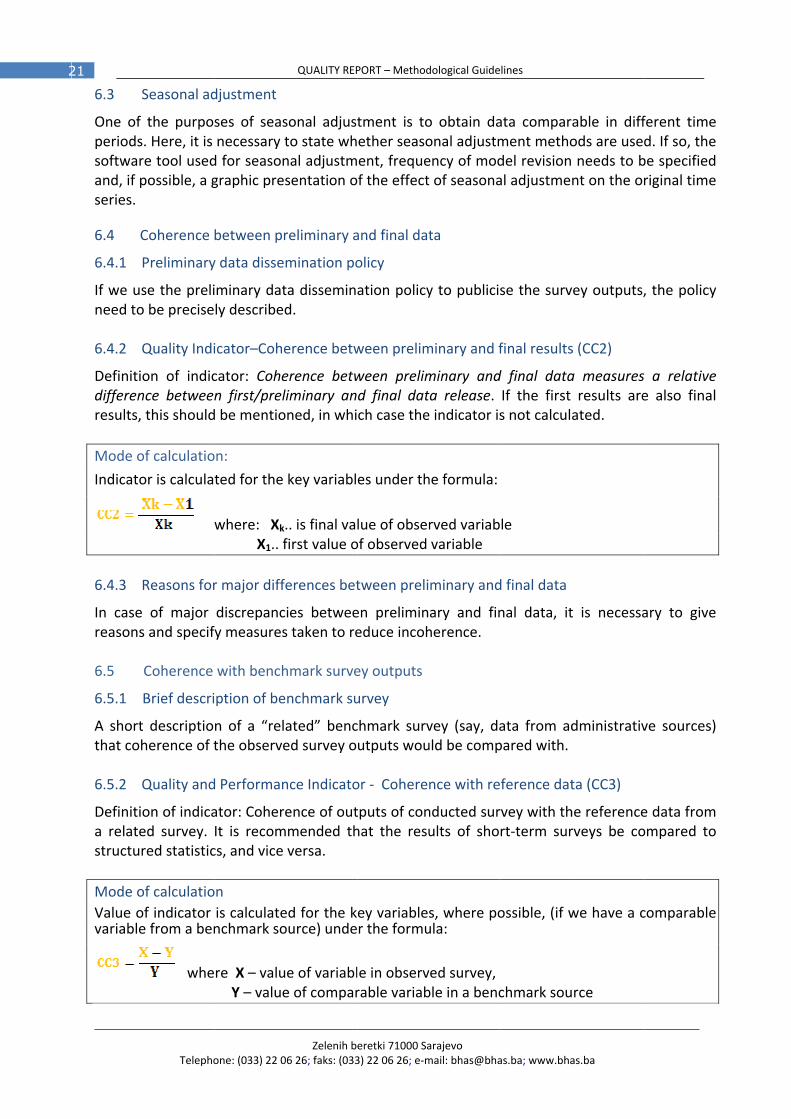
If we usneed to 6.4.2 Q
Definitiodifferenresults, Mode o
Indicato
6.4.3 R
In case reasons 6.5
6.5.1
A shortthat coh 6.5.2 Q
Definitioa relatestructur Mode oValue ovariable
Telepho
Seasonal ad
the purpo. Here, it is re tool usedpossible, a g
Coherence
Preliminary
se the prelio be precise
Quality Indi
on of indicnce betweenthis should
of calculatio
or is calcula
Reasons for
of major s and specif
Coherence
Brief descri
t descriptioherence of t
Quality and
on of indicaed survey. red statistic
of calculatioof indicator e from a ben
whe
one: (033) 22 0
djustment
ses of seasnecessary td for seasongraphic pres
between pr
y data dissem
minary datly described
icator–Cohe
cator: Cohen first/prelid be mentio
on:
ted for the
where: Xk. X1.. f
r major diffe
discrepancfy measures
with bench
ption of be
n of a “relathe observe
d Performan
ator: CohereIt is recomcs, and vice
on is calculatenchmark so
re X – valu Y – value
Zelenih be6 26; faks: (033
QUALITY REP
sonal adjustto state whnal adjustmsentation o
reliminary a
mination po
ta disseminad.
erence betw
erence betwiminary anned, in whi
key variabl
.. is final valfirst value o
erences bet
ies betwees taken to re
hmark surve
nchmark su
ated” benced survey o
nce Indicato
ence of outmended thversa.
ed for the kource) unde
e of variable of compar
eretki 71000 Sa3) 22 06 26; e‐m
PORT – Method
tment is toether seasoent, frequef the effect
and final dat
olicy
ation policy
ween prelim
ween prelimd final datch case the
es under th
lue of obserof observed
tween preli
en prelimineduce incoh
ey outputs
urvey
chmark survutputs wou
or ‐ Cohere
tputs of conhat the resu
ey variabler the formu
e in observrable variab
arajevo mail: bhas@bha
dological Guide
o obtain daonal adjustmency of modt of seasona
ta
y to publicis
minary and f
minary andta release. e indicator is
he formula:
rved variabvariable
minary and
ary and finherence.
vey (say, dauld be comp
nce with re
nducted surults of sho
s, where poula:
ved survey, ble in a benc
as.ba; www.bha
lines
ata comparment methodel revisional adjustme
se the surv
final results
d final dataIf the first s not calcula
le
d final data
nal data, it
ata from adpared with.
ference dat
vey with thrt‐term sur
ossible, (if w
chmark sou
as.ba
able in diffods are use needs to bnt on the o
vey outputs,
s (CC2)
a measuresresults areated.
t is necessa
dministrativ
ta (CC3)
he referencerveys be co
we have a c
rce
ferent timed. If so, thebe specifiedriginal time
, the policy
s a relativee also final
ary to give
ve sources)
e data fromompared to
comparable
e e d e
y
e l
e
)
m o
e
Zelenih beretki 71000 Sarajevo Telephone: (033) 22 06 26; faks: (033) 22 06 26; e-mail: [email protected]; www.bhas.ba
22 QUALITY REPORT – Methodological Guidelines
6.5.3 Reasons for major discrepancies
In case of major discrepancies among survey outputs, reasons should be given.
7 Trade‐offs between Output Quality Components
What should be included in this component: ‐ A description of each important trade‐off that has been analysed and the basis on which
the trade‐off decision has been made, and ‐ A statement concerning any trade‐offs that should have been analysed but have not
been. 8 Assessment of User Needs and Perceptions
The assessment of user needs and perceptions takes into consideration all quality components, and not only relevance (although this component is the most important). 8.1 User classification and satisfaction
Defining user needs is the initial stage of designing and managing statistical processes. Assessment of user needs generally involves a classification of users, an indication of the intended use of the outputs, the priorities in satisfying their needs, and an account of how this information was obtained, for example, through advisory committees, other regularly convened user groups, feedback/complaints from users, survey.
Key users by main groups of segmentation are mentioned: public sector, businesses, judiciary, science, survey and education, general public, media, foreign users. Key users are identified on the basis of the data on ordered publications, membership/subscription, and on the basis of other records on survey data users. 8.2. Measurement of user perceptions and satisfaction
User satisfaction is the first‐class priority. The most effective evaluation method is a user satisfaction survey, in accordance with the best practice of surveys, using a representative sample of users from the appropriate frame, designed and tested questionnaire. Assessment of user perception and satisfaction is done on a user satisfaction scale. Other, less expensive assessment methods include an analysis of publications sale, user comments, requests and complaints received, access to web sites, etc. 8.2.1 Quality and Performance Indicator – User Satisfaction Index (US1)
Definition of indicator: User Satisfaction Index measures the degree of user satisfaction with services and products offered. It can be calculated for various segments of users. 8.2.2 Quality and Performance Indicator – Length of time since most recent user satisfaction survey (US2)
Definition of indicator: as stated.
Zelenih beretki 71000 Sarajevo Telephone: (033) 22 06 26; faks: (033) 22 06 26; e‐mail: [email protected]; www.bhas.ba
23 QUALITY REPORT – Methodological Guidelines
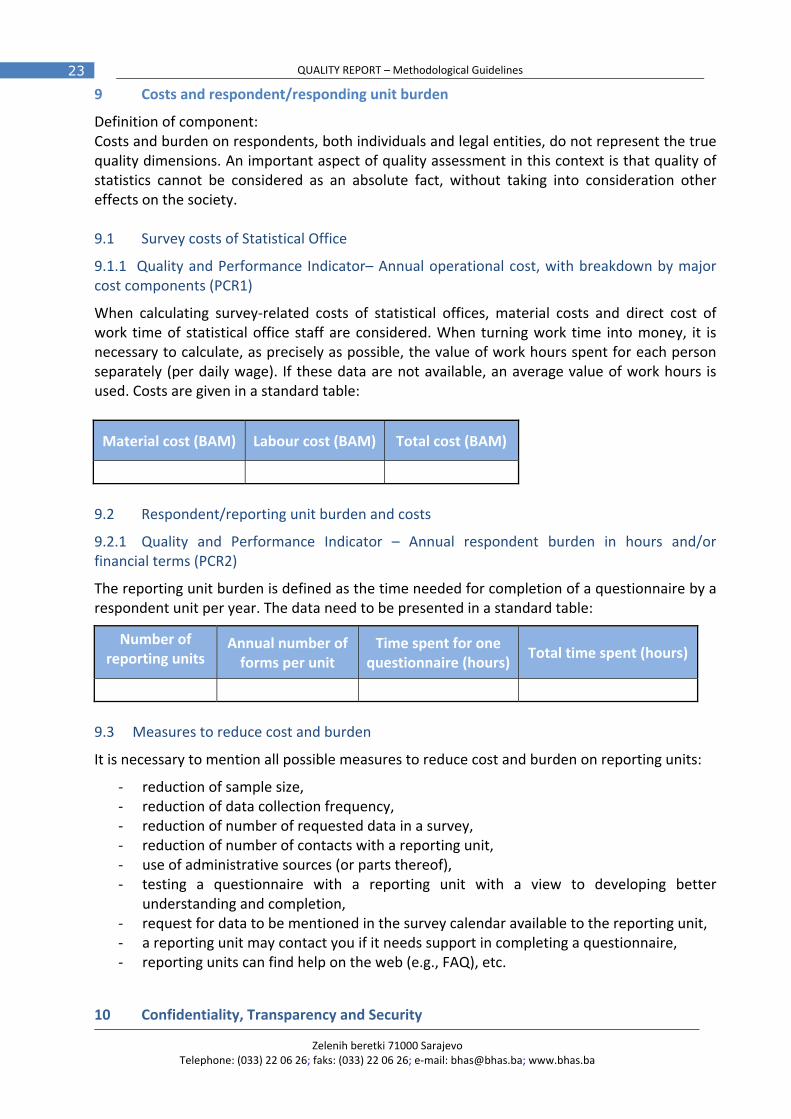
9 Costs and respondent/responding unit burden
Definition of component: Costs and burden on respondents, both individuals and legal entities, do not represent the true quality dimensions. An important aspect of quality assessment in this context is that quality of statistics cannot be considered as an absolute fact, without taking into consideration other effects on the society. 9.1 Survey costs of Statistical Office
9.1.1 Quality and Performance Indicator– Annual operational cost, with breakdown by major cost components (PCR1)
When calculating survey‐related costs of statistical offices, material costs and direct cost of work time of statistical office staff are considered. When turning work time into money, it is necessary to calculate, as precisely as possible, the value of work hours spent for each person separately (per daily wage). If these data are not available, an average value of work hours is used. Costs are given in a standard table:
Material cost (BAM) Labour cost (BAM) Total cost (BAM)
9.2 Respondent/reporting unit burden and costs
9.2.1 Quality and Performance Indicator – Annual respondent burden in hours and/or financial terms (PCR2)
The reporting unit burden is defined as the time needed for completion of a questionnaire by a respondent unit per year. The data need to be presented in a standard table:
Number of reporting units
Annual number of forms per unit
Time spent for one questionnaire (hours)
Total time spent (hours)
9.3 Measures to reduce cost and burden
It is necessary to mention all possible measures to reduce cost and burden on reporting units:
‐ reduction of sample size, ‐ reduction of data collection frequency, ‐ reduction of number of requested data in a survey, ‐ reduction of number of contacts with a reporting unit, ‐ use of administrative sources (or parts thereof), ‐ testing a questionnaire with a reporting unit with a view to developing better
understanding and completion, ‐ request for data to be mentioned in the survey calendar available to the reporting unit, ‐ a reporting unit may contact you if it needs support in completing a questionnaire, ‐ reporting units can find help on the web (e.g., FAQ), etc.
10 Confidentiality, Transparency and Security
Zelenih beretki 71000 Sarajevo Telephone: (033) 22 06 26; faks: (033) 22 06 26; e-mail: [email protected]; www.bhas.ba
24 QUALITY REPORT – Methodological Guidelines
According to the Principles of the Statistics Code of Practice, confidentiality of data providers/reporting units (individuals, households, businesses), confidentiality of the information they provide must be absolutely guaranteed and their data can be used only for statistical purposes (Principle 5); statistical authorities must produce and disseminate statistics (respecting professional independence) in an objective, professional and transparent way, treating all users equally. 10.1 Confidentiality
Typically, confidentiality of statistical data is required by law and the survey staff have legal confidentiality commitments. The quality report should confirm such arrangements, or report on any exceptions. It should also outline the procedures for ensuring confidentiality during collection, processing and dissemination. These include protocols for ensuring that individual data are accessed strictly on a need to know basis, rules for defining confidential cells in output tables, and procedures for detecting and preventing residual disclosure. In addition, the arrangements, if any, under which external users may access micro‐data for survey purposes, and the confidentiality provisions, should be described.
Note: Regardless of whether or not confidentiality is required by law, survey staff sign legal confidentiality commitments. 10.2 Transparency
The following needs to be mentioned: the way of using data, on the basis of the provisions on confidentiality contained in the Law on Statistics or the Fundamental Guidelines for Confidentiality – and information to users about it. Are statistical announcements and statements made at press conferences impartial and non‐partisan? Are the errors detected in published statistics corrected and publicised? 10.3 Security
It is necessary to describe in the report the provisions which ensure: protection and integrity of completed questionnaire, micro and macro databases and data outputs.
11 Conclusion
The quality report should conclude with a section referring to the principle quality problems as well as recommendations for improvement and future activities. ANNEXES
Zelenih beretki 71000 Sarajevo Telephone: (033) 22 06 26; faks: (033) 22 06 26; e‐mail: [email protected]; www.bhas.ba
25 QUALITY REPORT – Methodological Guidelines
Annex 1 : Brief description of quality components
Relevance Relevance is the degree to which statistical outputs meet current and potential user needs. It depends on whether all the statistics that are needed are produced and the extent to which concepts used (definitions, classifications etc.,) reflect user needs. When making a relevance report, the aim is to describe the extent to which statistical data are useful and which data are used by the broadest range of users.
In fact, we try to answer the question: are we producing relevant statistical data outputs?
Standard quality report should include the following items regarding relevance:
‐ A list of key users, on the basis of the standard division of users;
‐ All information on refused requests or any other user complaints;
‐ Rate of inaccessible statistical data
Accuracy The accuracy of statistical outputs in the general statistical sense is the degree of closeness of estimates to the true values. There are different types of errors, which occur in all survey processes, including errors in statistical data outputs:
‐ Sampling errors;
‐ Non‐sampling errors;
‐ Coverage errors;
‐ Measurement errors;
‐ Processing errors;
‐ Nonresponse errors;
‐ Model associated errors.
Standard quality reports should include the following accuracy‐related items:
‐ All sampling errors and non‐sampling errors, which have been calculated;
‐ Methods of error calculation or estimation;
‐ Explanation in case of a high value of error indicator;
‐ Measures taken to reduce errors.
Timeliness The timeliness of statistical outputs is the length of time between the event or phenomenon they describe and their availability. Punctuality is the time lag between the release date of data and the target date on which they were scheduled for release as announced in an official release calendar.
Timeliness and punctuality represent a dimension which can be measured relatively easily, although improved often with difficulty. Timeliness is often related to the frequency of release of statistical data: timeliness in case of monthly data is often considered as very different from timeliness in annual surveys.
Zelenih beretki 71000 Sarajevo Telephone: (033) 22 06 26; faks: (033) 22 06 26; e-mail: [email protected]; www.bhas.ba
26 QUALITY REPORT – Methodological Guidelines
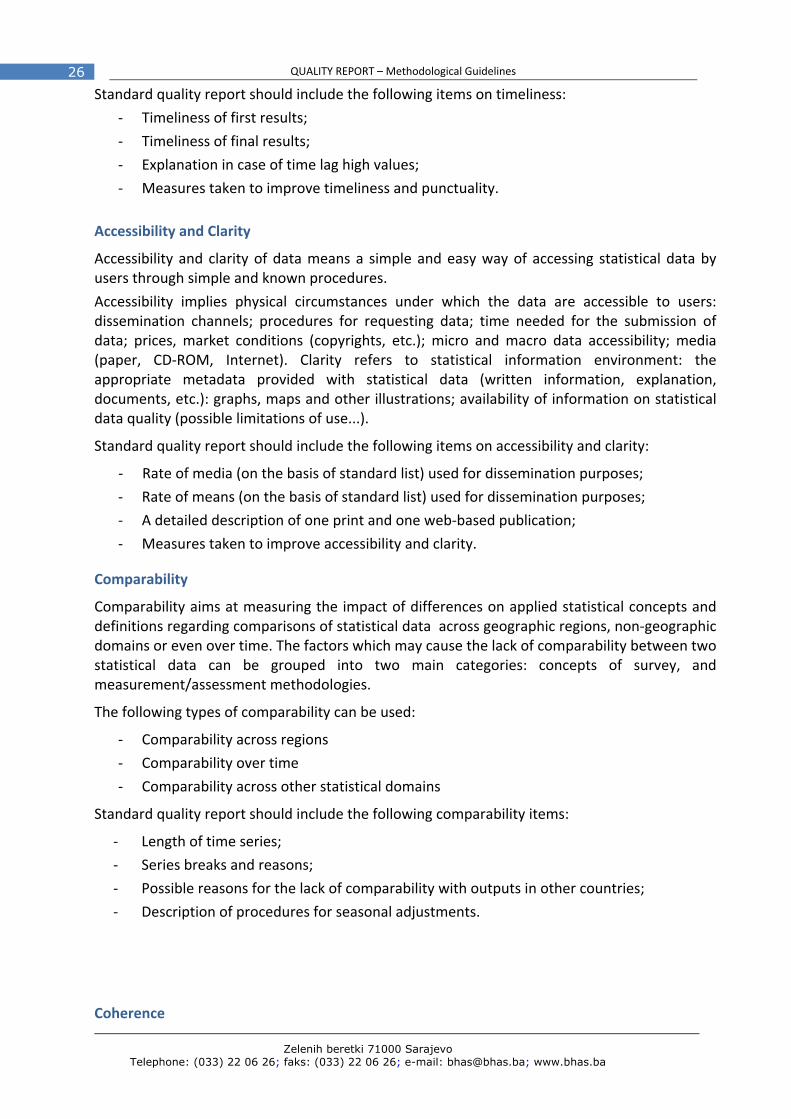
Standard quality report should include the following items on timeliness:
‐ Timeliness of first results;
‐ Timeliness of final results;
‐ Explanation in case of time lag high values;
‐ Measures taken to improve timeliness and punctuality.
Accessibility and Clarity
Accessibility and clarity of data means a simple and easy way of accessing statistical data by users through simple and known procedures.
Accessibility implies physical circumstances under which the data are accessible to users: dissemination channels; procedures for requesting data; time needed for the submission of data; prices, market conditions (copyrights, etc.); micro and macro data accessibility; media (paper, CD‐ROM, Internet). Clarity refers to statistical information environment: the appropriate metadata provided with statistical data (written information, explanation, documents, etc.): graphs, maps and other illustrations; availability of information on statistical data quality (possible limitations of use...).
Standard quality report should include the following items on accessibility and clarity:
‐ Rate of media (on the basis of standard list) used for dissemination purposes;
‐ Rate of means (on the basis of standard list) used for dissemination purposes;
‐ A detailed description of one print and one web‐based publication;
‐ Measures taken to improve accessibility and clarity.
Comparability
Comparability aims at measuring the impact of differences on applied statistical concepts and definitions regarding comparisons of statistical data across geographic regions, non‐geographic domains or even over time. The factors which may cause the lack of comparability between two statistical data can be grouped into two main categories: concepts of survey, and measurement/assessment methodologies.
The following types of comparability can be used:
‐ Comparability across regions
‐ Comparability over time
‐ Comparability across other statistical domains
Standard quality report should include the following comparability items:
‐ Length of time series;
‐ Series breaks and reasons;
‐ Possible reasons for the lack of comparability with outputs in other countries;
‐ Description of procedures for seasonal adjustments.
Coherence

Zelenih beretki 71000 Sarajevo Telephone: (033) 22 06 26; faks: (033) 22 06 26; e‐mail: [email protected]; www.bhas.ba
27 QUALITY REPORT – Methodological Guidelines
The coherence of statistical data is the possibility for reliable various combinations, for various uses.
When data are generated from different sources, i.e. from surveys of different nature or frequency, statistical data may not be fully coherent as they may be based on different approaches, classifications and methodological standards. The following types of coherence are of special importance:
‐ Coherence between first and final statistical data ‐ Coherence between annual and short‐term statistical data ‐ Comparability of statistical data with National Accounts.
Standard quality report should include the following coherence items:
‐ Coherence between first and final results; ‐ Explanation of major discrepancies between first and final results; ‐ Description of a reference source of comparable data; ‐ Coherence with comparable data from the reference source; ‐ Explanation of major discrepancies among data from the reference source.
Zelenih beretki 71000 Sarajevo Telephone: (033) 22 06 26; faks: (033) 22 06 26; e-mail: [email protected]; www.bhas.ba
28 QUALITY REPORT – Methodological Guidelines
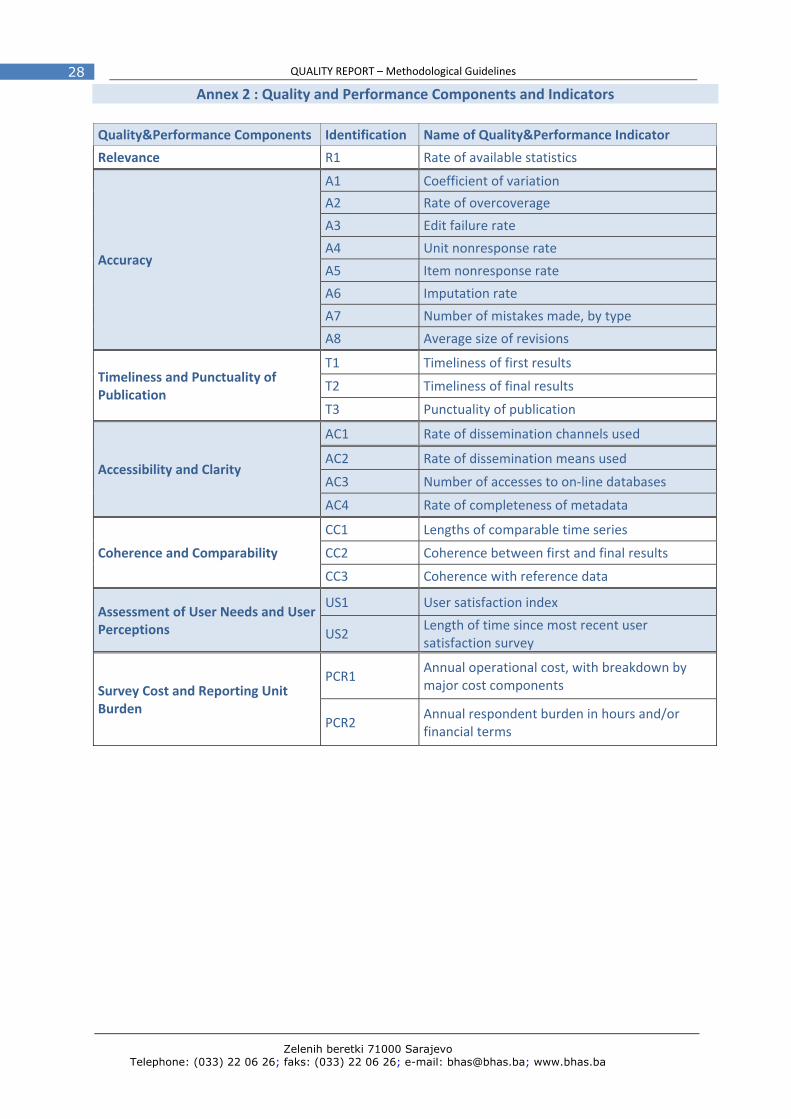
Annex 2 : Quality and Performance Components and Indicators Quality&Performance Components Identification Name of Quality&Performance Indicator
Relevance R1 Rate of available statistics
Accuracy
A1 Coefficient of variation
A2 Rate of overcoverage
A3 Edit failure rate
A4 Unit nonresponse rate
A5 Item nonresponse rate
A6 Imputation rate
A7 Number of mistakes made, by type
A8 Average size of revisions
Timeliness and Punctuality of Publication
T1 Timeliness of first results
T2 Timeliness of final results
T3 Punctuality of publication
Accessibility and Clarity
AC1 Rate of dissemination channels used
AC2 Rate of dissemination means used
AC3 Number of accesses to on‐line databases
AC4 Rate of completeness of metadata
Coherence and Comparability
CC1 Lengths of comparable time series
CC2 Coherence between first and final results
CC3 Coherence with reference data
Assessment of User Needs and User Perceptions
US1 User satisfaction index
US2 Length of time since most recent user satisfaction survey
Survey Cost and Reporting Unit Burden
PCR1 Annual operational cost, with breakdown by major cost components
PCR2 Annual respondent burden in hours and/or financial terms
Zelenih beretki 71000 Sarajevo Telephone: (033) 22 06 26; faks: (033) 22 06 26; e‐mail: [email protected]; www.bhas.ba
29 QUALITY REPORT – Methodological Guidelines
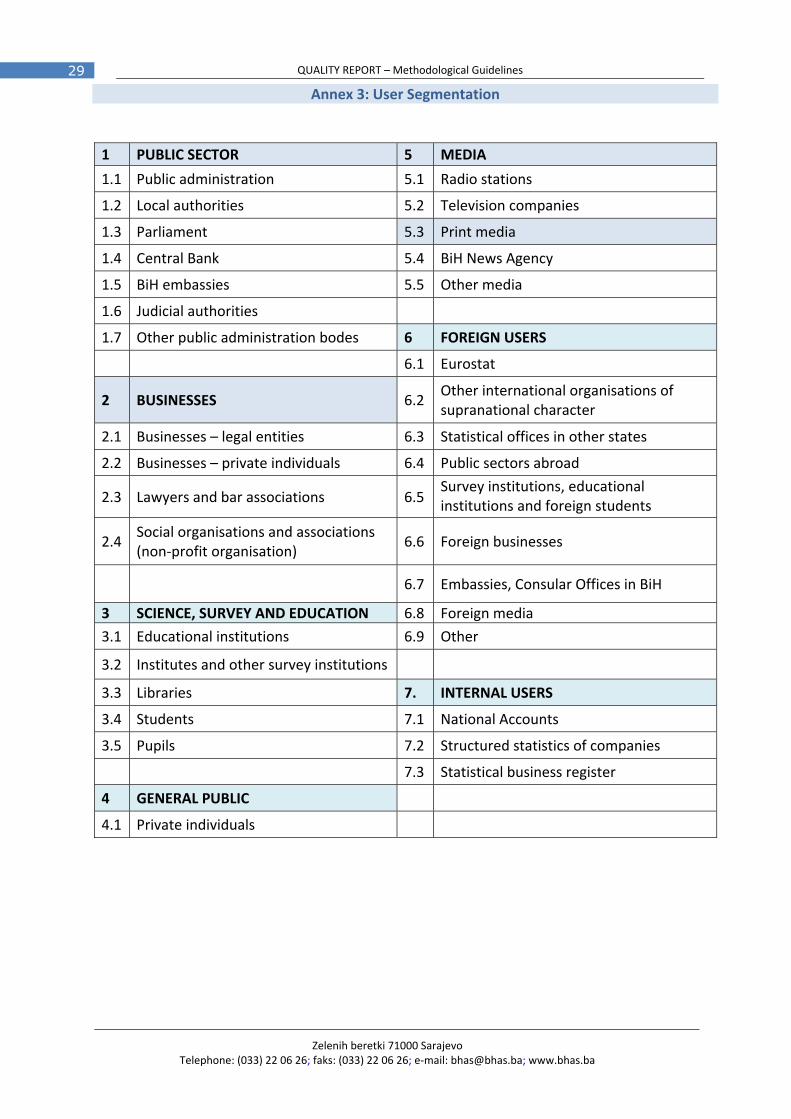
Annex 3: User Segmentation 1 PUBLIC SECTOR 5 MEDIA
1.1 Public administration 5.1 Radio stations
1.2 Local authorities 5.2 Television companies
1.3 Parliament 5.3 Print media
1.4 Central Bank 5.4 BiH News Agency
1.5 BiH embassies 5.5 Other media
1.6 Judicial authorities
1.7 Other public administration bodes 6 FOREIGN USERS
6.1 Eurostat
2 BUSINESSES 6.2 Other international organisations of supranational character
2.1 Businesses – legal entities 6.3 Statistical offices in other states
2.2 Businesses – private individuals 6.4 Public sectors abroad
2.3 Lawyers and bar associations 6.5 Survey institutions, educational institutions and foreign students
2.4 Social organisations and associations (non‐profit organisation)
6.6 Foreign businesses
6.7 Embassies, Consular Offices in BiH
3 SCIENCE, SURVEY AND EDUCATION 6.8 Foreign media
3.1 Educational institutions 6.9 Other
3.2 Institutes and other survey institutions
3.3 Libraries 7. INTERNAL USERS
3.4 Students 7.1 National Accounts
3.5 Pupils 7.2 Structured statistics of companies
7.3 Statistical business register
4 GENERAL PUBLIC
4.1 Private individuals