quality risk management understanding and control …ijpsi.org/papers/vol4(1)/e041029041.pdf ·...
TRANSCRIPT

International Journal of Pharmaceutical Science Invention
ISSN (Online): 2319 – 6718, ISSN (Print): 2319 – 670X
www.ijpsi.org || Volume 4 Issue 1|| January 2015 || PP.29-41
www.ijpsi.org 29 | Page
Quality Risk Management –Understanding and Control the Risk
in Pharmaceutical Manufacturing Industry
Joymalya Bhattacharya, M.Pharm (Pharmaceutics), MBA (HRM),
M.Phil (Management)
Senior Chemist, Albert David Limited.5/11,D.Gupta lane, Kolkata-700 050, India
ABSTRACT: The risk management program consists of four major components: risk assessment, risk control,
risk review, and risk communication. All four components are essential. All the above methods should address
the mentioned four basic components. Team selection and method selection are also plays a vital role in the risk
management process, so care should be taken while selection of risk management team and method.
FMEA is the preferable method for risk management in the pharmaceutical industry as FMEA analysis include
higher reliability, better quality, increased safety and its contribution towards cost saving includes decreased
development time and reduced waste and non value added operations.
KEYWORDS: Risk management program, Failure modes and effects analysis (FMEA), Pharmaceutical
industry
I. INTRODUCTION OF QUALITY RISK MANAGEMENT In earlier days risk in the product quality and process had been assessed in the following informal ways.
Trends review
Check lists
Flow charts
Observations compilation [From complaints, deviations etc.]
Changes review
Now the risk management approach initiated by regulatory agencies with recognized management tools along
with support of statistical tools in combination, which make easy for application of quality risk management
principles across the industry.
A Risk Management Program starts with identifying the possible risks associated with a product or with the
process used to develop, manufacture, and distribute the product. An effective quality risk management ensures
the high quality of drug product to the patient. In addition quality risk management improves decision making if
a quality problem arises. It should include systemic processes designated to co-ordinate, facilitate and improve
science-based decision-making with respect to risk.
The FDA’s Initiative on Risk Management Approach
The FDA defines a Risk Management as, ―a strategic safety program designed to decrease product risk by using
one or more interventions or tools.‖ The FDA proposes that: ―…the sponsor of every product submitted for
approval considers how to minimize risks from the product’s use. Risk management planning generally
encompasses all efforts by a sponsor to minimize the risk from its product’s use and may include product
labeling, risk assessment, pharmacovigilance, and special studies or interventions.‖
The FDA expects the Risk management to follow a basic process of:
1. Learning about and interpreting a product’s benefits and risks,
2. Designing and implementing interventions to minimize a product’s risks,
3. Evaluating interventions in light of new knowledge that is acquired over time, and
4. Revising interventions when appropriate.
FDA Guideline Risk Management Elements
Learning about and interpreting a products
benefits and risks
Risk and Issue Management Strategy, Risk Identification
Technique, Risk Evaluation Technique.
Designing and Implementing Interventions Risk Response Planning, Risk and Issue Management Plan
Evaluating and Revising Interventions Risk and Issue Management Plan

Quality Risk Management –Understanding…
www.ijpsi.org 30 | Page
Risk Management Methods
To make risk-based decisions, a systematic approach is essential. The ICH Q9 guideline, Quality Risk
Management, provides a structure to initiate and follow a risk management process. The following methods
widely used in the industry for risk management.
Basic risk management facilitation methods (flowcharts, check sheets, etc.)
Failure Mode Effects Analysis (FMEA)
Failure Mode, Effects, and Criticality Analysis (FMECA)
Fault Tree Analysis (FTA)
Hazard Analysis and Critical Control Points (HACCP)
Hazard Operability Analysis (HAZOP)
Preliminary Hazard Analysis (PHA)
Risk ranking and filtering
Supporting statistical tools
No Method Area of Application
1
Basic risk management methods. Flow
charts/Process mapping, Check lists,
Cause & Effect diagrams
Data organization to facilitate decision making in the areas of
1.Failure investigations 2.Root cause analysis
2 Failure Mode Effects Analysis (FMEA) Equipments and facilities which are involved in the manufacturing.
3 Failure Mode, Effects, and Criticality
Analysis (FMECA) Risks associated with manufacturing process.
4 Fault Tree Analysis (FTA) Root cause analysis and failure investigations
5 Hazard Analysis and Critical Control
Points (HACCP)
Monitoring of critical points not only in the manufacturing process
but also in other lifecycle phases.
6 Hazard Operability Analysis (HAZOP) Manufacturing processes, evaluating process safety hazards.
7 Preliminary Hazard Analysis (PHA) Analyzing existing systems or prioritizing hazards and commonly
used early in the development.
8 Risk ranking and filtering
Prioritize manufacturing sites for inspection/audit by Regulators or
industry, to evaluate both quantitatively-assessed and qualitatively-
assessed risks within the same organizational framework.
9 Supporting Statistical Tools Data assessment.
II. QUALITY RISK MANAGEMENT PROCESS
Figure 1. Overview of a typical quality risk management process. Taken from reference 6: ICH Q9:
Quality Risk Management.

Quality Risk Management –Understanding…
www.ijpsi.org 31 | Page
QRM PROCESS 1. Initiating a QRM process: QRM activities should be performed using systematic processes designed to
coordinate, facilitate and improve science-based decision-making with respect to risk. Possible steps used to
initiate and plan a QRM process might include the following (Ref. ICH Q9):
• define the problem and/or risk question, including pertinent assumptions identifying the potential for risk;
• assemble background information and/or data on the potential hazard, harm or human health impact relevant to
the risk assessment;
• identify a leader and necessary resources; and
• specify a timeline, deliverables and appropriate level of decision-making for the risk management process.
2. Personnel involved in QRM: The implementing party, i.e. pharmaceutical manufacturer or regulatory
authority, should assure that personnel with appropriate product-specific knowledge and expertise are available
to ensure effective planning and completion of QRM activities. The personnel should be able to:
(a) Conduct a risk analysis.
(b) Identify and analyze potential risks.
(c) identify, evaluate risks and determine which ones should be controlled and which ones can be accepted;
(d) Recommend and implement adequate risk control measures.
(e) Devise procedures for risk review, monitoring and verification.
3. Knowledge of the product and process: Any activity of QRM would need to be based on knowledge of the
product or processes concerned, according to the stage of the product life-cycle. Where necessary, a flow
diagram may be helpful, covering all operations and controls in the process under evaluation. When applying
QRM to a given operation, the steps preceding and following that operation should also be considered. A block-
type diagram may be sufficiently descriptive. Amendments to the flow diagram may be made where appropriate,
and should be documented.
4. Risk assessment: When risk assessment is conducted safety and efficacy need to be considered in addition to
the quality concerns. During the assessment all the risks that may be reasonably expected to occur in the
activity under evaluation should be listed. This is usually applied during its initiation when there is a change or a
concern and may also be applied to existing processes. An analysis should be conducted to identify which risks
are of such a nature that their elimination or reduction to acceptable levels is essential. A thorough risk analysis
is required to ensure an effective risk control. It should review the materials, activities, equipment, storage,
distribution and intended use of the product. Typically a list of the potential risks (biological, chemical and
physical) which may be introduced, increased or controlled in each step should be drawn up. In the risk analysis
the following basic questions should be addressed:
What is the nature of possible risks?
What is the probability of their occurrence and how easy is it to detect them?
What are the consequences (the severity)?
It should then be decided which potential risks should be addressed by the QRM activities and what control
measures, if any, should be implemented for each risk. If a risk has been identified at a step where control is
necessary for safety, and no control measure exists at that step or at any other, the product or process should be
modified at that step, or at an earlier or later stage, to include such a control measure. More than one control
measure may be required to control a specific risk and more than one risk may be controlled by a specified
control measure. Risk assessment can be facilitated by the use of a decision-tree, which facilitates a logical
approach. The way that a decision-tree is used will depend on the operation concerned.
Normally, potential risks in relation to the following should be considered:
– Materials and ingredients;
– physical characteristics and composition of the product;
– processing procedures;
– microbial limits, where applicable;
– premises;
– equipment;
– packaging;
– sanitation and hygiene;
– personnel – human error;
– utilities;

Quality Risk Management –Understanding…
www.ijpsi.org 32 | Page
5. Risk control: Risk control is a decision-making activity designed to reduce and/or accept risks. It usually occurs
after risk assessment, and at a fundamental level its purpose is to reduce the risk to an acceptable level. During risk
control activities the following key questions should be asked:
What can be done to reduce or eliminate risks?
What is the appropriate balance among benefits, risks and resources?
Are new risks introduced as a result of the identified risks being controlled?
Risk control activities usually involve identifying controls and measures which may reduce or control the risk
associated with a failure mode or negative event. Risk control activities can serve to determine critical process
parameters for certain controls, how they will be monitored, and the level of qualification and validation which
may be required, if any, for such controls.
6. Risk review: Appropriate systems should be in place to ensure that the output of the QRM process is periodically
monitored and reviewed, as appropriate, to assess new information that may impact on the original QRM decision.
Examples of such changes include changes to control systems, changes to equipment and processes, changes in
suppliers or contractors and organizational restructuring. Monitoring is the scheduled measurement or observation of
a specific risk control measure relative to its acceptance limits. Monitoring should be recorded. All records and
documents associated with risk review should be signed and dated by the person(s) carrying out the review and by a
responsible official(s) of the quality unit of the company.
III QUALITY RISK MANAGEMENT METHODS AND TOOLS
Basic risk management facilitation methods:
The simple technique used to structure risk management by organizing data and facilitating decision-making are
flow charts, check sheet, process mapping, cause and effect diagrams.
Failure Mode Effects Analysis (FMEA):
FMEA depends on product and process understanding. It methodically breaks down the analysis of complex
processes into manageable steps. It provides evaluation of potential failure modes for processes and their likely
effect on product performance. It can be applied to equipment and facilities and might be used to analyze a
manufacturing operation and its effect on product or process. This tool is further advanced with studying
criticality of the consequences and providing clear indication of situation. The purpose, terminology and other
details can vary according to type ( e.g. Process FMEA, Design FMEA, Health FEMA etc.), the basic
methodology is similar for all.
Benefits of FMEA : Some benefits of performing FMEA analysis include higher reliability, better quality,
increased safety and its contribution towards cost saving includes decreased development time and reduced
waste and non value added operations. Cost benefits associated with FMEA are usually expected to come from
the ability to identify failure modes earlier in the process, when they are less expensive to address. Financial
benefits are also derived from the design improvements that FMEA is expected to facilitate, including reduced
warranty costs, increased sales through enhanced customer satisfaction, etc.
This provides a learning tool for new engineers and meets customer requirement and/or to comply with Safety
and Quality requirements, such as ISO 9001, QS 9000, ISO/TS 16949, Six Sigma, FDA Good Manufacturing
Practices (GMPs), Process Safety Management Act (PSM)
Ideally, FMEA is best done in conjunction with or soon after PHA efforts. Results can be used to identify high-
vulnerability elements and to guide resource deployment for best benefit. An FMEA can be done anytime in the
system lifetime, from initial design onward.
Figure 2. Example of FMEA detection

Quality Risk Management –Understanding…
www.ijpsi.org 33 | Page
Failure Mode, Effects and Criticality Analysis (FMECA):
It is the extension of earlier said FMEA tool. Extending FEMA to incorporate an investigation of the degree of
severity of consequences, their probabilities of occurrence and their detectability is Failure mode, effects and
criticality analysis. 2
In FMECA, each failure mode of the product is identified and then evaluated for criticality.
This criticality is then translated into a risk, and if this level of risk is not acceptable, corrective action must be
taken. This can be utilized for failure and risk associated with manufacturing processes. The tool can also be
used to establish and optimize maintenance plans for repairable systems and/or contribute to control plans and
other quality assurance procedures. In addition, an FMEA or FMECA is often required to comply with safety
and quality requirements, such as ISO 9001, QS 9000, ISO/TS 16949, Six Sigma, FDA Good Manufacturing
Practices (GMPs), Process Safety Management Act (PSM), etc. When we perform a FMECA, we are identifying
all potential failure modes and their associated effects. To make this task more manageable, we must first decide
what type of FMECA we want to perform - Design, Process, User, Software, Test, to name a few.
Severity classification
This classification is assigned to provide a qualitative measure of the worst potential consequences resulting
from design error or item failure. Classifications should be assigned to each identified failure mode and each
item analyzed in accordance with the loss statements below. It may not be possible to identify an item or a
failure mode according to the loss statements in the four categories below, but similar loss statements based on
various inputs and outputs can be developed and included in the ground rules for the FMECA activity. Severity
classification categories that are consistent with are defined as follows:
Category I–Catastrophic—A failure that may cause injury or death.
Category II–Critical—A failure which may cause severe injury, major property damage, or major system
damage that will result in major downtime or production loss.
Category III–Marginal—A failure which may cause minor injury, minor property damage, or minor system
damage which will result in delay or loss of system availability or degradation.
Category IV–Minor—A failure not serious enough to cause injury, property damage or system damage, but
will result in unscheduled maintenance or repair. 13
FMECA's are similar to FTA's. The big difference is an FTA starts with one specific failure effec t and then
identifies only those failure modes that can cause the particular effect, whereas a FMECA is trying to
identifying all possible failure modes of a product and the effects of these failure modes.
Fault tree analysis (FTA):
This tool assumes failure of the functionality of a product or process. The results are represented pictorially in
the form of a tree of fault modes. This can be used to investigate complaints or deviation in order to fully
understand their root cause and ensure that intended improvement will resolve the issues and not cause any other
different problem. 1
A good Hazard Analysis and critical control points (HACCP):
HACCP is a systematic, proactive and preventive tool for assuring quality, reliability and safety. It involves
hazard analysis, determining critical control point, establishing critical limit, establishing a system to monitor
critical control point and establishing a record keeping system. This might be used to identify and manage risk
associated with physical, chemical and biological hazards.
Figure 3. Example of Fault tree analysis
Quality Risk Management –Understanding…
www.ijpsi.org 34 | Page
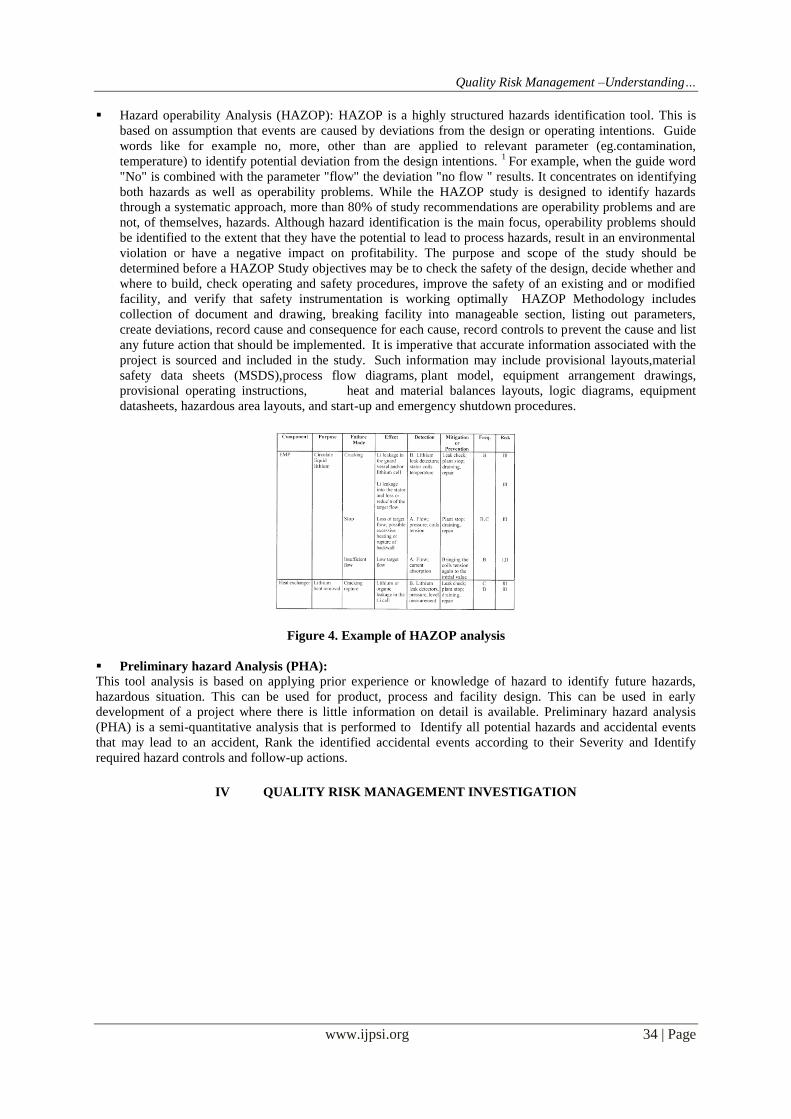
Hazard operability Analysis (HAZOP): HAZOP is a highly structured hazards identification tool. This is
based on assumption that events are caused by deviations from the design or operating intentions. Guide
words like for example no, more, other than are applied to relevant parameter (eg.contamination,
temperature) to identify potential deviation from the design intentions. 1
For example, when the guide word
"No" is combined with the parameter "flow" the deviation "no flow " results. It concentrates on identifying
both hazards as well as operability problems. While the HAZOP study is designed to identify hazards
through a systematic approach, more than 80% of study recommendations are operability problems and are
not, of themselves, hazards. Although hazard identification is the main focus, operability problems should
be identified to the extent that they have the potential to lead to process hazards, result in an environmental
violation or have a negative impact on profitability. The purpose and scope of the study should be
determined before a HAZOP Study objectives may be to check the safety of the design, decide whether and
where to build, check operating and safety procedures, improve the safety of an existing and or modified
facility, and verify that safety instrumentation is working optimally HAZOP Methodology includes
collection of document and drawing, breaking facility into manageable section, listing out parameters,
create deviations, record cause and consequence for each cause, record controls to prevent the cause and list
any future action that should be implemented. It is imperative that accurate information associated with the
project is sourced and included in the study. Such information may include provisional layouts,material
safety data sheets (MSDS),process flow diagrams, plant model, equipment arrangement drawings,
provisional operating instructions, heat and material balances layouts, logic diagrams, equipment
datasheets, hazardous area layouts, and start-up and emergency shutdown procedures.
Figure 4. Example of HAZOP analysis
Preliminary hazard Analysis (PHA):
This tool analysis is based on applying prior experience or knowledge of hazard to identify future hazards,
hazardous situation. This can be used for product, process and facility design. This can be used in early
development of a project where there is little information on detail is available. Preliminary hazard analysis
(PHA) is a semi-quantitative analysis that is performed to Identify all potential hazards and accidental events
that may lead to an accident, Rank the identified accidental events according to their Severity and Identify
required hazard controls and follow-up actions.
IV QUALITY RISK MANAGEMENT INVESTIGATION

Quality Risk Management –Understanding…
www.ijpsi.org 35 | Page

Quality Risk Management –Understanding…
www.ijpsi.org 36 | Page
Investigation Parameters
V. QRM IN PHARMACEUTICAL PRODUCTION
QRM principles applied as a process supports science-based and practical decisions when integrated into
commercial manufacturing. In general implementing QRM should not obviate a manufacturer’s obligation to
comply with regulatory expectations (e.g. regulatory requirements, regulatory filings, inspection commitments,
etc.). All QRM activities should be structured in a way that allows escalation of risks to the appropriate
management level within the organization. Special focus can be on the risk assessment and risk control of, e.g.:
product quality risks;
adverse impact to patient health based on product quality defects;
product supply interruption to patients;
GMP and regulatory compliance risks;
multisite risks;
multiproduct risks;
Parameters Causes
Material A non-conformance deviation where the testing and specifications are valid.
Method A deviation caused by method or procedure not yielding the specified result, including those due to inadequate
equipment or procedure validation/qualification (equipment or procedures found inadequate or unsuitable for its
intended use), inadequate test method validation, or the establishment of specifications without adequate supporting data.
Document This category is reserved for "Trial Use" documents (changes to approved documents) that are used in place of
approved procedures.
Operator A deviation caused by an error made by a Company employee or caused by insufficient training.
Operator Action –Inattention to Detail
–Verbal or Written Communication Problem
–Operator Monitoring Multiple Processes Operator Training:
–Not Trained on Procedure
–Not Trained on Current Version of Procedure –Insufficient Practice or Experience
–Inadequate Content in Training
Equipment A deviation caused by equipment, system or utility failure.
Equipment Failure –Calibration Not Current
–Multiple Work Order(s) Addressing Same Issue Didn’t Correct Problem –Preventive Maintenance Not Current
–Out of Tolerance
–Equipment Not Operated According to Validated Procedure –Defective Part
–Improper Part
–No IQ/OQ or Inadequate IQ/OQ –Electrical Power Failure or Surge
–Computer system failure
Environment A deviation caused by an air, surface, or water monitoring result (including HVAC operating specifications) that
exceeds alert or actions levels.
Schedule A deviation caused by deviations from established schedules or testing plans. Established schedules include environmental monitoring, preventive maintenance, and calibration programs. Deviations from testing plans include
the use of a material before release testing is completed.
Vendor A deviation caused by the performance of a vendor (not including supplying materials that do not meet their specifications). Examples include changes to vendor documentation (vendor/catalog part number or certification), in
packaging that is not communicated to Company prior to production, missing vendor documentation, and shipment errors. Contract test lab errors are included in this category.
Administrative Management System
–Inadequate Administrative Control
–Work Organization / Planning Deficiency –Inadequate Supervision
–Improper Resource Allocation
–Information Not Adequately Defined, Disseminated or Enforced
Other Where the cause cannot be determined or more appropriately belongs in separate category not listed.

Quality Risk Management –Understanding…
www.ijpsi.org 37 | Page
new facility and changes to existing facility, e.g. start-ups, new commercial manufacturing processes,
technology transfers and product discontinuation.
After completion of the risk assessment and risk control activities the outcomes must be summarized and
communicated. The results may be documented in a new or existing report or they may be included as part of
another document approved by appropriate decision-makers (e.g. site or functional management, system owner,
quality unit, etc.). A risk review is important if new risks or changes to existing risk levels are identified through
planned or unplanned events such as routine operation, changes, complaints, product returns,
discrepancies/deviations, data monitoring, trends, inspections/audits, changes in regulatory environment, etc.
Risk review may also include evaluation of, e.g.:
effectiveness of risk control activities and actions;
changes in observed risk levels or existing controls.
In principal there are two focuses when implementing QRM in commercial manufacturing: a system focus and a
product focus.
QRM integration with key quality system elements
Effective QRM can facilitate the ―What to do?‖ and, therefore, support better and more informed decisions.
QRM should be integrated into existing quality system elements and related business processes and documented
appropriately. Situations in which the use of the QRM process might provide information are beneficial in a
variety of operations, e.g.:
integrated quality management: documentation; training and education; quality defects;
auditing/inspection; change management/change control (includes equipment, facilities, utilities, control
and IT systems); continual improvement/corrective and preventi e actions (CAPA);
facilities, equipment and utilities: e.g. design; qualification; maintenance and decommissioning of
facility/equipment; hygiene aspects; cleaning of equipment and environmental control;
calibration/preventive maintenance; computer systems and computer-controlled equipment;
supplier, materials and contract service management: e.g. assessment and evaluation of suppliers and
contract manufacturers; starting material; use of materials; storage; logistics and distribution conditions;
technology transfer: e.g. from development to manufacturing; during commercial manufacturing
between sites; from commercial manufacturing to product discontinuation.
VI. CLASS IDENTIFICATION IN QRM The output of a risk assessment may be a combination of quantitative and qualitative estimation of risk.
As part of FMEA, a risk score or ―Risk Prioritization Number or RPN” may be assigned to the deviation or to
the stage of the process that is affected; this helps to categorize the deviation. RPN is calculated by multiplying
Probability (P), Detectability (D) and Severity (S), which are individually categorized and scored.The Risk
Priority Number (RPN) methodology is a technique for analyzing the risk associated with potential problems
identified during a Failure Mode and Effects Analysis (FMEA). This article presents a brief overview of the
basic RPN method and then examines some additional and alternative ways to use RPN ratings to evaluate the
risk associated with a product or process design and to prioritize problems for corrective action.
Overview of Risk Priority Numbers An FMEA can be performed to identify the potential failure modes for a product or process. The RPN method
then requires the analysis team to use past experience and engineering judgment to rate each potential problem
according to three rating scales:
Severity, which rates the severity of the potential effect of the failure.
Occurrence, which rates the likelihood that the failure will occur.
Detection, which rates the likelihood that the problem will be detected before it reaches the end-
user/customer.
Rating scales usually range from 1 to 5 or from 1 to 10, with the higher number representing the higher
seriousness or risk. For example, on a ten point Occurrence scale, 10 indicates that the failure is very likely to
occur and is worse than 1, which indicates that the failure is very unlikely to occur. The specific rating
descriptions and criteria are defined by the organization or the analysis team to fit the products or processes that
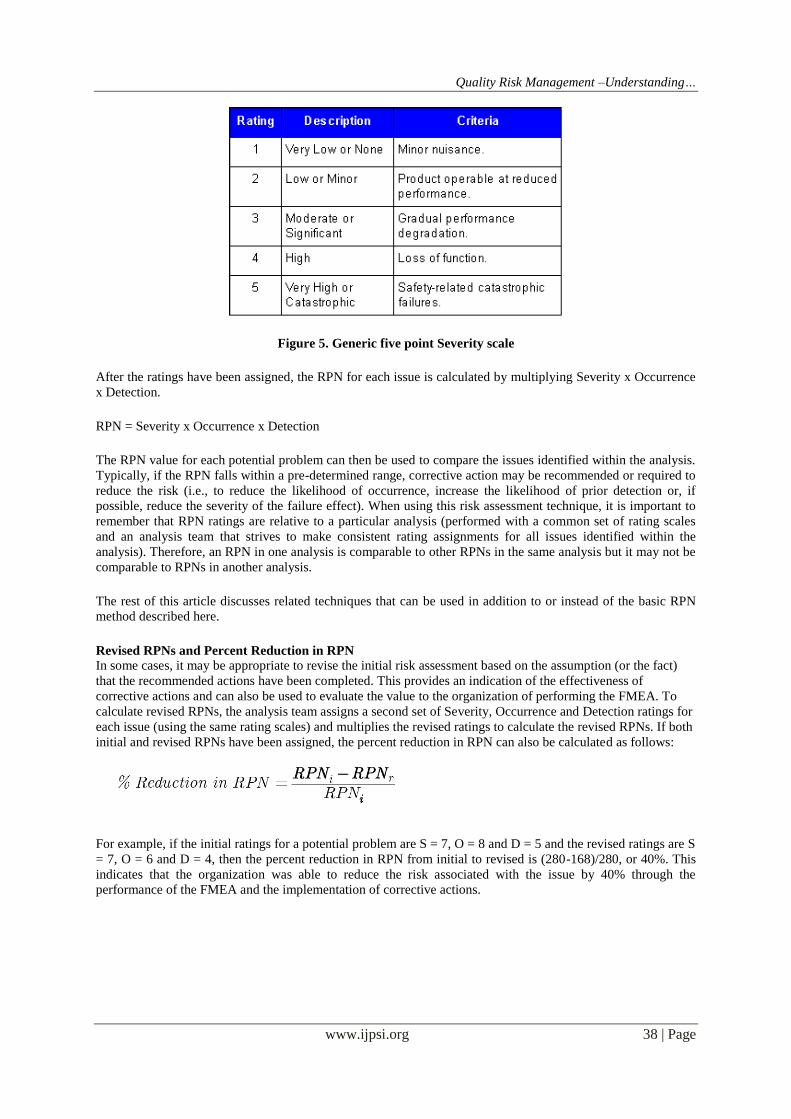
are being analyzed. As an example, Figure 1 shows a generic five point scale for Severity
Quality Risk Management –Understanding…
www.ijpsi.org 38 | Page
Figure 5. Generic five point Severity scale
After the ratings have been assigned, the RPN for each issue is calculated by multiplying Severity x Occurrence
x Detection.
RPN = Severity x Occurrence x Detection
The RPN value for each potential problem can then be used to compare the issues identified within the analysis.
Typically, if the RPN falls within a pre-determined range, corrective action may be recommended or required to
reduce the risk (i.e., to reduce the likelihood of occurrence, increase the likelihood of prior detection or, if
possible, reduce the severity of the failure effect). When using this risk assessment technique, it is important to
remember that RPN ratings are relative to a particular analysis (performed with a common set of rating scales
and an analysis team that strives to make consistent rating assignments for all issues identified within the
analysis). Therefore, an RPN in one analysis is comparable to other RPNs in the same analysis but it may not be
comparable to RPNs in another analysis.
The rest of this article discusses related techniques that can be used in addition to or instead of the basic RPN
method described here.
Revised RPNs and Percent Reduction in RPN In some cases, it may be appropriate to revise the initial risk assessment based on the assumption (or the fact)
that the recommended actions have been completed. This provides an indication of the effectiveness of
corrective actions and can also be used to evaluate the value to the organization of performing the FMEA. To
calculate revised RPNs, the analysis team assigns a second set of Severity, Occurrence and Detection ratings for
each issue (using the same rating scales) and multiplies the revised ratings to calculate the revised RPNs. If both
initial and revised RPNs have been assigned, the percent reduction in RPN can also be calculated as follows:
For example, if the initial ratings for a potential problem are S = 7, O = 8 and D = 5 and the revised ratings are S
= 7, O = 6 and D = 4, then the percent reduction in RPN from initial to revised is (280-168)/280, or 40%. This
indicates that the organization was able to reduce the risk associated with the issue by 40% through the
performance of the FMEA and the implementation of corrective actions.

Quality Risk Management –Understanding…
www.ijpsi.org 39 | Page
Figure 6. Percent Reduction in RPN
Occurrence/Severity Matrix : Because the RPN is the product of three ratings, different circumstances can
produce similar or identical RPNs. For example, an RPN of 100 can occur when S = 10, O = 2 and D = 5; when
S = 1, O = 10 and D = 10; when S = 4, O = 5 and D = 5, etc. In addition, it may not be appropriate to give equal
weight to the three ratings that comprise the RPN. For example, an organization may consider issues with high
severity and/or high occurrence ratings to represent a higher risk than issues with high detection ratings.
Therefore, basing decisions solely on the RPN (considered in isolation) may result in inefficiency and/or
increased risk.
The Occurrence/Severity matrix provides an additional or alternative way to use the rating scales to prioritize
potential problems. This matrix displays the Occurrence scale vertically and the Severity scale horizontally. The
points represent potential causes of failure and they are marked at the location where the Severity and
Occurrence ratings intersect. The analysis team can then establish boundaries on the matrix to identify high,
medium and low priorities. Figure 6 displays a matrix chart. In this example, the Occurrence and Detection
ratings were set based on a ten point scale, the high priority issues are identified with a red triangle (up), the
medium priority issues are identified with a yellow circle and the low priority issues are identified with a green
triangle (down). Within the software, when the user clicks a point in the matrix, the description of the potential
problem is displayed. For presentation in other documents, a text legend can be used to accompany the matrix
graphic.
Figure 7. Occurrence/Severity Matrix
Rank Issues by Severity, Occurrence or Detection : Ranking issues according to their individual Severity,
Occurrence or Detection ratings is another way to analyze potential problems. For example, the organization
may determine that corrective action is required for any issue with an RPN that falls within a specified range

Quality Risk Management –Understanding…
www.ijpsi.org 40 | Page
and also for any issue with a high severity rating. In this case, a potential problem may have an RPN of 40
(Severity = 10, Occurrence = 2 and Detection = 2). This may not be high enough to trigger corrective action
based on RPN but the analysis team may decide to initiate a corrective action anyway because of the very high
severity of the potential effect of the failure.
Figure 7 presents a graphical view of failure causes ranked by likelihood of occurrence in a pareto (bar) chart.
This chart provides the ability to click a bar to display the issue description and to generate a detailed legend for
print-ready output. Xfmea also provides this information in a print-ready tabular format and generates similar
charts and reports for Severity and Detection ratings.
Figure 8. Charts of causes ranked by Occurrence rating generated with Xfmea.
Risk Ranking Tables In addition to, or instead of, the other risk assessment tools described here, the organization may choose to
develop risk ranking tables to assist the decision-making process. These tables will typically identify whether
corrective action is required based on some combination of Severity, Occurrence, Detection and/or RPN values.
As an example, the table in Figure 4 places Severity horizontally and Occurrence vertically
Figure 9. Sample risk ranking table
The letters and numbers inside the table indicate whether a corrective action is required for each case.
N = No corrective action needed.
C = Corrective action needed.
# = Corrective action needed if the Detection rating is equal to or greater than the given number.

Quality Risk Management –Understanding…
www.ijpsi.org 41 | Page
For example, according to the risk ranking table in Figure 4, if Severity = 6 and Occurrence = 5, then corrective
action is required if Detection = 4 or higher. If Severity = 9 or 10, then corrective action is always required. If
Occurrence = 1 and Severity = 8 or lower, then corrective action is never required, and so on.
Other variations of this decision-making table are possible and the appropriate table will be determined by the
organization or analysis team based on the characteristics of the product or process being analyzed and other
organizational factors, such as budget, customer requirements, applicable legal regulations, etc.
Higher Level RPNs Finally, it may be desirable to assign RPNs at higher levels in the analysis based on the RPNs calculated for the
causes of failure. For example, Item RPNs might be useful as a way to compare components to determine
priority for corrective action or to determine which component will be selected for inclusion in the design. The
higher level RPN can be calculated by obtaining the sum of all RPNs for all associated causes of failure. For
example, to calculate the Item RPN, it is necessary to calculate the RPNs for each cause associated with the item
and then to obtain the sum of those RPNs, as shown:
VII. CONCLUSION The risk management program consists of four major components: risk assessment, risk control, risk
review, and risk communication. All four components are essential. All the above methods should address the
mentioned four basic components. Team selection and method selection are also plays a vital role in the risk
management process, so care should be taken while selection of risk management team and method.
FMEA is the preferable method for risk management in the pharmaceutical industry as FMEA analysis include
higher reliability, better quality, increased safety and its contribution towards cost saving includes decreased
development time and reduced waste and non value added operations.
Potential Areas for Risk Management Application
The following areas are identified as potential in the pharmaceutical industry for quality risk management
application.
1. Documentation [SOPs, Batch records etc.]
2. Training [Schedules and effectiveness]
3. Quality defects [Complaints, deviations, OOS etc.]
4. Audits [Compliance]
5. Periodic reviews [Revalidation assessment]
6. Change controls [Impact assessment]
7. Development reports [Process and controls verification]
8. Facilities, Equipment and Utilities [Components, maintenance etc.]
9. Material management [Receipt, storage and distribution]
10. Packaging and labeling [Container closure system and labeling]
REFERENCES [1] FDA News – GMPs for the 21st Century; M Anisfeld; Industrial Pharmacy, Dec 2004, I4, P20.
ICH Harmonised Tripartite Guideline. ICH Q8(R2): Pharmaceutical Development.
August 2008; http://www.ich.org. [2] ICH Harmonised Tripartite Guideline. ICH Q9: Quality Risk Management
June 2006; http://www.ich.org.
[3] EU GMP Requirements – Quality Systems; Boedecker B, Germany; Presentation 20-21 Oct 2009, Ankara, Turkey Ministry of Health. [4] WHO guidelines on quality system requirements for national GMP inspectorates:
http://www.who.int/medicines/areas/quality_safety/quality_assurance/inspections/en/index.html