quanta1 measurement and analysis methods …web.as.uky.edu/biology/faculty/cooper/lab quantal...
TRANSCRIPT
Journal of Neuroscience Methods 61 (1995) 67-78
Quanta1 measurement and analysis methods compared for crayfish and Drosophila neuromuscular junctions, and rat hippocampus
R.L. Cooper, B.A. Stewart, J.M. Wojtowicz, S. Wang, H.L. Atwood * Department of Physiology, University of Toronto, Toronto, Ontario M5.Y lA8, Canada
Received 15 July 1994; accepted 21 January 1995
Abstract
Quanta1 content of transmission was estimated for three synaptic systems (crayfish and Drosophila neuromuscular junctions, and rat dentate gyrus neurons) with three different methods of measurement: direct counts of released quanta, amplitude measurements of evoked and spontaneous events, and charge measurements of evoked and spontaneous events. At the crayfish neuromuscular junction, comparison of the three methods showed that estimates from charge measurements were closer to estimates from direct counts, since amplitude measurements were more seriously affected by variable latency in evoked release of quanta1 units. Thus, charge measurements are better for estimating quanta1 content when direct counts cannot be made, as in crayfish at high frequency of stimulation or in the dentate gyrus neurons. At the Drosophila neuromuscular junction, there is almost no latency variation of quanta1 release in realistic physiological solutions, and the methods based upon amplitudes and charge give similar results. Distributions of evoked synaptic quanta1 events obtained by direct counts at the crayfish neuromuscu- lar junction were compared to statistical distributions obtained by best fits. Binomial distributions with uniform or non-uniform probabilities of release generally provided good fits to the observations. From best fit distributions, the quanta1 parameters n (number of release sites) and p (their probability of release) can be calculated. We used two algorithms to estimate n and p: one allows for non-uniform probability of release and uses a modified chi-square (x2) criterion, and the second assumes uniform probability of release and derives parameters from maximum likelihood estimation (MLE). The bootstrap estimate of standard errors is used to determine the accuracy of n and p estimates.
Keywords: Dentate gyrus; Neuromuscular; Drosophila; Crayfish; Quanta]; Presynaptic
1. Introduction
The release of transmitter at the neuromuscular junction has been shown to be quanta1 in nature (de1 Castillo and Katz, 1954). At many other synapses, including those of mammalian central neurons, the basic principles of quanta1 transmission have been con- firmed (Redman, 1990; Hessler et al., 1993; Rosen- mund et al., 1993). Characterization of transmission, and its alteration by activity or neuromodulators, de- mands measurement of quanta1 content of transmission (the number of quanta1 units generated by a nerve impulse). This is more easily done in some systems than in others. In this paper, we examine some techni- cal problems encountered in measuring quanta1 con- tent in one of the more easily studied preparations, the
* Corresponding author. Tel.: (416) 978-8752; Fax: (416) 978-4940.
01650270/95/$09.50 @ 1995 Elsevier Science B.V. All rights reserved SSDI 0165-0270(95)00024-O
crayfish neuromuscular junction. We then determine the applicability and usefulness of the procedures em- ployed for the crayfish in two other synaptic systems of current interest: the neuromuscular junctions of Drosophila, and hippocampal synapses of the dentate gyrus in a mammalian brain slice preparation.
The most direct method for determining quanta1 content is to count the number of quanta released by the nerve impulse. This ,is feasible at the crayfish neuromuscular junction at low frequencies of stimula- tion. Such counts can then be used to estimate bino- mial parameters of transmitter release (Johnson and Wernig, 1971; Wernig, 1972; Smith et al., 1991). In many other preparations, it is not possible to resolve directly all the quanta1 units evoked by a nerve im- pulse, unless the preparation is altered experimentally to make this possible. For example, the frog neuromus- cular junction is commonly treated with bathing solu- tions containing high Mg2+ concentrations to reduce

6S R. L. Cooper er 01. /Journal of Neuroscience Methods 61 (1995) 67- 78
the number of quanta1 units released. This permits resolution of single evoked quanta1 events during low- frequency stimulation of the motor neuron, but in a physiologically abnormal preparation. Estimates of quanta1 content in a normal neuromuscular junction, in which more than a hundred quanta1 units may appear for each nerve impulse, require a calculation based upon amplitude or charge measurements of the evoked potential or current, and of the individual quanta1 units, which are often observed as spontaneous events. These are believed to be the same as the quanta1 elements constituting evoked release (de1 Castillo and Katz, 1954).
For mammalian central neurons, measurements of charge rather than amplitude have been preferred by some authors (Bekkers and Stevens, 1991). It has been pointed out that measurements of charge are less sub-
Muscle fiber
- Ev
u SP
ject to errors arising from variation in latency (Bekkers and Stevens, 19891, but still numerous reports are based upon the use of amplitude measurements (Malinow and Tsien, 1990; Redman, 1990; Larkman et al., 1991; Liao et al., 1992; Manabe et al., 19921.
The accuracy of the less direct methods of estimat- ing quanta1 release can be judged at the crayfish neuro- muscular junction, in which the results of these meth- ods can be compared with the results from direct quanta1 counts. For the two other preparations chosen for comparison, direct counts of evoked quanta cannot be made under physiologically ‘normal’ conditions; therefore, we assessed the utility of the two less direct methods for estimating quanta1 content. The advan- tages and disadvantages of the different methods are outlined for each preparation. Since the measurements of quanta1 release are the starting point for estimates
200 pA
5 ms
D 800
1 mean = 30.56 pA .
I I I I 1 I
0 400 600
Sweep number
Fig. 1. Quanta1 events in synaptic transmission at a single varicosity of a crayfish nerve terminal. A: recording method, with focal macro-patch electrude placed over an identified varicosity on nerve terminal of the crayfish opener muscle. A representative electrode placement and varicesity are also sketched in face view, to show complete inclusion of the varicosity within the lumen of the electrode; B: result for a sing& stimulus which released two quanta1 units of transmitter (arrows>. A test pulse for seal resistance of the recording electrode appears at the&d of the record. t? (1) Average of 500 single records to show the time of the peak response. (2) A single sweep of the series, showing evoked release (Ev) of 3 quanta (arrows), and 1 spontaneous event ( l 1. Measurements of charge (time-current integral) were made for the evoked (Ev) and for spontaneous events (Sp). D: a plot of amplitudes of all evoked responses in order of occurrence. A majority of stimuli produced no evoked release. The data were tested for stationarity throughout the experiment.

R. L. Cooper et al. /Journal of Neuroscience Methods 61 (1995) 67-75 69
of probability of release at individual release sites or groups of them, we compare statistical evaluations used to assess the correspondence of observed quanta1 distributions with binomial and Poisson theoretical dis- tributions.
2. Methods
2.1. Physiological preparations
2.1.1. Crayfish Freshwater crayfish (Procambarus clarkii) used for
these experiments measured 5-6 cm in body length (Atchafalaya Biological Supply, Raceland, LA). The ‘opener’ muscle of the first or second walking leg and its single motor axon were prepared according to standard procedures (Wojtowicz and Atwood, 1986).
Preparations were dissected and maintained in mod- ified Van Harreveld’s solution (205 mM NaCl, 5.3 mM KCl, 13.5 mM CaCl, * 2 H,O, 2.45 mM MgCl, * 6 H,O, 0.5 mM HEPES adjusted to pH 7.4). During physiolog- ical recordings, preparations were super-fused with this solution at 14°C.
The synaptic boutons were visualized with the vital dye 4-Di-2-Asp (Magrassi et al., 1987), which did not affect synaptic transmission at the concentrations and times employed (5 PM, 5-min treatment). With fluores- cence microscopy, the lumen of a ‘macro-patch’ recording electrode (Atwood et al., 1994) could be placed directly over a single isolated bouton (Fig. 1). Stimuli were given at 1, 5 and 10 Hz to the isolated motor axon while recording at a bouton.
2.1.2. Larval Drosophila Drosophila melanogaster Canton-S strain larvae
raised on standard Drosophila medium at 25°C were used in all experiments. Larvae were dissected in haemolymph-like solution (HL3) which contained: 70 mM NaCl, 5 mM KCl, 1.5 mM CaCl, * 2 H,O, 20 mM MgCl, .6 H,O, 10 mM NaHCO,, 5 mM trehalose, 115 mM sucrose, 5 mM BES (Stewart et al., 1994). Dissec- tion procedures were standard for this preparation (Atwood et al., 1993; Stewart et al., 1994). The internal organs were carefully removed to expose the body wall muscles and the nervous system.
Electrophysiological data were collected with ‘macro-patch’ electrode (Mallart, 1993) from type Ib boutons (Atwood et al., 1993) comprising part of the neuromuscular junction of muscle fiber 6 (Crossley, 1978) in abdominal segment 4. The main segmental nerve was stimulated with a suction electrode. The boutons are easily identifiable using Nomarski optics and a 40 x water immersion objective (Jan and Jan, 1976; Atwood et al., 1993; Stewart et al., 1994).
2.1.3. Rat brain slice Wistar rats (16-30 day old) of both sexes were used.
Animals were anaesthetized with halothane, decapi- tated with a guillotine and their brains quickly re- moved. The hippocampi were dissected out and cut transversely into 400~pm-thick slices with a tissue chopper. Slices were kept moist and oxygenated at room temperature for at least 1 h before use. Immedi- ately prior to experimentation, slices were transferred to a recording chamber and continuously perfused with artificial cerebrospinal fluid (ACSF) in equilibrium with 95% oxygen and 5% CO,. The composition of the ACSF was: 124 mM NaCl, 3 mM KCl, 1.25 mM NaHPO,, 2 mM CaCl, .2 H,O, 1 mM MgCl, .6 H,O, 26 mM NaHCO,, 10 mM dextrose. The temperature in the chamber was kept at 30-32°C. This temperature is set arbitrarily below the normal body temperature of the rat to assure survival of slices deprived of normal blood circulation.
2.2. Recording synaptic currents
Synaptic currents at the crayfish and larval Drosophila neuromuscular junctions were recorded through a macro-patch electrode essentially as de- scribed by Dude1 (19811, Wojtowicz et al. (1991) and Mallart (1993). Kimax glass (outer diameter: 1.5 mm) was pulled and fire-polished to produce patch tips with inside diameters ranging from 10 to 20 pm. All record- ings were obtained using crayfish or larval Drosophila physiological solution as the bathing medium and macro-patch electrode recording solution. The patch- clamp amplifier was obtained from Zeitz-Instruments Vertriebs (Augsburg, Germany). Electrode and seal resistance were determined by passing test current pulses through the electrode. Seal resistances ranged from 0.3 to 1.0 M.0 and the electrode resistance ranged from 0.5 to 1.0 M.0. Seal resistance was monitored throughout the recording; if it changed, the data were not utilized. When synaptic currents were compared between recorded sites, electrode and seal resistances were taken into account as described by Stiihmer et al. (1983).
Recordings from dentate gyrus granule neurons were obtained by whole-cell patch recording. A Grass con- stant-current stimulator, connected to bipolar, tungsten electrodes, was used to stimulate perforant path axons at 0.5 Hz in the middle molecular layer. Stimulation intensity was adjusted to give minimum stable levels of transmission with occasional failures. The patch recording pipettes (outside tip diameter: l-2 pm) were filled with an intracellular solution containing: 142.5 mM potassium gluconate, 17.5 mM KMeSO,, 8 mM NaCl, 10 mM HEPES, 0.1 mM EGTA, 2 mM MgATP, 0.2 mM GTP, pH 7.3. The osmolarity of the solution was 290-300 mOsm. A similar solution has been used
70 R. L. Cooper et al. / Journd of Neuroscience Merhocls 61 (1995) 67- 78
previously for patch recordings from hippocampal neu- rons (Baskys and Malenka, 1991). We used a ‘blind technique’ to obtain whole-cell patch recordings in slices. The procedure consisted of advancing the intra- cellular patch pipette (usually 5-7 M0 in resistance) with a motorized micromanipulator in small steps until a cellular membrane in the granule cell layer was encountered. Upon contact, suction was applied to the pipette and a tight seal (> 2 Ga> established. Rupture of the membrane was produced by additional gentle suction. This was indicated by a sudden drop of input resistance, increase in membrane capacitance and ap- pearance of the membrane potential (usually -70 to -80 mV). In all hippocampal slice experiments de- scribed in this study, 10 PM bicuculline methiodide, a GABA.-receptor blocker, was included in the per- fusate to eliminate synaptic transmission from hilar neurons and from inhibitory interneurons. Synaptic signals were recorded with an Axopatch-1D amplifier (Axon Instruments) and monitored by a computer. For additional off-line analysis, data were recorded on a Neurodata VCR-based recorder.
2.3. Determination of quanta1 content
2.3.1. Counts of quanta1 events Direct counting of quanta1 units was possible at the
crayfish neuromuscular junction at low stimulation fre- quencies. For each evoked response, the number of quanta1 units was determined. For a series of re- sponses, the total number of quanta1 units was estab- lished. Mean quanta1 content based upon direct counts, m c0, was calculated as the total number of quanta divided by the total number of responses.
2.3.2. Peak amplitude measurements The second determination, used for all three prepa-
rations, is to measure the mean peak amplitude of evoked events (I$,,> and spontaneous events (qPk) and calculate the mean quanta1 content as mpk = Ipk/qpk (de1 Castillo and Katz, 1954; Boyd and Martin, 1956).
2.3.3. Charge measurements The third determination, also used for the three
preparations, is to measure charge (pA X ms), by inte- grating the current trace (Van der IUoot, 1991). The values for mean charge of evoked (&,) and sponta- neous events (&,,> then provide an estimate for mean quanta1 content, calculated as mch = Zi,/Zj,,. The win- dow of time chosen to measure area of evoked re- sponses was obtained from the averaged trace, starting just prior to the averaged evoked response and ending at the point at which the current returned to baseline. For the mammalian neurons, the end of the time window was set at 90% recovery of the current event, due to a long-lasting ‘tail’ of slow current. Values for
a,,, were derived from 500 to 1000 trials, and those for qch from at least 30 events.
2.4. Calculation of binomial and Poisson distributions
We tested the fits of data sets to binomial and Poisson distributions, derived from the assumptions outlined in earlier work (Dude1 and Kuffler, 1961; Johnson and Wernig, 1971; Wernig, 1975). Binomial distributions have been shown to represent the ob- served quanta1 distributions recorded at crayfish neu- romuscular junctions (Johnson and Wernig, 1971; Smith et al., 1991; Wojtowicz et al., 1991). For the parameters of non-uniform binomial distributions, we used a model and procedures described in detail by Wojtowicz et al. (1991). The chi-square statistic (x2> and a modified Akaike information criterion (AIC) were used to pre- dict the best fitted distribution of events, and quanta1 parameters n and p. Further estimates of n and p were obtained by MLE as outlined in Smith et al. (1991).
To determine the accuracy of II and p estimates we employed the bootstrap estimate of standard error (Table 2). The bootstrap method, consists of drawing many independent (in our case 1000) random samples from the original data set, some appearing zero times, some appearing once, some appearing twice, etc. Cal- culations of n and p from each bootstrap sample are made and standard errors of n and p are given by empirical standard deviations of the replications. The algorithm and details of the technique are described by Efron and Tibshirani (1993). The bootstrap sampling method used herein is based on an open scheme (Efron and Tibshirani, 1993).
3. Results
3.1. Crayfish neuromuscular junction
3.1.1. Quanta1 counts Recordings were obtained from visualized varicosi-
ties of the single excitatory axon on the inner~ surface of the exposed opener muscle (Fig. 1A). It is known that each varicosity has a complement of about 30 individ- ual synapses (Wojtowicz et al., 1994; Atwood et al., 19941, but at low frequencies of stimulation, few quanta are produced, and they can be individually counted without much ambiguity (Fig. lB,C).
In compound events (more than 1 quantum released by an impulse), each event is usually observed as a deflection in the slope of the current trace. In the crayfish, there is usually some asynchrony in release of individual quanta1 units (Dude1 and Kuffier, 19613; this asynchrony is increased at law temperatures (Zucker, 1973). If the individual evoked events are cksely syn- chronous, discrete events may not be discerned, and

EL. Cooper et al. /Journal of Neuroscience Methods 61 (1995) 67-78 71
Table 1 Mean quanta1 content determinations and coefficient of variation (CV) of spontaneous events
mcount mpeeak %cak mcharge cvwak CVcharge (fixed) (variable)
Crayfish Exp. 1 (1 Hz) Exp. 2 (1 Hz) Exp. 3 (1 Hz)
(5 Hz) Exp. 4 (2 Hz)
Drosophila Exp. 1 (1 Hz) Exp. 2 (1 Hz) Exp. 3 (1 Hz)
0.17 0.21 0.23 0.24 0.51 1.77 0.29 0.21 0.33 0.34 0.48 0.52 0.25 0.14 0.20 0.22 0.41 0.76 0.63 0.45 0.58 0.65 0.66 0.45 0.58 0.69 0.43 0.60
10.1 8.9 0.39 0.49 7.9 6.9 0.47 0.53
18.5 19.1 0.33 0.51
Rat dentate gyrus Exp. 1 (0.5 Hz) Ekp. 2 (0.5 Hz) Exp. 3 (0.5 Hz)
1.5 1.6 1.8 0.55 0.59 2.36 2.44 2.82 0.62 0.57 2.39 2.41 2.82 0.52 0.57
some events counted as one quantum may contain two. Also, if the evoked response is large, as during high- frequency stimulation of the motor axon, discrete events are often not readily detectable, and direct counts are difficult to obtain with accuracy. In the data sets col- lected at 1 Hz, a few large evoked events without detectable inflections on rising or falling phases were observed; these responses were counted as single events. Such cases were rare. Thus, at low frequencies, direct counts of quanta provide quite an accurate value
for quanta1 content, on the basis of which the accuracy of the other less direct methods can be judged.
Results obtained from direct quanta1 counts at low frequencies of stimulation appear in Figs. 1-3, and in Tables 1 and 2.
3.1.2. Estimates based upon amplitude measurements This method requires measurement of peak evoked
responses, and of individual spontaneous quanta1 events. Measurements of peak amplitudes of evoked responses were obtained in two ways. (a) The average evoked response was obtained, the time of occurrence of its peak was observed, and the maximum values of individual responses were measured as the average of the points occurring +300 ps from the time of the average peak (Fig. 10. An average value for the base- line was taken for the same number of points, and subtracted from the peak value to give the amplitude. (b) The measurement of the peak amplitude was taken as above, but at latency adjusted to match the peak of the individual evoked response. This allowed variation in latency of quanta1 release to be taken into account more fully.
Amplitude values typically varied widely, with a preponderance of failures at low frequencies (Fig. lD>. Such data sets were tested for stationarity (Wojtowicz et al., 1994) before being accepted.
Values for quanta1 content obtained from measured amplitudes of evoked and spontaneous events Cm,,,, or mpk) are given in Table 1. Most of the estimates
Table 2 Quanta1 parameters for crayfish neuromuscular junctions
Distribution n’s and p’s SD
Exp. Events a Obs. b Theoretical
10 Hz) 0 843 846 1 150 147 Uniform 2 7 6
2 (1 Hz) 0 374 374 1 105 109 Poisson 2 21 16 3 0 2
3 (1Hz) 0 383 383 1 109 109 Uniform 2 8 8
3 (5 Hz) 0 249 249 1 189 194 Non- 2 44 50 uniform 3 9 7
4 (2 Hz) 0 253 254 1 194 187 Non- 2 43 51 uniform 3 9 7 4 1 1
a The number of discrete events, indicated as 0 failures, 1 failure, etc. b Obs.. the observed occurrences of each event.
AK h=) (p=>
3 0.03
3 0.08
7 p, = 0.3 pz-, = 0.05
6 p, = 0.24 P2-6 = 0.07
MLE Rootstrap (n =) (R + SE) (p=) (P ~fr SE)
2 2.72 f 2.7 0.08 0.07 f 0.02
29 28.18 +_2 0.0001 0.031 f 0.33
2 2.48 f 1.79 0.125 0.11 *0.03
4 4.18 rf. 1.47 0.156 0.16 +O.O
5 6.49 f 3.42 0.124 0.12 f 0.04

72 R.L. Cooper et ul. /Joumnl of Neuroscience Methotis 61 (1995) 67-73
based upon amplitude measurements were lower than those based upon counts (although one experiment is included in which the reverse is true). The estimates derived from measurements at a fixed latency are lower than those based upon measurements made at a vari- able latency. This arises mainly from variable latency of quanta1 events (Fig. lC>. For the crayfish, our results show that use of amplitude measurements for quanta1 content determinations usually leads to under-estima- tion of the quanta1 content.
3.1.3. Estimates based upon charge measurements The time integral of the current below the baseline
(in pA x ms) estimates the charge associated with one or more quanta1 events (Fig. lC,). This method is less susceptible to measurement errors arising from varia- tion in latencies of individual quanta1 units, as ‘late’ events (such as the third event in Fig. lC,) are in- cluded. In addition, if multiple events which are not clearly discernable for counting occur during the evoked response, the charge measurement takes them into account.
A correction in charge measurements may be neces- sary for controlling artifactual currents recorded with a macropatch electrode at the neuromuscular junction. Averaging trials which were deemed to be failures in evoked release sometimes yielded a small deviation from the baseline. This spurious current can add or subtract to those measured during the evoked re- sponses depending on the deflection. Adding or sub- tracting the average of the failures from each trial produced only a slight deviation in mean quanta1 con- tent.
Table 1 shows that estimates of quanta1 content derived from charge measurements were invariably larger than those derived from amplitude measure- ments, and usually ‘closer to the values derived from counts. (Exp. 1 in Table 1, is an exception). Thus, for the crayfish neuromuscular junction, the method based upon charge measurement would provide a better esti- mate of quanta1 content than the method based upon amplitude measurements.
This is illustrated in Fig. 2, which presents in more detail the results of the three methods of quanta1 content determination (Exp. 2 of Table 1). In this case, the amplitude method underestimates the quanta1 con- tent derived from counts, and the charge method over- estimates this value, but the latter method gives a closer estimate of the ‘counted’ value than the former.
It should be noted that spontaneous events for both amplitude and charge measurements show non-Gaus- sian distributions (Fig. 2). This type of distribution is commonly seen at the crayfish neuromuscular junction, and elsewhere (Robinson, 1976). Usually the distribu- tion of spontaneous measurements is skewed to the right because of a few large events. Such distributions
160,s
0 100 200 300 Current amplitude lpAl
0 100 200 300 400
Current amplitude (pAI
0 400 800 Charge (PA. ms)
I I I
0 200 400 600 800 1000 1200
Charge (pA.ms)
Fig. 2. Comparison of quanta1 content determinations made at the crayfish neuromuscular junction from: (A) direct quanta1 counts; (B) peak measurements; (C) charge measurements. In 3 and C, the inserts show distributions of spontaneously occurring quanta1 units. Abbreviations: avg, the average value of the spontaneous events; n, the number of events measured.
have been described by Robinson (1976) and can be fitted by gamma distributions. It is possible that the skewness results from true ‘giant’ spontaneous events discussed in detail by Van der Kloot (1991). We in- cluded these large spontaneous events in the calcula- tion of the mean value. A more refined statistical treatment that takes account of the non-Gaussian dis- tributions could yield a better value for the quanta1 content, but would not correct problems associated with variable latency of release. An additional index that can be used which takes into account the variation of the spontaneous events is the coefficient of variation (CV) given as the standaxd de&tiisn of the events divided by the mean of the events. This index can be
R.L. Cooper et al. /Journal of Neuroscience Methods 61 (1995) 67-78
used to compare variation of the measurements of amplitude and charge. The CV values are shown in Table 1 for each of the preparations.
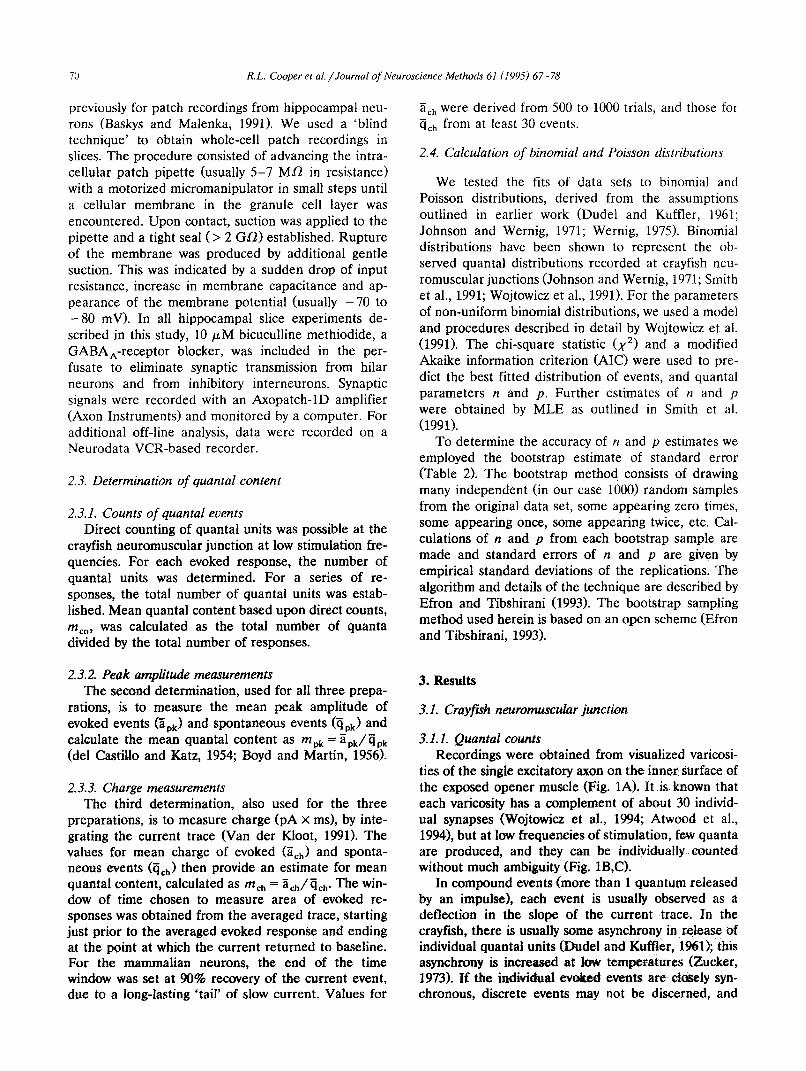
Obtaining a good signal-to-noise ratio is necessary for measuring peak amplitude or charge. Since there is a range of single quanta1 sizes, some will appear just slightly above the noise level of the recording. One way to insure that single events can be resolved is to plot an amplitude or charge histogram of all the failed events during the time window in which evoked responses normally occur. This will give an indication of the variance of noise during the time of evoked responses. Such a histogram can then be compared to one made using only traces that were marked as having an event. This was done for amplitude and charge measurements in the same sets of data (data not shown). We did not observe any significant difference between the ampli- tude and the charge mesurements using this approach. There usually is a slight overlap of noise with the smallest of the single evoked events. Another index of signal to noise for quanta1 detection that may be used is to obtain a ratio of the mean of spontaneous events to the standard deviation of the baseline noise. This ratio can be used to assess whether the amplitude or charge measures provide a better signal-to-noise ratio. In the four experimental crayfish preparations shown in Table 1, this index of signal-to-noise demonstrated that the peak amplitudes gave a larger ratio for Exps. 1 and 2, whereas the charge measure showed a larger ratio for Exps. 3 and 4. The results indicate that one method of measurement is not markedly superior to the other with respect to the signal-to-noise ratio.
3.1.4. Frequency facilitation As shown by the pioneering work of Dude1 and
Kuffler (19611, increased frequency of stimulation leads to a higher rate of transmitter release at the crayfish neuromuscular junction. A representative experiment to measure quanta1 content at different frequencies is given in Fig. 3 (Exp. 2 of Table 1). It was not possible to count quanta accurately at 5 and 10 Hz for this recording site, and the method based upon charge measurement was employed. The value of ll~,,, rose lo-fold when the frequency was increased from 1 to 10 Hz. These data suggest that the calculated value of mch is closely representative of m, when both can be compared in the same set of data. We suggest that at higher stimulation frequencies, when direct counts can- not be made, nzch will provide a good representative measure of mean quanta1 content, as at the lower stimulation frequencies.
3.2. Drosophila neuromuscular junction
In physiological solutions with ionic composition close to that of haemolymph (Stewart et al., 19941,
120 1 1 Hz
120 B 5 Hz
120 C 10 Hz
0 0 800 1600 2400
Charge (pA.ms)
Fig. 3. Changes in quanta1 content at the crayfish neuromuscular junction, estimated by charge measurements, with increasing fre- quency of stimulation. Stimulation frequencies were: 1 Hz (A), 5 Hz (B), and 10 Hz (C). As frequency increased, occurrence of failures declined, and multiple quanta1 events increased, making direct counts of quanta1 units uncertain or impossible at the higher frequencies.
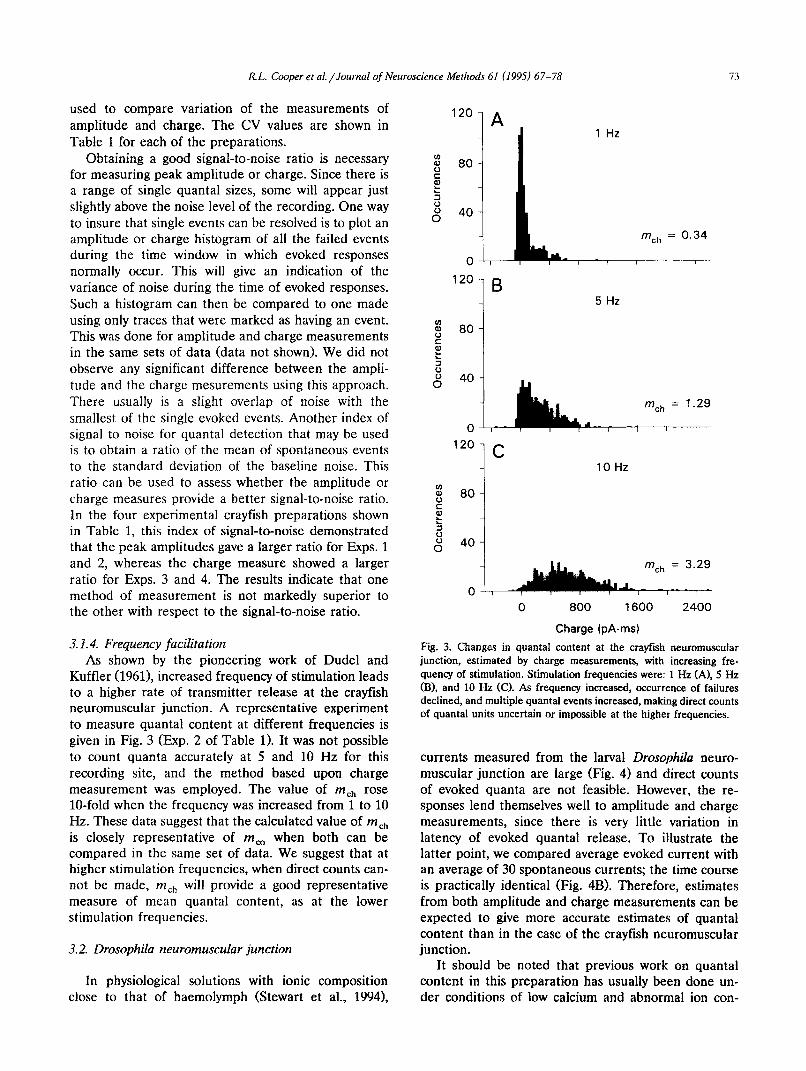
currents measured from the larval Drosophila neuro- muscular junction are large (Fig. 4) and direct counts of evoked quanta are not feasible. However, the re- sponses lend themselves well to amplitude and charge measurements, since there is very little variation in latency of evoked quanta1 release. To illustrate the latter point, we compared average evoked current with an average of 30 spontaneous currents; the time course is practically identical (Fig. 4B). Therefore, estimates from both amplitude and charge measurements can be expected to give more accurate estimates of quanta1 content than in the case of the crayfish neuromuscular junction.
It should be noted that previous work on quanta1 content in this preparation has usually been done un- der conditions of low calcium and abnormal ion con-
74 R.L. Cooper et al. /Journal of Neuroscience Methods 61 (199s) 67-78
Ev
10 msec
- Spontaneous - Evoked
100 pA
C - Synaptic current . . . . . . . EpSp
i j’ r LJ*oo pA 10 mV
10 msec
Fig. 4. Recording of evoked and spontaneous synaptic currents at a single varicosity of the neuromuscular junction in larval Draophilu. A: resuits for a single stimufus, showing evoked (Ev) and sponta- neous f l 1 events. B: comparison of time courses of averaged evoked (thick line) and spontaneous (thin line) events, showing identity of time course. The decay time constant of the spontaneous event is 4.4 ms and of the evoked event 3.7 ms. The spontaneous currents were scaled to match the evoked events. C: excitatory post-synaptic poten- tial and simultaneously recorded synaptic current to illustrate that the peak of the current occurs when the voltage displacement from the resting potential is only a small fraction of its.final value (here =8 mV). The synaptic current trace has been inverted for easier comparison to the EPSP.
tent (Jan and Jan, 1976; Mallart, 1993). Under such conditions there is more variation in quanta1 latency and a lower quanta1 content (Mallart, 1993); hence, quanta1 counts can be obtained.
Because of the relatively large currents at this junc- tion, the excitatory postsynaptic potential is usually lo-30 mV in amplitude (Fig. 4C), and the need for a correction in amplitudes to take account of the loss of driving force for the synaptic current needs to be addressed. Two observations Sicated that such a cor- rection was not needed. First, at the time of peak
current, the displacement in membrane potential is only a few millivolts (Fig. 40. Second, we measured current amplitudes with and without voltage clamp (Stewart and Atwood, personal observations), and found that current amplitude did not increase when the membrane potential was clamped at the resting potential; rather, it remained the same size, or de- creased slightly.
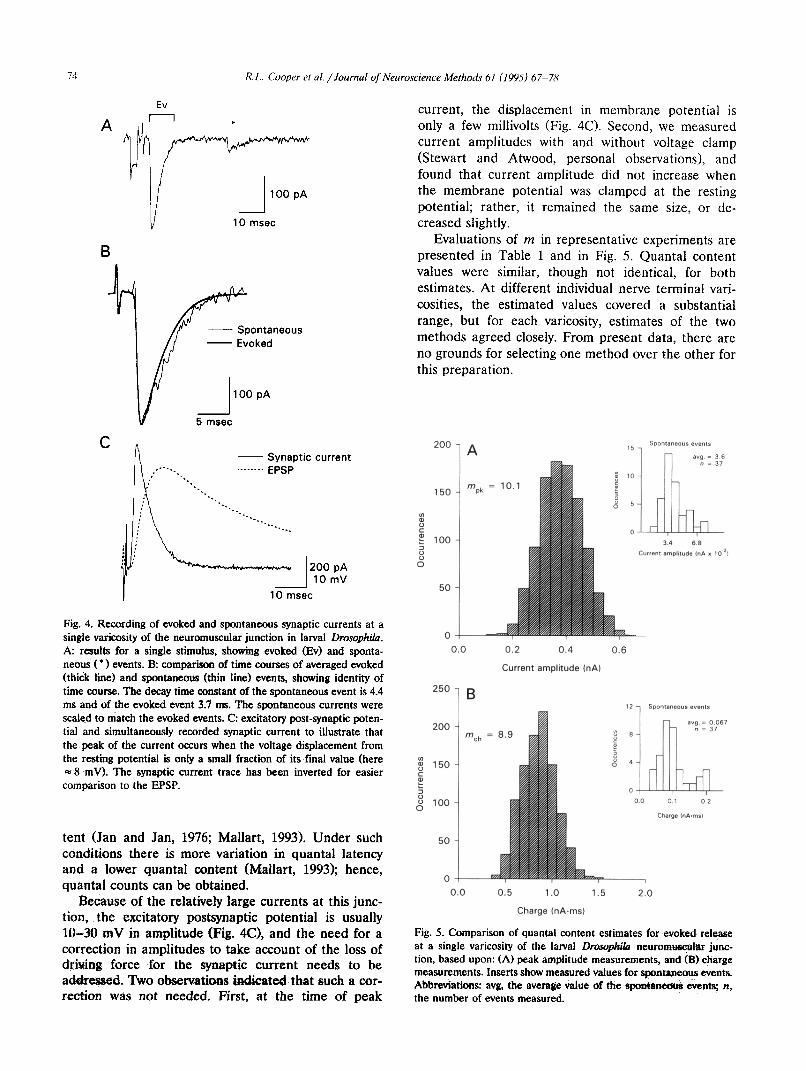
Evaluations of m in representative experiments are presented in Table 1 and in Fig. 5. Quanta1 content values were similar, though not identical, for both estimates. At different individual nerve terminal vari- cosities, the estimated values covered a substantial range, but for each varicosity, estimates of the two methods agreed closely. From present data, there are no grounds for selecting one method over the other for this preparation.
200
150
I : ! : 100 3
8
50
0
0.2 0.4 0.6
Current amplitude (nA)
200
2 150 2 ?
2 8 100
50
0
0.0 0.5 1 .o 1.5 2.0
Charge (nA.ms)
Fig. 5. Comparison of quanta1 content estimates for evoked release at a single varicosity of the larval Drosophila neuromwa@ junc- tion, based upon: (A) peak amplitude measurements, atid (B) charge measurements. Inserts show measured values for spontaneous events. Abbreviations: avg, the average value of the spo&%necrtrs events; n, the number of events measured.
R. L. Cooper et al. /Journal of Neuroscience Methods 61 (I 995) 67- 78 15
IOms
spontaneous events
avg. = 9.5
0 10 20 30 40 50
Current amplitude (PA)
0 10 20 30 40 50 60
Current amplitude (PA)
C 40 7 spontaneous events
mch= 2.82 30 i -
Charge (PA. ms)
0
0 100 200 300 400 500
Charge (pA.ms)
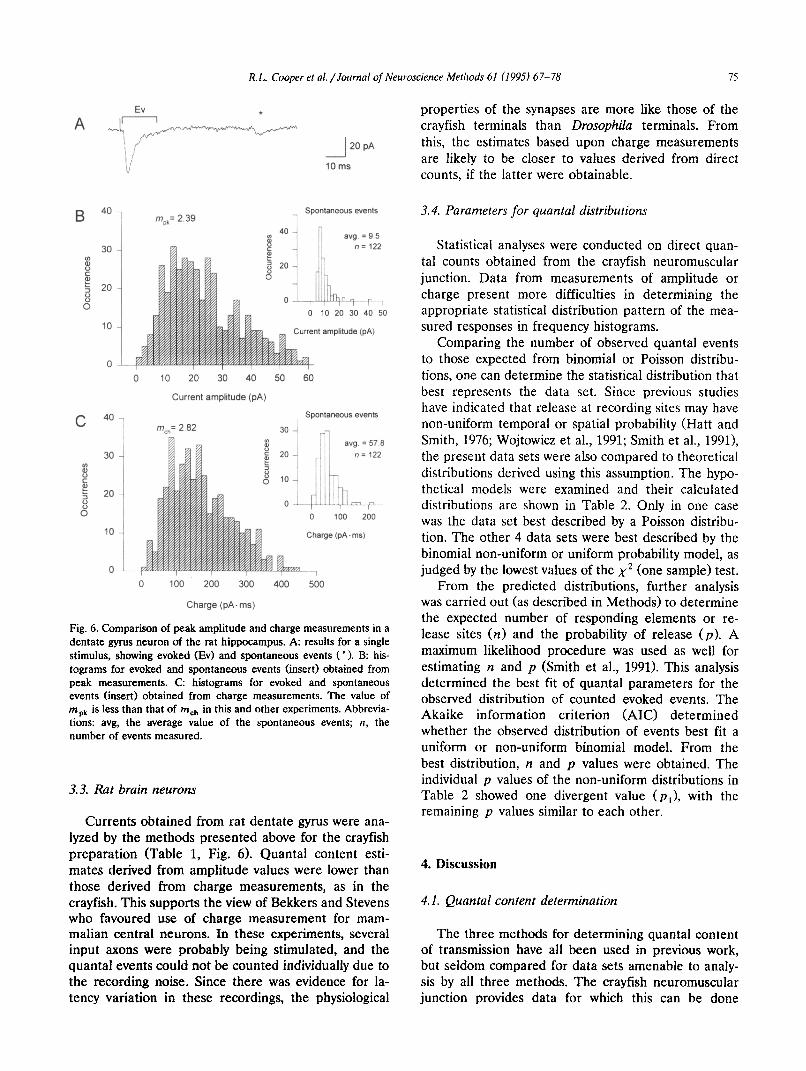
Fig. 6. Comparison of peak amplitude and charge measurements in a dentate gyrus neuron of the rat hippocampus. A: results for a single stimulus, showing evoked (Ev) and spontaneous events ( * ). B: his- tograms for evoked and spontaneous events (insert) obtained from peak measurements. C: histograms for evoked and spontaneous events (insert) obtained from charge measurements. The value of m,, is less than that of mCh in this and other experiments. Abbrevia- tions: avg, the average value of the spontaneous events; n, the number of events measured.
3.3. Rat brain neurons
Currents obtained from rat dentate gyrus were ana- lyzed by the methods presented above for the crayfish preparation (Table 1, Fig. 6). Quanta1 content esti- mates derived from amplitude values were lower than those derived from charge measurements, as in the crayfish. This supports the view of Bekkers and Stevens who favoured use of charge measurement for mam- malian central neurons. In these experiments, several input axons were probably being stimulated, and the quanta1 events could not be counted individually due to the recording noise. Since there was evidence for la- tency variation in these recordings, the physiological
properties of the synapses are more like those of the crayfish terminals than Drosophila terminals. From this, the estimates based upon charge measurements are likely to be closer to values derived from direct counts, if the latter were obtainable.
3.4. Parameters for quanta1 distributions
Statistical analyses were conducted on direct quan- tal counts obtained from the crayfish neuromuscular junction. Data from measurements of amplitude or charge present more difficulties in determining the appropriate statistical distribution pattern of the mea- sured responses in frequency histograms.
Comparing the number of observed quanta1 events to those expected from binomial or Poisson distribu- tions, one can determine the statistical distribution that best represents the data set. Since previous studies have indicated that release at recording sites may have non-uniform temporal or spatial probability (Hatt and Smith, 19’76; Wojtowicz et al., 1991; Smith et al., 19911, the present data sets were also compared to theoretical distributions derived using this assumption. The hypo- thetical models were examined and their calculated distributions are shown in Table 2. Only in one case was the data set best described by a Poisson distribu- tion. The other 4 data sets were best described by the binomial non-uniform or uniform probability model, as judged by the lowest values of the x2 (one sample) test.
From the predicted distributions, further analysis was carried out (as described in Methods) to determine the expected number of responding elements or re- lease sites (n) and the probability of release (p). A maximum likelihood procedure was used as well for estimating n and p (Smith et al., 1991). This analysis determined the best fit of quanta1 parameters for the observed distribution of counted evoked events. The Akaike information criterion (AIC) determined whether the observed distribution of events best fit a uniform or non-uniform binomial model. From the best distribution, n and p values were obtained. The individual p values of the non-uniform distributions in Table 2 showed one divergent value (p,), with the remaining p values similar to each other.
4. Discussion
4.1. Quanta1 content determination
The three methods for determining quanta1 content of transmission have all been used in previous work, but seldom compared for data sets amenable to analy- sis by all three methods. The crayfish neuromuscular junction provides data for which this can be done

‘76 R. L. Cooper et ~1. /Journal of Neumscience Methods 61 (1995) 67-75
under normal physiological conditions. From the pre- sent analysis, it is evident that the commonly used method of determining quanta1 content from ampli- tudes of evoked and spontaneous events often pro- duces a value lower than that obtained by counting quanta directly. The major cause of the discrepancy is the variation in latency of evoked quanta (Bekkers and Stevens, 1991). When estimates are based upon mea- surement of charge rather than amplitude, the values agree more closely with those obtained from direct counts. We conclude that, for synaptic systems in which there is evidence for quanta1 latency fluctuations in evoked release, but in which individual quanta1 units cannot be counted, the method based upon charge measurements provides a better estimate of quanta1 content than methods based upon amplitude measure- ments. This would hold in particular at higher stimula- tion frequencies, when latency fluctuation might in- crease.
The rat dentate gyrus neurons are an example of this type. The evoked current responses show evidence of latency fluctuations and estimates of mch are larger than those of mpk, as in the crayfish. Since sponta- neous events cannot be attributed with certainty to the same synapses participating in evoked release in this preparation, the estimates of quanta1 content are more uncertain than in the crayfish and Drosophila prepara- tions, in which spontaneous events arise at the same recording site as the evoked responses. The CV values for the spontaneous events, in all three preparations, indicate that in the majority of the cases, the variations are larger for the charge measurements than for the amplitude measurements, This suggests that amplitude measurements underestimate the degree of variation in spontaneous events, whereas the charge measurements include not only the amplitude but also the rise and decay phases of the event.
In Drosophila, there is very little latency fluctuation in evoked release at haemolymph calcium concentra- tions and thus no reason to prefer estimates of m,,, over those of mpk. If quanta1 content is reduced in this preparation through low-calcium solutions, latency fluctuation appears (Jan and Jan, 1976; Mallart, 19931, and then the situation resembles that in the crayfish. We emphasize that measurements at abnormally low Ca2+ are not likely to represent the normal perfor- mance of the synapse (Stewart et al., 1994), though they may be useful for comparing effects of mutations on synaptic transmission (Zhong and Wu, 1991; Mal- lart, 1993). The variation in amplitude and charge among spontaneous events may be dependent on the anatomical characteristics of the preparation. For ex- ample, the variance in the spontaneous events recorded from the dentate neurons is larger than those recorded at the neuromuscular junctions of crayfish and Drosophila. This can arise from multiple postsynaptic
sites along large dendritic trees of CNS neurons. An- other possible explanation for quanta1 size and shape variation is that receptors may exhibit variable desensi- tization when events are occurring in a rapid succes- sion at the same synapse (see Dude1 et al., 1992).
4.2. Binomial parameters of evoked release
Distribution of quanta1 release for crayfish data were most often fitted best with binomial distributions, though a few cases occur in which the best fit is a Poisson distribution (Table 2). The best results were obtained using data from direct quanta1 counts. At- tempts to fit amplitude distributions with binomial distributions must contend with several sources of vari- ation, including errors in measurements of evoked re- lease discussed above, and non-Gaussion distributions for spontaneous events. These factors, combined with the range in possible values for n and p, frequently provide many possible solutions which fit equally well the distributions in the histograms.
As illustrated in Table 2, data sets from the crayfish neuromuscular junction are often best fitted with bino- mial distributions in which the probability of release is non-uniform among the individual release sites (Hatt and Smith, 1976; Smith et al. 1991). However, cases also occur in which a uniform probability gives the best fit. Structural studies provide a basis for non-uniform probability, since some synapses on a varicosity are more complex than others (Wojtowicz et al., 1989, 1994) and structural differences are found at high-out- put and low-output synapses of a single neuron (Govind et al., 1994). Also, depending on the distances between release sites (i.e., active zones), there can be interac- tions among sites which affect the probability of re- lease (Cooper, Winslow, Govind, and Atwood, in manuscript). In this regard, crustacean synapses may differ from those of the goldfish Mauthner cell, which are more uniform in structure and for which probabil- ity of release appears to be uniform (Kern et al., 1981). Such comparisons emphasize the variability of natu- rally occurring synaptic systems. Non-uniform probabil- ity of release has been recognized as likely for synaptic transmission in hippocampal neurons on the basis of analysis of fluctuations of synaptic currents (Rosen- mund et al., 1993; Redman, 1990). A disadvantage of the charge measurement for analysis in central neurons may arise if the recordings exhibit a high rate of spontaneous transmitter release which could result in baseline shifts. This was not a problem in our record- ings from dentate gyrus neurons because the rate of occurrence of spontaneous miniature potentials was on average 2 Hz.
Use of uniform and non-uniform probabilities -for the same data sets did not lead to a significant differ- ence in the estimated parameters: n changed by 1, and

R. L. Cooper et al. /Journal of Neuroscience Methods 61 (199.5) 67-78 II
the estimated standard errors were usually greater than this (Table 2). We present a bootstrap approach for estimating standard errors of quanta1 parameters based on Efron and Tibshirani (1993). Other ap- proaches to this problem employed either estimates based on the method of moments (Robinson, 1976) or the Fisher information matrix (Smith et al. 1991). These approaches are valid for estimates of continuous func- tions and can be used with some limitations to calcu- late standard errors of the parameter p. However, parameter n in quanta1 models is an integer rather than a continuous function. The bootstrap method can be used in dealing with integer values and is probably the method of choice at this time.
Acknowledgements
This research was supported by the Medical Re- search Council of Canada (H.L.A. and J.M.W.), Net- work on Neural Regeneration and Functional Recov- ery, Canada (Fellowship to R.L.C.), and Natural Sci- ences and Engineering Research Council of Canada (Fellowship to B.A.!%). Marianne Hegstrom-Wojtowicz helped to prepare figures and typing. Software for off-line analysis measurements was written by Steve Jones, Medical Computing, Medical Sciences, Univ. of Toronto and by Tom Goldthorpe. Software for deter- mining values of MLE, AIC and bootstraping analysis was provided by Dr. Bruce Smith, University of Victo- ria, Canada.
References
Atwood, H.L., Govind, C.K. and Wu, C.-F. (1993) Differential ultra- structure of synaptic terminals on ventral longitudinal abdominal muscles in Drosophila larvae, J. Neurobiol., 24: 1008-1024.
Atwood, H.L., Cooper, R.L. and Wojtowicz., J.M. (1994) Non-uni- formity and plasticity of quanta1 release at crustacean motor nerve terminals. In: L. Stjiirne (Ed.), Advances in Second Mes- senger and Phosphoprotein Research. Molecular and Cellular Mechanisms of Neurotransmitter Release. Raven Press, New York, pp. 363-382.
Baskys, A. and Malenka, R.C. (1991) Agonists at metabotropic glutamate receptors presynaptically inhibit EPSCs in neonatal rat hippocampus, J. Physiol. (Land.), 444: 687-701.
Bekkers, J.M. and Stevens, CF. (1989) NMDA and non-NMDA receptors are co-localized at individual excitatory synapses in cultured rat hippocampus, Nature, 341: 230-233.
Bekkers, J.M. and Stevens, C.F. (1991) Application of quanta1 analy- sis to the study of long-term potentiation: errors, assumptions, and precautions. In: M. Baudry and J.L. Davis (Eds.1, Long-Term Potentiation. A Debate of Current Issues, MIT Press, Cam- bridge, MA, pp. 63-76.
Boyd, I.A. and Martin, A.R. (1956) The end-plate potential in mammalian muscle, J. Physiol. (Land.), 132: 74-91.
Crossley, CA. (1978) The morphology and development of the Drosophila muscular system. In: M. Ashburner and T.R.F. Wright (Eds.), The Genetics and Biology of Drosophila, Vol. 2b, Aca- demic Press, New York, pp. 449-559.
Del Castillo, J. and Katz, B. (1954) Quanta1 components of the end-plate potential, J. Physiol. (Land.), 124: 560-573.
Dude], J. (1981) The effect of reduced calcium on quanta1 unit current and release at the crayfish neuromuscular junction, Pfliigers Arch., 391: 35-40.
Dude], J., Franke, C. and Hatt, H. (1992) Rapid activation and desensitization of transmitter-liganded receptor channels by pulses of agonists. In: T. Narahashi (Ed.), Ion Channels, Vol. 3, Plenum Press, New York, pp. 207-260.
Dudel, J. and Kuffler, S.W. (1961) The quanta1 nature of transmis- sion and spontaneous miniature potentials at the crayfish neuro- muscular junction, J. Physiol. (Land.), 155: 514-529.
Efron, B. and Tibshirani, R. (1993) The bootstrap estimate of stand- ard error. In: B. Efron and R. Tibshirani (Eds.), An Introduction to the Bootstrap, Chapman Hall, pp. 45-59.
Govind, C.K., Pearce, J., Wojtowicz, J.M. and Atwood, H.L. (1994) ‘Strong’ and ‘weak’ synaptic differentiation in the crayfish opener muscle: structural correlates, Synapse, 16: 45-58.
Hatt, H. and Smith, D.O. (1976) Non-uniform probabilities of quan- tal release at the crayfish neuromuscular junction, J. Physiol. (Lond.), 259: 395-404.
Hessler, N.A., Shirke, A.M. and Malinow, R. (1993) The probability of transmitter release at a mammalian central synapse, Nature, 366: 569-572.
Jan, L.Y. and Jan, Y.N. (19761 Properties of the larval neuromuscu- lar junction in Drosopfzila mefanogasrer, J. Physiol. (Lond.1, 262: 189-214.
Johnson, E.W. and Wernig, A. (1971) The binomial nature of trans- mitter release at the crayfish neuromuscular junction, J. Physiol. (Lond.), 218: 757-767.
Kern, H., Triller, A., Mallet, A. and Faber, D.S. (1981) Fluctuating responses at a central synapse: n of binomial fit predicts number of stained presynaptic boutons, Science, 213: 898-901.
Larkman, A., Stratford, K. and Jack, J. (1991) Quanta1 analysis of excitatory synaptic action and depression in hippocampal slices, Nature, 350: 344-347.
Liao, D., Jones, A. and Malinow, R. (1992) Direct measurement of quanta1 changes underlying long-term potentiation in CA1 hip- pocampus, Neuron, 9: 1089-1097.
Magrassi, L., Purves, D. and Lichtman, J.W. (1987) Fluorescent probes that stain living nerve terminals, J. Neurosci., 7: 1207-1214.
Malinow, R. and Tsien, R.W. (1990) Presynaptic enhancement shown by whole-cell recordings of long-term potentiation in hippocam- pal slices, Nature, 346: 177-180.
Mallart, A. (1993) Calcium dependent modulation of the facilitation of transmitter release at neuromuscular junctions of Drosophila, J. Physiol. (Paris), 87: 83-88.
Mana&, T., Renner, P. and Nicoll, R.A. (1992) Postsynaptic contri- bution to long-term potentiation revealed by the analysis of miniature synaptic currents, Nature, 355: 50-55.
Redman, S. (1990) Quanta1 analysis of synaptic potentials in neurons of the central nervous system, Physiol. Rev., 70: 165-198.
Robinson, J. (1976) Estimation of parameters for a model of trans- mitter release at synapses, Biometrics, 32: 61-68.
Rosenmund, C., Clements, J.D. and Westbrook, G.L. (1993) Nonuni- form probability of glutamate release at a hippocampal synapse, Science, 262: 754-757.
Smith, B.R., Wojtowicz, J.M. and Atwood, H.L. (1991) Maximum likelihood estimation of non-uniform transmitter release proba- bilities at the crayfish neuromuscular junction, J. Theor. Biol., 150: 457-472.
Stewart, B.A., Atwood, H.L., Renger, J.J., Wang, J. and Wu, C.-F. (1994) Improved stability of Drosophila larval neuromuscular preparations in haemolymph-like physiological solutions, J. Comp. Physiol., 175: 179-191.
Stiihmer, W., Roberts, W.S. and Almers, W. (19831 The loose patch

7s R.L. Cooper Ed (11. /Journal of Neuroscience Merhods 61 (1993) 67-78
clamp. In: B. Sakmann and E. Neher (Eds.), Single channel recordings. Plenum Press, New York, pp. 123-132.
Van der Kloot, W. (1991) The regulation of quanta1 size, Prog. Neurobiol., 36: 93-130.
Wernig, A. (1972) The effects of calcium and magnesium on statisti- cal release parameters at the crayfish neuromuscular junction, J. Physiol. &and.), 226: 761-768.
Wernig, A. (1975) Estimates of statistical release parameters from crayfish and frog neuromuscular junctions, J. Physiol. (Land.), 244: 207-221.
Wojtowicz, J.M. and Atwood, H.L. (1986) Long-term facilitation alters transmitter releasing properties at the crayfish neuromus- cular junction, J. Neurophysiol., 55: 484-498.
Wojtowicz, J.M., Marin, L. and Atwood, H.L. (1989) Synaptic re-
structuring during long-term facilitation at the crayfish neut-o- muscular junction, Can. J. Physiol. Pharmacol., 67: 167-171.
Wojtowicz, J.M., Smith, B.R. and Atwood, H.L. (1991) Activity-de- pendent recruitment of silent synapses, Ann. NY Acad. Sci., 627: 169-179.
Wojtowicz, J.M., Marin, L. and Atwood, H.L. (1994) Activity-in- duced changes in synaptic release sites at the crayfish neuromus- cular junction, J. Neurosci., 14: 3688-3702.
Zhong, Y. and Wu, C.-F. (1991) Synaptic plasticity in Drosophila memory mutants with a defective cyclic AMP cascade. Science, 251: 198-201.
Zucker, R.S. (1973) Changes in the statistics of transmitter release during facilitation, J. Physiol. (Land.), 229: 787-810.