quantification of membrane properties of trigeminal root...
TRANSCRIPT

JOURNALOF NEUROPHYSIOLOGY Vol. 55, No. 5, May 1986. Printed in U.S.A.
Quantification of Membrane Properties of Trigeminal Root Ganglion Neurons in Guinea Pigs
E. PUIL, B. GIMBARZEVSKY, AND R. M. MIURA
Department of Pharmacology and Therapeutics, FucuIty of Medicine, The University of British Columbia, Vancouver, British Columbia V6T I WS, Cunudu
SUMMARY AND CONCLUSIONS
I. Passive and active (voltage- and time- dependent) membrane properties of trigeminal root ganglion neurons of decerebrate guinea pigs have been determined using frequency- domain analyses of small-amplitude pertur- bations of membrane voltage. The complex impedance functions of trigeminal ganglion neurons were computed from the ratios of the fast Fourier transforms of the intracellularly recorded voltage response from the neuron and of the input current, which had a defined oscillatory waveform. The impedance mag- nitude functions and corresponding imped- ance locus diagrams were fitted with various membrane models such that the passive and active properties were quantified.
2. The complex impedances of less than one-quarter of the 105 neurons which were investigated extensively could be described by the complex impedance function for a simple RC-electrical circuit. In such neurons, the voltage responses to constant-current pulses, using conventional bridge-balance techniques, could be fitted with single exponential curves, also suggesting passive membrane behavior.
3. A nonlinear least-squares fit of the com- plex impedance function for the simple model to the experimentally observed complex impedance yielded estimates of the resistance of the electrode, and of input capacitance (range, 56 to 490 pF) and input resistance (range, 0.8 to 30 MQ) of the neurons.
4. The majority of trigeminal ganglion neurons were characterized by a resonance in the 50- to 250-Hz bandwidth of their imped-
ante magnitude functions. Such neurons when injected with “large” hyperpolarizing current pulses using bridge-balance techniques showed membrane voltage responses that “sagged” (time-dependent rectification). Also, repetitive firing commonly occurred with depolarizing current pulses; this characteristic of neurons with resonance in their impedance magnitude functions was not observed in neurons with “purely” passive membrane behavior.
5. A nonlinear least-squares fit of a five- parameter impedance fitting function based on a membrane model to the impedance locus diagram of a neuron with resonance yielded estimates of its membrane properties: input capacitance, the time-invariant part of the conductance, the conductance activated by the small oscillatory input current, and the relax- ation time constant for this conductance. The ranges of the estimates for input capacitance and input resistance were comparable to the ranges of corresponding properties derived for neurons exhibiting “purely” passive behavior. The membrane resistance which apparently was voltage- and time-dependent usually ranged between 1.6 and 300 MQ with a relax- ation time constant of 0.7 to 8,O ms.
6. Membrane models given by 1) an equiv- alent electrical circuit consisting of a parallel RC circuit in parallel with a series resistance- inductor branch; 2) a linearized Hodgkin- Huxley model with one active conductance component; and 3) a linearized Goldman or permeability model with one active perme- ability component, were all shown to have complex impedance functions with the same frequency dependence.
0022-3077/86 $1.50 Copyright 0 1986 The American Physiological Society 995

996 PUIL, GIMBARZEVSKY, AFJD MXURA
INTRODUCTION
An understanding of signal transfer in ver- tebrate nervous systems requires study of the electrical behavior of the membrane in indi- vidual neurons. The membrane electrical properties and morphology influence the tem- poral and spatial distributions of the electrical response of a neuron that has been stimulated by a synaptic input or by injection of current into the soma. Ever since intracellular record- ing in spinal ganglion cells was initiated by Svaetichin (5 1 ), the cell bodies of sensory neu- rons of vertebrates have been popular targets for electrophysiological investigations, partly because of their relatively large size and ap- proximately spherical shape (4 1). It is widely assumed that the unipolar geometry and the absence of synaptic impingements on their perikarya (41) permit an unambiguous inter- pretation of electrical behavior of these cells. Some revision of this belief may become nec- essary in view of the recent demonstration of synapses on dorsal root ganglion cells of cats (36) and because of the established presence of receptors for y-aminobutyric acid, a neu- rotransmitter (15, 20). On the other hand, neurons of the mesencephalic trigeminal nu- cleus that receive synaptic input and are pri- mary afferents of the trigeminal nerve (41), appear to be insensitive to y-aminobutyrate (16), suggesting that trigeminal root ganglion cells may differ from dorsal root ganglion cells.
The combination of their large size, an approximately spherical soma, and a stem process that is small at its origin (41) make trigeminal ganglion cells ideal for certain electrophysiological studies because spatial variations and the effects of attached processes may be neglected in the modeling of neuronal responses to stimuli. However, membrane electrical properties of trigeminal ganglion cells have received little attention compared with those of other ganglionic neurons. The only results of intracellular recordings from tri- geminal ganglion neurons are contained in brief accounts of passive membrane properties in tissue culture (22) and the in vitro dem- onstrations of an ATP sensitivity and a highly specific Ht sensitivity of the neuronal mem- brane (39,40). This is surprising, especially in view of evidence that trigeminal neuralgia in humans may be due to pathogenesis in the trigeminal ganglion or the sensory root (37, 38).
In the experimental studies reported here, we have used temporal variations in voltage responses to injected currents to infer mem- brane properties of trigeminal ganglion neu- rons. For small-amplitude injected currents, resulting in small perturbations of the mem- brane potential from its resting value, one might expect membrane behavior to be strictly passive, i.e., the voltage- and time-dependent (active) conductances do not contribute. However, neuronal membranes are not solely passive near rest ( IX), and the calculated time constant, assuming passive behavior, may be very different from the true membrane time constant. Thus the estimates of input resis- tance and capacitance of neurons need to ac- count for these active properties.
In principle, the assumption of linear su- perposition permits time-domain responses of the membrane potential to step current injec- tions to be decomposed into a sum of expo- nentials using the method of peeling. Unfor- tunately, the accuracy of peeling techniques is questionable when more than two exponen- tials are needed to approximate the response (53). A more accurate method for determining membrane properties is to use frequency-do- main analysis of the data (34). Injection of si- nusoidal currents at certain frequencies yields a relationship between the membrane prop- erties of the cell body and the given input fre- quency. Conventional methods for accom- plishing this go back more than 40 years to Cole (cf. Ref. lo), but these are time consum- ing and were superceded largely by the anal- yses based on the Hodgkin-Huxley model of an excitable membrane (30). Sophisticated high-speed computers obviate a number of problems associated with the time constraint and make frequency-domain analyses more appropriate. One is no longer restricted to giv- ing a sequence of single-frequency current in- puts (lo), but more general current inputs can be applied with responses decomposed into their individual frequency components using Fourier transform techniques. Furthermore, off-line computer-intensive analysis of the data in conjunction with linearized membrane models permits determination of values of certain membrane properties and with an ac- curacy heretofore unobtainable.
We present here for the first time measure- ments of membrane potential responses of tri- geminal ganglion neurons in vivo to oscillatory

MEMBRANE PROPERTIES OF TRIGEMINAL NEURONS 997
current inputs. Then, the membrane proper- ties are obtained using our frequency-domain methodology. In addition to comparisons with estimates of membrane properties obtained by bridge-balance techniques, these analyses (25, 46) permit accurate quantification of activated voltage- and time-dependent conductances (30). Some aspects of this recently developed methodology have been described previously (24-26).
METHODS
Animal preparation All experiments were performed on decerebrate
guinea pigs (300-400 g). The animals were anes- thetized initially either by an intraperitoneal injec- tion of urethan (ethyl carbamate, 1.2- 1 S g/kg) or, in a chamber and subsequently by mask, with di- ethyl ether or isoflurane. After tracheotomy, the general anesthetic state was supplemented if nec- essary or maintained by the administration of either inhalational agent. The animal then was placed in a stereotaxic head holder, and an extensive bilateral craniotomy was performed. The encephalon rostra1 to the superior colliculus was removed, with hem- orrhage being minimized by brief (- 3-min) ligation of both carotid arteries. Further anesthesia was not required. The rectal temperature of the animal was maintained with a heating pad at -37OC. In about one-third of the experiments, blood pressure was monitored from a cannulated carotid artery. Pan- curonium bromide was used in most of the exper- iments for muscle paralysis to provide improved conditions for stable intracellular recording. End- tidal CO2 was controlled at ~4-4.5% by artificial respiration.
Electruphysiological recording About 2 h after discontinuation of anesthesia,
entry of the microelectrode was facilitated by a small tear opened in the dura of the middle fossa overlying the maxillary or mandibular portions of one tri- geminal ganglion. The indifferent electrode was in- serted into the dorsal muscles of the neck or the adjacent subcutaneous tissues. The microelectrode was fixed to a mechanical micromanipulator and connected to a conventional amplifier for sensing the intracellular voltage and providing the current injection (WP Instruments, model 701). Impale- ment of a neuron, presumably its soma, in the pos- terolateral region of the ganglion was accomplished using a glass microelectrode containing 3 M KC1 (tip resistances 10-80 MQ). Neurons were selected for study which initially had resting membrane po- tentials more negative than -50 mV and which were able to generate action potentials of at least 60 mV amplitude in response to injections of depolarizing
current pulses. The experimental arrangement for recording, current injection, and data acquisition is shown in Fig. 1.
Input waveform, frequency and data acquisition
spectrum,
For the frequency-domain studies presented here, an oscillatory input current [I(t)] was applied in- tracellularly to the cell in order to measure its com- plex impedance (2). This input current had the form
I(t) = a sin(bt’ + d) (1)
a “ZAP function” [ZAP = impedance (2) amplitude profile], where a is the peak amplitude of the current and 6, c, d are empirically assigned constants (Fig. 2A). The values of these constants were chosen such that the frequency spectrum of the waveform was relatively smooth in a restricted range of frequencies (Fig. 2C). The complex-valued impedance function is defined by
z = FFT of voltage response FFT of current input
= G-4 + jZim+w (2)
where FFT means a fast Fourier transform (3), and Ltl and Zimaginary are the real and imaginary com- ponents with j = fi. The ZAP function (or input current) was used to generate an “impedance am- plitude profile” (impedance magnitude function) from the neuron (e.g., Fig. 4A). The ZAP function was comprised of 1,024 discrete time points in order to use an FFT algorithm in the computerized anal- ysis of the data. In the majority of experiments, these discrete time points were spaced 200 ps apart.
The calculated ZAP function was stored in a PDP 1 l/23 processor (Digital Equipment), which was used as the front end processor for the data acqui- sition system (Fig. 1). Once this processor was loaded with the ZAP function, only the amplitude and the output clock rate were changed. The am- plitude of the input current was adjusted to keep the perturbation of membrane potential between l-5 mV peak-to-peak (e.g., after accounting for the voltage response of the electrode, -2.4 mV in Fig. 2B). In some experiments, the ZAP function was inverted, or reversed in time, such that the validity of linear superposition of the cell’s voltage response could be examined.
The digitized input current waveform was deliv- ered to a digital-to-analog (D/A) converter at the specified clock rate. The 12-bit output voltage of the D/A converter was low-pass filtered and fed into the WPI amplifier, which was connected to the mi- croelectrode. The ZAP function had a theoretical range of 4.883 Hz to 2.5 kHz in the frequency spec- trum. However, in practice slightly less than the lower half of this range was used, the range of fre- quencies in the ZAP function being limited to a

998 PUIL, GIMBARZEVSKY, AND MIURA
i D/A --:-,
; D/A -I
Acqulsltiurl ;
r : System i
. . . . . . . . . . . . . . * . . . . . . . . . . . *.. . . . . . . . 4 4 V out
Bd out
73 Isolation -
Unit l!Y a: ml+
(UK/
FIG. 1. Schema of electronic hardware for stimulation, intracellular recording, and data acquisition from trigeminal ganglion neuron, Oscillatory functions generated within PDP computer system were converted to current waveforms with a digital-to-analog converter (D/A) of the data acquisition system (DAS, outlined by broken lines), delivered to a WPI amplifier, and then to the cell. Neither bridge balance nor capacitance compensation was employed to offset the impedance properties of the microelectrode when used for frequency-domain analysis. The voltage response of the electrode-cell system was summed upon entry into the DAS with a calibrated offset voltage and then digitized by an analog-to-digital converter (A/D). Voltage responses were averaged by the PDP 1 l/23 processor and sent to the host PDP 1 l/34 computer for further processing. Data storage was in both analog and digital forms for off-line analysis by the PDP 1 l/34 and array processors. Measurements also were made for time-domain analyses by inclusion of three switches at the WPI amplifier stage for “enabling” a stimulus isolator, bridge balance, and capacitance compensation (not shown).
maximum of - 1 kHz (Fig. 2C). This limitation tenuation of the low-pass filter was chosen to be allowed the use of noncritical low-pass filters, since - 18 dB/decade at 2.5 kHz. with a 1.5kHz “guard band,” the first frequency Before the input current was injected into the that would alias into the frequency spectrum of the cell, resting membrane potential was measured at response signal was 4 kHz. Thus, the stop-band at- low gain. This value then was used to compute an
Frequency (Hz)
FIG, 2. Variable-frequency oscillatory waveforms representing the input current (A) recorded from the D/A converter of the DAS, and output voltage response (B) from a neuron are shown with their corresponding power spectra (C and D, respectively). The response in B to the input ZAP function ofA was the membrane voltage recorded from a neuron with an input resistance of - 6 MO in series with a 26MQ microelectrode; i.e., the voltage response of the electrode has not been subtracted from the record. The input power spectrum in C shows an approximately exponential distribution of amplitudes with increasing frequency, ensuring more power in the low-frequency region (<250 Hz).

MEMBRANE PROPERTIES OF TRIGEMINAL NEURONS 999
offset voltage such that the resting membrane po- tential would be centered in the middle of the an- alog-to-digital (A/D) conversion range.
Data from experiments were recorded in analog form on a tape recorder (Hewlett-Packard model 3968A) or initially were digitized using a data ac- quisition system (DAS) and then stored on magnetic tape (Fig. 1) With oscillatory input current, the bridge-balance technique and capacitance com- pensation were not used; the voltage response of the electrode-cell system was sampled by a 12-bit A/D converter simultaneously with the generation of this current waveform. When current pulses were used for comparative studies in the time-domain, the unity gain output signal of the WPI amplifier was fed into a bridge-balance circuit where it was summed with the balance output of the WPI am- plifier (Fig. I). The output from the WPI amplifier (in the case of oscillatory input current or from the bridge-balance circuit in the case of current pulses) monitored by the oscilloscope was fed through a low-pass filter and into the input amplification cir- cuit of the DAS. This stage of the DAS consisted of a summing amplifier that added an offset voltage to this input signal. The signal then was led via a variable gain amplifier (range 1-100X), subject to sample and hold commands, into the A/D con- verter. The offset voltage range (& 128 mV) was used to shift the membrane potential values so that the neuronal voltage response to the ZAP function could be recorded in a voltage range that was sym- metric about 0 mV.
The DAS was controlled by the PDP 1 l/23 pro- cessor through a l&bit parallel interface. This pro- cessor translated high-level commands from the PDP 11/34 host computer (Digital Equipment), which specified measurements of voltage, changes in ZAP-function amplitude, etc., into the correct sequence of commands to the DAS required to im- plement the particular experimental operation.
Dais collech~ procedures Sixteen values of membrane potential were mea-
sured and averaged over a 3.2-ms period before the start of each current application (which was repeated up to 24 times in each cycle; a cycle lasted for 5 s). Averages of voltage responses and normalization of raw data were performed by the PDP 1 l/23 com- puter.
The voltage response, consisting of 1,024 digitized points transmitted to the PDP 1 l/34, was converted to the frequency-domain by use of FFTs. The impedance magnitude of the cell (cf. Fig. 4A) was calculated by dividing the output frequency spec- trum by the input frequency spectrum (cf. Fig. 2, C-O), yielding the complex impedance, and taking its magnitude [[Z] = (I& + Zfm,g,,,)“]. The cal- culation time required by the PDP 1 l/34 program allowed the generation of one impedance function
with estimates of electrode and membrane prop- erties at the end of every cycle. Within this cycle time, 24 ZAP functions were applied, although usually only 20 averaged responses were recorded in order to ensure that the sampling occurred during periods of voltage stability, i.e., recordings were free from interfering action potentials or artifacts.
On-line and of-line data analysis procedures Digitized records of each experiment contained
voltage responses, calibration values, values of rest- ing membrane potential, and other relevant vari- ables. During the experiments, impedance magni- tude functions (displayed visually) and estimates of electrode resistance (R,), input resistance (Ri), and input capacitance (Ci) were computed on-line and stored on magnetic tape. These rough estimates were used as initial guesses for more accurate parameter estimations off-line. The algorithm used for these on-line approximations was to estimate the total resistance, RT = R, + &, from the impedance mag- nitude function at low frequencies. The equation for the impedance magnitude function then was rewritten such that it was linear in the square of the frequency; this allowed estimation of the remaining parameters using a linear least-squares procedure (the latter linearization procedure is not justified statistically). The above estimation algorithm was inappropriate for cells that exhibited resonance in their impedance magnitude functions, but permit- ted rough estimations of R, and Ri (and Ci) for ad- justment of the ZAP-function amplitude. The same algorithm was employed for estimation of electrode capacitance prior to penetration of a cell. Electrode capacitance usually was found to be negligible (~2 pF) and therefore not included in the fitting models.
Upon withdrawal of the electrode from a neuron, the impedance magnitude function for the DAS and electrode in presumed extracellular space became flat over the entire frequency range (5- 1,000 Hz), and usually equal in magnitude to the previously computed values for R,.
Voltage-response data were read from digital tapes off-line for recomputation of the complex- valued impedance function, Z. Each complex impedance function was displayed graphically as a plot of real (resistance) and imaginary (reactance) components, i.e., as an impedance locus diagram or Cole-Cole plot (12). Cells were classified accord- ing to whether their impedance data were best fitted by a model comprised of three or five parameters using a nonlinear least-squares procedure consisting of a grid search method (2). These computations were performed on an array processor (Computer Design Associates, MSP-3000).
Membrane models Three different model representations of the
neuronal membrane are given by 1) an equivalent

1000 PUIL, GIMBARZEVSKY, AND MIURA
electrical circuit (Fig. 3B), 2) the Hodgkin-Huxley where I(t) is the applied current and Ic, IA, IL are (HH) equations (30), and 3) the Goldman perme- the currents flowing in the capacitive, resistive, (R,), ability model (27). All three of these are based on and inductor-series-resistance branches, respectively different assumptions and various levels of physi- (see Fig. 3B). (This is simply Kirchoff’s law.) For a ological conformity. In the APPENDIX we show that voltage Jr across each branch of the circuit (repre- a linearized analysis of each of the above models senting the membrane potential), the currents Ic, results in complex impedance functions [Z(o)], IR, and IL satisfy which have the same functional dependence on fre- quency. Thus, determination of the values of the parameters in the general complex impedance
I&t) = Cid V/dt
function come from fitting the data, and a distinc- tion between the models must come from a more LdIJdt + RLIL = V (6)
explicit interpretation of these models in a physi- ological context. The “linearizations” of the HH and Goldman equations are mathematical linear- izations and & not correspond to assuming time- invariant membrane properties.
The standard representation of neuronal mem- brane is an electrical circuit. For a passive mem- brane, the electrical circuit is given by a parallel RC circuit (see Fig. 34. One of the simplest represen- tations of an adve neuronal membrane with one active component is a generalization of the RC cir-
Note that for constant circuit elements, Eqs. 3-6 are linear constant coefficient equations in the cur- rents and voltage. For a purely sinusoidal applied current I(t) = I exp(jot) at frequency w in radians per second (where w = 2rf) and a corresponding voltage response Y(t) = Y exp(jwt), the complex impedance fitting function is easily computed to be
Z(0) = voltage response applied current
t cuit in which a resistor and inductor in series are =-
added in parallel to the parallel RC circuit (Fig. i 39. Note that whereas the parallel resistance (R,) I and capacitance (Ci) branches of the electrical circuit = R, +
GL. (7)
have physiological interpretations, the inductor-se- G, + j&i + -
ties-resistance branch may be considered simply an 1 + jc37,
electrical circuit analog of the active component of where the series electrode resistance has been added, a membrane conductance, since a true inductor G, = l/R, and GL = 1 /R,. The relaxation time (7,) may not exist in the membrane. for the unknown membrane conductance is related
With constant circuit elements, the linear model to inductance (L) and inductor-series-resistance (RL) equation for the current is given by bY
L =- I(t) = Ic + IR + Ir. (3)
TU
RL (8)
A B
FIG, 3, Equivalent electrical circuit models for neurons. Both models include a series electrode resistance (R,) but not an electrode capacitance. The “active” model in B possesses a series resistance (Rt) and inductor (L) branch, which is in parallel with the “passive” RiCi model in A.

MEMBRANE PROPERTIES OF TRIGEMINAL NEURONS 1001
For a more general applied current, P and 17 are replaced by the Fourier transforms of the applied current and voltage response, respectively, but the frequency dependence remains unchanged.
For RL - 00, the circuit in Fig. 3B becomes the simple RC circuit in Fig, 3A, and the explicit fre- quency dependence of the fitting function is given by
Z(w) = R, + & . wRi2Ci
- 1 + 02R.2C.2 J 1 + a2Ra2C2 (9) 1 1 1 1
Neither the HH nor the Goldman permeability in- terpretations were used in the three-parameter case because they are identical to the case of the para- digm consisting of constant circuit elements.
In their famous paper, Hodgkin and Huxley (30) gave a linearized version of the HH equations, which has served as the basis for more recent studies of the active electrical properties of the membrane of the squid giant axon (cf. Refs. 21, 44). We note that in the HH model, time- and voltage-dependent conductances replace the constant inductance and series resistance branch in the simpler equivalent circuit model.
The use of linearized equations introduces two difficulties: 1) in the voltage-clamp paradigm, there are technical difficulties, and 2) the identity and properties of the major ionic channels in the mem- brane are not known a priori. The first difficulty is obviated by considering the membrane-potential equation, and the second requires a generalization of the linearized HH equations (see APPENDIX).
For a small injected current that passes through the membrane, the linearized HH equations be- come (see Eqs. 35 and 36 in Ref. 30)
WV) I(t) = c 7 + (&mo3ho + &no4 + gi)AV
+ 4&no3( V. - v,)An (10)
Wn) 1 dn An >AV--,
dl =T,dV 7,
ffn 1 n, = -
an + Pn ’ 7, - ~
an + Pn ’ (10
where rn have let
and dn,/dV are evaluated at VO, and we
V= V,+AV, m=mo+Am,
h = ho + Ah, n = no + An
with VO, mo, ho, ~2~ equal to the values of V, m, h, and y2 at the resting state of the membrane potential. The quantities AV, Am, Ab, and An are the per- turbations from these resting values. Relaxation equations for Am and Ah are similar to Eq. Il. The complex impedance function for this linearized HH
model is identical to Eq. 7 but with different inter- pretations of the coefficients (see APPENDIX).
A more accurate description of ionic current flow through neuronal membrane, which accounts for extracellular and intracellular ionic concentrations, is given by a constant-field membrane model (27, 31). The applied membrane current is given by a generalization of Eq. 3 (see Eq. A. 1 in APPENDIX). The membrane currents now are given by
Ii = -IhlFPiV ci - p&iv
’ 1 - k-w (13)
with fl: = ziF/RT where zi, F, R, T are the valence of the ith ion, the Faraday, the gas constant, and the temperature, respectively; Pi is the membrane permeability to the ith ion, and C! and CF are the intracell ular and extracell ith ion, respectively.
ular concentrations of the
In the HH and Goldman interpretations of Eq. 7, all but one of the ionic conductances are assumed to be constant. Thus, G, is the time-invariant part of the membrane conductance, and CL is that part activated by perturbation of membrane potential with the ZAP current. In this case, the sum of the conductances (G, + GL) is the input conductance (GJ of the cell, and the input resistance is given by Ri = 1 /Gi l In the HH and Goldman interpretations of E’q. 7, 7, is the relaxation time constant for the conductance and permeability, respectively.
Initial estimates for the parameters of each fit were obtained automatically from the rough esti- mates calculated on-line during the experiments in the case of the three-parameter model (single time constant model), but were guessed in the case of the five-parameter model. A nonlinear least squares fitting procedure (2) was used to fit the above com- plex impedance functions to the data points in the impedance locus diagram. Such a fit of the full set of 200 data points would yield a single estimate of the three or five parameters. In order to obtain an indication of the variation in the values of these parameters as a result of experimental error, we used a modification of the bootstrap statistical method (19) for determinations of the distributions and mean values of the parameter estimates. Our mod- ified bootstrap method utilized a random selection of 100 of the 200 data points (with replication al- lowed) in the impedance locus diagram, and then, a nonlinear least squares fit of the five-parameter model to these 100 points was made. This procedure was repeated for a minimum of 2,000 bootstrap samples or until no further increases in the range of estimated values were obtained.
In order to have some confidence in the modified bootstrap procedure used here, we have applied the true bootstrap procedure (i.e., randomly selected 200 points from the available 200 data points al- lowing replication) and a cross-validation procedure (cf. Ref. 19) to three of the cells listed in Tables 1

1002 PUIL, GIMBARZEVSKY, AND MIURA
and 2. The confidence limits obtained with the
increased. The cross-validation procedure chooses
modified
100 of the 200 data points, and a fit of the three-
and true bootstrap procedures approached identical values as the number of bootstrap samples
within 5%. The precision of the estimates, i.e., the reproducibility of an
RESULTS
estimate upon surements, was withi n 1%.
repeated mea-
or five-parameter model to these 100 data points is made. This provides information as to how well the curve fit predicts the remaining 100 data points. The averaged error between the predicted values and the excluded data points is the prediction error (19). The distributions of the sum of squares error of the fit and the prediction error did not differ sig- nificantly in the three cases.
The accuracy and precision of the FFT meth- odology were checked by the application of the ZAP function to various electrical networks comprised of resistors and capacitors with values approximat- ing those of the resistances and capacitances of electrodes and neurons. (It was not practical to in- corporate inductors in such networks because of the large values of required inductance.) For the model with a single time constant, accuracy for the estimation of the three electrical components was
In the development of the methodology de- scribed herein, measurements of complex impedance were made on -250 neurons. The results presented here were selected from this pool and are based on data obtained from 105 trigeminal ganglion neurons with resting membrane potentials of -50 to -80 mV (typ- ically -55 to -65 mV). All of the neurons initially displayed action potentials of 60-90 mV amplitude (typically 60-70 mV) in re- sponse to intracellular injections of depolar- izing current pulses (using bridge techniques; cf. Figs. lo- 12). The physiological state of the recorded neuron was evaluated on the basis of resting membrane potential, spike height (and shape), repetitive firing, and changes in
200 600 1000
Frequency (Hz)
Resistance (Ma) 20 22 24
f/ I I I I no 0 I L ’
FIG. 4. Experimental and theoretical impedance functions for a neuron (cf. cell no. 5 in Table 1). A: impedance magnitude function vs. frequency. Smooth cuwe is a nonlinear least-squares fit of an impedance magnitude function computed for model A (Fig. 3). B: the same data (200 points), which represent responses to 20 ZAP functions, are shown as an impedance locus diagram. The complex impedance (smooth cuwe) is approximately a semicircle with center on the resistance axis.

MEMBRANE PROPERTIES OF TRIGEMINAL NEURONS 1003
TABLE 1. Summary of membrane properties for six neurons with simple electrical behavior
Cell No. ci, PF Ri, mQ 7 rn7 ms
1 74-t 5 8.1 ztr 0.4 0.6 * 0.1 2 142 I!I 29 7.3 t 1.0 1.0 k 0.3 3 153 * 10 7.6 t 0.4 1.2 k 0.2
4 183 k 13 5.0 t 0.3 0.9 Y!z 0.1 5 202 4 16 4.1 k 0.3 0.8 t 0.1 6 319 k 32 4.2 + 0.3 1.4 t 0.2
Electrodes used for these cells had mean resistance of 27.1 MS2 (range, 11.9-46.2 MQ). Results are expressed as a mean k SD for 95% confidence limits derived from probability density functions based on bootstrap estimates. Each impedance magnitude function from which >2,000 bootstrap samples were drawn was calculated from 6 to 140 average voltage responses of a neuron. Mean value of resting membrane potential was -60 mV with a SD of 11 mV. Ci 7 input capacitance; Ri , input resistance; rrn, mem- brane time constant.
input resistance. Many cells, when tested at - lo-20 min after their impalement, contin- ued to generate spikes. However, some neu-
rons failed to generate action potentials when depolarized with injection of current pulses at this time (- 10 min or more after impale- ment), while showing no ancillary evidence of injury; indeed, such cells often displayed 5- 10 mV of hyperpolarization and a 5-20% in- crease in input resistance at the time of pu- tative “injury”.
Neurons with simple (passive) electrical behavior
Regardless of continued spike generation, a minority (~25%) of the neurons (24/105) ex- hibited impedance magnitude functions (Fig. 4A), which could be fitted closely by a theo- retical impedance magnitude function com- puted for a resistance in series with a parallel RC circuit model. The impedance locus dia- gram, yielding the impedance magnitude function, was approximately a semicircle with center on the resistance-axis (Fig. 4B). The semicircular fit was computed using the pa- rameter values which were estimated from the impedance magnitude function as initial
TABLE 2. Summary of membrane electrical pruperties in 20 trigeminal ganglion neurons with resonance in their impedance magnitude functions
Cell NO.
1 205 (-45,95) 2 121 (-18,40) 3 185 -+ 48 4 115 k 16 5 160 k 21 6 167 k 30 7 138 k 31 8 259 -+ 36 9 186 122
10 146 k 22 11 104 * 16 12 71k 5 13 72k 5 14 102 k 12 15 76k 19 16 98k 13 17 119zk 9 18 66k 6 19 86+ 10
20 109k 7
4.5 (-1.9, 5.5) 8.0 (-1.6, 10.1) 9.3 (-3.5, 6.2)?
14.5 (-3.7, 12.4) 9.1 (-1.6, 6.1) 4.8 (-1.0, 2.1) 9.8 (-3.6, 12.0) 7.1 (-2.2, 10.0)
11.3 (-3.3, 14.4) 11.4 (-4.2, 12.8) 16.3 (-5.1, 14.5)*
25.8 (-5.4, 13-O)*
19.4 (- 1.9, 4.4) 6.4 I 0.5
13.0 k 2.6 9.8 f 2.7
11.2 k 1.6 17.4 k 2.9
7.8 t 1.3 9.9 f 1.5
1.6 k 1.1 7.8 k 2.1 2.7 (-0.9, 1.7) 5.7 (-1.0, 2.2) 8.0 (-1.8, 4.4) 7.7 zk 3.7 4.5 k 2.2 3.7 k 1.3 3.9 ~fi 0.8 3.3 k 0.9 6.2 k 1.2*
11.7 2 2.9 11.8 k 2.0
7.1 (-1.8, 3.7) 15.2 (-9.0, 34.O)t
8.8 (-2.2, 7.6) 12.1 -+ 4.5 12.5 -+ 2.0* 17.8 k 7.6 11.9 k 2.1
1.1 (-0.9, 0.5) 2.4 (- 1.4, 3.4)? 3.9 f 0.7 1.6 (-0.8, 1.4) 2.0 t- 0.5 0.4 (-0.2, 0.5) 4.1 k 0.6 1.2 k 0.6 4.2 k 0.7 2.2 k 1.0” 2.7 (-2.1, 0.8) 2.6 (-1.7, 3.7)” 3.0 k 1.0 1.6 (-0.9, 1.6) 2.4 k 0.4 1.2 k 0.5 2.9 k 0.5 1.7 k 0.7 2.6 k 0.6 1.3 * 0.7” 4.4 k 0.7 1.0 -t 0.5 8.1 1 1.4 1.5 k 0.5 7.4 (-1.1, 2.2) 3.2 k 1.4
3.4 z!I 0.7 4.1 (-1.5, 2.4) 6.4 k 1.97 9.3 (-7.0, lO.Oyf 4.6 2 0.8 1.3 k 0.8 5.8 (- 1.7, 0.9) 2.5 (-1-2, 2.8)
7.3 (- 1 .o, 2.0) 1.6 I!I 0.5 5.4 t- 0.4 0.9 f 0.5 5.4 4 0.3 1.4 * 0.4
0.9 (-0.5, 1.3) 1.0 (-0.4, 2.2) 1.8 (-1.2, 4.9) 1.8 (-0.7, 3.9) 1.5 (-0.4, 1.0)
0.8 (-0.3, 0.5) 1.4 (-0.7, 1.9) 1.9 (-0.8, 3.3) 2.2 (-0.9, 2.9) 1.7 (-0.9, 2.1) 1.8 (-0.9, 4.2) 1.9 (-0.7, 2.0) 1.4 r!z 0.2 0.7 4 0.1
1.0 k 0.4 1.0 k 0.4 1.3 k 0.3 1.1 * 0.3 0.7 k 0.2 1.1 & 0.2
Results (including A;, which was computed for the parallel RLC-circuit model of Fig. 3B) are expressed as a mean f SD for 95% confidence limits derived from probability density functions based on bootstrap estimates. In cases where distribution of values about the mean is not symmetrical, the deviations below and above the estimated values are given in parentheses. Each impedance locus
diagram from which >2,000 bootstrap samples were drawn, was calculated from 4 to 200 averaged voltage responses of a neuron. For each neuron, this procedure required -2.5 h of computations with an array processor. Electrodes used for the 20 cells had a mean resistance of 28.4 Ma (range, 17.9-4 1.1 MQ). Mean value of resting membrane potential was -60 mV with a SD of 9 mV. Ci 7 input capacitance; R,, resting resistance; RL, inductor-series-resistance; Ri, input resistance; rU, conductance (GL) time constant; TV, membrane time constant. * 90% confidence limits; t 80% confidence limits.
1004 PUIL, GIMBARZE VSKY, AND MIURA
2 - c
z 0
8
s
-2
I’u : -4
p1 -6
200 600
Frequency (Hz) 200 600
Frequency (Hz)
4 D r Resistance (Ma)
.
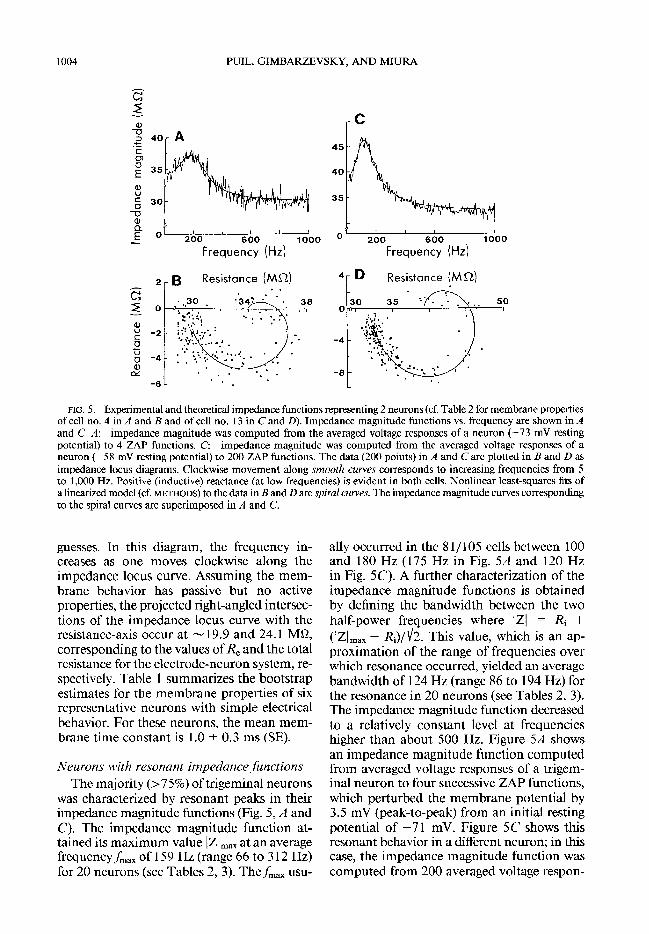
FIG. 5. Experimental and theoretical impedance functions representing 2 neurons (cf. Table 2 for membrane properties of cell no. 4 in A and B and of cell no. 13 in C and D). Impedance magnitude functions vs. frequency are shown in A and C. A: impedance magnitude was computed from the averaged voltage responses of a neuron (-73 mV resting potential) to 4 ZAP functions. C: impedance magnitude was computed from the averaged voltage responses of a neuron (-58 mV resting potential) to 200 ZAP functions. The data (200 points) in A and C are plotted in B and D as impedance locus diagrams. Clockwise movement along smooth czuws corresponds to increasing frequencies from 5 to 1,000 Hz. Positive (inductive) reactance (at low frequencies) is evident in both cells. Nonlinear least-squares fits of a linearized model (cf. METHODS) to the data in B and D are spiral curves. The impedance magnitude curves corresponding to the spiral curves are superimposed in A and C.
guesses. In this diagram, the frequency in- creases as one moves clockwise along the impedance locus curve. Assuming the mem- brane behavior has passive but no active properties, the projected right-angled intersec- tions of the impedance locus curve with the resistance-axis occur at - 19.9 and 24.1 MQ, corresponding to the values of R, and the total resistance for the electrode-neuron system, re- spectively. Table 1 summarizes the bootstrap estimates for the membrane properties of six representative neurons with simple electrical behavior. For these neurons, the mean mem- brane time constant is 1.0 $- 0.3 ms (SE).
Neurons with resonant impedance functions The majority (>75%) of trigeminal neurons
was characterized by resonant peaks in their impedance magnitude functions (Fig. 5, A and C). The impedance magnitude function at- tained its maximum value IZI,,, at an average frequency fmax of 159 Hz (range 66 to 3 12 Hz) for 20 neurons (see Tables 2, 3). The fmax usu-
ally occurred in the 8 l/ 105 cells between 100 and 180 Hz (175 Hz in Fig. 5A and 120 Hz in Fig. 5C). A further characterization of the impedance magnitude functions is obtained by defining the bandwidth between the two half-power frequencies where IZl = Ri +
(14 - Ri)/ fie This value, which is an ap- prozzation of the range of frequencies over which resonance occurred, yielded an average bandwidth of 124 Hz (range 86 to 194 Hz) for the resonance in 20 neurons (see Tables 2, 3). The impedance magnitude function decreased to a relatively constant level at frequencies higher than about 500 Hz. Figure 5A shows an impedance magnitude function computed from averaged voltage responses of a trigem- inal neuron to four successive ZAP functions, which perturbed the membrane potential by 3.5 mV (peak-to-peak) from an initial resting potential of -7 1 mV. Figure 5C shows this resonant behavior in a different neuron; in this case, the impedance magnitude function was computed from 200 averaged voltage respon-
MEMBRANE PROPERTIES OF TRIGEMINAL NEURONS 1005
Resistance (Ma) 0
Resistance (Ma)
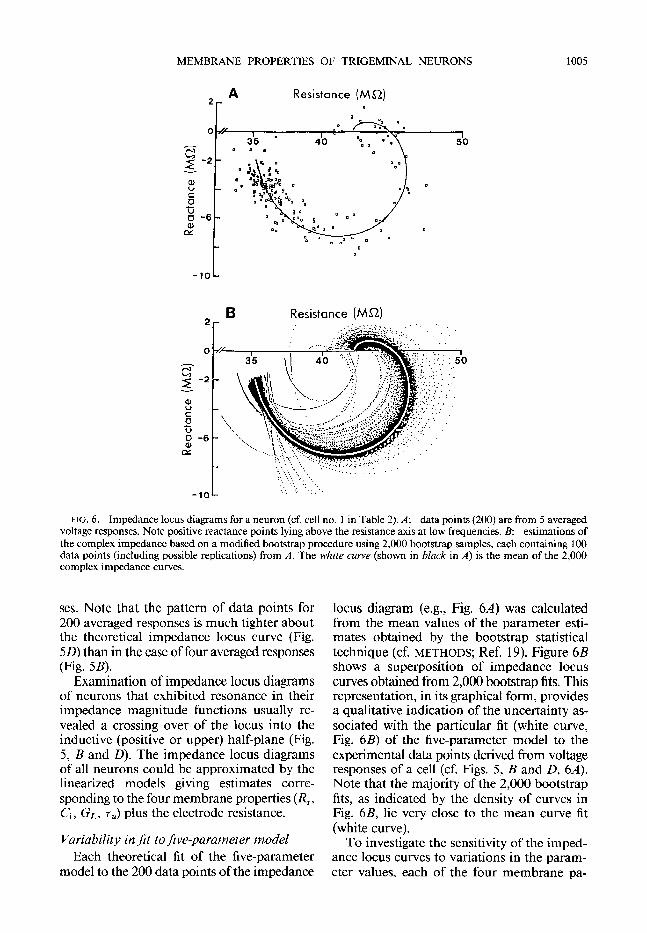
FIG. 6. Impedance locus diagrams for a neuron (cf. cell no. 1 in Table 2). A: data points (200) are from 5 averaged voltage responses. Note positive reactance points lying above the resistance axis at low frequencies. B: estimations of the complex impedance based on a modified bootstrap procedure using 2,000 bootstrap samples, each containing 100 data points (induding possible replications) from A. The white curve (shown in black in A) is the mean of the 2,000 complex impedance curves.
ses. Note that the pattern of data points for 200 averaged responses is much tighter about the theoretical impedance locus curve (Fig. 5D) than in the case of four averaged responses (Fig. 5B).
Examination of impedance locus diagrams of neurons that exhibited resonance in their impedance magnitude functions usually re- vealed a crossing over of the locus into the inductive (positive or upper) half-plane (Fig. 5, B and D). The impedance locus diagrams of all neurons could be approximated by the linearized models giving estimates corre- sponding to the four membrane properties (R,, Ci, GL, 7,) plus the electrode resistance.
Variability in frt to Jive-parameter model Each theoretical fit of the five-parameter
model to the 200 data points of the impedance
locus diagram (e.g., Fig. 64 was calculated from the mean values of the parameter esti- mates obtained by the bootstrap statistical technique (cf. METHODS; Ref. 19). Figure 6B shows a superposition of impedance locus curves obtained from 2,000 bootstrap fits. This representation, in its graphical form, provides a qualitative indication of the uncertainty as- sociated with the particular fit (white curve, Fig. 6B) of the five-parameter model to the experimental data points derived from voltage responses of a cell (cf. Figs. 5, B and D, 64. Note that the majority of the 2,000 bootstrap fits, as indicated by the density of curves in Fig. 6B, lie very close to the mean curve fit (white curve).
To investigate the sensitivity of the imped- ance locus curves to variations in the param- eter values, each of the four membrane pa-

1006 PUIL, GIMBARZEVSKY, AND MIURA
L
I t 40 30
Resistance (MSZ)
FIG. 7. Clam-shell diagrams showing effects of parameter variations on the impedance loci. Doffed curve in each diagram corresponds to a nonlinear least-squares fit of experimental data (see Fig. 5B). Direction of increasing 1 parameter (while others are kept constant) is indicated by the number sequence, 1-4. A: Ci parameter was increased in 20-pF steps from 50 pF (curve I) to 250 pF. B: R, parameter was increased in 2.SMQ steps from 5 to 27-5 MR C: RL parameter was increased in 2.0-MQ steps from 2 to 24 MQ. D: 7, parameter was increased in 0.2-ms steps from 0.5 to 2.3 ms.
rameters (Ci , R,, RL , TJ was varied separately in uniform steps with a range bracketing the parameter values for cell 4 of Table 2 (Fig. 7). As expected, RL has the most pronounced ef- fect of the four parameters on the amount of positive reactance in the impedance locus dia- gram, Note that in the “clam shell” diagram given by Fig, 7C, there is no positive reactance portion of the impedance locus curve for val- ues of RL greater than ~8 MQ. This indicates that if the activated conductance is small enough, then the reactance is dominated by the capacitance. In this case, the bulge in the diagram disappears as RL is increased. For the other three parameters, an increase in their values is manifested in a shrinking (Ci) or ex- pansion (R,, TJ of the impedance locus curves. In addition, no positive reactance is evident with large values of Ci or small values of 7,.
Estimates of model parameters The estimates for each membrane param-
eter and their ranges of variability obtained by the fit of the impedance locus diagram using the five-parameter model were found quan- titatively for 20 neurons exhibiting resonance in their impedance magnitude functions, using the bootstrap procedure (Table 2). The large variation in the estimates of input capacitance (66-259 pF) is not unexpected in view of the variability in cell size and unknown sampling
3 a c - 506 1 I I I 1 1 I t
2 5 IO resistancy 40
Resting (lO”S2)
L- 3 00 B
eu =.,, t r0
‘.., ‘C ‘-... - 200
-+ ‘.. ‘.. ‘-..,
Q, 2 “A.. u ‘..
.= ‘A. “.
g Q 100
1 ..t
s “.., -L L
-
I
G- I
-‘. 3
--P ‘.A., ‘.. -... L
- sol 1 I 11 I I 1
1 2 Input5resisto2 20
(10%)
FIG. 8, Log-log plots relating input capacitance ( Ci) and resting resistance (R,) or input resistance (Ri) of 20 neurons with values (dots) and ranges (vertical and hori- zontal lines) listed in Table 2. A: dotted line corresponds to a linear least-squares fit of the curve CiR, = constant. Interpretation of this product as the membrane time con- stant results in a value of ~~ = 1.25 ms. B: dotted line (slope = - 1) corresponds to a linear least-squares fit of data.

MEMBRANE PROPERTIES OF TRTGEMINAL NEURONS 1007
bias, which was attributable partly to electrode tip size.
If one assumes that the larger values of input capacitance correspond to cells of larger di- ameter, then it is reasonable to expect a recip- rocal correlation between input capacitance and resting resistance or input resistance (Fig. 8). Because the membrane time constant equals the product of Ci and R,, a straight line fit (slope = - 1) of the log-log plot of the data for the 20 cells of Table 2 results in a mem- brane time constant, 7, = 1.3 ms (Fig. 8A). (The mean value of 7, from Table 2 is l-4 ms with SE = 0.2 ms.) A closer correspondence occurs between estimates of Ci and Ri for the same 20 cells of Table 2 (Fig. 8B). In this case, since Ci is proportional to cell membrane area and Ri is inversely proportional to the area, their product equals the product of the specific input capacitance and specific input resistance (see Table 3); again, a log-log plot of the data can be approximated by a straight line with slope = -1.
The reciprocal of the inductor-series-resis- tance values ( l/RL = GL) listed in Table 2 can be interpreted as the membrane conductances activated by perturbations of the resting membrane potential. For many of the 20 cells in Table 2, the estimates of activated conduc-
TABLE 3. Relationship of membrane properties to the peak impedance magnitude,
tance are comparable to the values of the time- invariant part of the membrane conductance ( l/R,). Furthermore, the relaxation time con- stants for the activated conductance (with the exceptions of cells 13 to 15) are comparable to the membrane time constants.
The fact that Ci/Ri is proportional to the square of the membrane area of the neuron leads to some interesting observations on the relationships between membrane properties and peak impedance magnitude (Table 3). An increase in the area seems to correspond to a decrease in the peak value of the impedance magnitude function and in the inductor-series- resistance, RL. We point out that from the theoretical calculations leading to the clam- shell diagrams for variations in Ci and RL (cf. Fig. 7, A and C), decreases in Ci and increases in RL result in an increase in ]ZI,, , as ob- served experimentally. On the other hand, there appears to be no correlation between cell area and the frequency (fmax) at the peak of the impedance magnitude function. However, theoretical computation of the natural fre- quency of the system, fn = [4LCi - (L/R, - RLCi)2]“/4rLCi (based on the estimated pa- rameters in Table 2, including damping) shows f max > fn for all neurons, except cell no. 3,
relative cell urea, and resonance characteristics
Cell No. IZI max7 MQ CiIRi 3 PF/MQ ci, PF RL, MQ fmax, I-Jz fn, l-Iz
12 18 13 15 19 20 17 16 11 4
14 2 5
10 6 9 3 8
13.8 8.7 11.5 9.0 14.7 9.7 12.1 11.9
5.9 15.9 6.9 20.2 8.4 20.5 6.7 21.3 7.7 23.6 7.3 28.0 5.8 30.0 5.9 31.0 6*4 38.1 6.0 46.0 5-7 56.2 4.1 61.9 6.0 64.1 2.6 92.5 3.6 107.9 3.4 186.3
71 66 72 76 86
109 119
98 104 115 102 121 160 138 146 167 186 185 259 205
11.7 12.5 11.8 15.2 17.8 11.9 12.1 8.8 6.2 5.7 7.1 7.8 8.0 4.5 3.3 7.7 3.9 2.7 3.7 1.6
155 142 165 142 114 91 66 51
154 132 137 116 103 79 176 149 201 187 192 178 122 41 152 121 112 93 178 159 214 198 116 54 149 137 312 322 156 147 202 171
Cj , input capacitance: Rj 9 input resistance; RJ + inductor-series-resistance,:J-,, frequency at jZ]ma,;J, natural fre- quency; lzlmax, maximum value of impedance magnitude function.

PUIL, GIMBARZEVSKY, AND MIURA
3mV
c--q/-- ,.,- 20 ms
FIG. 9. Membrane-potential responses of neuron (cf. cell no. 11 in Table 2) to hyperpolarizing current pulse. A: membrane potential response to a hyperpolarizing current pulse of 0.5 nA. B: theoretical reconstruction of membrane potential response of A using linearized membrane model equations. C residual membrane potential obtained by subtracting theoretical curve from experimental response,
Theoretical transformation time-dumain response
Gtf
A test for the precision of the theoretical estimates of the neuronal membrane proper- ties obtained from frequency-domain analysis is to reconstruct the cell’s membrane potential response to step currents in the time domain. This reconstruction was carried out for several cells (see Fig. 9 for cell no. 11 of Table 2). There is a close correspondence between the time evolution of the membrane potential, calculated theoretically (Fig. 9B), with the ex- perimental record obtained in the time do- main (Fig. 9A).
Comparutive behavior in time domain Neurons that had no resonance in their
impedance magnitude functions exhibited the single exponential behavior in the time do- main in their hyperpolarized voltage responses of lo-20 mV amplitudes to injected step cur- rents (Fig. 1 OB) as expected from a passive model. Such neurons did not exhibit off-re- sponses (e.g., a spike) following termination of a hyperpolarizing current pulse. The cur- rent-voltage relationship in the hyperpolariz- ing direction was approximately linear when measured over the lo- to 50-mV range (Fig. 1OC). These cells also showed no tendency to discharge repetitively when injected with de- polarizing current pulses.
The majority of the neurons that had sat- isfactory spikes and resonance in their imped- ance magnitude functions also did not exhibit simple electrical behavior when injected with step currents, at least during the first 10 min after the initial impalement. Time-dependent rectification was observed in responses to de- polarizing step currents that were subthreshold for the production of action potentials, as well as in responses to hyperpolarizing current pulses (Fig. 11). The initial depolarizing re- sponse was followed by a small sag in mem- brane potential (Fig. 1lA). In this regard, the rectification appeared to be similar to that ob- served in cultured dorsal root ganglion neu- rons (45). Some membrane potential record- ings of trigeminal root ganglion neurons ad- ditionally showed a depolarizing trend that continued for the duration of the injected step current (Fig. 1lA). A possible explanation of this trend is that slow changes in ionic con- centrations or conductances are occurring. However, there is the possibility that such trends are a consequence of time-dependent changes in electrode properties. When an ac- tion potential was elicited, a short-lasting ( 1.5- to 4-ms) afterhyperpolarization followed the spike (Fig. 1 lA, uppermost trace).
These cells also showed a time- and voltage- dependent sag in their membrane potentials when injected with a hyperpolarizing current (Fig. 11 C). This time-dependent rectification

MEMBRANE PROPERTIES OF TRIGEMINAL NEURONS 1009
50 mv (A)
25 mV (B)
20 ms
B
FIG. 10. Membrane-potential responses of neuron (cf. cell no. 4 in Table 1) in time domain. A: action potential evoked by a 7.6nA depolarizing current pulse B: voltage response as a function of time to 2.1-nA hyperpolarizing current pulse of 62 ms duration. Smooth curve is an exponential fit to voltage response. Membrane time constant was 1.2 ms, C: plot of current-voltage relationship shows linear slope resistance with large hyperpolarizing current pulses.
A 1
I 50 mV
20 ms
B 3.O-
nA O----
-3.o-
C
FIG. 11. Voltage responses from a neuron (cf. cell no. 4 in Table 2) showing effects of depolarizing (A) and hyper- polarizing (C) current pulses (cf. B). Rectification and overshooting of “off-responses” were evident with large depolarizing and hyperpolarizing current pulses. Increasing the magnitude of depolarizing current pulses evoked larger local responses of short latency (A) until threshold for an action potential was exceeded (1 l 1 times) in uppermost trace. Current pulse of maximum amplitude in the hyperpolarizing direction evoked time-dependent %ag” of membrane potential evident in C (cf. broken line for visual reference). Traces in B have been redrawn from original current monitor traces. Voltage calibration at top is for responses in A and C.

1010
A
PUIL, GIMBARZEVSKY, AND MIURA
1 1
20 ms
1
50 mv
2.6 nA I
C
II.
L FIG. 12. Voltage responses of a neuron (cf. cell no. 8
in Table 2) showing repetitive firing behavior elicited by 3 depolarizing current pulses. Single action potential was evoked using a current stimulus of 0.9 nA (not shown). Small increase in current stimulus resulted in appearance of second spike (A). Further increases in stimulus resulted in increasingly longer spike trams (B, C) until a maximum rate of firing of -300 Hz was attained (C). Traces below each voltage response have been redrawn from original current monitor traces.
was apparent from careful examination of voltage responses to step currents of 50- 100 ms duration, which &placed membrane po- tential by at least 10-20 mV, and was similar to that described for dorsal root ganglion neu- rons in vivo (13) and in vitro (45). Both the characteristic resonance and the sag of trigem- inal cells disappeared with intracellular injec- tions of strong constant hyperpolarizing cur- rent (not shown).
In most cases, the membrane potential did not return immediately to its resting value after termination of the hyperpolarizing step cur- rent but showed a rebound depolarizing over- shoot similar to that observed in other mam- malian neurons, notably cat spinal motoneu- rons (1, 33). Sometimes a spike occurred on top of the overshoot followed by an oscillation of membrane potential.
Repetitive firing characleristic In contrast to neurons that did not show
membrane rectification, those with resonance in their impedance magnitude functions, and showing depolarizing overshoots following their hyperpolarizing responses to current steps, displayed an ability to discharge action potentials in a repetitive manner. This was re- vealed by the intracellular application of su- prathreshold pulses of depolarizing current. An example of the repetitive firing character- istic is shown in Fig. 12. A single action po- tential was elicited with a just suprathreshold pulse of depolarizing current (0.9 nA; not shown). Further increases in the depolarizing current resulted in a train of action potentials with amplitudes that decreased after the first spike (Fig. 12). The maximum rate of dis- charge that could be elicited in the cell was -300/s (Fig. 12C). This maximum rate, typ- ical for neurons with resonance, appeared to be partly a consequence of the presence of a slow background oscillation in membrane po- tential and, partly the result of the presence of postspike afterhyperpolarization (cf. Fig. 12C). The maximum discharge frequency was ap- proximately the same as fmax in many cases, or was some integer multiple of the peak res- onant frequency of the neuron.
DISCUSSION
The necessity of accurate measurement of membrane impedances for the interpretation of the electrical behavior of invertebrate nerve has led to extensive studies using a frequency- domain analysis of small perturbations of membrane current. Such v01tage-cJmp ba- vestigations in squid axon, in particti@mw
facilitated a description of the linear kinetics of its active ionic conductances (cf. Refs. 10, 2 1). Our results, which were obtained from a frequency-domain analysis of membrane po- tential perturbations using a computer-inten- sive methodology, demonstrate for the first

MEMBRANE PROPERTIES OF TRIGEMINAL NEURONS 1011
time that an accurate characterization of membrane impedance may be obtained from vertebrate neurons, in vivo. The confidence that one may ascribe to the accuracy and pre- cision of these impedance measurements of trigeminal ganglion neurons partly results from the analysis of membrane potential re- sponses to near sinusoidal currents over a wide range of frequencies (cf. Ref. 34) using high- speed computers (cf. Ref. 2 1).
Comparison with time- domain measurements
The electrical properties of various sensory ganglion neurons have been assessed by many investigators using intracellular application of hyperpolarizing current pulses and subsequent measurements of the perturbations of mem- brane potential in the time domain (5, 13, 18, 22, 23, 28, 32, 35, 45, 52). The responses to current pulses have been interpreted on the basis of an equivalent electrical circuit model for the passive membrane, i.e., simple RC cir- cuit.
In the present investigation, only a small proportion of neurons studied could be mod- eled with this equivalent circuit. However, the estimates of input resistance for neurons with simple electrical behavior were within the same range as those for neurons with active behavior (cf. Tables 1 and 2). In general, the values of input resistance reported here are much lower than the estimates for Ri of var- ious types of ganglion cells in in vitro prepa- rations (23, 32, 35) or in tissue culture (5, 22, 29). The average of the estimates of input re- sistance in dorsal root ganglion cells obtained from in vivo investigations ( 13, 18) and in cer- tain identified classes of dorsal root ganglion cells in the pigeon (28) and mouse (52), fall within the range of estimates for input resis- tance reported here.
Similarly, estimates for input capacitance of trigeminal ganglion neurons (Tables 1 and 2) a-e cumpambk tu tliose determined for other types of ganglion cells (5, 23, 32, 35) including trigeminal root ganglion cells in tis- sue culture (22). These previous estimates were deduced from input resistances and membrane time constants obtained by using time-domain analyses in step-current experiments. In most cases, the assumptions are made that the small perturbations of the membrane potential fol- low a simple exponential time course and that activation of voltage- and time-dependent
conductances is negligible. Brown et al. (5) found, for mouse dorsal root ganglion neurons in tissue culture, that injections of hyperpo- larizing step currents resulted in membrane potential responses that could be fitted by a sum of two exponentials, thus leading to two time constants. These time constants were in- terpreted as the membrane time constant and the equalizing time constant, i.e., a measure of the time for the membrane to reach iso- potentiality upon local polarization of the membrane by the intracellular injection of current. In our step-current experiments on trigeminal ganglion neurons (e.g., those listed in Table l), we observed some membrane po- tential responses that could be fitted with a single exponential. It is not clear if this contrast with the results from cultured dorsal root gan- glion cells may be accounted for by certain differences in morphology such as differences in the initial tract of the axon attached to the nearly spherical cell body. For example, very large stem processes with diameters up to 15 pm have been observed in adult cat and mon- key dorsal root ganglia (50; cf. Fig. 1 of Ref, 5). It may be significant that cells of well maintained cultures of dorsal root ganglia do not develop axonal glomeruli (6), which are known to exist in trigeminal root ganglia. [See Lieberman (41) for further descriptions of morphological variations in sensory ganglion cells.] Differences in the estimates of the membrane time constants between our in vivo and the tissue culture preparations (5) may be accounted for by consideration of the larger values (- 10 times) of input resistance for dorsal root ganglion cells compared with the values reported here for trigeminal ganglion neurons. Since the corresponding input ca- pacitance values of the tissue culture cells are approximately half the values reported here, we conclude that the cell membrane areas of the dorsal root ganglion cells are approxi- mately half of those for the trigeminal cells. Ths, the longer membrane time constant (- 5 ms) in cultured dorsal root ganglion cells may result from the larger input resistances.
Active membrane properties and signiJicance of resonance
“Active” behavior such as inward rectifi- cation (45) also may be identified by following the perturbation of the membrane potential produced by a current pulse, particularly when current pulses produce a large displacement

1012 PUIL, GIMBARZEVSKY, AND MIUR4
of membrane potential (lo-20 mV). In such cases, estimates of the resting conductance may be misleading because of activation of voltage- and time-dependent ionic conduc- tances (30). Indeed, our results suggest that in the majority of cases, active properties of the membranes of trigeminal ganglion cell bodies can be measured even when the membrane potential is near its resting level. For this rea- son, and because of possible variations arising from differences in animal species, experi- mental conditions, microelectrode sampling bias, etc., the estimates of membrane prop- erties obtained in the previous investigations cited above are not strictly comparable with those obtained from trigeminal ganglion neu- rons by means of the frequency-domain methodology.
In the frequency domain, the active com- ponent in membrane behavior in trigeminal ganglion neurons is expressed in their imped- ance magnitude functions as a resonant peak; this was apparent in the impedance locus dia- grams as a bulge in the capacitive half-plane, or for most cells, as an inductive reactance. Over 20 years ago, Araki et al. ( 1, 33) postu- lated the existence of an inductive reactance, such as that demonstrated previously for squid axon (11; cf. Ref. 30) to explain the time-de- pendent rectification they observed in mam- malian motoneurons injected with hyper- polarizing current pulses. The majority of trigeminal ganglion neurons investigated ex- hibited active behavior in the time domain similar to that of motoneurons. In particular, many of the trigeminal neurons also showed an inductive reactance in the impedance locus diagram corresponding to analogous behavior in squid axon ( 10, 11,43) and lamprey spinal neurons (46). These observations suggest that this electrical behavior may be a basic property of many types of neurons. The possibility may not be ruled out, however, that the absence (or presence) of resonance in the impedance magnitude functions of trigeminal ganglion neurons determined near their resting mem- brane potentials or when the cells are depo- larized might be attributed indirectly to some damage to the membrane or be a consequence of an unusual positioning of the microelec- trode within the cell. In such cases, the ability of the neurons to fire action potentials would be impaired. In contrast to other trigeminal ganglion cells with resonance in their imped- ance magnitude functions, those neurons
without resonance often failed to discharge in a repetitive manner in response to injections of suprathreshold depolarizing current pulses.
A consequence of membrane resonant be- havior appears to be a restriction of the range over which a cell would discharge spikes re- petitively in response to an applied constant current. For example, the application of a de- polarizing current to a space-clamped squid axon will evoke a train of action potentials at a frequency which is close to the “subthresh- old” natural frequency of - 100 Hz (44). This frequency corresponds approximately to the peak resonant frequency in lamprey spinal neurons at depolarized levels (< 100 Hz; 46) and in the impedance magnitude functions of a majority of trigeminal ganglion neurons at their resting membrane potentials (fmax - 1 OO- 180 Hz); cf. Table 3). The higher fmax in tri- geminal neurons can be attributed to the dif- ferences in resting membrane potential and the higher temperature of mammals as com- pared to invertebrates (44).
The relationship of the resonant frequencies of the trigeminal neurons to membrane po- tentials that approach the firing thresholds was not investigated systematically, although it was apparent that the resonance was strongly volt- age-dependent. The importance of the fre- quency-voltage relationship in the entrain- ment of spike discharge near the peak resonant frequency has been emphasized in the case of frog node of Ranvier (4, 8) and in the case of heart cells (9). Thus, at a given subthreshold membrane potential, the impedance magni- tude function of a trigeminal ganglion neuron exhibiting resonance may be considered anal- ogous to those of certain band-pass filters (cf, Refs. 14, 46) based on an RLC circuit and possessing a low quality factor. According to this analogy, the voltage responses generated by input currents with frequencies quite dif- ferent from the resonant frequencies would be attenuated relative to the voltage responses to input currents with frequencies nearf,, . Such a resonant system, while experiencing a rela- tively low energy loss, would verge on damped oscillation. These natural frequencies of os- cillation (cf. Table 3) have been determined mathematically from the linearization of the HH equations (30) for squid axon and in other equations for the node of Ranvier (3, 14, 17).
Our results, obtained with small oscillatory perturbations of membrane potential, suggest that the use of the ZAP function in a fre-

MEMBRANE PROPERTIES OF TRIGEMINAL NEURONS 1013
quency-domain analysis of the membrane electrical behavior of neurons may be a more sensitive indicator of active properties than step-current measurement techniques. One might predict that the active component in the membrane would influence the cablelike properties of mammalian neurons that have extensive dendritic arborization (cf. Ref. 49). Such contributions may not be always evident from a time-domain analysis of responses to applied current pulses. Complex impedances corresponding to a model comprised of a dis- tributed capacitance and resistance in parallel, as in the case of spinal motoneurons (42, 47), is no assurance that active properties, however small, do not exist. For example, some tri- geminal ganglion neurons with relatively large values of the time-invariant conductance ex- hibited no inductive reactance in their imped- ance locus diagrams, but these diagrams were closely approximated by the equivalent circuit (Fig. 3B) or linearized models. The estimates of Gr in these neurons were associated with small values of GL, the membrane conduc- tance activated by the oscillatory perturbations of membrane potential. In squid axon (7, 44, 48) and in lamprey spinal neurons (46), the inductive reactance has been attributed to time- and voltage-dependent activation and inactivation of certain ionic channels in the membrane. The demonstration that the in- ward rectification in cultured dorsal root gan- glion cells of the mouse is mediated by Na+ and K’ currents (45) raises our expectations that the voltage responses of trigeminal gan- glion neurons to current inputs, which we have observed in both the time- and frequency do- mains, may be a consequence of similar ionic mechanisms.
APPENDIX
To generalize the HH and constant-field equa- tion, we note that the applied membrane current [1(t)] is equal to the sum of the capacitive current and the currents carried by the cations and anions
dV I(t) = c dr + z Ii + MgN Ii (A-0
i=l i=M+ 1
wherei= 1,. . . , M corresponds to M cations andi=M+ 1,. . . , M + N corresponds to N anions. This generalizes Eq. 3 for the electrical cir- cuit model and Eq. 10 for the I-IH equations. A generalization of the current for the ith ion in the HH and constant-field models is given by
where qi generalizes the conductance in the HH model and the permeability in the constant-field model. The function I& depends only on the mem- brane potential I/ and is parameterized by Cp, C;, and zi, which correspond to the extracellular and intracellular concentrations and valence of the ith ion, respectively.
We assume that the qi depend on L - 1 auxiliary variables, say WI, where 2 = 2, 3, . . . , L. These auxiliary variables generalize pn, h, p2 in the HH equations. Thus
i= 1,2,. . l ,N (A-3)
where the functional dependence of qi on the WI values is determined by the physiological interpre- tation of the W( and corresponding experimental data. Each WI is assumed to be voltage- and time- dependent and to satisfy a relaxation equation given bY
dW, WY(V) - WI -= dt r1W)
, I= 2,3,. . . , L (A-4
where Wla(V) is the resting state value of WI at membrane potential V and there is a single voltage- dependent time constant T](V) for each W1. Note that each equation contains only WI and this occurs linearly. The linearized equations for both models are obtained by assuming that I(t) is small and let- ting
V = V. + v, Wi = Wlo + wI, I= 2, 3, . . . , N (AS)
where v is the perturbation of V from the resting membrane potential and WI is the perturbation of WI about its resting value WlO* At the resting state of the membrane, there are constraints on the pa- rameters. From Eg. A.1 with no applied current, i.e., 1(t) = 0, and dV/dt = 0, we have the constraint
where subscript 0 means that the membrane po- tential is at its resting value VO, and WI is given by WI0 = W1”“(VO) with 7 given by 7zo = 7/(Vo).
To simplify the presentation here, we assume that there is only one active ionic component (qI) in the membrane and that it depends on a single auxiliary variable WZ. (The general case of more than one active component with several auxiliary variables is more complicated but can be treated similarly.) We thus have the linear approximations (the first 2 terms of a Taylor series)
W2YV N wo + Y2V (A- 7)
where y2 = dW2”(Vo)/dV and a2 = dT2(V0)/dV. Here (~4.2) q, has the linear approximation

1014 PUIL, GIMBARZEVSKY, AND MIURA
SlW2) = 9lW20) + 2 W2ob2 2
= 910 + 412w2
Taking account of the constraint Eq. A-6, the lin- earized forms of Egs. A. 1 and A.4 become
dv c; + av + bw, = I(&) (A. 10)
dW2 dt + cw2 - dv = 0 (AX)
where c = l/rzo, d = y2/720 (A.12)
For the HH model, the coefficients a and b are given by
N a= cs iO? b = g12wo - w (A.13)
i=l
where V1 is the Nemst potential for the ionic species with active membrane component. I f the active component in the HH membrane were the potas- sium conductance, then Egs. A.10 and A. I I with w2 = An reduce to Eqs. 10 and 1 I with Am = 0 = Ah.
For the Goldman model with one active com- ponent in the membrane, the coefficients a and b are given by
M+N IAIFpio[ 1 -Jyo - e-Avo][C; - Cye-‘;‘vO] a=-C [ 1 - &ivD]2 (A. 14)
i= 1
b = -IflIm2~0
cl’ _ cloe-fi~o
1 _ ,-f v. . (A. 15) 1
If one accounts only for the three major ions, K, Na, Cl, and the active component is due to K per- meability, then these expansions become (subscripts K, Na, Cl correspond to the ions)
a= fF(P+ + P-)
[ 1 - epo12 (A. 16)
b = -fFPK2Vo cg - cKiefvo
1 - eflo (A.1 7)
REFERENCES
1. ARAKI, T., ITO, M., AND OSHIMA, T. Potential changes produced by application of current steps in motoneu- rones. Ivature. Land. 191: 1104-l 105, 1961.
2. BEWNGTON, P. R. Data Reduction aptd Error Analysis for the Physical Sciences. New York: McGraw-Hill, 1969, p. 204-246.
3. BRIGHAM, E. 0. The Fast Fourier Transform. Engle- wood Cliffs, NJ: Prentice-Hall, 1974, p+ 252.
4. BROMM, B, Spike frequency of the nodal membrane generated by high frequency alternating current. Pfluegers Arch. 353: l-19, 1975.
where f = F/RT and
P+ = [l + (fvo - l)eflo][PKo(Cg - CKi eflo)
+ PNaO(C& - CNa’eJ”“)] (AM)
p-+1 +fv,- eflo]Pcl&/ - C&elvo) (A.19)
For the generalized model given by Eqs. A.10 and A. 11, we note that Eq- A. IO has the same form as Eq. 3 for the electrical circuit if we let
I= = C dvldt (A.20)
IR = av (A.21)
IL = bw2 (A. 22)
Rewriting Eq. A. 11 using Eq. A.22, we obtain
I dl, -- bd dt
CJ =2, +bd ’
(A-23)
which has the same form as Eq. 6. Thus, since Eqx A.10, A.20, A.21, and A.23 have the same form as Eqs. 3-6, the complex impedance for the general- ized model has the same dependence on frequency as that for the electrical circuit, namely
5. BROW, T. H., PERKEL, D. H., NORRIS, J. C., AND PEACOCK, J, H. Electrotonic structure and specific membrane properties of mouse dorsal root ganglion neurons. J. Neurophysiol. 45: l-l 5, 198 1.
6. BUNGE, M.B., BUNGE, R.P., PETERSON, E. P., AND MURRAY, M. R, A light and electron microscope study of long term organized cultures of rat dorsal root gan- glia. J. Cell. Bid. 32: 439-466, 1967.
7. CHANDLER, W.K., FITZHUGH, R., ANDCOLE, K.S. Theoretical stability properties of a space clamped axon. Biophys. J. 2: 105-127, 1962,

MEMBRANE PROPERTIES OF TRIGEMINAL NEURONS 1015
8.
9.
10.
11.
12.
13.
14.
15
16
17
18.
19.
20.
21.
22.
23.
24.
CLAPHAM, D. E. AND DE FELICE, L. J. The theoretical small signal impedance of the frog node Rana pipiens. Pfluegers Arch. 366: 273-276, 1976. CLAPHAM, D. E. AND DE FELICE, L. J. Small signal impedance of heart cell membranes. J. Membr. Biol. 67: 63-71, 1982. COLE, K. S. Membrane, Ions and Impulses. A Chapter of Classical Biophysics. Berkeley: University of Cali- fornia Press, 1972. COLE, K. S. AND BAKER, R. F. Transverse impedance of the squid giant axon during current flow. J. Gen. Physiol. 24: 535-549, 1941. COLE, K. S. AND COLE, R. H. Dispersion and ab- sorption in dielectrics. I. Alternating current charac- teristics. J. Chem. Phys. 9: 341-35 1, 1941. CZEH, G., KUIX, N., AND KUNO, M. Membrane properties and conduction velocity in sensory neu- rones following central or peripheral axotomy. J. Physiol. Land. 270: 165-180, 1977. DE FELICE, L. J. Introduction to Membrane Noise. New York: Plenum, 198 1. DE GROAT, W. C., LALLEY, P. M., AND SAUM, W. R. Depolarization of dorsal root ganglia in the cat by GABA and related amino acids: antagonism by picrotoxin and bicuculline. Brain Res. 44: 273-277, 1972. DE MONTIGNY, C. AND LUND, J. P. A microionto- phoretic study of the action of kainic acid and putative neurotransmitters in the rat mesencephalic trigeminal nucleus, Neuroscience 5: 1621-1628, 1980. DODGE, F. A. A Study of Ionic Permeability Changes Underlying Excitation in Myelinated Nerve Fibres of the Frog (PhD Thesis), Ann Arbor, Michigan: The Rockefeller University, University microfilms no. 63- 7333, 1963. D~WNES, H. AND FRANZ, D. N. Effects of a convulsant barbiturate on dorsal root ganglion cells and dorsal root discharges. J. Pharmacol. Exp. Therup. 179: 660- 670, 1971. EFRON, B. The Jackn$e, the Bootstrap and Other Re- sampZing Plans. Philadelphia, PA: Society for Indus- trial and Applied Mathematics, monograph no. 38, 1982. FELTZ, P. AND RASMINSKY, M. A model for the mode of action of GABA on primary afferent terminals: de- polarizing effects of GABA applied iontophoretically to neurones of mammalian dorsal root ganglia. Neu- ropharmacolagy 13: 553-563, 1974. FISHMAN, H. M., MOORE, L, E., AND POUSSART, D. Squid axon K conduction: admittance and noise dur- ing short- versus long-duration step clamps. In: The Bioph ysical Approach to Excitable Systems, edited by W. J. Adelman and D. E. Goldman. New York: Plenum, 198 1, p. 65-95. FUKUDA, J. AND KAMEYAMA, M. A tissue-culture of nerve cells from adult mammalian ganglia and some electrophysiological properties of the nerve cells in vitro. Brain Rex 202: 249-255, 1980. GALLEGO, R. AND EYZAGUIRRE, C. Membrane and action potential characteristics of A and C nodose ganglion cells studied in whole ganglia and tissue slices. J. Neurophysiol. 41: 1217-1232, 1978. GIMBARZEVSKY, B., MIURA, R. M., AND PUIL, E. Measurement of complex impedance by sine-wave analysis in trigeminal ganglion neurons. Sot. Neurosci. Abstr. 9: 233, 1983.
25.
26.
27,
28.
29.
30.
31.
32,
33.
34.
35.
36.
37.
38.
39.
40.
41.
42.
43.
44.
GIMBAIUEVSKY, B., MIURA, R. M., AND PIJXL, E. Impedance profiles of peripheral and central neurons. Can. J. Physiol. Pharmacol. 62: 460-462, 1984. GIMBARZEVSKY, B. ANII PUIL, E. Complex impedance of trigeminal ganglion neurons. Can. J. Physiol. Pharmacol. 61: Ax, 1983. GOLDMAN, D. E. Potential impedance and rectifica- tion in membranes. J. Gen. Physiol. 27: 37-60, 1943. G~RKE, K. AND PIERAU, F. K. Spike potentials and membrane properties of dorsal root ganglion cells in pigeons. Pfiruegers Arch. 386: 2 l-28, 1980. HEYER, E. J. AND MACDONALD, R. L. Calcium- and sodium-dependent action potentials of mouse spinal cord and dorsal root ganglion neurons in cell culture. J. Neurophysiol. 47: 641-655, 1982. HODGKIN, A. L. AND HUXLEY, A. F. A quantitative description of membrane current and its application to conduction and excitation in nerve. J. Physiol. Land. 117: 500-544, 1952. HODGKIN, A. L. AND KATZ, B. The effect of sodium ions on the electrical activity of the giant axon of the squid. J. Physiol. Land. 108: 37-77, 1949. ITO, M. The electrical activity of spinal ganglion cells investigated with intracellular microelectrodes. Jpn. J. Physiol. 7: 297-323, 1957. ITO, M. AND OSHIMA, T. Electrical behaviour of the motoneurone membrane during intracellularly ap- plied current steps. J. Physiol. Lond. 180: 607-635, 1965. JACK, J. J. B., NOBLE, D., AND TSIEN, R. W. EZectric Current Flow in Excitable Cells. Oxford, UK: Clar- endon, 1983, p. 14. JAFFE, R. A. AND SAMPSON, S. R. Analysis of passive and active electrophysiologic properties of neurons in mammalian nodose ganglia maintained in vitro. J. Neurophysiol. 39: 802-8 15, 1976. KAYAHAFW, T., SAKASHITA, S,, AND TAKIMOTO, T. Evidence for spinal origin of neurons synapsing with dorsal root ganglion cells of the cat. Brain Res. 293: 225-230, 1984. KERR, F. W. L. The etiology of trigeminal neuralgia. Arch. Neural. 8: 15-25, 1963. KERR, F. W. L. Craniofacial neuralgia. In: Advances in Pain Research and Therapy, edited by J. J. Bonica and D. G. Albe-Fessard. New York: Raven, 1979, vol. 3, p. 283-295. KRISHTAL, 0. A. AND MARCHENKO, S. M. ATP-ac- tivated ionic conductance in the somatic membrane of mammalian sensory ganglionic neurons. Neuro- physioZogy 16: 255-263, 1985. KRISHTAL, 0. A. AND PIDOPLICHKO, V. I. Receptor for protons in the membrane of sensory neurons. Brain Rex 214: 150-154, 1981. LIEBERMAN, A. R. Sensory ganglia. In: The Peripheral Nerve, edited by D. N. Landon. London: Chapman & Hall, 1976, chapt. 4, p. 188-278. Lux, I-I. D. Eigenschaften eines Neuron-Modells mit Dendriten begrenzter 18lnge. PJruegers Arch. 297: 238- 255, 1967. MAURO, A. Anomalous impedance, a phenomeno- logical property of time-variant resistance. An analytic review. Biophys. J. 1: 353-372, 196 1. MAURO, A., CONTI, F., DOWE, F., AND SCHOR, R. Subthreshold behaviour and phenomenological impedance of the squid giant axon. J. Gen. Physiol. 55: 497-523, 1970.

1016 PUIL, GIMBARZEVSKY, AND MZURA
45. MAYER, M, L, AND WESTBROOK, G. L. A voltage- clamp analysis of inward (anomalous) rectification in mouse spinal sensory ganglion neurones. J. Physiol. Lond. 340: 19-45, 1983.
System. Cellular Biology of IVeurons. Bethesda, MD: Am. Physiol. Sot., 1977, sect. 1 ., vol, I., pt. 1, chapt, 3, p. 39-97.
46. MOORE, L. E. AND CHRISTENSEN, B. N. White noise analysis of cable properties of neuroblastoma cells and lamprey central neurons. J. Neurophysiol. 53: 636- 651, 1985.
50. SPENCER, P. S., RAINE, C. S., AND WISNIEWSKI, H. Axon diameter and myelin thickness-unusual rela- tionships in dorsal root ganglia. Anat. Rec. 176: 225- 244, 1973.
47. NELSON, P. G. AND Lux, H. D. Some electrical mea- surements of motoneuron parameters. Biophys. J. IO: 55-73, 1970.
5 1. SVAETICHIN, G. Electrophysiological investigations on single ganglion cells. Acta Physiol. Stand. 24, Suppl. 86, 1951.
48. POUSSART, D. J. M., MOORE, L. E., AND FISHMAN, H. M. Ion movements and kinetics in squid axon. I. Complex admittance. Ann. NY Acad. Sci. 303: 355- 379, 1977.
52. YOSHIDA, S., MATSUDA, Y., AND SAMEJIMA, A. Te- trodotoxin-resistant sodium and calcium components of action potentials in dorsal root ganglion cells of the adult mouse. J. Neurophysiol. 41: 1096-1106, 1978.
49. RALL, W, Core conductor theory and cable properties 53. ZIERLER, K. A critique of compartmental analysis. of neurons. In: Handbook of Physiology. The Nervous Annu. Rev. Biophys. Bioeng. 10: 53 l-562, 198 1.