quantification of porosity changes due to precipitation of ... · diego sampietro(1)...
TRANSCRIPT
• iCP is a flexible and powerful tool for quantitative integration of
groundwater flow and geochemical models.
• iCP is able to model the geochemical processes in 3D large scale
with long‐term.
Diego Sampietro(1) ([email protected]), Elena Abarca (1), Marti Bayer(1), Salvador Jordana(1), Jorge Molinero(1), Tatsuya Tanaka(2) ,
Shuji Hashimoto(2), Teruki Iwatsuki(3), Hironori Onoe(3), Hiromitsu Saegusa(3)
Quantification of porosity changes due to precipitation of cement materials with iCP
The Japan Atomic Energy Agency (JAEA) is being carried out an URL
(Underground Research Laboratory) project in Mizunami city,
central Japan. The project is a purpose‐built generic URL project
that is planned for a scientific study of the deep geological
environment in fractured crystalline rock as a basis of research and
development for geological disposal of nuclear wastes.
The concrete material using the URL construction is expected to be
source of a hyperalkaline plume that can lead to porosity and
permeability changes in the bedrock.
In this study, a 3D reactive transport model, developed with the
interface COMSOL‐PHREEQC (iCP) (Nardi et al., 2014a), shows the
evolution of the hyperalkaline plume and evaluates the influence of
porosity changes on the rock permeability.
Introduction
(1) Amphos 21 Consulting S.L., Passeig de García i Faria, 49‐51, 08019 Barcelona, Spain.
(2) Obayashi Corporation, Shinagawa Intercity Tower B 2‐15‐2, Konan, Minato‐ku. Tokyo 108‐8502, Japan.
(3) Japan Atomic Energy Agency, 1‐64, Yamanouchi, Akiyo‐cho, Mizunami‐shi, Gifu, 509‐6132, Japan.
References• Costa, A. 2006. Permeability‐porosity relationship: A reexamination of the Kozeny‐Caraman equation based on afractal pore‐space geometry assumption. Geophysical research letters, Vol. 33.• Iwatsuki, T., Furue, R., Mie, H., Ioka, S. and Mizuno, T., 2005. Hydrochemical baseline condition of groundwaterresearch laboratory (MIU). Applied Geochemistry, 20, 2283‐2302.• Nardi, A., Idiart, A., Trinchero, P., de Vries, L. M. and Molinero, J., 2014a. Interface Comsol‐PHREEQC (iCP), anefficient numerical framework for the solution of coupled multiphysics and geochemistry. Computers & Geosciences,doi:10.1016/ j.cageo. 2014.04.011.• Nardi, A., Idiart, A., Trinchero, P., de Vries, L. M., Sainz, A. and Molinero, J., 2014b. iCP – interface COMSOLPHREEQC. User´s manual v1.0.• Parkhurst, D. L. and Appelo, C. A. J., 2013. Description of Input and Examples for PHREEQC Version 3—A ComputerProgram for Speciation, Batch‐Reaction, One‐Dimensional Transport, and Inverse Geochemical Calculations. Chapter53 of Section A, Groundwater book 6, Modeling Techniques U.S. Geological Survey Water‐Resources.
Model Set‐up
Conclusions
The URL consists on two 500 m deep shafts and several galleries
(Figure 1). Concrete lining at shafts and galleries, grout has been
injected to minimize groundwater inflow volume.
iCP solves the reactive transport with a sequential non‐iterative
approach (SNIA). First the groundwater flow and conservative
transport processes are modelled with heterogeneities and
anisotropies in the hydraulic properties (hydraulic conductivity and
porosity (Figure 2)). Then, the chemical reactions are modelled
using PHREEQC (Parkhurst and Appelo, 2013) with the physical
parameters provided in the first step. The groundwater flow
modelling using COMSOL has been implemented with the Darcy’s
law physic while the modelling of transport process is implemented
using a custom physic interface named Molal Solute Transport
(Nardi et al., 2014b).
Figure 1. Detailed of the URL geometry and the refinement of the mesh.
Figure 2. Rock hydraulic conductivity of themodel domain with the URL located in thecenter of the domain .
Prescribed pressure and open boundary over the whole domain
were assigned as boundary conditions for flow and transport
respectively, with a total time simulation of 5000 years.
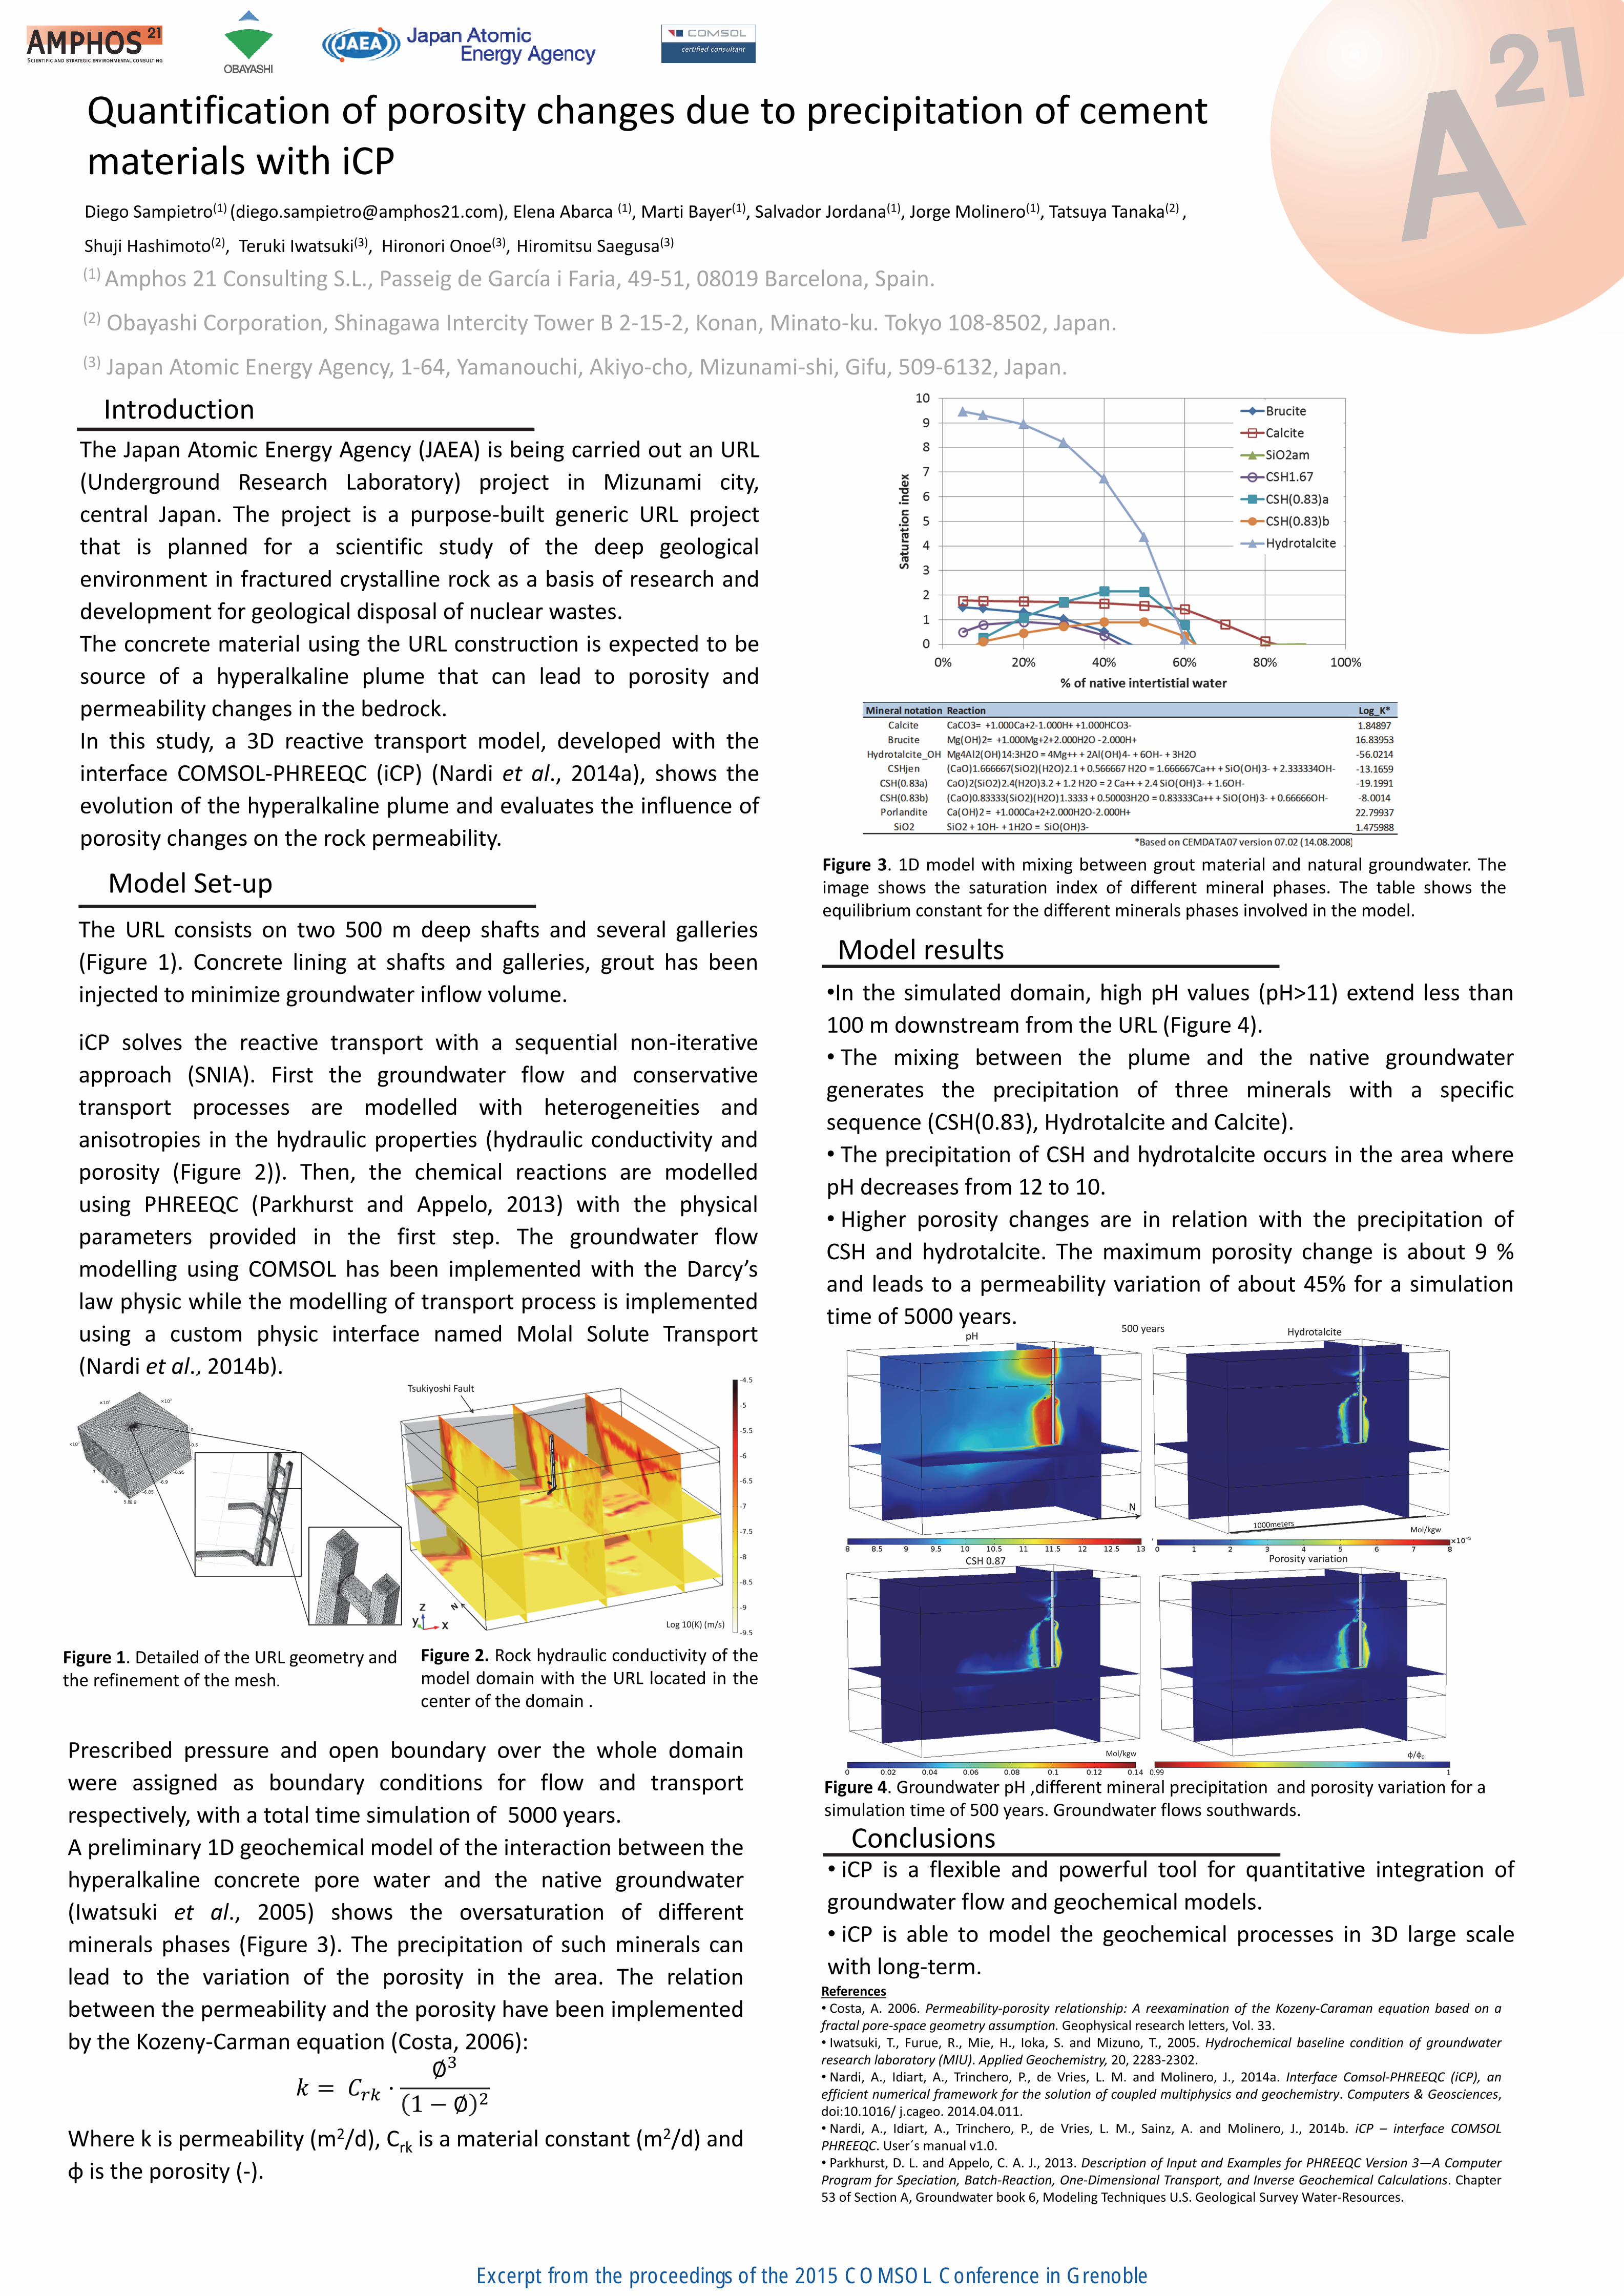
A preliminary 1D geochemical model of the interaction between the
hyperalkaline concrete pore water and the native groundwater
(Iwatsuki et al., 2005) shows the oversaturation of different
minerals phases (Figure 3). The precipitation of such minerals can
lead to the variation of the porosity in the area. The relation
between the permeability and the porosity have been implemented
by the Kozeny‐Carman equation (Costa, 2006):
Where k is permeability (m2/d), Crk is a material constant (m2/d) and
φ is the porosity (‐).
Figure 3. 1D model with mixing between grout material and natural groundwater. Theimage shows the saturation index of different mineral phases. The table shows theequilibrium constant for the different minerals phases involved in the model.
Figure 4. Groundwater pH ,different mineral precipitation and porosity variation for a simulation time of 500 years. Groundwater flows southwards.
•In the simulated domain, high pH values (pH>11) extend less than
100 m downstream from the URL (Figure 4).
• The mixing between the plume and the native groundwater
generates the precipitation of three minerals with a specific
sequence (CSH(0.83), Hydrotalcite and Calcite).
• The precipitation of CSH and hydrotalcite occurs in the area where
pH decreases from 12 to 10.
• Higher porosity changes are in relation with the precipitation of
CSH and hydrotalcite. The maximum porosity change is about 9 %
and leads to a permeability variation of about 45% for a simulation
time of 5000 years.
Model results
Excerpt from the proceedings of the 2015 COMSOL Conference in Grenoble