quantification of protein fractions in aqueous phases of...
TRANSCRIPT

Faculty of Natural Resources and Agricultural Sciences Department of Food Science
Quantification of protein fractions in aqueous phases of whey and emulsions
Ayotunde Omolade Alawode
Master Program – Food – Innovation and Market Independent Project in Food Science • Master Thesis • 30 hec • Advanced A2E Publikation/Sveriges lantbruksuniversitet, Institutionen för livsmedelsvetenskap, nr 391Uppsala, 2014

Quantification of protein fractions in aqueous phases of whey and emulsions
Ayotunde Omolade Alawode
Supervisor: Dr. Arthur Hill, University of Guelph, Ontario Canada, Department of Food Science
Assistant Supervisor: Dr. Prashanti Kethireddipalli, University of Guelph, Ontario, Canada, Department of Food Science
Examiner: Dr. Monika Johansson, Swedish University of Agricultural Sciences, Department of Food Science
Credits: 30 hec Level: Advanced A2E Course title: Independent Project in Food Science Course code: EX0396 Program/education: Master Program Food – Innovation and Market Place of publication: Uppsala, Sweden Year of publication: 2014 Cover picture: Ayotunde Alawode Title of series: Publikation/Sveriges lantbruksuniversitet, Institutionen för livsmedelsvetenskap Series no: 391Online publication: http://stud.epsilon.slu.se Keywords: Whey proteins, WPC 35, Emulsion, Protein denaturation, Native protein, Aggregated protein, Particle size distribution
Sveriges lantbruksuniversitet Swedish University of Agricultural Sciences
Faculty of Natural Resources and Agricultural Sciences Department of Food Science

i
Abstract
Aqueous 6.86% whey protein concentrate 35 (WPC 35) solution was heated at the
temperature of 70°C for 10, 15 and 20 minutes respectively to quantify the amount of
native protein, soluble protein aggregates and insoluble protein aggregates in the heated
samples. The serums of the emulsions formed from the different heated samples were
also analyzed for percentages of native proteins and aggregated proteins using Dumas
combustion method. The aim of this work was to improve the knowledge on the
functionality of WPC 35 with a heat treatment of 70°C at varied period of time. The
results show that there was native protein fraction of 76.6%, 14.4% soluble protein
fraction and 9% insoluble protein aggregates when aqueous 6.86% WPC 35 solution was
heated at 70°C for 10 minutes. Emulsion formed from the heated sample contains 78.2%
native protein in its serum after centrifugation. With a heat treatment of the same sample
at 70°C for 15 minutes, the content of native protein fraction was 73%, 8.3% soluble
protein fraction and 18.7% insoluble protein aggregates. The resulting emulsion from this
heat treatment had 66.9% native protein in its serum after centrifugation. Heat treatment
of aqueous 6.86% WPC 35 at 70°C for 20 minutes contains 80.43% of native proteins,
5.6% of soluble protein and 13.97% insoluble proteins. The emulsion prepared from the
heated sample has 81.7% native proteins in its serum. Effect of some other processing
conditions such as homogenization and length of storage of whey protein dispersion were
also examined.

ii
Acknowledgement My special thanks to God Almighty, the giver of every good gift, for the successful
completion of this program. He has been my source and will forever be. Great God! I
cannot thank you enough.
My profound gratitude goes to my supervisor, Dr. Arthur Hill (Professor and Chair, Food
Science Department, University of Guelph, Ontario, Canada), for creating space for me in
his laboratory and allowing me to be part of his ongoing project. Your help came up for
me just right in time. Thank you for your attention and time during the course of this
work despite your busy schedule. History is made already and you will always be part of
it. My appreciation also goes to my assistant supervisor, Dr. Prashanti Kethireddipalli
(Post Doctoral Fellow, Food Science Department, University of Guelph, Ontario,
Canada), for her thorough but constructive criticisms, inputs and close supervision in the
course of this work. My working with you had been a good experience, Thank you.
My sincere appreciation also goes to my examiner, Dr. Monika Johansson (Food Science
Department, Swedish University of Agricultural Sciences), for her time. Also to Dr.
Kristine Koch (Director of Food Innovation and Market program, SLU), I really
appreciate her time and excellent coordination throughout the period of the program. I
cannot but appreciate the selfless supports of all the teachers in the program; the imparted
knowledge had made a better me. Karin Hakelius, Andreas Stephan, Asa Ostrom,
Cornelia Witthoft, Carl Brunius, Ulf Sonesson, Helena Rocklinsberg, Per Sandin, amidst
others, Thank you all.
I want to sincerely appreciate my colleagues in the Food Innovation and Market (FIM)
program at SLU and also my laboratory colleagues at Guelph University. You all gave
me a right atmosphere to study and work. It is nice knowing and working with you all.
This acknowledgement would not be complete without my special appreciation to my
husband (Dr. Stephen Oni), for believing in me and for his support throughout the period
of this program. You are the best soul mate I can ever have, the only man that can
manage me. Many thanks also go to my girl for her cooperation and understanding all the
way. I love you my little angel. Also to my father, Pa G.A.O. Alawode, thank you for
your words of encouragement all the time.
This work is dedicated to my daughter, “My little angel”, Mercy Ibukun Ayomipo ONI.

iii
Table of contents Abstract ................................................................................................................................ i
Acknowledgement .............................................................................................................. ii
Table of contents ................................................................................................................ iii
Lists of Abbreviations ........................................................................................................ iv
1 Introduction ...................................................................................................................... 1
1.1 Aim and Objectives................................................................................................... 3
1.2 Delimitation of Study ................................................................................................ 3
2 Theoretical Background ................................................................................................... 4
2.1 Whey proteins ........................................................................................................... 4
2.2 Effect of heat treatment on whey proteins’ functionality ......................................... 4
2.3 Protein Solubility and its functionality ..................................................................... 5
2.4 Whey protein based emulsions ................................................................................. 6
2.5 Homogenization ........................................................................................................ 6
3 Materials and Method ...................................................................................................... 7
3.1 Preparation of WPC 35 solution ............................................................................... 7
3.2 Heat treatments of aqueous WPC 35 solution .......................................................... 7
3.3 Homogenization of samples ...................................................................................... 7
3.4 Preparation of Emulsion ........................................................................................... 8
3.5 Measure of particle size distribution ......................................................................... 8
3.6 Separation of native and aggregated protein fractions in samples ............................ 9
3.6.1 WPC 35 samples ................................................................................................ 9
3.6.2 Emulsions ......................................................................................................... 10
3.7 Quantification of total protein in samples ............................................................... 12
4 Results ............................................................................................................................ 13
4.1 Measure of particle size distributions of the different samples .............................. 13
4.2 Quantification of total protein contents of samples ................................................ 17
5 Discussions .................................................................................................................... 22
5.1 Measure of Particle size distributions ..................................................................... 22
5.2 Quantification of native and aggregated protein contents ...................................... 22
6 Conclusion ..................................................................................................................... 24
References ......................................................................................................................... 25
Popular Scientific Summary ............................................................................................. 29

iv
Lists of Abbreviations
Aq. – Aqueous
Homo - Homogenized sample
HPSEC - High-performance size exclusion chromatography
SDS- PAGE - Sodium dodecyl sulfate polyacrylamide gel electrophoresis
WP - Whey protein
WPC - Whey protein concentrate
WPC 35 - Whey protein concentrate 35
1
1 Introduction The Canadian dairy food market had been more concerned about consumers’ satisfaction
and wellbeing in the recent times (Peng et al., 2006). One of the numerous attempts of the
dairy food market in achieving its goal is an idea of producing and/or reformulating a
dairy-based food, which is more nutritious, healthy, more appealing to consumers, yet
economical to both buyers and producers. In addition to these, the functionality of the
new food product and its components become of great interest for effective end use
(Mangino et al., 1987; Schmidt et al., 1984; De Wit, 1998). In an ongoing study at the
University of Guelph, Ontario, Canada, it was discovered that there is a possibility of
making a butter oil-based recombined dairy cream with partially heat-denatured
commercial whey proteins (Kethireddipalli & Hill, ongoing). The butter oil-based creams
would have similar globule size distribution as that of natural milk cream with other
additional advantages.
Conventionally, recombined creams are prepared by homogenizing butter oil with skim
milk but then, the resulting fat globules are small, coated with caseins. Caseins are
directly involved in cheese gel formation. This is undesirable in some cheese production,
especially in hard and semi-hard types, as it is often responsible for the tough, rubbery
texture, poor melting and stretching of such cheeses (Gaygadzhiev et al., 2009; Raikos,
2010). The new recombined dairy cream would have an advantage of better fortification,
reformulation, modification, taste, stability and better cheese-making property, in relative
to the natural cream milk. In addition to the advantages mentioned above, the new
product also provides an opportunity of dairy food consumption especially in
areas/countries where there is no/not enough production of fresh milk (De Wit, 1998). It
could therefore be summarized that the new recombined dairy cream would have a lot of
economic advantages resulting from enhanced food product innovation, development and
diversification (Capon, 2009; Trott, 2012).
The present competitive and largely globalised business environment places the need on
different sectors and organizations to constantly innovate. This is because innovation is
of key importance to the success and economic growth of a business (Landsperger &
Spieth, 2011; Trott, 2012). The term innovation is surrounded by several phenomenon
such as problem identification, knowledge, new idea, idea development, market research,
consumers’ needs and wants, new technology, new product or services, new process,
amidst others (Earle, et al., 2001; Earle & Earle, 2008; Capon, 2009; Trott, 2012). For the
purpose of this study, innovation could be defined as a clever way of maximizing an
identified business opportunity, which gives an organization a competitive advantage
over other competitors (Earle et al., 2001; Capon, 2009; Trott, 2012). This is achieved by
transforming residual and new knowledge into new product or services that would be
acceptable by the target market (Capon, 2009). The results of innovation assessments
help in the identification of the gap between innovation capabilities and innovation goals
of the innovator (Lawson & Samson, 2001). The enhanced knowledge and clarity
therefore helps in bridging the gap between capabilities-to-goals for improved innovation
performance (Rush et al., 2007).

2
The newly formulated recombined dairy cream is intended to be fortified with nutritional
components such as fat-soluble vitamins and healthy omega oils, with a better cheese-
making property. Then, some of the desired attributes in the new recombined dairy cream
are the presence of non-interacting fat globules, which would enhance better product
stability before and after fortification. Whey fractions of different protein compositions
had therefore been used as emulsifiers in these formulations due to their characteristic
attributes, both when denatured and in cheese-making. One of these attributes is the
ability of whey proteins to form and stabilize oil-in-water emulsion. In this study, focus
would be on whey protein concentrate 35% (WPC 35). Another major attribute of WPC
35, which qualifies it for this project, is that WPC having 35% protein content could act
as a replacer of skim milk in food industries (De Wit, 1998).
Whey proteins are generally acceptable food ingredients, as they are well known for their
good nutritional and functional properties such as their ability to form and stabilize oil-in-
water emulsions (Roufik et al., 2005; Manion & Corredig, 2006; Ye & Taylor, 2009).
This might be due to their characteristic structure and biological attribute, which when
modified, could enhance their functionalities (De Wit, 1998; Sajedi et al., 2014). To
further justify the utilization of WPC, more knowledge about the functionality of whey
proteins and the different factors that affect them must be acquired. Schmidt et al. (1984)
reported that whey heat treatment, heating during ingredients’ application, storage
conditions and sanitation factors are some of the processing factors that directly and/or
indirectly affect whey protein functionality. A typical protein concentration for
commercial WPC such as WPC 35 ranged from 29 - 60 %. This is because there is a limit
to attainable protein purity in WPC manufacture due to economic reasons. For example,
increased total solids decrease the rate of protein denaturation (Schmidt et al., 1984).
From the perspective of whey proteins’ nutritional value, increased usage of whey
proteins in dietetics and also in the production of infant foods and other health foods
shows its effectiveness (De Wit, 1998; Roufik et al., 2005).
Aqueous solutions and emulsions would be made from WPC 35 after which there is a
need to identify and quantify the type and amount of proteins at the interfaces of whey
protein dispersions and the resulting emulsions. As part of the preliminary study in the
ongoing project, some exploratory researches are expected. This is to clearly understand
what proportion of whey proteins, both at the native and aggregated forms, gives the best
sample for required product stability, cheese-making and fortification. The measure of
the particle size distribution of each sample also gives enhanced knowledge of potential
functionality of such sample, both in the food and pharmaceutical industries (Lam &
Nickerson, 2013; Shakeel et al., 2012).
Native proteins are those proteins that still retain their original conformation or structure.
They are often referred to as folded proteins with their native three-dimensional structure
undisrupted, thereby retaining the ability of such protein to continually carry out its
biological functions (Levinthal, 1968; Visschers & de Jongh, 2005; Boutin et al., 2007;
Anandharamakrishnan et al., 2008). Native proteins are often retained when the
configurational energy acting on it is at the barest minimum (Levinthal, 1968; Visschers
& de Jongh, 2005). A common food processing condition which leads to protein
denaturation from its native state is heating (Pelegrine & Gasparetto, 2005; Gulzar et al.,

3
2011; Dissanayake et al., 2013). Protein denaturation through heat-treatment could be
reversible or irreversible, depending on conditions such as the intensity of heat treatment.
Mild heat treatment might cause random unfolding of the protein structure which could
be restored to its folded metastable state, having its biological functions completely
restored (Levinthal, 1968; Visschers & de Jongh, 2005). Both folded and refolded
proteins are described as being in their native states as long as the biological
functionalities of such proteins are not negatively affected (Visschers & de Jongh, 2005).
Aggregated proteins on the other hand are the denatured or unfolded protein, which
results from the disruption in the protein structure during food processing conditions
(Levinthal, 1968; Visschers & de Jongh, 2005). Protein denaturation could be heat-
induced, acid-induced, high pressure-induced and other denaturants-induced (Visschers
& de Jongh, 2005). During protein denaturation, the structural disruption of protein leads
to hydrophobic interaction and then the formation of disulphide bond, thereby leading to
protein aggregation (Boutin et al., 2007; Raikos, 2010). Protein solubility is one of the
measures taken to know how much of protein remains at its native state and how much is
aggregated after protein denaturation (Pelegrine & Gasparetto, 2005; Lim et al., 2008).
Some of the processes involved in this study include preparation of sample solutions,
protein denaturation, homogenization, mastersizing (to measure the particle size
distributions of samples), centrifugation, protein quantification in samples using Dumas,
amidst others.
1.1 Aim and Objectives
The objectives of this study are:
1. To understudy the effect of some processing conditions such as sample
preparation, storage conditions, duration of storage, duration of heating and
homogenization on particle size distribution of both heated and unheated aqueous
WPC 35 solutions and the resulting emulsions.
2. To quantify the amount of native and aggregated protein fractions in different
aqueous WPC 35 dispersions heated at 70°C for 10,15 and 20 minutes
respectively.
3. To quantify the amount of native and aggregated protein fractions in different
aqueous phases (serum) of butter oil and whey protein-based emulsions prepared
with the heat treatment of 70°C for 10, 15 and 20 minutes respectively.
1.2 Delimitation of Study
This study does not in any way involve assessment on the shelf life of the aqueous whey
protein concentrates (both when heated and unheated), shelf life assessment of the
resulting emulsions and the stability of the formed emulsions.
4
2 Theoretical Background
2.1 Whey proteins
Food proteins such as whey proteins are known for their great emulsifying properties
(Raikos, 2010; Singh & Sarkar, 2011; Lam & Nickerson, 2013). Several authors had
reported about the compositional, nutritional, functional and economical properties of
whey proteins with respect to their importance in the food industry (Mangino et al., 1987;
Schmidt et al., 1984; De Wit, 1998; Roufik et al., 2005; Liu et al., 2005). This means that
whey proteins are able to compete with functional vegetable proteins in the market,
ability to replace egg proteins in bakeries and confectioneries, ability to replace milk in
dairy products such as ice cream, suitability for usage in dietetics and production of
infant formula (Roufik et al., 2005; De Wit, 1998). Apart from the nutritional and
functional benefits of whey proteins, the different types and wide range of whey protein
compositions broaden their level of utilization. For example, there are whey protein
isolates (Hunt & Dalgleish, 1994; Manion & Corredig, 2006), whey protein concentrates
(Dickow et al., 2012; Roufik et al., 2005; Mangino et al., 1987) and whey protein
hydrolysates, which are as well known as predigested whey proteins. According to the
findings in Roufik et al. (2005), the report showed that whey protein concentrates ranged
from 32% - 81% in protein contents. Lim et al. (2008) also reported some attributes of
WPC 35 containing approximately 35% protein. This suggests that the different protein
contents available in each whey protein concentrate could determine its usefulness.
Other researchers focused on the several factors that might be modified to get the best of
whey proteins’ usage as a result of improved functionality (Lim et al., 2008; Liu et al.,
2005; Mangino et al., 1987; Schmidt et al., 1984). For instance, heat treatments, sample
concentration, cheese or casein manufacturing practices, storage conditions and sanitation
aspects are some factors affecting whey protein functionality as discussed in Schmidt et
al. (1984). Functionality of protein also depends on its hydrophobicity, which in turn
influences its emulsion capacity (Liu et al., 2005). Lam and Nickerson (2013) defined
emulsion as the dispersion of two or more immiscible liquids, in which one of the liquids
is dispersed in the other as small droplets which ranged from 0.1 – 100µm and ≤100nm in
the case of nanoemulsions. The ability of a protein acting as an emulsifier in a mixture, to
lower interfacial tension of either oil-water and/or water-oil mixture is defined as
emulsion capacity of such protein. This same ability is identified with whey proteins, to
reduce interfacial tension in an oil-water interface especially in an oil-in-water emulsion
(O/W) as described in this study, which enhances their usefulness in the formation of
emulsions (Lam & Nickerson, 2013).
2.2 Effect of heat treatment on whey proteins’ functionality
Heat treatment is one of the ways how protein denaturation could be carried out
(Pelegrine & Gasparetto, 2005; Gulzar et al., 2011; Dissanayake et al., 2013). To start
with, thermal processing of milk is one of the numerous methods adopted in the dairy
industry. Some of the reasons for heat processing of milk include extension of products’
shelf-life, quality improvement of products, reduction in the risk of food poisoning,

5
improvement in the organoleptic properties of food products and modification of
functional properties (Raikos, 2010).
Protein denaturation occurs when there is a disruption in its original structure
(Anandharamakrishnan et al., 2008; Boutin et al., 2007). The structural disruption of
protein via heat treatment might therefore be either intentional or as a result of processing
(Raikos, 2010). For instance, when liquid whey protein undergoes pasteurization, a level
of denaturation could have occurred depending on the pasteurization temperature
(Dickow et al., 2012). Also, reversible structural unfolding of protein or irreversible
structural disruption could have occurred as a result of intentional heat treatment to
modify proteins’ functionality such as in induced gelation of whey proteins (Manion &
Corredig, 2006; Boutin et al., 2007; Ye & Taylor, 2009; Sajedi et al., 2014). Again, in the
manufacture of whey protein concentrates, the conversion of liquid whey into powdered
form requires heat treatment in form of drying. In this process, depending on the method
of drying and the drying temperature, there could have been a level of disruption in the
protein structure. Although spray drying is the most preferred method of manufacturing
powdered whey protein, significant thermal denaturation still occurs. (Gulzar et al., 2011;
Anandharamakrishnan et al., 2008).
When there is structural disruption of whey protein for instance as a result of thermal
denaturation, two stages are involved; there is an exposure of the hydrophobic group and
then the sulphydryl group. This unfolding and exposure enhances protein aggregation due
to protein hydrophobicity and disulphide bond formation. During the first stage, there is
attractive interaction of protein polymers thereby forming aggregates. The second stage
on the other hand involves strengthening of the gel matrix as a result of disulphide bonds
formation (Boutin et al., 2007; Raikos, 2010). Depending on the functional end use of
such whey protein, the denaturation could be considered as desirable or detrimental
(Raikos, 2010).
2.3 Protein Solubility and its functionality
Protein solubility in the context of this study could be defined as the ability of protein to
be retained in the supernatant of its solution after being centrifuged under a given
condition. It simply identifies the extent to which whey protein is denatured (Pelegrine &
Gasparetto, 2005; Lim et al., 2008). Protein solubility could also be measured as the
concentration of proteins in a dissolved liquid phase in relation to the total amount of
protein, either dissolved or undissolved in the sample (Anandharamakrishnan et al.,
2008). There is a level of interaction between temperature and pH in the context of
factors that affect protein solubility (Dissanayake et al., 2013; Anandharamakrishnan et
al., 2008; Pelegrine & Gasparetto, 2005). Generally, at protein heat treatments of between
40°C - 50°C, protein solubility increases, but with higher temperature, especially when
sustained for a given time, the denaturation occurs (Pelegrine & Gasparetto, 2005).
Decrease in protein solubility unfavorably affects its functionality as high solubility of
protein is required for making good emulsions (Anandharamakrishnan et al., 2008;
Pelegrine & Gasparetto, 2005; Manion & Corredig, 2006). The case of whey protein is
not an exception. Whey protein solubility decreases with increase in the temperature of
heat treatment, thereby leading to protein denaturation, either at pH of about 4.6 or 6.8.
The higher the solubility of a protein the more suitable it is in its functionalities such as in

6
the formation of emulsion, gelation, foam and whipping properties (Pelegrine &
Gasparetto, 2005).
2.4 Whey protein based emulsions
Emulsions are becoming more and more important in the recent times as they form a
significant part of processed food formulations such as milk, cream and cheese (Kiokias
et al., 2004; Singh & Sarkar, 2011). The formation of emulsions basically requires a
scientific understanding of the nature and components of the immiscible liquids coming
together to interact. Having known what constitutes the mixture with the knowledge of
the desired end result, the choice of emulsifiers to be used becomes very important. In the
preparation of emulsion, proteins are usually used as emulsifier to stabilize oil droplets
(Sünder et al., 2001). In a case of a partially heat-denatured whey protein concentrate
such as used in this study, emulsification temperature is very important as it is a major
determinant of emulsion consistency (Sünder et al., 2001; Boutin et al., 2007).
Oftentimes, the higher the protein levels of an emulsion, the better the behaviour of such
emulsion. This is because the smaller oil droplets resulting from higher protein content,
increases the stability of the emulsion (Sünder et al., 2001). Gaygadzhiev et al. (2009)
further reported that regardless of the type of protein used in stabilizing the oil droplets of
an emulsion, increasing amount of protein gradually reduces the average droplet size.
Milk proteins generally known for their emulsifying ability are broadly categorized into
two groups: the caseins and the whey proteins (Singh, 2011; Raikos, 2010). Some of the
numerous advantages of whey protein based emulsions therefore are observed over
emulsions stabilized with skim milk powder (SMP) protein. This might be related to the
economic advantage associated with the use of whey protein. For instance, more SMP
protein is required to stabilize an emulsion to get a particular average droplet size in
relative to whey protein used in getting the same result (Liu et al., 2005; Gaygadzhiev et
al., 2009). Also, solubility is an important attribute of whey protein as soluble proteins
positively influence the formation, stability and consistency of emulsion
(Anandharamakrishnan et al., 2008). Again, the functional end result of the intended new
recombined dairy cream necessitates and/or justifies the preference for using whey
proteins as emulsifier over other food emulsifying agents. Looking at other food
emulsifying agents such as skim powder and milk caseins for instance, they contribute
directly to cheese gel formation, which is not desirable in the new product in view
(Gaygadzhiev et al., 2009).
2.5 Homogenization
Homogenization of an emulsion is the act of inducing mechanical shear to the mixture of
immiscible liquid, to produce uniformity in the mixture by making small droplets of one
of the liquids to be dispersed in the other (Kiokias et al., 2004; Lam & Nickerson, 2013).
Proper homogenization of an emulsion leads to proper stability of such emulsion,
depending on what is desirable in each emulsion (Kiokias et al., 2004). This fact was
further established by Sünder et al. (2001) and Raikos (2010), stating, that the parameters
of homogenization are some of the major tools that determine the physico-chemical
properties of an emulsion. The process of homogenization aids the dispersal of one phase
of the immiscible liquids in the other phase by stretching and breaking the coarse droplets
thereby leading to enhanced emulsion stability (Kiokias et al., 2004).

7
3 Materials and Method
All experiments except stated were carried out at room temperature.
3.1 Preparation of WPC 35 solution
WPC 35 powder (Prodel 35, Parmalat, London, ON, Canada) usually kept at 4°C was
prepared into an aqueous solution of 6.86% w/w in a glass beaker with 0.02% sodium
azide added. The sodium azide was added as a biocide; a preservative to inhibit the
growth of microorganisms in the prepared sample (Manion & Corredig, 2006;
Gaygadzhiev et al., 2009). The resulting dispersion was brought to stirring for one hour
while covered with film to avoid evaporation and contamination of the prepared sample.
After stirring for one hour, the solution was stored in a refrigerator overnight. The day of
solution preparation is reported as unheated Day 1, the solution that was refrigerated
overnight is reported as unheated Day 2 solution, while the sample refrigerated till the
third day is reported as unheated Day 3.
3.2 Heat treatments of aqueous WPC 35 solution
The aqueous WPC35 solution prepared and refrigerated the previous day was brought to
room temperature before heating. The process of pre-heating WPC 35 solution is
important to the formation and the resulting properties of whey protein gels (Ye &
Taylor, 2009). The solution was dispensed into several but uniform test tubes (as much as
needed), using pipette, before heating to ensure even heat penetration into solutions being
heated. The already filled test tubes were arranged in test tube racks and then covered
with aluminum foil to prevent any form of evaporation or condensation. The water bath
(Isotemp 3016H, Fisher Scientific Incorporation, USA) was pre-set for 70°C before the
solutions to be heated was placed. This process was done for all the samples heated at
70°C for 10, 15 and 20 minutes respectively, except that samples experimented at 70°C
for 10 and 15 minutes were heated on Day 2 while sample 70°C for 20 minutes was
heated on Day 3. The heated samples still in test tubes were then transferred into ice for
about 3-5 minutes to cool (Manion & Corredig, 2006). Later, the heated samples were
collected back into a bigger beaker for further experiment.
3.3 Homogenization of samples
All homogenizations in this study were done using Emulsiflex – C5 homogenizer by
Avestin, Canada, at the pressure of 175 - 200 bars. The homogenizer was always ensured
to be thoroughly clean with no trace of fat, oil, dirt, soap, or any other particles in the
outlet, hose or pump of the homogenizer. This was to get just the accurate particle size of
the homogenized samples without any external influence. In this study, there were 3
categories of samples homogenized. First, the unheated but homogenized WPC 35.
Second, the heated and homogenized WPC 35. And lastly, the butter oil and whey protein
based emulsion. All the homogenized samples from these categories were ensured to be
at a temperature of 60°C at homogenization.

8
3.4 Preparation of Emulsion
The butter oil and whey protein- based emulsion was prepared using butter oil melted
from a butter fat (Laetania Clarified butter, Parmalat, London, ON, Canada) and aqueous
6.86% WPC 35 solution. The mixture was prepared at ratio 70:30, where aqueous 6.86%
WPC 35 solution has the 70% portion and the butter oil has the 30% portion of the
mixture. In the case where emulsion is prepared from heated aqueous 6.86% WPC 35
solution and butter oil, 30% butter oil that was melted from butter fat in a water bath at
60°C was added to 70% heated aqueous 6.86% WPC 35 solution to make a total of
100%. Throughout the process of making the emulsion, all samples were kept at 60°C.
The mixture at 60°C was thereafter pre-homogenized/blended using high speed shear
dispersing tool (Polytron Kinematica AG dispersing and mixing technology, PT 1300D,
Fisher Scientific, Mississauga, Ontario) to have a single phase mixture since the two
components were immiscible liquids. This was also done to avoid phase-separation of the
mixture, as it is undesirable in samples to be homogenized. The pre-homogenization
and/or blending were carried out at the speed of 10 000 rpm for 3 minutes. After the
blending, the blended mixture was warmed up in the water bath to 60°C before being
homogenized to obtain an emulsion. The obtained sample of emulsion was always
covered with aluminum foil to avoid contaminations and dryness of surface of the
emulsion.
3.5 Measure of particle size distribution
All the prepared samples were analyzed for particle size distribution using mastersizer,
which is a static light scattering instrument (Mastersizer 2000, Malvern Instruments
Limited, Worcestershire, United Kingdom). The Small Volume Sample Dispersion Unit
(Malvern Instruments, Hydro 2000SM) attached to the mastersizer was always ensured to
be thoroughly cleaned using low foam chlorinated detergent and rinsing with distilled
water. This was to get rid of any residual particle from previous usage in the mastersizer
that might influence the new result. Depending on the sample to be analyzed in the
mastersizer, there are different standard operational procedures (SOP), which could be
used in the measurements. For instance, whenever the particle size distribution of an
emulsion was to be assessed, SOP for butter-oil was selected and whenever whey protein
solution of any kind was to be analyzed, SOP for WP-aggregate was used. The dispersant
in which the samples were dispensed for analysis was water with refractive index of 1.33,
refractive index of butter oil was 1.455, while the refractive index of WP was 1.53. The
analysis of the different samples was based on these values. The laser speed was always
set to 1000 rpm and laser obscuration of the dispersed sample at between 11-15% was
always ensured before readings were taken. To plot the graphs of particle size
distributions of samples as shown in the result and discussion section, the mastersizer
values that ranged from columns “result between user sizes” through “operator notes”
were used.

9
3.6 Separation of native and aggregated protein fractions in samples
In this study, all the samples that were analyzed were separated into native protein
fraction and aggregated protein fraction according to the method adopted in Roufik et al.
(2005) with the process of centrifugation.
3.6.1 WPC 35 samples For the unheated, heated and “heated and homogenized” samples of 6.86% aqueous WPC
35 solution in each case of varied duration of heat treatment, there was a 50% dilution
thereby reducing the concentration of samples to 3.43% aqueous WPC 35 solutions. Two
samples each of diluted unheated, diluted heated and diluted “heated and homogenized”
WPC 35 solutions were prepared making 6 samples altogether. One out of the two
samples in each group was acidified with 0.1N HCL to a pH of approximately 4.6 from
an initial pH range of 6.50 - 6.52, using pH meter (Accumet AR15 pH meter, Fisher
Scientific, Mississauga, Ontario). This is to say that one sample of heated 3.43% aqueous
WPC 35 solution was acidified while the other sample was not acidified. This scenario
holds for the unheated and “heated and homogenized” samples as well. All the prepared
samples were constantly brought to stirring to avoid sedimentation of samples especially
for the acidified ones. The constant stirring was not a rigorous stirring but a mild one, so
as not to leave the prepared sample in a total state of rest. This condition of stirring was
also consistent for all the concerned samples. The samples were thereafter weighed (~88
g) into centrifuge bottles (~31 g) of an ultracentrifuge (Sorvall WX Ultra series
ultracentrifuge, Thermo Fisher Scientific, Germany).
The filled centrifuge bottles were carefully arranged in the F37L – 8 x 100 rotor to be
placed in the rotor chamber of the ultracentrifuge. The centrifugation was carried out at
48 000 g for 1 hour at 20°C. After the centrifugation was completed, the samples were
carefully brought out of the ultracentrifuge and the supernatants of all the centrifuged
samples were collected into well-label separate containers. For each of the three
categories of the WPC 35 solutions which are unheated, heated and “heated and
homogenized” samples, acidified, unacidified, supernatant of acidified and finally
supernatant of unacidified samples were analyzed for total protein contents. There were
pellets formed in all the centrifuged WPC 35 samples but the amount of aggregate protein
fractions in the pellets were accounted for in the results and discussion section. A
diagram of the process of protein separation is shown in the Figure 1.

10
3.6.2 Emulsions The emulsions prepared from varied durations of heat treatment of aqueous 6.86% WPC
35 solutions at 70°C for 10, 15 and 20 minutes respectively were also centrifuged in
order to quantify the total protein content of the aqueous phase/serum of the emulsions.
The emulsions of the 3 samples; 70°C for 10 minutes, 70°C for 15 minutes and 70°C for
20 minutes, were carefully weighed into centrifuge bottles of the F37L – 8 x 100
centrifuge rotor and carefully places in the rotor chamber of the ultracentrifuge. The
centrifugation of the emulsions was carried out at 6 000 g for 45 minutes at 4°C. At this
condition, there was no pellet formed in the centrifuged samples and in samples where
there were appearances of pellets, the amount was negligible. The serum of the different
samples was carefully collected from the centrifuged samples into well-labeled
containers, avoiding the top cream layers. Again, the pH of the serum were adjusted to
approximately 4.6 with 0.1N HCL from the initial pH range of 6.3 - 6.4. The acidified
serum was re-centrifuged following the same procedure at 48 000 g for 1 hour at 20°C.
The supernatants of the re-centrifuged serum of different samples were also carefully
collected and both the original serum with the supernatant of the acidified samples was
analyzed for total protein contents. A diagram of the process of protein separation is
shown in Figure 2.
Figure 1: A chart of WPC 35 protein separation process used in this study

11
Figure 2: A chart of protein separation process of an emulsion
12
3.7 Quantification of total protein in samples
The different samples of aqueous WPC 35 solutions heated at 70°C for 10, 15 and 20
minutes respectively, with the serum of their resulting emulsions were collected into
separate well labeled containers after centrifugation. The total protein contents
quantification of samples were carried out using Dumas combustion method (Leco FP –
528, Mississauga, ON, Canada) and the obtained nitrogen values were multiplied by a
conversion factor of 6.28. The obtained values were further computed as the case may be
for each sample as shown in the most tables in the results and discussion section. All
experiment would be done in replicates and all samples would be analyzed for an
advanced identification and quantification of proteins using High-performance size
exclusion chromatography (HPSEC) and Sodium dodecyl sulfate polyacrylamide gel
electrophoresis (SDS-PAGE).

13
4 Results
4.1 Measure of particle size distributions of the different samples
The graph of comparison in the particle size distribution of the different samples of
unheated aqueous 6.86% WPC 35 solutions assessed on the Day 1, Day 2 and Day 3 of
sample preparations is shown in Figure 3. This is an important step in the study as there is
a close relationship between protein structures and their functionalities (Sajedi et al.,
2014). The distribution shows that the prepared sample at Day 1 has the smallest particle
size, followed by Day 2, with Day 3 sample having the largest. The particle size
distribution of 3 samples of aqueous 6.86% WPC 35 heated at 70°C at different durations
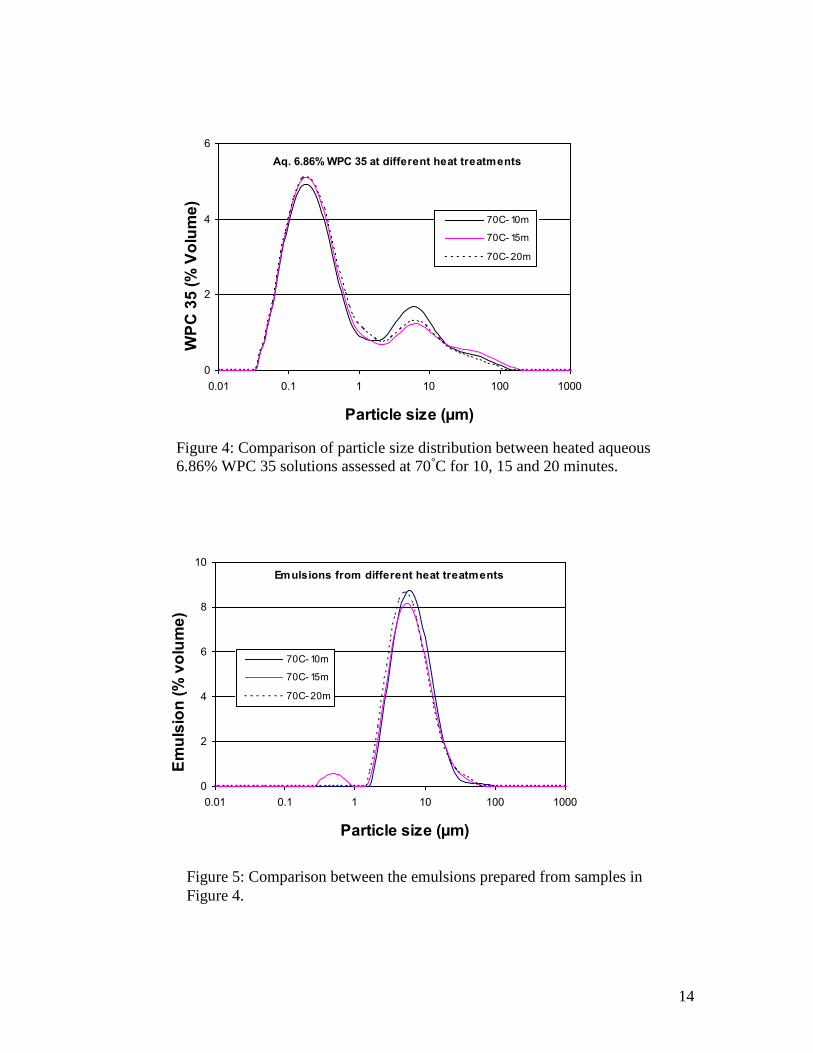
of 10, 15 and 20 minutes respectively is shown in Figure 4. The different samples of
heated aqueous WPC 35 solutions observed (Figure 4) were used to prepare emulsions.
The particle size distributions of the resulting emulsions were also assessed (Figure 5).
Figure 3: Comparison between the particle size distributions of unheated
aqueous 6.86% WPC 35 solutions assessed on the Day 1, Day 2 and Day 3.
Unheated Aq. 6.86% WPC 35 solution
0
2
4
6
0.01 0.1 1 10 100 1000
Particle size (µm)
WPC
35
(% v
olum
e)
Day 1
Day 2
Day 3
14
Figure 4: Comparison of particle size distribution between heated aqueous
6.86% WPC 35 solutions assessed at 70°C for 10, 15 and 20 minutes.
Aq. 6.86% WPC 35 at different heat treatments
0
2
4
6
0.01 0.1 1 10 100 1000
Particle size (µm)
WPC
35
(% V
olum
e)70C- 10m
70C- 15m
70C- 20m
Figure 5: Comparison between the emulsions prepared from samples in
Figure 4.
Emulsions from different heat treatments
0
2
4
6
8
10
0.01 0.1 1 10 100 1000
Particle size (µm)
Emul
sion
(% v
olum
e)
70C- 10m
70C- 15m
70C- 20m

15
Table 1: Mean droplet sizes [D3,2] (± standard deviation) of the different prepared samples
from aqueous 6.86% WPC 35 solution
Different attributes of aq. 6.86%
WPC 35 solution observed
Samples Mean droplet sizes
[D3,2] of samples (µm) Unheated aq. 6.86% WPC 35 solution Day 1 0.228±1.343
Day 2 0.223±1.359
Day 3 0.230±1.317
Aq. 6.86% WPC 35 solution at different
heat treatments
70°C for 10 minutes 0.219±1.397
70°C for 15 minutes 0.212±1.441
70°C for 20 minutes 0.212±1.464
Emulsions from different heat treatments
of aq. 6.86% WPC 35 solution
70°C for 10 minutes 5.936±2.344
70°C for 15 minutes 4.253±2.191
70°C for 20 minutes 5.433±2.293
In order to further have the knowledge of the different samples of aqueous WPC 35
solutions and the different resulting emulsions for the best optimization of their
functionalities, the prepared samples were further analyzed (Sajedi et al., 2014; Lam &
Nickerson, 2013; Shakeel et al., 2012; Gaygadzhiev et al., 2009; Roufik et al., 2005). The
results of the varied attributes and parameter are reported in Figure 6 and Table 1. The
samples whose results are shown in Figure 6 were produced from the prepared aqueous
6.86% WPC 35 solutions, refrigerated until Day 2 and heated at 70°C for 15 minutes.
Figure 6a shows the relationship in the particle size distribution of unheated and heated
aqueous 6.86% WPC 35 solution. Figure 6b shows the relationship between the particle
size distributions of emulsions made from heated and unheated aqueous 6.86% WPC 35
in Figure 6a. Figure 6c shows the characteristic particle size distributions of heated and
homogenized aqueous 6.86% WPC 35 solution in relation to unheated but homogenized
aqueous 6.86% WPC 35 solution. Figure 6d reveals the relationship in the particle size
distributions of emulsions of samples shown in Figure 6c. Figure 6e and 6f shows the
relationship between heated and “heated and homogenized” aqueous 6.86% WPC 35
solutions and the resulting emulsions from the two samples.

16
Figure 6: Comparison of the particle size distribution of unheated/heated aqueous
6.86% WPC35 solution (a) and its emulsion (b), as well as homogenized
unheated/heated aqueous 6.86% solution (c) and its emulsion (d). Comparison of
heated and heated/homogenized aqueous 6.86% WPC 35 solution and its emulsion are
shown in plot (e) and (f). All samples in this figure were prepared on Day 2 at 70°C for
15 minutes.
Emulsions from 6.86% WPC 35 solutions
0
2
4
6
8
10
12
0.01 0.1 1 10 100 1000
Particle size (µm)
Emul
sion
(% v
olum
e)
Heated
Heated&Homo
Aq. 6.86% WPC 35 solutions
0
2
4
6
8
0.01 0.1 1 10 100 1000
Particle size (µm)
WPC
(% v
olum
e)
Heated
Heated&Homo
Homo. Aq. 6.86% WPC 35 dispersion
0
2
4
6
8
0.01 0.1 1 10 100 1000
Particle size (µm)
WPC
35
(% v
olum
e)
Unheated
Heated
Emulsion from Homo. 6.86% WPC 35 Solution
0
2
4
6
8
10
12
0.01 0.1 1 10 100 1000
Particle size (µm)
Emul
sion
(% v
olum
e)Unheated
Heated
Aq. 6.86% WPC 35 solutions
0
2
4
6
8
0.01 0.1 1 10 100 1000
Particle size (µm)
WPC
35
(% v
olum
e)
Unheated
Heated
Emulsions from 6.86% WPC 35 Solution
0
2
4
6
8
10
12
0.01 0.1 1 10 100 1000
Particle size (µm)
Emul
sion
(% v
olum
e)
Unheated
Heated

17
Table 2: Mean droplet sizes [D3,2] (± standard deviation) of the different prepared samples
from aqueous 6.86% WPC 35 solution experimented at 70°C for 15 minutes
Different attributes
of Day 2 aq. 6.86%
WPC 35 solutions
heated at 70°C for
15 minutes
Mean droplet sizes [D3,2] of samples (µm)
Aq. WPC 35
solution
Homo. aq.
WPC 35
solutions
Emulsion
from WPC 35
samples
Emulsion from
homo. WPC 35
samples Unheated 0.223±1.359 0.174±1.681 3.109±2.181 3.725±2.183
Heated 0.212±1.441 0.176±1.696 4.253±2.191 6.394±2.453
Heated and homo 0.176±1.696 _ 6.394±2.453 _
4.2 Quantification of total protein contents of samples
Table 3: Quantification of protein contents for 3.43% aqueous WPC 35 solutions with
heat treatment at 70°C for 10 minutes
Samples of WPC 35
solution
Total
protein
content (%)
Amount of protein in the
supernatant (%)
Amount of protein
in the pellet (%)
Unheated 1.300 1.137 (+ soluble aggregates) 0.163
Heated 1.262 1.149 (+ soluble aggregates) 0.113
Heated and homo 1.287 1.143 (+ soluble aggregates) 0.144
Unheated + HCL 1.225 1.093 (native) 0.132
Heated + HCL 1.212 0.967 (native) 0.245
Heated and homo + HCL 1.212 0.917 (native) 0.295
The Table 3 above show the percentage total protein content obtained for each of the
sample listed in the table by multiplying the total nitrogen value obtained from Dumas
analysis by a conversion factor of 6.28. The amount of percentage protein contents in the
supernatant of each of the samples was also generated directly from Dumas. The acidified
samples would have just the percentage native proteins in their supernatants while the
unacidified samples would have both the native and soluble protein aggregates in their
supernatants, according to Roufik et al. (2005). All other protein contents less of the
percentage total protein content of each of the samples was assumed to be the percentage
amount of insoluble protein aggregates in each of the sample, which is residual in their
pellets. Percentage soluble protein aggregates were obtained by subtracting the
percentage amount of protein in the supernatant of acidified unheated sample (native
protein) from the percentage amount of protein in the supernatant of unacidified unheated
18
sample (native and soluble protein aggregates) (Anandharamakrishnan et al., 2008;
Pelegrine & Gasparetto, 2005).
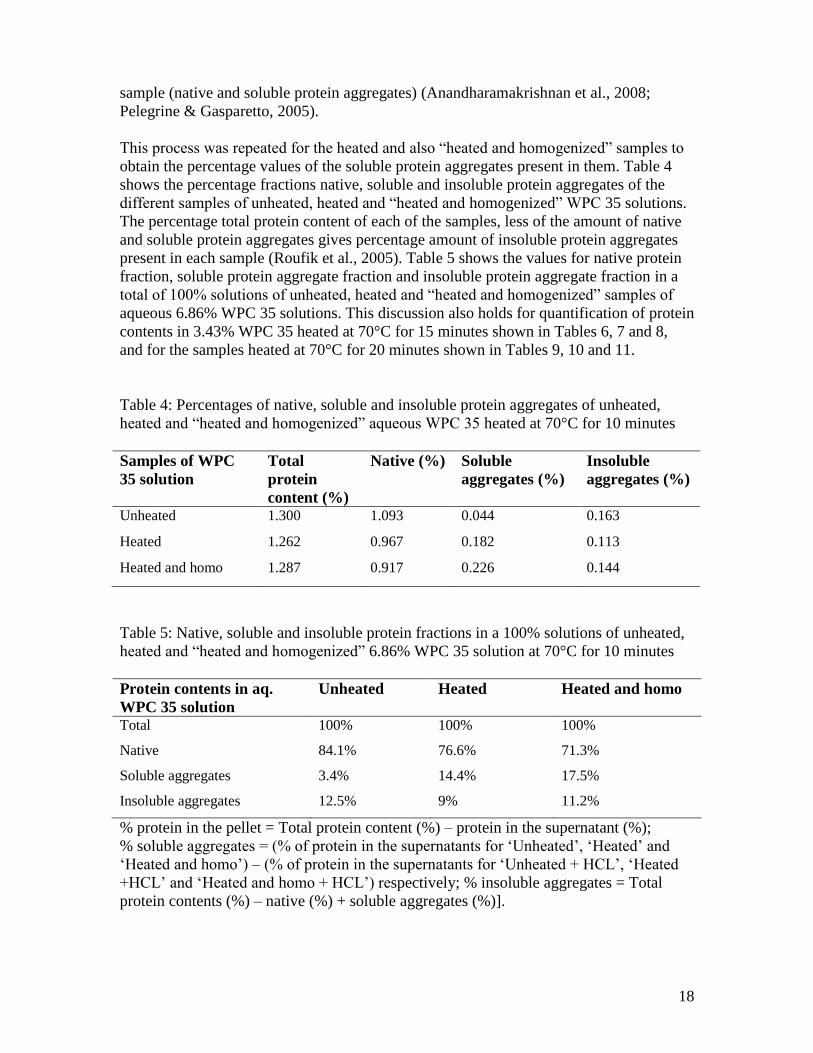
This process was repeated for the heated and also “heated and homogenized” samples to
obtain the percentage values of the soluble protein aggregates present in them. Table 4
shows the percentage fractions native, soluble and insoluble protein aggregates of the
different samples of unheated, heated and “heated and homogenized” WPC 35 solutions.
The percentage total protein content of each of the samples, less of the amount of native
and soluble protein aggregates gives percentage amount of insoluble protein aggregates
present in each sample (Roufik et al., 2005). Table 5 shows the values for native protein
fraction, soluble protein aggregate fraction and insoluble protein aggregate fraction in a
total of 100% solutions of unheated, heated and “heated and homogenized” samples of
aqueous 6.86% WPC 35 solutions. This discussion also holds for quantification of protein
contents in 3.43% WPC 35 heated at 70°C for 15 minutes shown in Tables 6, 7 and 8,
and for the samples heated at 70°C for 20 minutes shown in Tables 9, 10 and 11.
Table 4: Percentages of native, soluble and insoluble protein aggregates of unheated,
heated and “heated and homogenized” aqueous WPC 35 heated at 70°C for 10 minutes
Samples of WPC
35 solution
Total
protein
content (%)
Native (%) Soluble
aggregates (%)
Insoluble
aggregates (%)
Unheated 1.300 1.093 0.044 0.163
Heated 1.262 0.967 0.182 0.113
Heated and homo 1.287 0.917 0.226 0.144
Table 5: Native, soluble and insoluble protein fractions in a 100% solutions of unheated,
heated and “heated and homogenized” 6.86% WPC 35 solution at 70°C for 10 minutes
Protein contents in aq.
WPC 35 solution
Unheated Heated Heated and homo
Total 100% 100% 100%
Native 84.1% 76.6% 71.3%
Soluble aggregates 3.4% 14.4% 17.5%
Insoluble aggregates 12.5% 9% 11.2%
% protein in the pellet = Total protein content (%) – protein in the supernatant (%);
% soluble aggregates = (% of protein in the supernatants for ‘Unheated’, ‘Heated’ and
‘Heated and homo’) – (% of protein in the supernatants for ‘Unheated + HCL’, ‘Heated
+HCL’ and ‘Heated and homo + HCL’) respectively; % insoluble aggregates = Total
protein contents (%) – native (%) + soluble aggregates (%)].

19
Table 6: Quantification of protein contents for 3.43% aqueous WPC 35 solutions with
heat treatment at 70°C for 15 minutes
Samples of WPC 35
solution
Total
protein
content (%)
Amount of protein in the
supernatant (%)
Amount of protein
in the pellet (%)
Unheated 1.507 1.281 (+ soluble aggregates) 0.226
Heated 1.514 1.231 (+ soluble aggregates) 0.283
Heated and homo 1.551 1.275 (+ soluble aggregates) 0.276
Unheated + HCL 1.407 1.168 (native) 0.239
Heated + HCL 1.915 1.105 (native) 0.81
Heated and homo + HCL 1.262 1.086 (native) 0.176
Table 7: Percentages of native, soluble and insoluble protein aggregates of unheated,
heated and “heated and homogenized” samples heated at 70°C for 15 minutes
Samples of WPC 35
solution
Total protein
content (%)
Native (%) Soluble
aggregates (%)
Insoluble
aggregates (%) Unheated 1.507 1.168 0.113 0.226
Heated 1.514 1.105 0.126 0.283
Heated and homo 1.551 1.086 0.189 0.276
Table 8: Native, soluble and insoluble protein fractions in a 100% solutions of unheated,
heated and “heated and homogenized” 6.86% WPC 35 solution at 70°C for 15 minutes
Protein contents in aq.
WPC 35 solution
Unheated Heated Heated and homo
Total 100% 100% 100%
Native 77.5% 73% 70%
Soluble aggregates 7.5% 8.3% 12.2%
Insoluble aggregates 15% 18.7% 17.8%

20
Table 9: Quantification of protein contents for 3.43% aqueous WPC 35 solutions with
heat treatment at 70°C for 20 minutes
Samples of WPC 35
dispersion
Total
protein
content (%)
Amount of protein in the
supernatant (%)
Amount of
protein in the
pellet (%) Unheated 1.043 0.999 (+ soluble aggregates) 0.044
Heated 1.124 0.967 (+ soluble aggregates) 0.157
Heated and homo 1.143 1.024 (+ soluble aggregates) 0.119
Unheated + HCL 1.068 0.986 (native) 0.082
Heated + HCL 1.005 0.904 (native) 0.101
Heated and homo + HCL 1.043 0.936 (native) 0.107
Table 10: Percentages of native, soluble and insoluble protein aggregates of unheated,
heated and “heated and homogenized” samples heated at 70°C for 20 minutes
Samples of WPC 35
solution
Total protein
content (%)
Native (%) Soluble
aggregates (%)
Insoluble
aggregates (%)
Unheated 1.043 0.986 0.013 0.044
Heated 1.124 0.904 0.063 0.157
Heated and homo 1.143 0.936 0.088 0.119
Table 11: Native, soluble and insoluble protein fractions in a 100% solutions of unheated,
heated and “heated and homogenized” 6.86% WPC 35 solution at 70°C for 20 minutes
Protein contents in WPC
35 solution
Unheated Heated Heated and homo
Total 100% 100% 100%
Native 94.53% 80.43% 81.89%
Soluble aggregates 1.25% 5.60% 7.70%
Insoluble aggregates 4.22% 13.97% 10.41%

21
Table 12: Summary of the percentage native, soluble and insoluble aggregate protein
fractions in unheated, heated and “heated and homogenized” aqueous 6.86% WPC 35
solutions prepared at 70°C for 10, 15 and 20 minutes
Temperature and
durations of
samples’ heat
treatments
Samples Protein contents in 6.86% WPC 35 solution
Total Native
protein
Soluble
aggregate
protein
Insoluble
aggregate
protein 70°C for 10 minutes Unheated 100% 84.1% 3.4% 12.5%
Heated 76.6% 14.4% 9%
Heated and homo 71.3% 17.5% 11.2%
70°C for 15 minutes Unheated 100% 77.5% 7.5% 15%
Heated 73% 8.3% 18.7%
Heated and homo 70% 12.2% 17.8%
70°C for 20 minutes Unheated 100% 94.53% 1.25% 4.22%
Heated 80.43% 5.6% 13.97%
Heated and homo 81.89% 7.7% 10.41%
Table 13: Summary of the total amount protein contents in the serum of the resulting
emulsions from samples experimented at 70°C for 10, 15 and 20 minutes
Total Protein contents in
6.86% WPC 35 -
based emulsions
Samples Emulsions
70°C for 10
minutes
70°C for 15
minutes
70°C for 20
minutes
Serum 1.790 1.746 1.576
Supernatant of
acidified serum
1.400 (native) 1.168 (native) 1.287 (native)
Aggregated
protein content
0.390 0.578 0.289
100% Native protein fraction 78.2% 66.9% 81.7%
100% Aggregated protein
fraction
21.8% 33.1% 18.3%

22
5 Discussions
5.1 Measure of Particle size distributions
The results of the measures of particle size distributions of the prepared samples of both
aqueous 6.86% WPC 35 solutions and the resulting emulsions is shown as plots in
Figures 3, 4, 5 and 6. These results is also presented as mean droplet sizes in Tables 1and
2. The measure of particle size distribution of each prepared sample becomes very
necessary in this project as it a quick measure to assess the stability, functionality and
acceptability of the different samples of WPC 35 and the resulting emulsions (Nakashima
et al., 2000; Huang et al., 2001; Coupland & McClements, 2001; Chanamai &
McClements, 2001; Bouchemal et al., 2004). Literature reports that despite the rising
awareness of whey proteins (WP) and whey protein concentrates (WPC) in the food
industry, some undesirable changes may occur in the physico-chemical properties of both
WP and WPC, which must be adequately handled (Carbonaro et al., 1998). For instance,
the process of pre-heating WPC often aggravates protein denaturation and aggregation
(Carbonaro et al., 1998; Pelegrine & Gasparetto, 2005; Gulzar et al., 2011; Dissanayake
et al., 2013). The measure of particle size distribution is therefore a control measure to
understudy if samples’ particles are still within the food manufacturers’ target.
All the samples explored in this project are prepared from WPC 35 and the heat
treatments of aqueous 6.86% WPC 35 solutions are carried out at 70°C. This is because
WPC 35 has the capability to be heat-treated at different degrees of temperatures without
its functionalities being negatively affected. The fact is further established as Lim et al.
(2008) also reported that heat treatment temperature greater than 75°C usually negatively
affect the functional properties of proteins except for WPC 35.
5.2 Quantification of native and aggregated protein contents
A summary of the different percentages of native, soluble and insoluble aggregate protein
fractions of unheated, heated and “heated and homogenized” aqueous 6.86% WPC 35
solution prepared at 70°C for 10, 15 and 20 minutes is given in Table 12. At heat
treatment 70°C for 10 minutes, there is 76.6% native protein fraction in the heated
sample while there is a total 23.4% aggregated protein fraction. The heated and
homogenized sample at this heat treatment has 71.3% protein in the native state, with
17.5% protein as soluble aggregate protein and 11.2% protein as insoluble aggregate
protein fraction. The result obtained from the heated and homogenized sample shows a
little less value compared to the value obtained from ordinary heated sample at its native
state and a little more value than the values at the aggregated state of heated sample. This
might be due to improved solubility of the homogenized samples (Lam & Nickerson,
2013; Schmidt et al., 1984). Moreover, smaller sized aggregates have the tendency to
diffuse to the interfaces higher than the larger aggregates (Sajedi et al., 2014). The
unheated sample at this preparation has more native protein of 84.1% and total denatured
protein content of 15.9%. Since there was no heat treatment of any form on this sample,
the aggregated protein fraction was assumed to be due to the heat treatment the WPC 35
powder was subjected to in the process of drying during manufacture (Dickow et al.,
2012; Anandharamakrishnan et al., 2008; Mangino et al., 1987).

23
Also for the set of samples heated at 70°C for 15 minutes, the results show that there are
more aggregated protein fractions in relative to the samples heated at 70°C for 10
minutes. This could obviously be due to longer period of heating (Boutin et al., 2007;
Mangino et al., 1987; Schmidt et al., 1984). Also, Raikos (2010) reported that with heat
treatment of between 60°C - 90°C for about 1000 seconds on whey protein solution, large
protein aggregates are formed. The more aggregated protein fraction obtained in a
sample, the less native protein fraction remaining in such sample. For all the samples,
there were more native protein contents in the unheated samples. This was due to no
laboratory heat treatment samples leading to less protein denaturation and less protein
aggregate formation (Schmidt et al., 1984; Mangino et al., 1987). Again, for all the
samples heated at 70°C for 10, 15 and 20 minutes, there were more soluble aggregate
proteins in the heated and homogenized samples that there are in the ordinary heated
samples. This might be as a result from the process of further homogenizing the heated
WPC 35 solutions at a pressure of 175 – 200 bars, enhancing better protein solubility
(Sajedi et al., 2014; Lam & Nickerson, 2013).
The slight differences in the values obtained for unheated samples prepared for heating at
70°C for 10minutes and 15 minutes could be due to experimental precision errors such as
in sample weighing, pipetting, accuracy in pH adjustment of the two sets of samples and
period of overnight refrigeration of prepared samples. The prepared WPC 35 dispersion
must be refrigerated overnight for specific number of hours for consistency of results
rather that just refrigerating overnight. As mentioned earlier in this report, the prepared
samples used for 70°C for 10 minutes and 15 minutes experiment were heated on Day 2
while the prepared sample for 70°C for 20 minutes experiment was heated on Day 3. The
results of different protein fractions obtained from the 70°C for 20 minutes experiment
was quite different from the previous trend. The 3 samples show the highest values of
percentage native protein fractions in their 3 sub-samples and the lowest percentage total
aggregated protein fractions in relative to samples treated at 70°C for 10 and 15 minutes
respectively. It was expected that the longer the duration of heat treatment obtained, the
more the denatured protein obtained. Reverse in the case. The likely reason for this result
might be the longer time of refrigeration of the prepared aqueous WPC 35 dispersion,
which was for about 48 hours (Schmidt et al., 1984).
The values obtained for the native and aggregated protein fractions of the serum of
resulting emulsions from aqueous 6.86% WPC 35 solution prepared at 70°C for 10, 15
and 20 minutes respectively was also reported in Table 13. Emulsion from WPC 35
sample prepared at 70°C for 20 minutes has the highest percentage of native protein
fraction of 81.7%. Emulsion from 70°C for 10 minutes sample has 78.2% native protein
fraction in its serum, while 70°C for 15 minutes sample has the least value of 66.9% as its
native protein fraction. The reason for the range of differences in the three values might
not be concluded until an advanced analysis on protein identification and quantification is
conducted. The emulsions and all its components such as cream and serum parts, both
before and after centrifugation would be analyzed in the course of the project. This
analysis would be done using high-performance size exclusion chromatography (HPSEC)
and Sodium dodecyl sulfate polyacrylamide gel electrophoresis (SDS-PAGE).

24
6 Conclusion The results from quantification of the amount of protein present as native protein
fractions and aggregated protein fractions in aqueous 6.86% WPC 35 enables an
improved knowledge of the functionalities of the dispersion (Roufik et al., 2005). De Wit
(1998) described the functionality of whey proteins as being “versatile”. This is as a
result of the adaptability, flexibility, multifacetedness and resourcefulness of whey
proteins, thereby enhancing their modification to perform several functions in the interest
of the manufacturer. This was also proven in this research work. As earlier discussed in
the study, the different stages of the ongoing project, right from the preparation of the
WPC 35 dispersion to the production of fortified cheese has specific desired attributes in
focus. This project therefore has been able to study at a preliminary level some
characteristics of aqueous 6.86% whey protein dispersion under different conditions and
durations of heating, providing information for the next stage of the experiment.
In conclusion, this study emphasizes that heat treatment is of key importance in
optimizing the flexible functionalities of whey protein. Appropriate heating temperature
and period of heating for whey protein denaturation depends on the interest of the
manufacturer per time. Different mean droplet sizes and particle size distributions of
different emulsions are directly related to the type, functionality and stability of such
emulsions. Although it is generally believed that heat treatment decreases protein
functionalities (Dissanayake et al., 2013; Schmidt et al., 1987), however, the
functionalities of whey proteins and their resulting emulsions could be well modified
under controlled conditions (Sünder et al., 2001). The result of this study also shows that
with heat treatment of aqueous 6.86% WPC 35 at 70°C for 10 minutes, there was 76.6%
native protein fraction, 14.4% soluble protein fraction and 9% insoluble protein
aggregates. The resulting emulsion from the heat treatment at 70°C for 10 minutes has
78.2% native protein in its serum after centrifugation. Also, with heat treatment of
aqueous 6.86% WPC 35 at 70°C for 15 minutes, there was 73% native protein fraction,
8.3% soluble protein fraction and 18.7% insoluble protein aggregates. The resulting
emulsion from the heat treatment at 70°C for 15 minutes has 66.9% native protein in its
serum after centrifugation. Finally, with heat treatment of aqueous 6.86% WPC 35 at
70°C for 20 minutes, there was 80.43% native protein fraction, 5.6% soluble protein
fraction and 13.97% insoluble protein aggregates. The resulting emulsion from the heat
treatment at 70°C for 20 minutes has the highest percentage of native protein fraction.
The serum sample of the emulsion contains 81.7% native protein fraction and 18.3%
aggregated protein fraction in its serum after centrifugation.
A major limitation to this research work was the shortness of the period at which the
project was done. This affected the number of times replicates of each sample analyzed
could be done. However, future analysis of the different samples experimented in this
research work would be done at least in triplicates to enable an advanced statistical
analysis on the results. Also further analysis on protein identification and quantification
of the different samples experimented could be done using high-performance size
exclusion chromatography (HPSEC) and Sodium dodecyl sulfate polyacrylamide gel
electrophoresis (SDS-PAGE) in the course of the project. Since this study is a part of an
ongoing project, final conclusion might not be drawn on the results obtained from these
experiments.

25
References Anandharamakrishnan, C., Rielly, C. D., & Stapley, A. G. F. (2008). Loss of solubility of
α-lactalbumin and β-lactoglobulin during the spray drying of whey proteins. LWT-Food
Science and Technology, 41(2), 270-277.
Bouchemal, K., Briançon, S., Perrier, E., & Fessi, H. (2004). Nano-emulsion formulation
using spontaneous emulsification: solvent, oil and surfactant optimisation. International
Journal of Pharmaceutics, 280(1), 241-251.
Boutin, C., Giroux, H. J., Paquin, P., & Britten, M. (2007). Characterization and acid-
induced gelation of butter oil emulsions produced from heated whey protein dispersions.
International dairy journal, 17(6), 696-703.
Capon, C. (2009). Understanding the business environment (3rd edition), Pearson
Education Limited, Harlow, ISBN: 978-0-273-70814-8.
Carbonaro, M., Bonomi, F., Iametti, S., Cappelloni, M., & Carnovale, E. (1998).
Aggregation of proteins in whey from raw and heat-processed milk: formation of soluble
macroaggregates and nutritional consequences. LWT-Food Science and Technology,
31(6), 522-529.
Chanamai, R., & McClements, D. J. (2001). Prediction of emulsion color from droplet
characteristics: dilute monodisperse oil-in-water emulsions. Food Hydrocolloids, 15(1),
83-91.
Coupland, J. N., & McClements, D. J. (2001). Droplet size determination in food
emulsions: comparison of ultrasonic and light scattering methods. Journal of Food
Engineering, 50(2), 117-120.
De Wit, J. N. (1998). Nutritional and functional characteristics of whey proteins in food
products. Journal of Dairy Science, 81(3), 597-608.
Dickow, J. A., Kaufmann, N., Wiking, L., & Hammershøj, M. (2012). Protein
denaturation and functional properties of Lenient Steam Injection heat treated whey
protein concentrate. Innovative Food Science & Emerging Technologies, 13, 178-183.
Dissanayake, M., Ramchandran, L., Donkor, O. N., & Vasiljevic, T. (2013). Denaturation
of whey proteins as a function of heat, pH and protein concentration. International Dairy
Journal, 31(2), 93-99.
Earle, M. & Earle, R. (2008). Case Studies in Food Product Development. Woodhead
Publishing, Cambridge, UK. Electronic ISBN: 978-1-60119-401-5. Pp. 453.

26
Earle, M., Earle, R., & Anderson, A. (2001). Food Product Development. Woodhead
Publishing, Cambridge, UK. Electronic ISBN: 978-1-59124-338-0. Pp. 380.
Gaygadzhiev, Z., Hill, A., & Corredig, M. (2009). Influence of the emulsion droplet type
on the rheological characteristics and microstructure of rennet gels from reconstituted
milk. Journal of dairy research, 76(03), 349-355.
Gulzar, M., Bouhallab, S., Jeantet, R., Schuck, P., & Croguennec, T. (2011). Influence of
pH on the dry heat-induced denaturation/aggregation of whey proteins. Food Chemistry,
129(1), 110-116.
Huang, X., Kakuda, Y., & Cui, W. (2001). Hydrocolloids in emulsions: particle size
distribution and interfacial activity. Food Hydrocolloids, 15(4), 533-542.
Hunt, J. A., & Dalgleish, D. G. (1994). Adsorption behaviour of whey protein isolate and
caseinate in soya oil-in-water emulsions. Food Hydrocolloids, 8(2), 175-187.
Kiokias, S., Reiffers-Magnani, C. K., & Bot, A. (2004). Stability of whey-protein-
stabilized oil-in-water emulsions during chilled storage and temperature cycling. Journal
of agricultural and food chemistry, 52(12), 3823-3830.
Lam, R. S., & Nickerson, M. T. (2013). Food proteins: A review on their emulsifying
properties using a structure–function approach. Food chemistry, 141(2), 975-984.
Landsperger, J. & Spieth, P. (2011). Managing Innovation Networks in the Industrial
Goods Sector. International Journal of Innovation Management, 15(6), 1209-1241.
Lawson, B. & Samson, D. (2001). "Developing innovation capability in organisations: a
dynamic capabilities approach." International Journal of Innovation Management, 5(3),
377-400.
Levinthal, C. (1968). Are there pathways for protein folding. Journal de Chimie
Physique, 65(1), 44-45.
Lim, S. Y., Swanson, B. G., & Clark, S. (2008). High hydrostatic pressure modification
of whey protein concentrate for improved functional properties. Journal of dairy science,
91(4), 1299-1307.
Liu, X., Powers, J. R., Swanson, B. G., Hill, H. H., & Clark, S. (2005). Modification of
whey protein concentrate hydrophobicity by high hydrostatic pressure. Innovative Food
Science & Emerging Technologies, 6(3), 310-317.
Mangino, M. E., Liao, Y. Y., Harper, N. J., Morr, C. V., & Zadow, J. G. (1987). Effects
of heat processing on the functionality of whey protein concentrates. Journal of Food
Science, 52(6), 1522-1524.

27
Manion, B., & Corredig, M. (2006). Interactions between whey protein isolate and soy
protein fractions at oil–water interfaces: Effects of heat and concentration of protein in
the aqueous phase. Journal of food science, 71(8), E343-E349.
Nakashima, T., Shimizu, M., & Kukizaki, M. (2000). Particle control of emulsion by
membrane emulsification and its applications. Advanced drug delivery reviews, 45(1),
47-56.
Pelegrine, D. H. G., & Gasparetto, C. A. (2005). Whey proteins solubility as function of
temperature and pH. LWT-Food Science and Technology, 38(1), 77-80.
Peng, Y., West, G. E., & Wang, C. (2006). Consumer Attitudes and Acceptance of
CLA‐Enriched Dairy Products. Canadian Journal of Agricultural Economics/Revue
canadienne d'agroeconomie, 54(4), 663-684.
Raikos, V. (2010). Effect of heat treatment on milk protein functionality at emulsion
interfaces. A review. Food Hydrocolloids, 24(4), 259-265.
Roufik, S., Paquin, P., & Britten, M. (2005). Use of high-performance size exclusion
chromatography to characterize protein aggregation in commercial whey protein
concentrates. International dairy journal, 15(3), 231-241.
Rush, H., Bessant, J. & Hobday, M. (2007). Assessing the technological capabilities of
firms: developing a policy tool. Research and Development Management, 37(3), 221-
237.
Sajedi, M., Nasirpour, A., Keramat, J., & Desobry, S. (2014). Effect of modified whey
protein concentrate on physical properties and stability of whipped cream. Food
Hydrocolloids, 36, 93-101.
Schmidt, R. H., Packard, V. S., & Morris, H. A. (1984). Effect of processing on whey
protein functionality. Journal of Dairy Science, 67(11), 2723-2733.
Shakeel, F., Shafiq, S., Haq, N., Alanazi, F. K., & Alsarra, I. A. (2012). Nanoemulsions
as potential vehicles for transdermal and dermal delivery of hydrophobic compounds: an
overview. Expert opinion on drug delivery, 9(8), 953-974.
Singh, H. (2011). Aspects of milk-protein-stabilised emulsions. Food Hydrocolloids,
25(8), 1938-1944.
Singh, H., & Sarkar, A. (2011). Behaviour of protein-stabilised emulsions under various
physiological conditions. Advances in colloid and interface science, 165(1), 47-57.
Sünder, A., Scherze, I., & Muschiolik, G. (2001). Physico-chemical characteristics of oil-
in-water emulsions based on whey protein–phospholipid mixtures. Colloids and Surfaces
B: Biointerfaces, 21(1), 75-85.

28
Trott, P. (2012). Innovation Management and New Product Development (5th edition),
Pearson Education Limited, United Kingdom, ISBN: 978-0-273-73656-1.
Visschers, R. W., & de Jongh, H. H. (2005). Disulphide bond formation in food protein
aggregation and gelation. Biotechnology advances, 23(1), 75-80.
Ye, A., & Taylor, S. (2009). Characterization of cold-set gels produced from heated
emulsions stabilized by whey protein. International dairy journal, 19(12), 721-727.

29
Popular Scientific Summary Consumers’ satisfaction and well being is of key importance in the process of food
innovation, of which product development and diversification are good novelty strategies
that could be adopted in achieving this goal. This is because there are great economic
values attached to new product development and/or product diversification, if these
innovation strategies are properly implemented. More so, improved food product
innovation enhances food availability, hence, global food security. In line with this, an
ongoing project at the Food Science Department of the University of Guelph, Ontario,
Canada, poses to conduct a study on recombined dairy creams. This project aims at
improving the quality, taste, availability, nutrient, stability and acceptability of
recombined dairy creams, cheeses and other dairy products, yet with feasible cost and
selling prices of new products.
Usually recombined dairy creams are prepared by homogenizing butter oil with skim
milk. This process, similar to homogenizing milk, produces small fat globules coated
mainly with caseins (milk protein), which can be involved in the casein gel formed
during cheese making thereby causing cheese gel formation. This is undesirable for most
types of cheese because the resulting cheese texture is too tough and rubbery. The
alternative that is being explored in this project is to make the recombined cream with
partially denatured whey proteins. The globules produced when whey proteins are used
are similar in size to native globules of natural milk and of course do not interact with
caseins during cheese making. The presence of non-interacting fat globules in the new
recombined dairy cream becomes desirable as it enhances better product stability before
and after fortification. This also serves as an additional economic advantage of products,
as a longer shelf-life of the new products would be guaranteed.
This study is therefore a preliminary work of exploration in the ongoing project, to study
some processing parameters that might be best suitable for proper optimization of whey
protein in producing the recombined creams. Despite the scientific evidences that whey
proteins are great emulsifier with numerous nutritional, economic and functional
properties, more knowledge is still required for best optimization of whey proteins.
Factors such as heat treatment temperature for partial denaturation, period of
denaturation, condition and period of storage, solubility of the denatured proteins, amidst
others, directly contribute to the type, stability and functionality of the formed emulsions.
For instance, fat globule size distribution of natural milk ranged between 1 - 15µm, any
particle size value less or more than this range would no longer function as natural milk
cream. The new recombined dairy cream and the resulting cheese from this project
therefore have an advantage of better nutrient fortification, reformulation, modification,
taste, stability and better cheese-making property, in relative to the natural cream milk.
The results in this study show the variations in the particle size distributions of the
partially denatured whey protein concentrate 35 (WPC 35) with the emulsions at heat
treatment of 70°C for 10, 15 and 20 minutes respectively. This was to clearly understand
what proportion of whey proteins after denaturation (both at the native and aggregated
forms) gives the best sample for required product stability, cheese-making and
fortification as solubility of emulsifying proteins play a vital role in the formation of good
emulsions.