quantification of the natural hedge characteristics of combination life ... · pdf...
TRANSCRIPT

Quantification of the Natural Hedge Characteristics of Combination Life or Annuity Products Linked to Long-
Term Care Insurance
Sponsored by The Society of Actuaries LTCI Section
and The ILTCI Conference Association
Prepared by Linda Chow, FSA, MAAA
Carl Friedrich, FSA, MAAA Dawn Helwig, FSA, MAAA
Milliman, Inc.
March 2012
© 2012 Society of Actuaries and ILTCI Conference Association, All Rights Reserved
The opinions expressed and conclusions reached by the authors are their own and do not represent any official position or opinion of the Society of Actuaries and the ILTCI Conference Association or their members. The Society of Actuaries and the ILTCI make no representation or warranty to the accuracy of the information.

© 2012 Copyright SOA and ILTCI, All Rights Reserved Milliman, Inc. Page 2
TABLE OF CONTENTS
INDEX OF CHARTS AND TABLES ........................................................................................................ 3
ACKNOWLEDGMENT .............................................................................................................................. 4
DISCLAIMER OF LIABILITY .................................................................................................................... 5
PROJECT OVERVIEW ............................................................................................................................. 6
BACKGROUND .......................................................................................................................................... 7
EXECUTIVE SUMMARY OF FINDINGS ................................................................................................ 9
MARKETS, REGULATIONS AND PRODUCT DESIGN .................................................................... 20
Stand-Alone LTCI Products and Market ........................................................................................... 20
Life Combination Product Structures ................................................................................................ 21
Annuity Combination Product Structures.......................................................................................... 22
Combination Product Market Outlook ............................................................................................... 23
RISK ELEMENTS BY PRODUCT ......................................................................................................... 24
Stand-Alone LTCI ................................................................................................................................. 24
Life Insurance ....................................................................................................................................... 25
Fixed Deferred Annuities ..................................................................................................................... 25
PROTOTYPE PRODUCT DESIGN ....................................................................................................... 27
General Commentary .......................................................................................................................... 27
General Plan Characteristics .............................................................................................................. 27
Prototype Stand-Alone LTCI Product and Its Assumptions ........................................................... 27
Prototype Life/LTCI Combination Product and Its Assumptions ................................................... 27
Prototype Annuity/LTCI Combination Product and Its Assumptions ............................................ 28
QUANTIFICATION OF COMBINATION PRODUCT HEDGE CHARACTERISTICS, AND OBSERVATIONS ..................................................................................................................................... 29
Methodology and Measures ............................................................................................................... 29
Plan Set 2 (2YR AB + 4YR EOB With Inflation) .............................................................................. 29
Plan Sets 3 and 4 (3YR AB + 3YR EOB With and Without Inflation) ........................................... 34
APPENDIX I: ASSUMPTIONS ............................................................................................................... 36
Stand-Alone LTCI Assumptions ......................................................................................................... 36
Life Combination Plan Assumptions ................................................................................................. 37
Annuity Combination Plan Assumptions ........................................................................................... 38
APPENDIX II: TABLES ........................................................................................................................... 41
APPENDIX III: BECKER IRR ................................................................................................................. 49
APPENDIX IV: GLOSSARY ................................................................................................................... 50
© 2012 Copyright SOA and ILTCI, All Rights Reserved Milliman, Inc. Page 3
INDEX OF CHARTS AND TABLES
Chart 1. Present Value of After-Tax Profit, 2 Year AB, 4 Year EOB,
Without Inflation p.10
Chart 2. Internal Rate of Return (IRR), 2 Year AB, 4 Year EOB, Without Inflation p.11
Chart 3. Percentage Change in PV After-Tax Profit from Best Estimate by
Scenario, 2 Year AB, 4 Year EOB, Without Inflation p.12
Chart 4. Percentage Change in IRR from Best Estimate by Scenario, 2 Year AB,
4 Year EOB, Without Inflation p.13
Table A. Scenario B: 115% of Active Life Mortality—Life Combination Plan p.15
Table B. Scenario B: 115% of Active Life Mortality—Annuity Combination Plan p.15
Table C. Scenario E: 50% of Standard Lapse—Life Combination Plan p.17
Table D. Scenario E: 50% of Standard Lapse—Annuity Combination Plan p.18
Chart 5. Present Value of After-Tax Profit, 2 Year AB with 4 Year EOB,
With Inflation p.30
Chart 6. Percentage Change in Present Value of After-Tax Profit from Best
Estimate by Scenario, 2 Year AB, 4 Year EOB, With Inflation p.31
Chart 7. Percentage Change in IRR from Best Estimate by Scenario,
2 Year AB, 4 Year EOB, With Inflation p.32
Chart 8. Percentage Change in PV of Profit, 2 Year AB, 4 Year EOB versus
3 Year AB, 3 Year EOB, Without Inflation p.34
Chart 9. Percentage Change in IRR, 2 Year AB, 4 Year EOB vs. 3 Year AB, 3
Year EOB, Without Inflation p.35
Appendix II: Tables
Table 1. Aggregate Results, Set 1: 2 Yr AB/4 Yr EOB, Without Inflation p.41
Table 2. By Age, Set 1: 2 Yr AB/4 Yr EOB, Without Inflation p.42
Table 3. Aggregate Results, Set 2: 2 Yr AB/4 Yr EOB, With Inflation p.43
Table 4. By Age, Set 2: 2 Yr AB/4 Yr EOB, With Inflation p.44
Table 5. Aggregate Results, Set 3: 3 Yr AB/3 Yr EOB, Without Inflation p.45
Table 6. By Age, Set 3: 3 Yr AB/3 Yr EOB, Without Inflation p.46
Table 7. Aggregate Results, Set 4: 3 Yr AB/3 Yr EOB, With Inflation p.47
Table 8. By Age, Set 4: 3 Yr AB/3 Yr EOB, With Inflation p.48

© 2012 Copyright SOA and ILTCI, All Rights Reserved Milliman, Inc. Page 4
ACKNOWLEDGMENT
The authors would like to thank the Society of Actuaries, the ILTCI Conference Association, and the following members of the Project Oversight Group and SOA staff for their time and direction in developing the research and this report.
David Benz Vince Bodnar
Mark Costello Bob Darnell
Jim Glickman Roger Loomis
Barbara Scott Steven Siegel
Mark Whitford
We would also like to thank several Milliman staff members for their contributions in the preparation of these materials, including Katie Finch, Nicole Gaspar, Gina Ritchie, Melinda Willson, Wenjie Xue and Deyu Zhou.
© 2012 Copyright SOA and ILTCI, All Rights Reserved Milliman, Inc. Page 5
DISCLAIMER OF LIABILITY
Any distribution of this report must be in its entirety. Nothing contained in this report is to be used in any filings with any public body, including, but not limited to state regulators, the Internal Revenue Service, and the U.S. Securities and Exchange Commission. Milliman, its directors, officers and employees, disclaim liability for any loss or damage arising or resulting from any error or omission in Milliman’s analysis and summary of the survey results or any other information contained herein. The report is to be reviewed and understood as a complete document.
This report is published by the Society of Actuaries (SOA) and the ILTCI Conference Association. The information published in this report was developed from hypothetical products and assumptions intended to be representative of the market and reasonable when those assumptions were developed. The SOA, Milliman, and the ILTCI Conference Association do not recommend, encourage, or endorse any particular use of the information provided in this report. The SOA, the ILTCI Conference Association and Milliman make no warrant, guarantee, or representation whatsoever and assume no liability or responsibility in connection with the use or misuse of this report.
© 2012 Copyright SOA and ILTCI, All Rights Reserved Milliman, Inc. Page 6
PROJECT OVERVIEW
Milliman, Inc. (Milliman) was retained by the Society of Actuaries (SOA) and the ILTCI Conference Association to conduct research relative to quantification of the natural hedge characteristics of combination products that link life insurance or annuities with long-term care insurance (LTCI). The study includes an overview of the market for stand-alone long-term care insurance and both life and annuity combination products, including a summary of key design considerations and a market outlook for these plans. It also includes a review of key pricing considerations for these products. The report culminates with quantification of profitability for each product, and summarizes the changes to profit results under a range of sensitivity tests conducted on key pricing parameters. Observations are provided to assist in the understanding of the factors that explain the sensitivity results and the natural hedging against major risks that inherently is present within the linked products.
© 2012 Copyright SOA and ILTCI, All Rights Reserved Milliman, Inc. Page 7
BACKGROUND
Insurance products that combine life insurance or annuities with long-term care insurance have a number of financial characteristics that are very different from the risks inherent in stand-alone long-term care insurance products. These combination products are not always an appropriate alternative to stand-alone long-term care insurance for the consumer. However, the evolution of these products has led to a variety of designs that can comprehensively address the long-term care insurance needs for many consumers. Most combination plans are single premium products, and these products provide cash values for policyholders in the event they want to discontinue their coverage. This helps overcome a common concern of potential purchasers of stand-alone LTCI, the risk of never receiving any benefits from the policy.
In general, combination products (combos) include two different coverage elements: a life or annuity base plan chassis coupled with a long-term care rider. Normally, both coverage elements must be kept inforce together under these plans.
Most combination products feature a form of cross-funding by the consumer relative to LTCI in that the first layer of LTCI benefits is paid out of the policyholder’s base plan values, either the cash value of an annuity base plan or the acceleration of life insurance benefits prior to death. The latter includes a pro rata share of cash values within the life insurance product. These accelerated benefit (AB) riders commonly pay out monthly long-term care benefits over two to three years, after which the life insurance values are depleted, maximum long-term care benefits have been paid, and the entire coverage ends. AB riders can provide real value in that they allow the policyholders to receive the full face amount of the life insurance in advance of death, in some cases years or even decades in advance of their death, when the life insurance benefit would normally be paid. This provides value to the consumer. The cost to the consumer is reduced significantly relative to the cost of a stand-alone LTCI policy coupled with a stand-alone life or annuity plan, because of the cross-funding characteristics of combination plans. At the same time, it represents a reduction to the risk to the insurance company versus coverage provided under stand-alone LTCI, since the company would be required to pay that same dollar amount to the policyholder ultimately as a life insurance benefit.
Newer, more comprehensive forms of combination coverage continue paying LTCI benefits after the full acceleration of base plan values. These supplementary “extension of benefit (EOB) riders” continue providing LTCI protection for another period of time that often is one to two times the length of the acceleration benefit period. These round out the LTCI coverage by providing more comprehensive coverage for more catastrophic LTCI needs, which can extend well beyond the typical two-year acceleration of benefit coverage period. These policies, i.e., combination plans that
© 2012 Copyright SOA and ILTCI, All Rights Reserved Milliman, Inc. Page 8
include EOB riders, are the focus of this paper. They address a broader range of consumer needs than plans for which the only LTCI benefit is an acceleration benefit.
From the company’s perspective, these policies reflect reduced risk versus the same LTCI benefit dollars provided by stand-alone LTCI. In terms of the risk of underpricing of LTCI benefits per dollar of total premium, these combination plans further dilute the LTCI risk since portions of the premium dollars are directed toward providing the cash values and insurance protection offered by the base plan itself. In addition, some of the pricing factors that normally reduce profit in a life insurance or annuity plan when sold alone have a dampened impact when that same base plan is sold with an LTCI rider, creating a form of internal hedging effect of risks for the insurance company. For example, higher mortality on a life combination product reduces profits for the life base plan. However, for typical LTCI riders featuring level charges, the implication of higher mortality is that fewer policyholders reach the advanced ages where LTCI claim costs are well in excess of the charges for the LTCI coverage. If higher mortality extends to those individuals who are receiving LTCI benefits, it also translates to reduced LTCI payouts.
The following report will highlight the favorable characteristics of these combination plans that serve to reduce the risks to insurers issuing these products. These risks are quantified and compared against similar risks assumed in the sale of stand-alone LTCI products.
It should be understood that comparable analysis could be provided on policies that include only acceleration benefits for LTCI, and the dilution of risks would be even more apparent with respect to companies’ exposure to key LTCI risk elements. But many of the pricing synergies of the more comprehensive combination products that include extension of benefit provisions do not exist with the simpler combination plans that only add on acceleration benefit riders.

© 2012 Copyright SOA and ILTCI, All Rights Reserved Milliman, Inc. Page 9
EXECUTIVE SUMMARY OF FINDINGS
This report quantifies profits for three hypothetical insurance products intended to be generally representative of plans in the market. Those include a stand-alone LTCI plan, a life/LTCI combination product and an annuity/LTCI product, each of which provides similar nominal LTCI benefits to the policyholder over a maximum benefit period of six years. The Executive Summary here specifically covers the combination products that assume a two-year acceleration period and a four-year extension period, while the stand-alone LTCI plan is a six-year coverage period. These are referenced as “Plan Set 1” in the report.
Results under a wider range of policy benefit levels are presented in the “Quantification” section of the report beginning on page 29, and in the tables of values in Appendix II. Those include combination plans with three-year accelerations coupled with three-year extensions, and plans that include 5 percent compound inflation benefits. Results for the three issue ages in the study (55, 65 and 75) are also presented separately for each plan in Appendix II.
One profit measure included is the present value of after-tax statutory profits over the life of the business, derived using a discount rate equal to the net investment earnings rate (NIER). Secondly, internal rates of return (IRRs) to the company reflecting statutory earnings and capital requirements are presented.
Percentage changes to profit results, moving from best estimate assumptions to alternative scenarios (generally adverse), are presented and discussed following Charts 1 through 4. For example, if the IRRs under best estimates for a given plan drop from 12 percent under best estimates to 8 percent under a given adverse scenario, this is presented as a 33 percent reduction in IRRs. These results are individually presented under a range of sensitivity tests that were conducted on key pricing parameters. This report does not examine scenarios where multiple adverse factors are present simultaneously.

© 2012 Copyright SOA and ILTCI, All Rights Reserved Milliman, Inc. Page 10
Because the combination plans include additional elements of coverage beyond LTCI, i.e., the base plans themselves, the overall premium and present value of profits are generally expected to be higher on the combination plans than on the stand-alone LTCI plan, as seen below in Chart 1. The sensitivities examined include a 15 percent increase in long-term care incidence rates in all years, a 15 percent increase in active life (non-disabled life) mortality in all years, a decrease in interest earnings in all years (described in more detail below), a 10 percent reduction in annual claim termination rates, and a 50 percent reduction in annual lapse rates.
Chart 1

© 2012 Copyright SOA and ILTCI, All Rights Reserved Milliman, Inc. Page 11
Internal rates of return are among the most common profit measures used for U.S. life insurers. The following chart illustrates slightly higher IRRs for stand-alone LTCI than for the combination plans under these hypothetical examples. This should be expected if one believes that the risks for stand-alone LTCI are greater than those for combination products.
Chart 2

© 2012 Copyright SOA and ILTCI, All Rights Reserved Milliman, Inc. Page 12
In general, because the absolute level of profits is quite different per sale by plan, the percentage change in the present value of profits is a better measure of volatility when comparing results across different plans. Thus, that measure is highlighted in the commentary below, as opposed to presenting the change in profits in dollar terms.
Chart 3

© 2012 Copyright SOA and ILTCI, All Rights Reserved Milliman, Inc. Page 13
The following chart presents the percentage change in IRRs as a second key measure of volatility. There are many similarities between the percentage changes in the two profit measures, but the magnitude differs between the two in a number of situations. There are, in fact, scenarios where the present value of profits increases while the IRRs decrease, notably for annuity combinations under lower lapse rate scenarios.
Chart 4

© 2012 Copyright SOA and ILTCI, All Rights Reserved Milliman, Inc. Page 14
Scenario A in the charts addresses the impact on profits related to a 15 percent increase in incidence rates (new LTCI claims) for LTCI in all policy years. Given that policyholders are “cross-funding” the first two years of coverage in the combination plans from their own policy values, the profit sensitivity to LTCI incidence rates in those plans is diluted dramatically versus stand-alone LTCI. This is even more applicable for annuity combinations than life combinations. For example, across all ages in aggregate, stand-alone LTCI shows IRRs decreasing from 14.9 percent to 8.2 percent, a 45 percent reduction (see Chart 4). The life combination plan has only a 13 percent reduction in IRRs, from 12.7 percent to 11.0 percent. The annuity combination plan drops even less, going from an IRR of 12.4 percent to 11.8 percent, a 5 percent reduction.
Comparing Charts 3 and 4, the percentage changes in the present value of profits are generally higher than the percentage changes in the IRR results across the three plans in general, but the general pattern noted above is continued with the greatest impact on LTCI, a lesser reduction to life combo results, and the smallest impact to annuity combo profit margins. Specifically, the present value of LTCI profits drops by 71 percent across all ages, while the life combo drops 14 percent and the annuity combo drops 6 percent.
Scenario B reflects 15 percent higher mortality for all active lives, i.e., those insureds not on claim for long-term care. The mortality assumption for disabled lives is not affected in this scenario. Higher active life mortality hurts profits on life combinations, whereas it helps on stand-alone LTCI due to additional decrements that reduce the long-term LTCI costs. The base plan component of life combinations shows higher losses than the overall package of life plus LTCI, but those losses are hedged by the inclusion of the LTCI components of the coverage.
Table A below illustrates this by age. At age 55, about 30 percent of the profit reduction seen on the life policy is offset by gains on the rider when mortality is increased by 15 percent (the 11.1 percent profit reduction for life only drops to 7.1 percent for life plus LTCI). At age 75, that dampening of volatility is about 70 percent for both profit measures. Note that since the combination product assumed here is a single premium product, the base plan sensitivity to mortality assumptions is lower than would be expected for a level premium life plan, particularly for the older ages where the single premium is quite high compared to life face amount. In fact, the inclusion of the long-term care riders requires a higher premium than that required to fund life base plan coverage alone, and this has an embedded hedging effect in and of itself in reducing the sensitivity of the plan to mortality as that higher premium reduces the life insurance net amount at risk.

© 2012 Copyright SOA and ILTCI, All Rights Reserved Milliman, Inc. Page 15
Table A
Scenario B: 115% of Active Life Mortality—Life Combination Plan
Issue Age
Percentage Change in PV profit
Percentage Change in IRR
Life Base Plan Only
55 -11.1% -4.2%
65 -14.7% -6.2%
75 -23.1% -11.4%
Life + LTCI
55 -7.1% -3.1%
65 -7.2% -3.5%
75 -6.6% -3.4%
Annuity combination sensitivities are fairly limited as mortality hurts the annuity base plan profits to a small degree, given that mortality acts as another decrement that reduces the time over which acquisition expenses can be amortized. Those losses are offset by gains related to the LTCI rider with higher mortality, particularly at older ages.
Table B
Scenario B: 115% of Active Life Mortality—Annuity Combination Plan
Issue Age
Percentage Change in PV profit
Percentage Change in IRR
Annuity Base Plan Only
55 -0.8% -0.3%
65 -2.2% -0.9%
75 -6.3% -3.0%
Annuity + LTCI
55 -1.1% -0.3%
65 -1.8% -0.4%
75 -3.4% -0.7%
© 2012 Copyright SOA and ILTCI, All Rights Reserved Milliman, Inc. Page 16
In Scenario C, a 100 basis point reduction to new investment earnings rates is assumed shortly after issue. A simplifying assumption is made that this has the effect of reducing the average earnings rate over the lifetime of the combination plan business by only 15 basis points, since the vast majority of cash inflows occur at issue. In fact, for many of the plans, there is little or no positive cash flow to the company after the first year. On the other hand, companies are not likely to change their rates immediately after a reduction in investment returns, so we believe that the use of the 15 basis point reduction for the combination plans is reasonable to compare against stand-alone LTCI priced with a 100 basis point decrease in investment returns.
Internal rates of return drop in this scenario by 22 percent for stand-alone LTC, from 14.9 percent to 10.7 percent. They only drop by 9 percent and 1 percent for life and annuity combination plans, respectively. The present value of profits drops 30 percent for stand-alone LTCI, but only 12 percent and 0 percent for life and annuity combos, respectively.
Scenario D covers the effect of a 10 percent reduction to periodic claim termination rates. As is true for LTCI incidence rates, there is natural hedging of this fundamental LTCI risk in the combination products, particularly for the annuity combinations. The general pattern of percentage changes in profit reductions related to this claim termination rate change, moving from stand-alone LTCI to life combinations to annuity combinations, is similar to that seen for Scenario A. Much of this is explained by the “cross-funding” elements of the life combination plans, and even more so for the annuity combination plans. Decreases as a percentage of best-estimate IRRs are 42 percent, 4 percent and 3 percent for the three plans, respectively, in Scenario D. In contrast, the percentage effects in IRRs for Scenario A by plan are 45 percent, 13 percent and 5 percent.
Scenario E reduces lapses to 50 percent of best-estimate assumptions for each product. Note that each product starts with slightly different lapse assumptions, so the change in lapse assumptions varies a bit by plan. Stand-alone LTCI is highly lapse-supported. Profits for the underlying life base plan illustrated in Table C below are slightly persistency-supported, which offsets much of the lapse-supported characteristics of the LTCI riders, with greater effects at the younger ages than the older ages.

© 2012 Copyright SOA and ILTCI, All Rights Reserved Milliman, Inc. Page 17
Table C
Scenario E: 50% of Standard Lapse—Life Combination Plan
Issue Age
Percentage Change in PV profit
Percentage Change in IRR
Life Only
55 25.0% 4.8%
65 19.2% 4.5%
75 12.8% 3.3%
Life + LTCI
55 2.1% -3.4%
65 -2.5% -4.8%
75 -7.8% -7.5%
Results may vary quite a bit depending on the pricing measure being used, or on the pricing structure of the particular life base plan used as a chassis by the company, some of which do have profits enhanced by higher lapses. Deferred annuities are more consistently characterized as “persistency-supported.”
Life base plan IRRs in Table C actually show a larger percentage improvement than the annuity base plan changes shown below in Table D. As noted earlier, this may be a function of the design of the life product used in these examples. With respect to the complete combination packages, the life combo shows larger percentage reductions to IRRs than the annuity combos, specifically a 5 percent reduction for life IRRs and a 2 percent reduction for the annuities, per Chart 4.
We think this is an example where other profit measures provide more meaning. Chart 3 shows LTCI PV of profit reductions of 9 percent, while life combo present value of profits decreases by 2 percent and annuity combo present value of profits increases in this scenario by 13 percent. It should also be noted that the normal lapse assumptions used for combination plan pricing are much lower than those used for life or annuity pricing, especially for annuities. Thus, this sensitivity is very modest, for many years representing less than a 1 percent absolute reduction to annual lapse rates. In contrast, it is felt that annuity combination plans offer the possibility of dramatic reductions in lapse versus those of stand-alone annuities, particularly in the years near the end of the surrender charge period, where the absolute changes in lapse rates might be as high as 30 to 50 percent of policies in force.
The results are even more complex when evaluated at various issue ages (details in Appendix II). The adverse impact of lower lapses on stand-alone LTCI profits is greatest

© 2012 Copyright SOA and ILTCI, All Rights Reserved Milliman, Inc. Page 18
at the younger ages, as would be expected given longer product longevity at those ages. The life combo is hurt less at the younger ages, and in fact values are enhanced for age 55 under present value of profit calculations. The annuity combo has improved results at younger issue ages, especially in terms of present value of profits, as shown in Table 2 of Appendix II, and that result is driven by the improvement in base plan results as shown in Table D below.
Table D
Scenario E: 50% of Standard Lapse—Annuity Combination Plan
Issue Age
Percentage Change in PV profit
Percentage Change in IRR
Annuity Only
55 32.0% 0.3%
65 27.0% 0.3%
75 20.1% 0.3%
Annuity + LTCI
55 22.0% 0.1%
65 10.1% -2.7%
75 -1.0% -5.7%
The “Quantification” section of the report (page 29) also provides values and commentary for plans with inflation benefits, and volatilities are increased further in general, but with greater benefits being realized by the combination plans due to the internal hedging characteristics of those products. Finally, plans that accelerate over three years with a three-year EOB provision further dampen the risks of combination plans versus combination plans with a two-year acceleration and four-year extension.
From a broader historical perspective, it should be understood that the risks of new LTCI policies are significantly lower than the risks seen on older, in-force LTCI business. In particular, the pricing of newer LTCI business has been conducted with lapse assumptions that are much lower than assumptions used on most prior generation products, and interest rate assumptions are much lower as well, both of which imply much more conservatism in the pricing of products currently offered in the stand-alone LTCI market. Quantifying that difference is beyond the scope of this project. However, this report quantifies the reduction to risks to insurance companies in

© 2012 Copyright SOA and ILTCI, All Rights Reserved Milliman, Inc. Page 19
combination policies versus currently marketed stand-alone LTCI policies. Those differentials highlight a number of meaningful hedge characteristics within these plans that should make them attractive to insurers, and ultimately to purchasers of these combination products.
© 2012 Copyright SOA and ILTCI, All Rights Reserved Milliman, Inc. Page 20
MARKETS, REGULATIONS AND PRODUCT DESIGN
Stand-Alone LTCI Products and Market There are several key structural considerations in designing a combination plan. Before reviewing these considerations, it is first appropriate to summarize the typical components of stand-alone LTCI coverage.
As a result of Internal Revenue Code incentives described later in the report, modern policies typically include “LTCI trigger” requirements. These requirements specify that services be provided either as a result of the inability of the insured to perform at least two of six activities of daily living (ADLs), or as a result of cognitive impairment. Inflation protection must be offered as an option under the National Association of Insurance Commissioners (NAIC) LTCI Model Regulation requirements. The most common form of the mandated offer of inflation benefits increases the daily maximum by 5 percent every year (with lifetime LTCI maximums correspondingly increased). Many other forms of inflation benefits are offered in the LTCI market.
Policy benefits are usually limited by daily, weekly or monthly amounts; these amounts are specified by the insured at issue, within company-defined limits. The periodic payments may be shaped based on expense-incurred designs, indemnity-based designs or disability-based designs. Maximum benefit periods are specified in years or dollars, and elimination periods commonly apply prior to benefit eligibility. Policy benefits may be limited to situations involving confinement in a qualified range of facilities, or more typically also include at-home care.
Many ancillary benefits are common, including waiver of premium, care advisory services, bed reservation benefits and respite care benefits. Shared care benefits, where a policy’s maximum benefits can be accessed by either of two insureds, have recently become popular.
Policies filed to comply with LTCI regulatory requirements may not feature premiums that are expected to increase by age above age 65. These policies are typically guaranteed renewable, meaning the coverage cannot be canceled but the company may, under certain circumstances, increase rates. Lifetime level pay plans have been the standard premium structure, but limited pay designs are also being offered, despite the fact that such designs restrict an insurer’s ability to pursue rate increases where warranted by experience (because the policy is effectively paid up after the limited pay period). Spousal discounts are common and are growing in magnitude, reflecting in part the benefits of a spousal “caretaker,” and indirectly reflecting the sex-distinct claim cost differentials that are not reflected in standard unisex rates. Affinity group discounts are also fairly common, often supported by commission reductions.
© 2012 Copyright SOA and ILTCI, All Rights Reserved Milliman, Inc. Page 21
Life Combination Product Structures LTCI benefits can be provided via riders to, or as benefit provisions in, universal life (UL), variable universal life, indexed universal life and whole life insurance plans .
The life/LTCI combination benefit payout structure is typically defined as an accelerated benefit (AB), whereby LTCI benefit payments are accompanied by concurrent dollar-for-dollar reductions in the life face amount. One alternative to immediate reductions to remaining death benefits and account values upon LTCI benefit payments is a lien approach. Current life values, including net amounts at risk (NARs) and interest credited, are unaffected by prior LTCI payments. Upon surrender or death, benefits are reduced by the lien. The major differences between the two approaches is that the lien approach credits higher interest to policyholders, but assesses higher cost of insurance (COI) charges, since NARs are not reduced. In either case, the cost of the LTCI benefit is the cost of acceleration of payment of the ultimate life insurance benefit that would eventually be paid at death. Generally, a pro rata portion of the payment is offset by a reduction in remaining policy account values. The result is a substantial reduction to the cost of LTCI benefits offered, making accelerated life benefits more affordable than stand-alone coverage.
On the other hand, such a structure reduces the death benefits payable, thereby diverting funds from the life insurance beneficiary, when in fact the need for life insurance may be increased in the event that LTCI services are required. In addition, there may be inherent limits to maximum LTCI benefits payable when they are defined in terms of base plan insurance coverage, thus making these structures only a partial solution in covering LTCI costs. Some early plans limited accelerated LTCI payments to a cap of as little as 50 percent of the life face amount, even when life face amounts were fairly modest.
Because of the concerns above, it is increasingly common to see independent LTCI riders offered and sold together with an AB rider. These designs are commonly referred to as extension of benefit (EOB) riders. EOB designs can help assure that a wide range of consumer needs are met by combination plans. In fact, recent trends show that some new plans offer LTCI riders on policies that may be very substantial (for example, more than $1 million in life face amounts). A 4 percent per month benefit would be well in excess of current monthly LTCI needs today. As such, it may make sense to unlink the LTCI lifetime dollar amount available (the “LTCI pool amount”) from the life face amount. This may sufficiently address the LTCI need over a 25-month period, while an independent benefit that begins once the AB provision ends will round out the coverage for an extended period.
Nearly all life/LTCI combination structures are based on a design under which benefit payments are based on a maximum LTCI pool amount defined at issue, usually directly linked to the life face amount. Under an AB rider, the excess of the maximum pool amount over the cash value defines a net amount at risk. Benefit payments reduce the remaining maximum LTCI pool and life face amount on a dollar-for-dollar basis under

© 2012 Copyright SOA and ILTCI, All Rights Reserved Milliman, Inc. Page 22
most designs. The cash value is reduced on a pro rata basis based on the benefit payment and the remaining maximum LTCI pool amount. Benefit payments under this structure are taken partially from the cash value and partially from the net amount at risk to the company. Under an EOB, benefit payments reduce the maximum LTCI pool amount on a dollar-for-dollar basis.
Annuity Combination Product Structures The base plan used as a platform for a combination deferred annuity could be a fixed annuity, a variable annuity, or an equity-indexed annuity. The vast majority in the market are fixed annuities.
The annuity/LTCI combination product payout structure typically begins with an accelerated benefit (AB), whereby LTCI benefit payments are made from the annuity account value without surrender charge. This is usually combined with some form of an independent benefit. The benefit is paid monthly and is usually expressed as a percent of the annuity account value at the time of initial claim. Three approaches are described below:
Approach 1 (the “tail” design): Benefits are paid first from the account value until the maximum accelerated benefit (“LTCI benefit limit”) has been exhausted, followed by an extension of benefit provision that continues LTCI payments at the same monthly level for a specified period of time so long as LTCI requirements are met. For example, ABs are defined as 4 percent of the LTCI benefit limit payable for 25+ months, with 25 or 50 months of extension of benefits. However, the optimal tax positioning would continue payments until the account value and all interest earnings during the long-term care payout period would be fully drained, thus extending the payout period beyond 25 months.
Approach 2 (the “coinsurance” approach): Accelerated and independent benefits are paid concurrently in fixed proportions until the LTCI benefit limit is exhausted.
For example, using the same LTCI benefit limit as defined for Approach 1 and with 80 percent of the benefit payment coming from the account value, the following option could be offered: 4 percent of the LTCI benefit limit payable for 30+ months.
Approach 3 (the “pool design”): Benefit payments are based on a maximum LTCI pool amount defined at issue. The excess of the maximum LTCI pool amount over the account value defines a net amount at risk. The proportion of the benefit payment that is an AB increases as the account value grows, while the independent benefit portion decreases. Benefit payments reduce the remaining maximum LTCI pool and account value on a dollar-for-dollar basis until the account value is depleted, at which point all remaining monthly benefits are independent benefits and are payable so long as LTCI benefit triggers are met and the maximum LTCI pool has not been paid out in full. A variation of this approach would be to introduce an element of coinsurance and reduce account values by less than a dollar for every dollar of LTCI benefits paid.

© 2012 Copyright SOA and ILTCI, All Rights Reserved Milliman, Inc. Page 23
An example of this approach is to set the maximum LTCI pool amount equal to 300 percent of the account value at issue and to offer the following option: 4 percent of the maximum LTCI pool amount payable for 25 months or until the depletion of the account value, if later.
As an alternative, a company might unlink the maximum LTCI pool from the initial account value, which would work much better for flexible premium contracts.
Combination Product Market Outlook The Pension Protection Act of 2006 (PPA) opened the door for combination products featuring long-term care riders. The PPA clarifies that charges for tax-qualified or non-tax-qualified LTCI riders on life policies are deemed distributions (retroactive to the enactment of HIPAA in 1996), but for tax-qualified riders those distributions beginning in 2010 will not be taxable but will reduce basis in the contract. The law also allows for 1035 exchanges into combination plans. We have seen about 30 to 35 life/LTCI combinations introduced into the market in the last few years, and product development activity continues at a steady pace.
Consumers may be driven from stand-alone LTCI products to combination products for a number of reasons. Premiums on the stand-alone products have increased because of updated interest and lapse assumptions. As a result, the stand-alone product is unaffordable for many who would benefit from LTCI. Also, buyers dislike the idea of paying premiums for many years and possibly getting nothing in return. Combination life/LTCI designs or combination annuity/LTCI designs can address these concerns.
Industry perspectives on the target market for life/LTCI combination plans vary by company. The prime age group for such plans to target is the 55 and older market because LTCI funding is a primary concern at that stage of life. This group includes more affluent customers with invested assets of at least $500,000. Also, this group is generally in the distribution phase of retirement planning. The life/LTCI combination product or the annuity/LTCI combination product offers a means of leveraging existing assets that had previously been earmarked for funding the LTCI risk. This market is attuned to single premium combination plans. The life/LTCI combination product provides a relatively inexpensive way to acquire LTCI protection. For the annuity/LTCI combination product, the second key target market could eventually be exchanges from existing annuities. This market has not yet emerged, which in large part may be explained by the low interest environment affecting new product offerings versus in-force annuity contracts with enhanced features and guarantees. This market may have similar demographics with the first group, but the sales theme is not quite so much the leveraging of account values to drive large LTCI benefits, but rather converting contracts with embedded taxable gains into new combination annuity/LTCI plans that have the potential to pay out gains in those old contracts as tax-free LTCI benefits.

© 2012 Copyright SOA and ILTCI, All Rights Reserved Milliman, Inc. Page 24
RISK ELEMENTS BY PRODUCT
Stand-Alone LTCI Stand-alone LTCI is generally sold on a level, annual premium basis, although some coverage is sold on either a 10-pay or paid-up-at-65 basis, and a very small percentage has been offered on a single premium basis. The stand-alone LTCI products analyzed in this report are annual premium products. The key risks are persistency, investment returns and morbidity risks. These products feature level premiums that contrast with a claim cost curve that increases dramatically with advancing age. The excess of premium over claim costs in the early durations, coupled with investment income on those amounts, accumulates over time to cover the cost of LTCI in later durations that exceeds the annual premium for the coverage. As such, higher persistency (lower lapses) than expected reduces profits on LTCI because more policyholders retain their coverage into the later durations where the annual premium is insufficient to cover the claim costs. This sensitivity to persistency is increased due to the fact that virtually all stand-alone LTCI coverage is written with no nonforfeiture benefit for the policyholder. This is partly mitigated by the resulting longer period over which to amortize acquisition expenses, but that effect is generally overwhelmed by the first factor. In reality, the most adverse scenarios include higher-than-expected lapsation in very early durations and lower-than-expected lapses in intermediate to later durations.
Increased investment returns add significantly to the profitability of stand-alone LTCI, as is true for all of these products.
LTCI morbidity risks include the incidence rates for long-term care and related insurance requirements to be triggered, and the claim continuance curve once this form of disability occurs. Claim terminations can occur as a result of three scenarios: death, recovery from claim, or the case where the maximum lifetime benefits available for LTCI have been paid. Disabled life mortality rates act much like a policy lapse, as they end not only the current claim but the entire policy; the higher the disabled life mortality, the higher the profits. Recoveries are beneficial in terms of current claim payments, but leave open the possibility for future LTCI claims and persistency into later policy durations where premium is insufficient to cover expected annual claim costs.
The risk of an increase in the cost of long-term care itself (e.g., increased nursing home rates or home health care charge rates) is a minor consideration in LTCI risks. This is because most coverage limits LTCI benefits at a monthly or daily level determined at issue, and those limits do not increase over time unless inflation protection has been purchased. If inflation protection has been purchased, the increase in coverage amounts is well-defined under the policy, and the largest increases are generally set at 5 percent annual compound growth rates. This represents a major distinction from the risks related to general medical inflation trends and their impact on other health insurance products and rates.

© 2012 Copyright SOA and ILTCI, All Rights Reserved Milliman, Inc. Page 25
Life Insurance Life insurance products can have premium requirements that range from level monthly premiums for the life of the policy to single-premium-only products. The combination life products included in this study are single premium products, the most common form of life combination plans. Level premium plans are available in the market for combination life/LTCI coverages, however. Level premium products include somewhat higher risk elements than single premium products, particularly because investment returns are less certain and insurance amounts at risk are increased when compared to single premium products since there are lower cash values supporting the coverage.
The key risks for life insurance products include mortality, investment returns and lapsation, with expense inflation generally a somewhat lesser concern. Higher mortality implies lower life insurance profits, as claims must be paid earlier on average. Higher investment returns provide additional revenues to companies on assets supporting life products, also enhancing profitability. Higher persistency (i.e., lower lapses), particularly in early policy durations, implies a longer period over which acquisition costs for the company can be amortized, thus enhancing profitability. Some life products realize a further benefit from higher persistency levels because of attractive margins in the later durations of these policies. On other life products, margins may actually decrease by policy duration given the mechanics of the policy and the particular charge structures built into these plans. At the extreme, some of these products may be lapse-supported, meaning that higher lapse rates actually improve profitability. It should be noted that there are regulations that are intended to prevent the design and illustration of lapse-supported life products, but such plans can and do exist in the market despite these regulations for a variety of reasons. For example, a plan may be designed to have similar margins in all durations of the policy, but a decline in investment returns over time can cause the product to become lapse-supported, so interactions among various pricing factors can be important in the risks involved in a product.
Fixed Deferred Annuities Deferred annuities are basically accumulation vehicles during most of the life of these contracts. Most of these plans are single premium contracts, but flexible premium designs are offered. The combination annuity plans in this report are single premium plans, as is almost universally true in the combination annuity/LTCI market. If and when annuitization occurs, the account value is converted into a periodic payout stream directed to the policyholder. In most cases, the length of the payout stream is tied to the number of years the policyholder survives after annuitization. The primary risks during the accumulation phase are the investment return risk and the lapse/surrender risk, with expense risk being a lesser concern. Higher investment returns add to profit. Higher persistency can add materially to profits. In particular, a high percentage of deferred annuities are surrendered in the policy years just prior to and following the end of the surrender charge period. Reductions to the cumulative lapses that commonly occur in those years, often 65 percent to 80 percent of all policyholders still on the books just prior to that time, can add to profits dramatically.

© 2012 Copyright SOA and ILTCI, All Rights Reserved Milliman, Inc. Page 26
During the payout stage, higher mortality generally translates into a higher profit to the company, i.e., moving in the opposite direction from life insurance profits. Higher investment returns add to profits. Lapses/surrenders are moot since policyholders under most of these plans are not allowed to discontinue their coverage. In actuality, a very small percentage of deferred annuities are annuitized. Because of that fact, and the fact that there are a number of annuity/LTCI designs that can be used in the post-annuitization stage, sensitivity analysis in that stage is not examined in this report.

© 2012 Copyright SOA and ILTCI, All Rights Reserved Milliman, Inc. Page 27
PROTOTYPE PRODUCT DESIGN
General Commentary There were two goals in choosing the prototype product design and setting the assumptions for the prototype products: a) the product designs and the assumptions used in the analysis should reflect those typical for the product in the industry (i.e., each product has its own unique set of lapse rates, commission rates etc.); b) the design and the assumptions among the three products need to be as consistent as possible in order for the comparison to be meaningful. For example, the LTCI underwriting selection factors, which are factors applied against attained age incidence rates by policy duration to reflect the value of underwriting, were kept the same among the three products, even though the underwriting protocols for the combination product are generally looser than those for stand-alone LTCI policies.
General Plan Characteristics The prototype stand-alone LTCI policy or the LTCI riders used in the analysis are assumed to be tax-qualified comprehensive nursing home and home health care policies. The policies have two out of six ADLs or cognitive impairment benefit triggers. All of the policies are assumed to have monthly reimbursement benefit styles. The elimination period is assumed to be 90 calendar days.
Assumptions for each product are shown in Appendix I.
Prototype Stand-Alone LTCI Product and Its Assumptions The prototype stand-alone LTCI product has a six-year benefit period. The maximum daily benefit is $150 for both home health care benefits and nursing home benefits. A 5 percent compound inflation option is available. This option is funded by level issue age premiums. The daily benefit is inflated at a 5 percent rate annually. The total benefit period is retained.
Prototype Life/LTCI Combination Product and Its Assumptions The base policy for the prototype life/LTCI combination product is a single premium whole life policy. The prototype LTCI rider offers either a two-year acceleration benefit (AB) followed by a four-year extension benefit (EOB) period (a 2+4 plan) or a three-year AB followed by a three-year EOB period (a 3+3 plan).
The face amount is assumed to be $110,000 for the two-year AB option and $165,000 for the three-year AB option, both of which will produce a maximum daily benefit of $150. A 5 percent compound inflation option is offered on both the AB and EOB. This option is funded by a single premium at issue of the policy. The maximum monthly benefit is inflated at a 5 percent rate annually. The monthly life face amount reduction is unaffected by the inflation benefit. Any maximum monthly benefit in excess of the monthly life face amount reduction is treated as an independent benefit and will be

© 2012 Copyright SOA and ILTCI, All Rights Reserved Milliman, Inc. Page 28
funded by the company. The AB benefit period is retained, as is the EOB benefit period.
The death benefit for the base policy is level. Note that a return of premium provision is common on life combination plans in the market but is not assumed here, as it is not intrinsic to life combination plans and because it creates some unique risks that are best analyzed separately.
Prototype Annuity/LTCI Combination Product and Its Assumptions The base policy for the prototype annuity/LTCI combination product is a single premium fixed deferred annuity policy. The prototype LTCI rider offers either a two-year AB followed by a four-year EOB period (a 2+4 plan) or a three-year AB followed by a three-year EOB period (a 3+3 plan). Both of these utilize the tail design as described earlier. Charges for the LTCI riders are assessed against the account value monthly. These are determined based on the then current account value times issue-age-based charges per thousand of account value.
The premium is assumed to be $90,000 for the two-year AB option and $135,000 for the three-year AB option. Both imply a maximum daily benefit that starts at about $123 per day, but which grows over time. Over the life of the business, the average daily benefit is intended to approximate the LTCI and life combination plan daily benefit of $150 per day. A 5 percent compound inflation option is offered on both the AB and EOB benefits. This option requires pour-in premium if needed to make up any difference between actual account value growth during the year and values required to achieve a 5 percent growth rate. The maximum monthly benefit is inflated at a 5 percent rate annually. The AB benefit period is retained, as is the EOB benefit period. It should be noted that even without the 5 percent compound inflation, an annuity combination product includes a built-in inflation element due to its account value growth and the linkage of those LTCI benefits to the account value.
The base policy is assumed to mature at attained age 110. This was a simplifying assumption made to assure that the models covered the continuation of LTCI coverage for the full life of the insured, and it ignores annuitization requirements that may apply under federal tax law in some circumstances.

© 2012 Copyright SOA and ILTCI, All Rights Reserved Milliman, Inc. Page 29
QUANTIFICATION OF COMBINATION PRODUCT HEDGE CHARACTERISTICS, AND OBSERVATIONS
Methodology and Measures The analysis was done by using a deterministic, profits released statutory projection model for new business. The study focuses on the natural hedge reflected by the impact of lapse rates, interest rates, mortality, claim termination rates and LTCI incidence rates. The underlying modeling included a number of profit metrics, such as internal rates of return on statutory cash flows after reflecting required capital (IRR), pre-tax and post-tax profit margins, and the present value of pre-tax and post-tax profits. Since the present value of profits captures not only the profits as a percent of premium, but also recognizes the longevity of the business via the present value calculation, the PV measure is presented in this report instead of the profit margin.
Specifically, figures referenced in the commentary below pertain to percentage changes in IRRs, and to percentage changes to the present value of post-tax profits discounted at the net investment earned rate. The absolute values of such changes are also provided in some tables. All IRR calculations have been derived using the Becker method to avoid anomalies in results that otherwise can occur when there are multiple sign changes in cash flows by year. See Appendix III for a brief description of the Becker method. Despite that, there are some situations where IRR measures are not the most meaningful values, so examination of results under multiple measures is recommended.
For each set of products studied, the first table in Appendix II presents results aggregated across all issue ages. The second table presents values separately for issue ages 55, 65 and 75.
As noted in the earlier sections of this report, the plans chosen were structured to provide similar periodic LTCI benefits.
Because the combination plans include additional elements of coverage beyond LTCI, i.e., the base plans themselves, the overall premium and present value of profits are generally expected to be higher on the combination plans than on the stand-alone LTCI plan.
Plan Set 2 (2YR AB + 4YR EOB With Inflation) Results for Plan Set 1, the two-year AB plus four-year EOB on the combination products, and a six-year plan on stand-alone LTCI, without inflation, were covered in the Executive Summary.
The next plans evaluated are based on a two-year AB plus four-year EOB on the combination products, and a six-year plan on stand-alone LTCI, with inflation. As

© 2012 Copyright SOA and ILTCI, All Rights Reserved Milliman, Inc. Page 30
expected, Chart 5 shows profits that are higher for plans with inflation than the Chart 1 results for plans without inflation.
Chart 5

© 2012 Copyright SOA and ILTCI, All Rights Reserved Milliman, Inc. Page 31
Also as expected, Charts 6 and 7 show volatility that is higher for the combo plans with inflation than the Chart 3 and 4 results for plans without inflation, although there are a couple of exceptions as discussed below. Stand-alone LTCI results are mixed, as the inclusion of inflation protection increases volatility to investment earnings and lapses but tends to decrease volatility to incidence rates, mortality and claim termination rates.
Chart 6

© 2012 Copyright SOA and ILTCI, All Rights Reserved Milliman, Inc. Page 32
Chart 7
Findings by Scenario:
A—The percentage impact on profits with a 15 percent increase in LTCI incidence rates on stand-alone LTCI profits is very similar with inflation versus without inflation. Given that the policyholder is “cross-funding” the first two years of coverage in the combination plans, the profit sensitivity on those plans to increases in LTCI incidence rates is diluted versus stand-alone LTCI. However, the life combination package of benefits is weighted relatively more toward the LTCI components when inflation is included, versus without inflation.

© 2012 Copyright SOA and ILTCI, All Rights Reserved Milliman, Inc. Page 33
The cross-funding elements of the annuity combos also dilute the risk relative to incidence rates. Although changes in results with inflation are a bit worse than those without inflation, most annuity combinations (including the plan modeled here) already include some built-in element of inflation protection. Specifically, since LTCI benefits are defined based on account values at the time of claim, the addition of a 5 percent compound inflation feature means less incremental LTCI coverage for annuity combinations than for life combinations, and less incremental risk.
B—As discussed earlier, higher active life mortality hurts profits on life combinations without inflation, whereas it helps on stand-alone LTCI. The base plan component of life combinations shows higher losses than the package of life plus LTCI, but those losses are hedged by the inclusion of the LTCI components of the coverage. Annuity combination sensitivities are very small as mortality hurts the annuity base plan profits to a small degree, with or without inflation. The inclusion of inflation benefits increases the relative weighting of the LTCI component of coverage in the life combo plans with inflation versus plans without inflation. This results in gains to profits for the life combinations with inflation benefits when active life mortality increases, versus reductions to profits for life combinations without inflation benefits. This result may be non-intuitive, but it should be noted that the single premium in the life combination plans is very high with inflation benefits, with reduced mortality risk to insurers as a result.
C—As was true without inflation, a decrease in the net investment earnings rate at issue, with a static crediting rate and static premiums, generally hurts all three products, but this scenario affects all three plans differently. The percentage reductions in profits tend to be slightly higher with inflation that without inflation, since plans with inflation are driven more by investment returns given the steeper tail of liabilities.
D—As with LTCI incidence rates, there is natural hedging in the combination products, particularly for the annuity combinations. With the heavier weighting of LTCI coverage in the combination plans featuring inflation, as opposed to those without inflation, PV of profit results drops by larger percentages on plans with inflation. As is true for the incidence rate sensitivity, since LTCI benefits are defined based on account values at the time of claim, the addition of a 5 percent compound inflation feature means less incremental LTCI coverage for annuity combinations than for life combinations, and less incremental risk moving from coverage without inflation to coverage with inflation. Changes in IRRs are similar with and without inflation benefits.
E—Deferred annuities show modest reductions to IRRs, and PV of profits increases at some ages and is reduced at other ages in this scenario with inflation. The percentage change in results is very similar to annuity combination results without inflation with reduced lapse rates. In contrast, stand-alone LTCI and life combinations show larger sensitivities with inflation than without, specifically larger reductions to profits when lapse rates are reduced on plans with inflation versus those without inflation.
© 2012 Copyright SOA and ILTCI, All Rights Reserved Milliman, Inc. Page 34
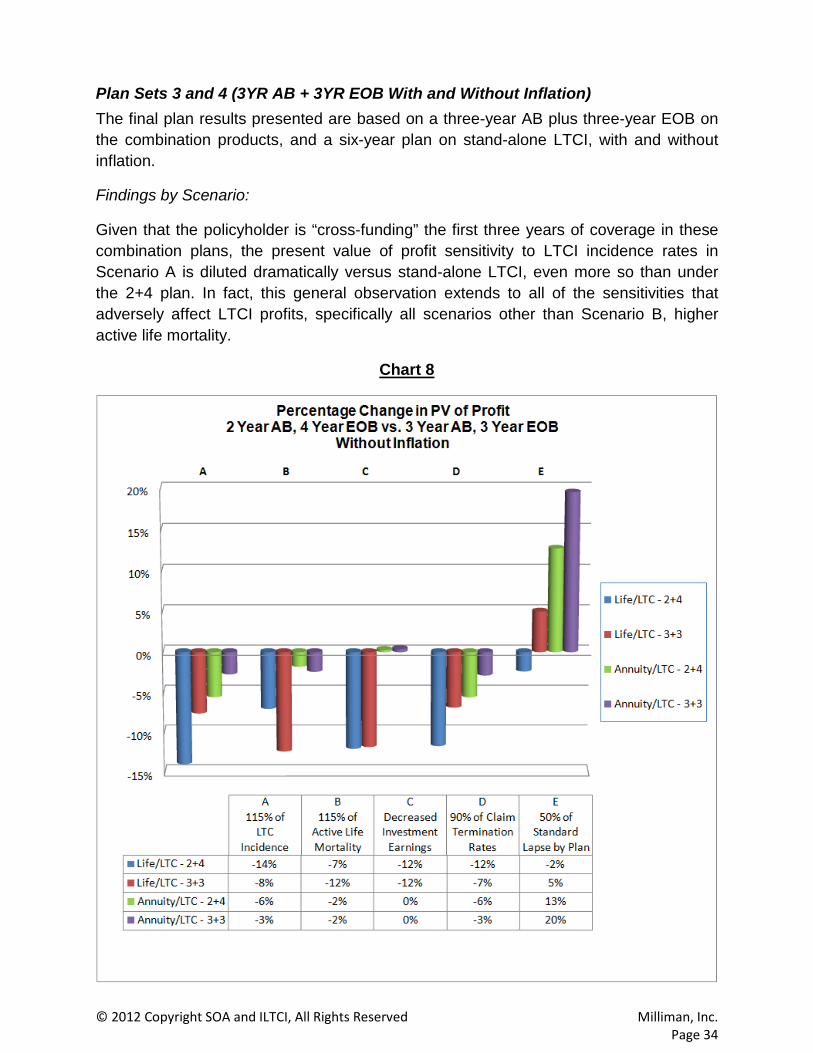
Plan Sets 3 and 4 (3YR AB + 3YR EOB With and Without Inflation) The final plan results presented are based on a three-year AB plus three-year EOB on the combination products, and a six-year plan on stand-alone LTCI, with and without inflation.
Findings by Scenario:
Given that the policyholder is “cross-funding” the first three years of coverage in these combination plans, the present value of profit sensitivity to LTCI incidence rates in Scenario A is diluted dramatically versus stand-alone LTCI, even more so than under the 2+4 plan. In fact, this general observation extends to all of the sensitivities that adversely affect LTCI profits, specifically all scenarios other than Scenario B, higher active life mortality.
Chart 8
© 2012 Copyright SOA and ILTCI, All Rights Reserved Milliman, Inc. Page 35
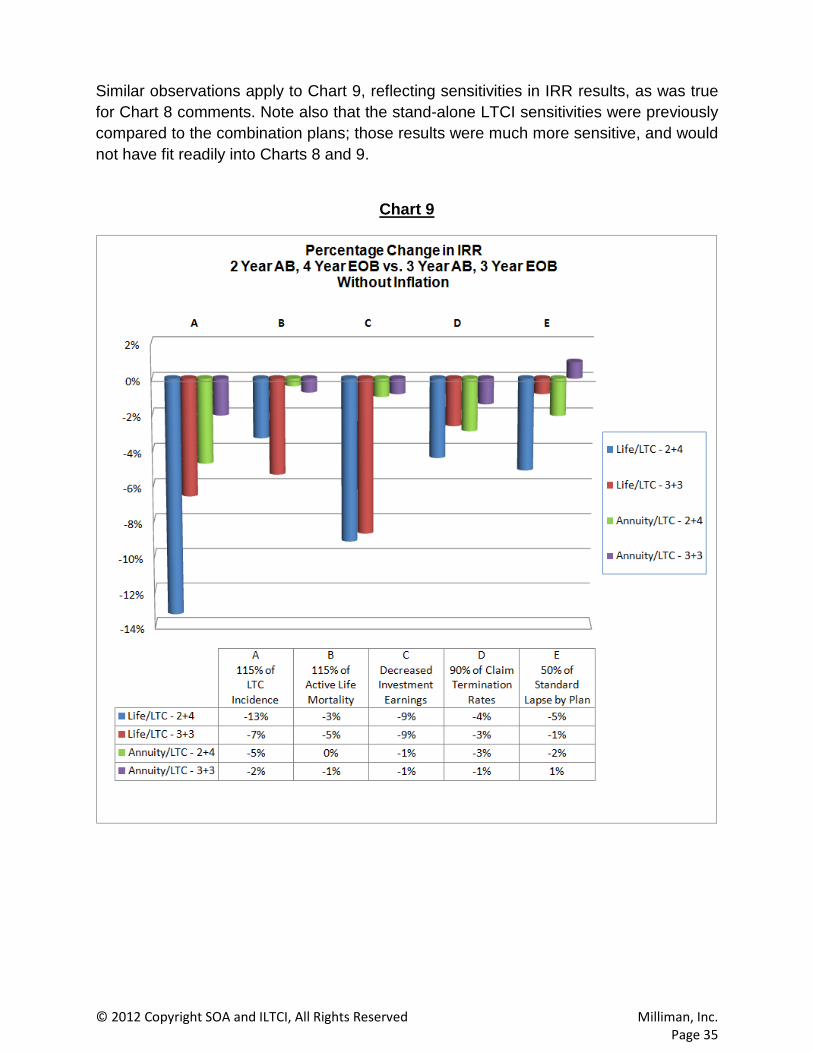
Similar observations apply to Chart 9, reflecting sensitivities in IRR results, as was true for Chart 8 comments. Note also that the stand-alone LTCI sensitivities were previously compared to the combination plans; those results were much more sensitive, and would not have fit readily into Charts 8 and 9.
Chart 9
© 2012 Copyright SOA and ILTCI, All Rights Reserved Milliman, Inc. Page 36
APPENDIX I: ASSUMPTIONS
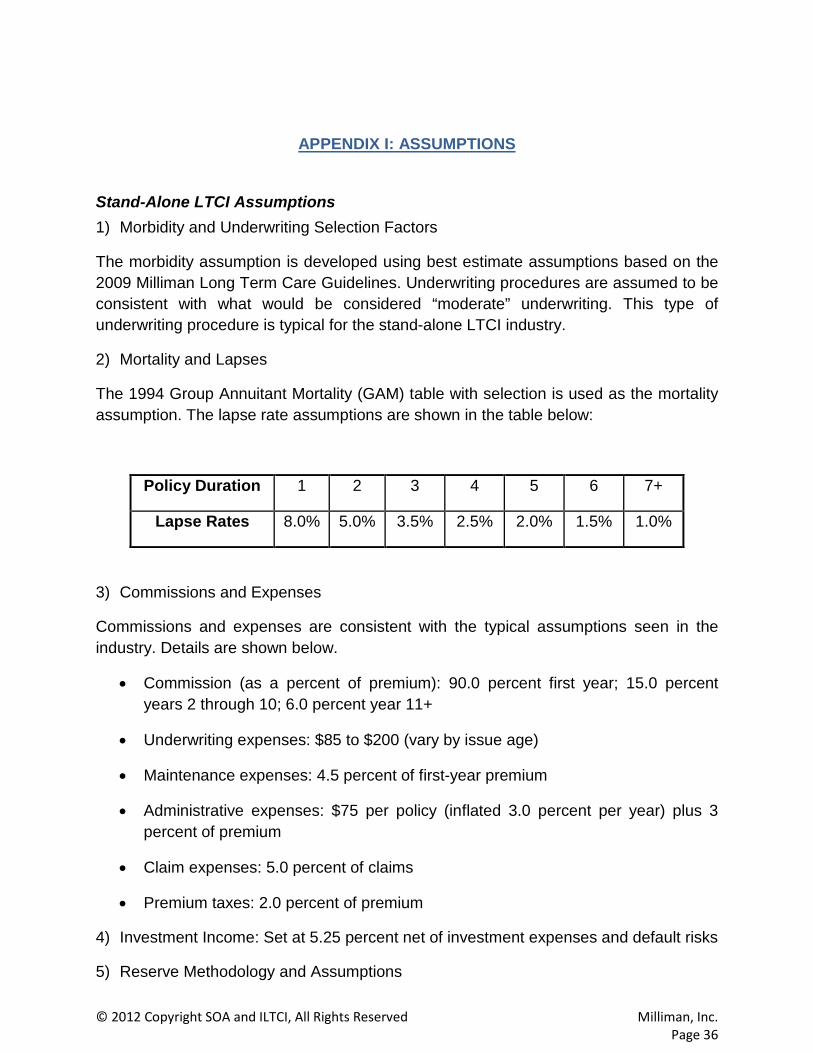
Stand-Alone LTCI Assumptions 1) Morbidity and Underwriting Selection Factors
The morbidity assumption is developed using best estimate assumptions based on the 2009 Milliman Long Term Care Guidelines. Underwriting procedures are assumed to be consistent with what would be considered “moderate” underwriting. This type of underwriting procedure is typical for the stand-alone LTCI industry.
2) Mortality and Lapses
The 1994 Group Annuitant Mortality (GAM) table with selection is used as the mortality assumption. The lapse rate assumptions are shown in the table below:
Policy Duration 1 2 3 4 5 6 7+
Lapse Rates 8.0% 5.0% 3.5% 2.5% 2.0% 1.5% 1.0%
3) Commissions and Expenses
Commissions and expenses are consistent with the typical assumptions seen in the industry. Details are shown below.
• Commission (as a percent of premium): 90.0 percent first year; 15.0 percent years 2 through 10; 6.0 percent year 11+
• Underwriting expenses: $85 to $200 (vary by issue age)
• Maintenance expenses: 4.5 percent of first-year premium
• Administrative expenses: $75 per policy (inflated 3.0 percent per year) plus 3 percent of premium
• Claim expenses: 5.0 percent of claims
• Premium taxes: 2.0 percent of premium
4) Investment Income: Set at 5.25 percent net of investment expenses and default risks
5) Reserve Methodology and Assumptions
© 2012 Copyright SOA and ILTCI, All Rights Reserved Milliman, Inc. Page 37
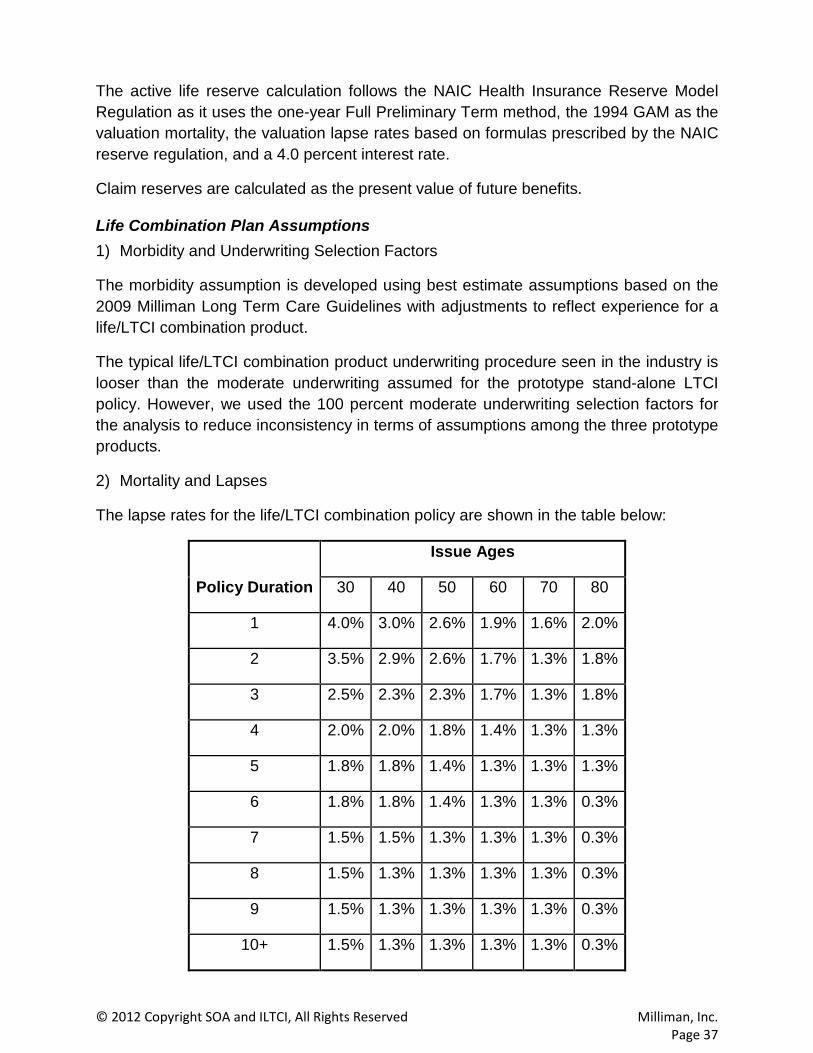
The active life reserve calculation follows the NAIC Health Insurance Reserve Model Regulation as it uses the one-year Full Preliminary Term method, the 1994 GAM as the valuation mortality, the valuation lapse rates based on formulas prescribed by the NAIC reserve regulation, and a 4.0 percent interest rate.
Claim reserves are calculated as the present value of future benefits.
Life Combination Plan Assumptions 1) Morbidity and Underwriting Selection Factors
The morbidity assumption is developed using best estimate assumptions based on the 2009 Milliman Long Term Care Guidelines with adjustments to reflect experience for a life/LTCI combination product.
The typical life/LTCI combination product underwriting procedure seen in the industry is looser than the moderate underwriting assumed for the prototype stand-alone LTCI policy. However, we used the 100 percent moderate underwriting selection factors for the analysis to reduce inconsistency in terms of assumptions among the three prototype products.
2) Mortality and Lapses
The lapse rates for the life/LTCI combination policy are shown in the table below:
Policy Duration
Issue Ages
30 40 50 60 70 80
1 4.0% 3.0% 2.6% 1.9% 1.6% 2.0%
2 3.5% 2.9% 2.6% 1.7% 1.3% 1.8%
3 2.5% 2.3% 2.3% 1.7% 1.3% 1.8%
4 2.0% 2.0% 1.8% 1.4% 1.3% 1.3%
5 1.8% 1.8% 1.4% 1.3% 1.3% 1.3%
6 1.8% 1.8% 1.4% 1.3% 1.3% 0.3%
7 1.5% 1.5% 1.3% 1.3% 1.3% 0.3%
8 1.5% 1.3% 1.3% 1.3% 1.3% 0.3%
9 1.5% 1.3% 1.3% 1.3% 1.3% 0.3%
10+ 1.5% 1.3% 1.3% 1.3% 1.3% 0.3%

© 2012 Copyright SOA and ILTCI, All Rights Reserved Milliman, Inc. Page 38
The lapse rates for the base life policy are assumed to be 1.0 percent (in all durations) higher than the ones used for the combination product above.
A set of simplified issued mortality assumptions is used for active life mortality.
3) Commissions and Expenses
Commissions and expenses are consistent with the typical assumptions seen in the industry. Details are shown below:
• Commission: 8.0 percent of single premium; commission charge back is on a two-year schedule: 100 percent months 1 through 12, grading down to 50 percent linearly in months 13 through 24, then 0 percent thereafter; distribution cost is 5.0 percent of single premium.
• Underwriting expenses: $85 to $200 (vary by issue age) • Per policy acquisition expenses: $75 • Administrative expenses: $75 per policy (inflated 3.0 percent per year), $.10 per
1000 • LTCI claims expenses: 5.0 percent of claims • Premium taxes: 2.0 percent of premium
4) Investment Income: 5.25 percent
5) Reserve Methodology and Assumptions When integrated with the base life policy, the active life reserve for the life and LTCI is calculated based on a net single premium (NSP) approach. Benefits for the AB rider include the net claim costs, which are defined as the difference between the incurred AB rider benefits and future death benefit (DB) savings. The EOB benefits include any independent incurred benefits. The present value calculation follows the NAIC LTCI regulation using a prescribed valuation interest rate of 4.00 percent, valuation mortality of 1994 GAM, and the valuation lapse allowance. Claim reserves for long-term care benefits are calculated as the present value of incurred future benefit claim payments.
Annuity Combination Plan Assumptions 1) Morbidity and Underwriting Selection Factors
© 2012 Copyright SOA and ILTCI, All Rights Reserved Milliman, Inc. Page 39
The morbidity assumption is developed using best estimate assumptions based on the 2009 Milliman Long Term Care Guidelines.
The typical annuity/LTCI combination product underwriting procedure seen in the industry is looser than the moderate underwriting assumed for the prototype stand-alone LTCI policy. However, we used the 100 percent moderate underwriting selection factors for the analysis to reduce inconsistency in terms of assumptions among the three prototype products.
2) Mortality and Lapses
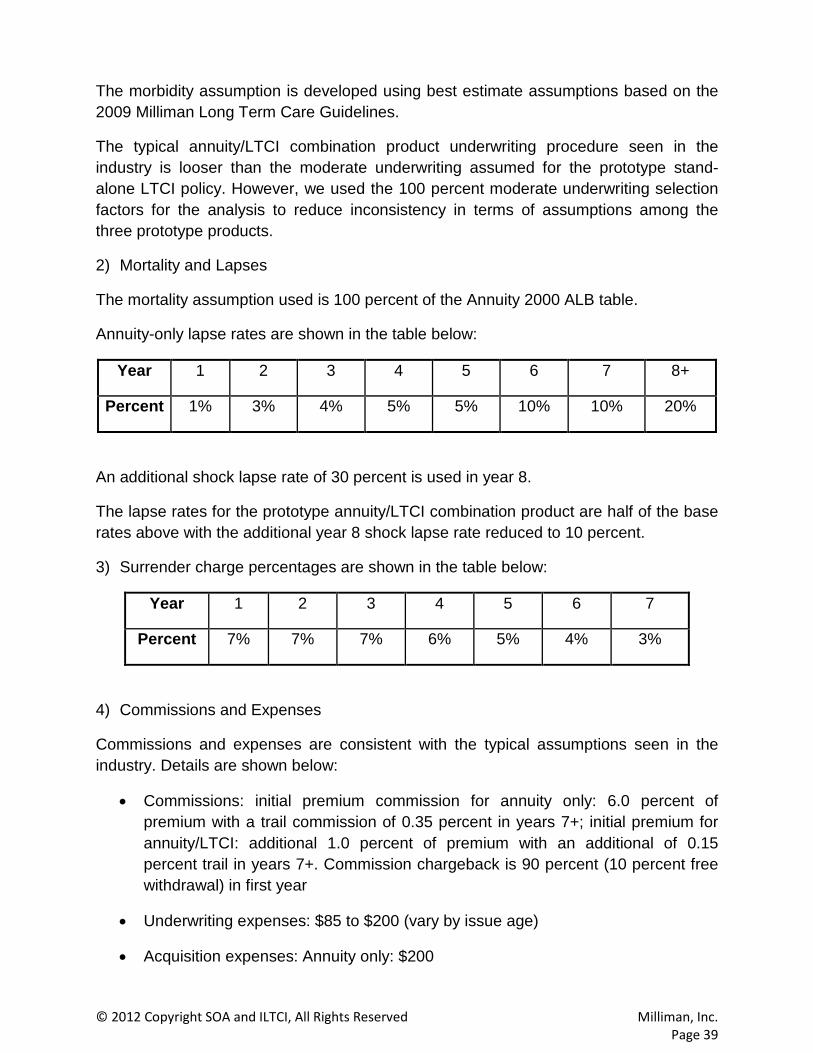
The mortality assumption used is 100 percent of the Annuity 2000 ALB table.
Annuity-only lapse rates are shown in the table below:
Year 1 2 3 4 5 6 7 8+
Percent 1% 3% 4% 5% 5% 10% 10% 20%
An additional shock lapse rate of 30 percent is used in year 8.
The lapse rates for the prototype annuity/LTCI combination product are half of the base rates above with the additional year 8 shock lapse rate reduced to 10 percent.
3) Surrender charge percentages are shown in the table below:
Year 1 2 3 4 5 6 7
Percent 7% 7% 7% 6% 5% 4% 3%
4) Commissions and Expenses
Commissions and expenses are consistent with the typical assumptions seen in the industry. Details are shown below:
• Commissions: initial premium commission for annuity only: 6.0 percent of premium with a trail commission of 0.35 percent in years 7+; initial premium for annuity/LTCI: additional 1.0 percent of premium with an additional of 0.15 percent trail in years 7+. Commission chargeback is 90 percent (10 percent free withdrawal) in first year
• Underwriting expenses: $85 to $200 (vary by issue age)
• Acquisition expenses: Annuity only: $200
© 2012 Copyright SOA and ILTCI, All Rights Reserved Milliman, Inc. Page 40
• Maintenance expenses: annuity only: $30/policy (inflated 3.0 percent per year); 0.05 percent of account value
• LTCI rider claim expenses: 5.0 percent of LTCI incurred claim
5) Investment Income and Crediting Rates
• The net investment earned rate: 5.25 percent
• The interest rate spread: three-year guarantee: 220 bps for all years
• Minimum guaranteed rate: 2.0 percent
• Initial guaranteed period: three years
6) Reserve Methodology and Assumptions
For the base annuity policy, the reserve is based on CARVM principles with AG 33. The valuation mortality is Annuity 2000. A 5.75 percent discount rate is used for death benefit; a 5.50 percent discount rate is used for cash value and partial withdrawal; and a 5.75 percent discount rate is used for annuitization.
The active life reserve calculation for the LTCI rider follows the NAIC Health Insurance Reserve Model Regulation as it uses the one-year Full Preliminary Term method, the 1994 GAM as the valuation mortality, the valuation lapse rates based on formulas prescribed by the NAIC reserve regulation, and a 4.0 percent interest rate. Benefits include the independent benefits plus surrender charges being waived for AB payments.
Claim reserves are calculated as the present value of future benefits for the independent benefits. For the non-independent benefit, the reserve is only held on the surrender charge portion of the account value.

© 2012 Copyright SOA and ILTCI, All Rights Reserved Milliman, Inc. Page 41
APPENDIX II: TABLES
Table 1. Aggregate Results Set 1: 2 Yr AB/4 Yr EOB, Without Inflation
Scenario Age
PV of After-Tax Profit disc @ NIER IRR
LTC Life/LTC Annuity/LTC LTC Life/LTC Annuity/
LTC Best Estimate All $1,709 $5,842 $4,771 15% 13% 12%
A 115% of LTCI
Incidence
All $502 $5,028 $4,504 8% 11% 12%
Change -$1,207 -$815 -$267 -7% -2% -1% % Change -71% -14% -6% -45% -13% -5%
B 115% of Active Life Mortality
All $1,858 $5,431 $4,684 16% 12% 12%
Change $149 -$411 -$87 1% 0% 0% % Change 9% -7% -2% 6% -3% 0%
C Decreased Investment Earnings
All $1,190 $5,139 $4,784 12% 12% 12%
Change -$519 -$703 $13 -3% -1% 0%
% Change -30% -12% 0% -22% -9% -1%
D 90% of Claim Termination
Rates
All $565 $5,160 $4,504 9% 12% 12%
Change -$1,145 -$683 -$267 -6% -1% 0% % Change -67% -12% -6% -429% -4% -3%
E 50% of
Standard Lapse by Plan
All $1,552 $5,703 $5,377 13% 12% 12%
Change -$158 -$140 $606 -2% -1% 0% % Change -9% -2% 13% -11% -5% -2%

© 2012 Copyright SOA and ILTCI, All Rights Reserved Milliman, Inc. Page 42
Table 2. By Age Set 1: 2 Yr AB/4 Yr EOB, Without Inflation
Scenario Age
PV of After-Tax Profit disc @ NIER IRR
LTC Life/LTC Annuity/LTC LTC Life/LTC Annuity/
LTC
Best Estimate 55 $1,256 $5,353 $5,468 15% 12% 13% 65 $1,717 $6,250 $4,819 15% 13% 12% 75 $2,333 $5,876 $3,718 14% 13% 12%
A 115% of
LTCI Incidence
55 $534 $4,887 $5,375 11% 11% 13% 65 $535 $5,449 $4,594 9% 11% 12% 75 $405 $4,551 $3,141 7% 10% 10%
% Change
55 -57% -9% -2% -30% -8% -2% 65 -69% -13% -5% -43% -12% -4% 75 -83% -23% -16% -53% -21% -12%
B
115% of Active Life Mortality
55 $1,405 $4,972 $5,410 16% 12% 13% 65 $1,888 $5,797 $4,730 16% 13% 12% 75 $2,444 $5,488 $3,593 15% 13% 12%
% Change
55 12% -7% -1% 6% -3% 0% 65 10% -7% -2% 7% -3% 0% 75 5% -7% -3% 5% -3% -1%
C Decreased Investment Earnings
55 $706 $4,710 $5,486 10% 11% 13% 65 $1,175 $5,510 $4,833 11% 12% 12% 75 $1,891 $5,148 $3,721 12% 12% 12%
% Change
55 -44% -12% 0% -33% -9% -1% 65 -32% -12% 0% -24% -9% -1% 75 -19% -12% 0% -15% -10% -1%
D 90% of Claim
Termination Rates
55 $553 $4,987 $5,378 11% 12% 13% 65 $580 $5,589 $4,592 9% 13% 12% 75 $557 $4,715 $3,138 7% 12% 11%
%
Change
55 -56% -7% -2% -30% -2% -1% 65 -66% -11% -5% -41% -3% -2% 75 -76% -20% -16% -49% -9% -9%
E 50% of
Standard Lapse by
Plan
55 $1,062 $5,463 $6,673 13% 12% 13% 65 $1,540 $6,091 $5,304 13% 12% 12% 75 $2,255 $5,417 $3,679 14% 12% 11%
% Change
55 -15% 2% 22% -16% -3% 0% 65 -10% -3% 10% -13% -5% -3%
75 -3% -8% -1% -6% -8% -6%
© 2012 Copyright SOA and ILTCI, All Rights Reserved Milliman, Inc. Page 43
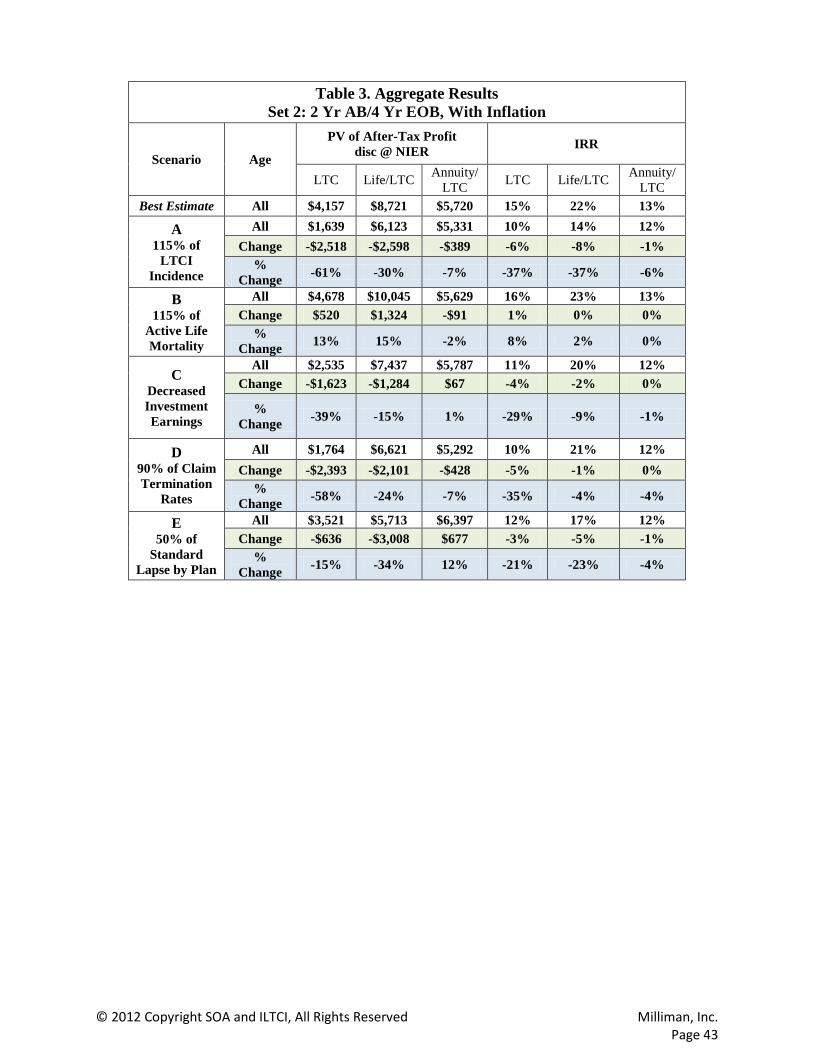
Table 3. Aggregate Results Set 2: 2 Yr AB/4 Yr EOB, With Inflation
Scenario Age
PV of After-Tax Profit disc @ NIER IRR
LTC Life/LTC Annuity/LTC LTC Life/LTC Annuity/
LTC Best Estimate All $4,157 $8,721 $5,720 15% 22% 13%
A 115% of
LTCI Incidence
All $1,639 $6,123 $5,331 10% 14% 12% Change -$2,518 -$2,598 -$389 -6% -8% -1%
% Change -61% -30% -7% -37% -37% -6%
B 115% of
Active Life Mortality
All $4,678 $10,045 $5,629 16% 23% 13% Change $520 $1,324 -$91 1% 0% 0%
% Change 13% 15% -2% 8% 2% 0%
C Decreased Investment Earnings
All $2,535 $7,437 $5,787 11% 20% 12% Change -$1,623 -$1,284 $67 -4% -2% 0%
% Change -39% -15% 1% -29% -9% -1%
D 90% of Claim Termination
Rates
All $1,764 $6,621 $5,292 10% 21% 12% Change -$2,393 -$2,101 -$428 -5% -1% 0%
% Change -58% -24% -7% -35% -4% -4%
E 50% of
Standard Lapse by Plan
All $3,521 $5,713 $6,397 12% 17% 12% Change -$636 -$3,008 $677 -3% -5% -1%
% Change -15% -34% 12% -21% -23% -4%
© 2012 Copyright SOA and ILTCI, All Rights Reserved Milliman, Inc. Page 44
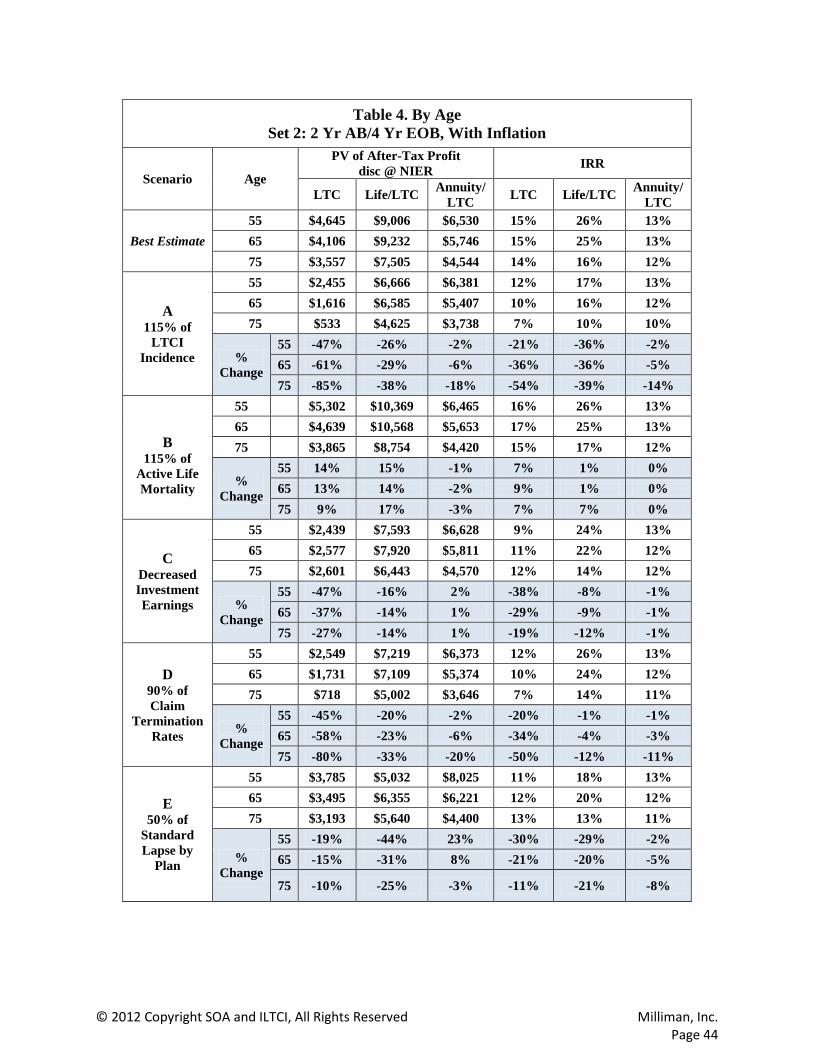
Table 4. By Age Set 2: 2 Yr AB/4 Yr EOB, With Inflation
Scenario Age
PV of After-Tax Profit disc @ NIER IRR
LTC Life/LTC Annuity/LTC LTC Life/LTC Annuity/
LTC
Best Estimate 55 $4,645 $9,006 $6,530 15% 26% 13% 65 $4,106 $9,232 $5,746 15% 25% 13% 75 $3,557 $7,505 $4,544 14% 16% 12%
A 115% of
LTCI Incidence
55 $2,455 $6,666 $6,381 12% 17% 13% 65 $1,616 $6,585 $5,407 10% 16% 12% 75 $533 $4,625 $3,738 7% 10% 10%
% Change
55 -47% -26% -2% -21% -36% -2% 65 -61% -29% -6% -36% -36% -5% 75 -85% -38% -18% -54% -39% -14%
B
115% of Active Life Mortality
55 $5,302 $10,369 $6,465 16% 26% 13% 65 $4,639 $10,568 $5,653 17% 25% 13% 75 $3,865 $8,754 $4,420 15% 17% 12%
% Change
55 14% 15% -1% 7% 1% 0% 65 13% 14% -2% 9% 1% 0% 75 9% 17% -3% 7% 7% 0%
C Decreased Investment Earnings
55 $2,439 $7,593 $6,628 9% 24% 13% 65 $2,577 $7,920 $5,811 11% 22% 12% 75 $2,601 $6,443 $4,570 12% 14% 12%
% Change
55 -47% -16% 2% -38% -8% -1% 65 -37% -14% 1% -29% -9% -1% 75 -27% -14% 1% -19% -12% -1%
D 90% of Claim
Termination Rates
55 $2,549 $7,219 $6,373 12% 26% 13% 65 $1,731 $7,109 $5,374 10% 24% 12% 75 $718 $5,002 $3,646 7% 14% 11%
%
Change
55 -45% -20% -2% -20% -1% -1% 65 -58% -23% -6% -34% -4% -3% 75 -80% -33% -20% -50% -12% -11%
E 50% of
Standard Lapse by
Plan
55 $3,785 $5,032 $8,025 11% 18% 13% 65 $3,495 $6,355 $6,221 12% 20% 12% 75 $3,193 $5,640 $4,400 13% 13% 11%
% Change
55 -19% -44% 23% -30% -29% -2% 65 -15% -31% 8% -21% -20% -5%
75 -10% -25% -3% -11% -21% -8%

© 2012 Copyright SOA and ILTCI, All Rights Reserved Milliman, Inc. Page 45
Table 5. Aggregate Results
Set 3: 3 Yr AB/3 Yr EOB, Without Inflation
Scenario Age
PV of After-Tax Profit disc @ NIER IRR
LTC Life/LTC Annuity/LTC LTC Life/LTC Annuity/
LTC Best Estimate All $1,709 $7,886 $7,154 15% 11% 13%
A 115% of
LTCI Incidence
All $502 $7,286 $6,957 8% 10% 13% Change -$1,207 -$600 -$197 -7% -1% 0%
% Change -71% -8% -3% -45% -7% -2%
B 115% of
Active Life Mortality
All $1,858 $6,911 $6,980 16% 11% 13%
Change $149 -$975 -$174 1% -1% 0% %
Change 9% -12% -2% 6% -5% -1%
C Decreased Investment Earnings
All $1,190 $6,955 $7,181 12% 10% 13% Change -$519 -$931 $27 -3% -1% 0%
% Change -30% -12% 0% -22% -9% -1%
D 90% of Claim Termination
Rates
All $565 $7,343 $6,948 9% 11% 13% Change -$1,145 -$543 -$206 -6% 0% 0%
% Change -67% -7% -3% -42% -3% -1%
E 50% of
Standard Lapse by Plan
All $1,552 $8,281 $8,551 13% 11% 13% Change -$158 $394 $1,397 -2% 0% 0%
% Change -9% 5% 20% -11% -1% 1%

© 2012 Copyright SOA and ILTCI, All Rights Reserved Milliman, Inc. Page 46
Table 6. By Age Set 3: 3 Yr AB/3 Yr EOB, Without Inflation
Scenario Age
PV of After-Tax Profit disc @ NIER IRR
LTC Life/LTC Annuity/LTC LTC Life/LTC Annuity/
LTC
Best Estimate 55 $1,256 $7,331 $8,257 15% 11% 13% 65 $1,717 $8,442 $7,176 15% 11% 13% 75 $2,333 $7,774 $5,575 14% 12% 12%
A 115% of
LTCI Incidence
55 $534 $6,972 $8,187 11% 10% 13% 65 $535 $7,845 $7,013 9% 11% 13% 75 $405 $6,832 $5,145 7% 10% 12%
% Change
55 -57% -5% -1% -30% -4% -1% 65 -69% -7% -2% -43% -6% -2% 75 -83% -12% -8% -53% -10% -5%
B 115% of
Active Life Mortality
55 $1,405 $6,573 $8,157 16% 10% 13% 65 $1,888 $7,419 $7,005 16% 11% 13% 75 $2,444 $6,572 $5,292 15% 11% 12%
% Change
55 12% -10% -1% 6% -4% 0% 65 10% -12% -2% 7% -5% -1% 75 5% -15% -5% 5% -7% -2%
C
Decreased Investment Earnings
55 $706 $6,472 $8,288 10% 10% 13% 65 $1,175 $7,462 $7,206 11% 10% 13% 75 $1,891 $6,821 $5,592 12% 11% 12%
% Change
55 -44% -12% 0% -33% -8% -1% 65 -32% -12% 0% -24% -9% -1% 75 -19% -12% 0% -15% -9% -1%
D 90% of Claim
Termination Rates
55 $553 $7,036 $8,186 11% 10% 13% 65 $580 $7,913 $7,005 9% 11% 13% 75 $557 $6,862 $5,123 7% 11% 12%
% Change
55 -56% -4% -1% -30% -1% 0% 65 -67% -6% -2% -41% -2% -1% 75 -76% -12% -8% -49% -5% -4%
E 50% of
Standard Lapse by
Plan
55 $1,062 $8,068 $10,488 13% 11% 14% 65 $1,540 $8,833 $8,443 13% 11% 13% 75 $2,255 $7,695 $6,012 14% 11% 12%
% Change
55 -15% 10% 27% -16% 1% 2% 65 -10% 5% 18% -13% -1% 1% 75 -3% -1% 8% -6% -3% -1%

© 2012 Copyright SOA and ILTCI, All Rights Reserved Milliman, Inc. Page 47
Table 7. Aggregate Results
Set 4: 3 Yr AB/3 Yr EOB, With Inflation
Scenario Age
PV of After-Tax Profit disc @ NIER IRR
LTC Life/LTC Annuity/LTC LTC Life/LT
C Annuity/
LTC Best Estimate All $4,157 $10,773 $8,097 15% 16% 13%
A 115% of
LTCI Incidence
All $1,639 $8,441 $7,816 10% 12% 12% Change -$2,518 -$2,331 -$281 -6% -4% 0%
% Change -61% -22% -3% -37% -24% -3% B
115% of Active Life Mortality
All $4,678 $11,522 $7,896 16% 17% 13% Change $520 $749 -$201 1% 0% 0%
% Change 13% 7% -2% 8% 1% -1% C
Decreased Investment Earnings
All $2,535 $9,265 $8,222 11% 15% 13% Change -$1,623 -$1,507 $125 -4% -2% 0%
% Change -39% -14% 2% -29% -10% -1% D
90% of Claim Termination
Rates
All $1,764 $8,962 $7,770 10% 16% 13% Change -$2,393 -$1,811 -$327 -5% 0% 0%
% Change -58% -17% -4% -35% -3% -2% E
50% of Standard
Lapse by Plan
All $3,521 $8,313 $9,834 12% 14% 13% Change -$636 -$2,459 $1,737 -3% -3% 0%
% Change -15% -23% 21% -21% -16% 0%
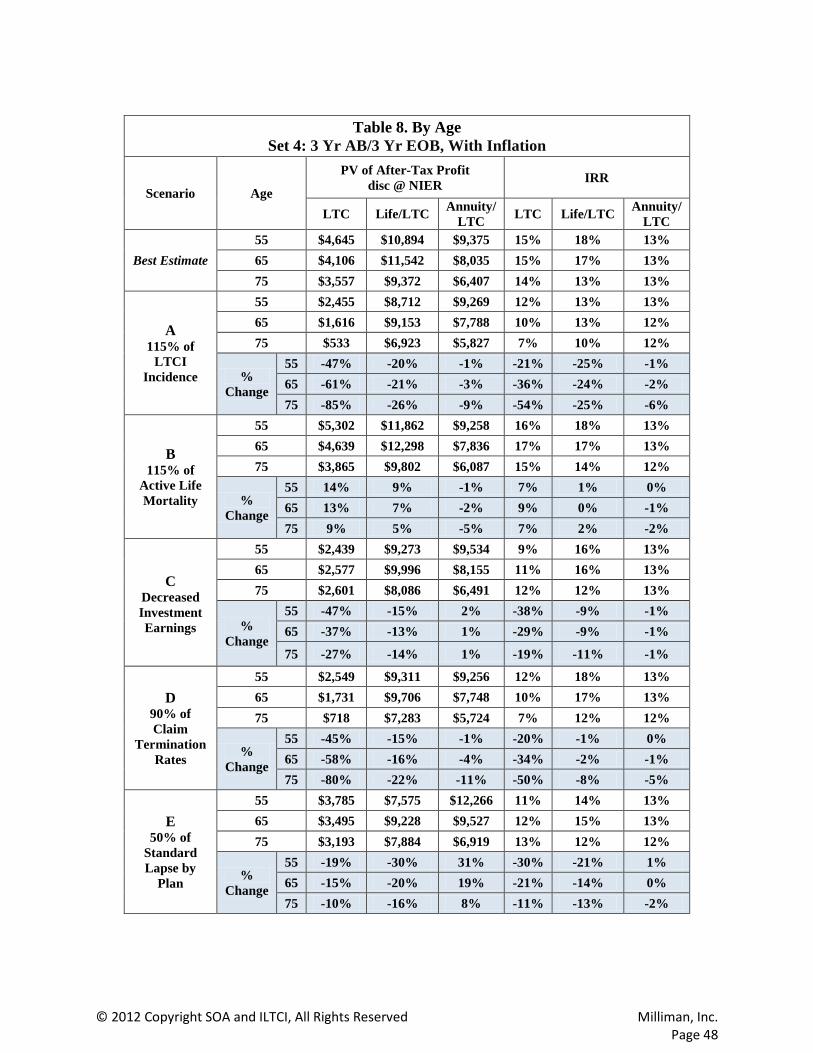
© 2012 Copyright SOA and ILTCI, All Rights Reserved Milliman, Inc. Page 48
Table 8. By Age Set 4: 3 Yr AB/3 Yr EOB, With Inflation
Scenario Age
PV of After-Tax Profit disc @ NIER IRR
LTC Life/LTC Annuity/LTC LTC Life/LTC Annuity/
LTC
Best Estimate 55 $4,645 $10,894 $9,375 15% 18% 13% 65 $4,106 $11,542 $8,035 15% 17% 13% 75 $3,557 $9,372 $6,407 14% 13% 13%
A 115% of
LTCI Incidence
55 $2,455 $8,712 $9,269 12% 13% 13% 65 $1,616 $9,153 $7,788 10% 13% 12% 75 $533 $6,923 $5,827 7% 10% 12%
% Change
55 -47% -20% -1% -21% -25% -1% 65 -61% -21% -3% -36% -24% -2% 75 -85% -26% -9% -54% -25% -6%
B 115% of
Active Life Mortality
55 $5,302 $11,862 $9,258 16% 18% 13% 65 $4,639 $12,298 $7,836 17% 17% 13% 75 $3,865 $9,802 $6,087 15% 14% 12%
% Change
55 14% 9% -1% 7% 1% 0% 65 13% 7% -2% 9% 0% -1% 75 9% 5% -5% 7% 2% -2%
C Decreased Investment Earnings
55 $2,439 $9,273 $9,534 9% 16% 13% 65 $2,577 $9,996 $8,155 11% 16% 13% 75 $2,601 $8,086 $6,491 12% 12% 13%
% Change
55 -47% -15% 2% -38% -9% -1% 65 -37% -13% 1% -29% -9% -1%
75 -27% -14% 1% -19% -11% -1%
D 90% of Claim
Termination Rates
55 $2,549 $9,311 $9,256 12% 18% 13% 65 $1,731 $9,706 $7,748 10% 17% 13% 75 $718 $7,283 $5,724 7% 12% 12%
% Change
55 -45% -15% -1% -20% -1% 0% 65 -58% -16% -4% -34% -2% -1% 75 -80% -22% -11% -50% -8% -5%
E 50% of
Standard Lapse by
Plan
55 $3,785 $7,575 $12,266 11% 14% 13% 65 $3,495 $9,228 $9,527 12% 15% 13% 75 $3,193 $7,884 $6,919 13% 12% 12%
% Change
55 -19% -30% 31% -30% -21% 1% 65 -15% -20% 19% -21% -14% 0% 75 -10% -16% 8% -11% -13% -2%
© 2012 Copyright SOA and ILTCI, All Rights Reserved Milliman, Inc. Page 49
APPENDIX III: BECKER IRR
The Becker method is a technique used to address anomalies in the calculation of internal rates of return when the periodic cash flows being analyzed have multiple sign changes across the periods being studied. This is covered in a 2008 paper, “Calculation of Generalized IRR in Excel,” by Tim Rozar. The paper can be located at http://www.soa.org/library/newsletters/compact/2008/april/com-2008-iss27-rozar.pdf. In that paper, Rozar notes:
“Atkinson & Dallas suggest the Generalized ROI approach for this analysis. This approach was initially outlined by David Becker in “A Generalized Profits Released Model for the Measurement of Return on Investment for Life Insurance,” (TSA 1988 Volume 40 part1 http://www.soa.org/library/research/transactions-of-society-of-actuaries/1988/january/tsa88v40pt15.pdf) and is therefore often referred to as the Becker IRR. Starting with the final cash flow and working backwards, a present value is calculated using the IRR as the discount rate when the present value at that duration is positive and a rate of borrowing as the discount rate when the present value is negative.”
Examples are also provided in the paper to illustrate the mechanics of these calculations.

© 2012 Copyright SOA and ILTCI, All Rights Reserved Milliman, Inc. Page 50
APPENDIX IV: GLOSSARY
AB: Accelerated benefit
Active life mortality: Mortality rates on lives in the non-disabled portion of the modeled population
ADLs: Activities of daily living
Claim termination rates: The annual (or other periodic) percentage of insured lives who are initially disabled who recover during that time period
COI: cost of insurance, a charge assessed periodically to cover the cost of providing insurance
Coinsurance approach: Under combo annuity products, a design featuring the payment of LTCI benefits that are provided in part by the use or acceleration of base plan values, and concurrently in part from general insurance company funds. Total lifetime LTCI benefit payment limits are normally defined in terms of account value at the time an LTCI claim first occurs.
Combo, or combination product: A plan that combines a life or annuity base plan with one or more LTCI riders
Compound inflation benefit (5 percent): A policy feature that annually increases the periodic daily or monthly LTCI benefit limit by 5 percent over the prior year level, and at the same time increases the lifetime maximum limit by 5 percent over the prior year level. (In some policies, the previously unused lifetime maximum limit is inflated.)
Cross-funding: As used here, the use of values from the base policy to fund benefit payments triggered by provisions of one or more LTCI riders. For example, a portion of the life insurance face amount may be accelerated in the event that a qualifying long-term care event occurs. Such a payout reduces the remaining life insurance benefit.
EOB: Extension of benefit
Incidence rates: The annual (or other periodic) percentage of insured lives not already disabled who become disabled during that time period
IRR, or internal rate of return: The rate of return realized on the capital invested into a business or product, generally reflecting statutory earnings plus the changes in capital requirements from year to year
LTCI pool amount: The maximum lifetime LTCI payment limit
NAIC: National Association of Insurance Commissioners

© 2012 Copyright SOA and ILTCI, All Rights Reserved Milliman, Inc. Page 51
NAR: Net amount at risk
NIER: Net investment earnings rate, or the rate of investment return that the insurer realizes on invested assets
Pool design: Under combo annuity products, a design featuring the payment of LTCI benefits that are first provided by the use or acceleration of base plan values up to a dollar limit of benefits equal to the account value, and subsequently from general insurance company funds up to a maximum lifetime LTCI payment limit. That limit is predefined at issue, and at times is expressed as a multiple of the policy’s single premium.
PV of after-tax profits: The present value of statutory earnings, discounted at the NIER
Tail design: Under combo annuity products, a design featuring the payment of LTCI benefits that are first provided by the use or acceleration of base plan values up to some limit specified in terms of years or dollars of benefits, and subsequently from general insurance company funds. Total lifetime LTCI benefit payment limits are normally defined in terms of account value at the time an LTCI claim first occurs.
Underwriting selection factors: Factors that are applied against attained age incidence rates by policy duration to reflect the value of underwriting