quantifying ecosystem controls and their contextual
TRANSCRIPT

Quantifying Ecosystem Controlsand Their Contextual Interactions
on Nutrient Export fromDeveloping Forest Mesocosms
Karen H. Beard,1* Deane Wang,1 Carl E. Waite,1 Kelly L. M. Decker,2
Gary J. Hawley,1 Donald D. DeHayes,1 Jeffery W. Hughes,1
and Jonathan R. Cumming3
1School of Natural Resources, Aiken Center, University of Vermont, Burlington, Vermont 05405, USA; 2Earth Systems Science and
Policy, California State University, Monterey Bay, NASA-AMES Research Center, Moffett Field, California 94035, USA;1 and3Department of Biology, West Virginia University, Morgantown, West Virginia 26506, USA
ABSTRACT
The complexity of natural ecosystems makes it
difficult to compare the relative importance of
abiotic and biotic factors and to assess the effects of
their interactions on ecosystem development. To
improve our understanding of ecosystem com-
plexity, we initiated an experiment designed to
quantify the main effects and interactions of several
factors that are thought to affect nutrient export
from developing forest ecosystems. Using a repli-
cated 2 · 2 · 4 factorial experiment, we quantified
the main effects of these factors and the factor
interactions on annual calcium, magnesium, and
potassium export from field mesocosms over 4
years for two Vermont locations, two soils, and four
different tree seedling communities. We found that
the main effects explained 56%–97% of total var-
iation in nutrient export. Abiotic factors (location
and soil) accounted for a greater percentage of the
total variation in nutrient export (47%–94%) than
the biotic factor (plant community) (2%–15%).
However, biotic control over nutrient export was
significant, even when biomass was minimal. Fac-
tor interactions were often significant, but they
explained less of the variation in nutrient export
(1%–33%) than the main effects. Year-to-year
fluctuations influenced the relative importance of
the main effects in determining nutrient export and
created factor interactions between most of the
explanatory variables. Our study suggests that
when research is focused on typically used main
effects, such as location and soil, and interactions
are aggregated into overall error terms, important
information about the factors controlling ecosys-
tem processes can be lost.
Key words: nutrient export; contextual interac-
tions; leachate; calcium; magnesium; potassium;
soil; location; climate; plant community; ecosystem
development.
INTRODUCTION
Quantification of the relative importance of abiotic
and biotic controls on ecosystem processes during
development is fundamental to our understanding
of forest ecosystems. It has generally been accepted
that abiotic factors, such as initial source pools and
Received 12 March 2003; accepted 14 November 2003; Published Online
j.
*Corresponding author; e-mail: [email protected]
Present address: Department of Forest, Range, and Wildlife Sciences and
the Ecology Center, Utah State University, Logan, Utah, 84322-5230,
USA
Ecosystems (2004) 7: 1–16DOI: 10.1007/s10021-004-0041-y
1

climate, control nutrient export, especially during
the initial stages of development (Odum 1963).
However, persistent questions remain regarding
the emergence and extent of biotic control of
nutrient export during this time (Bormann and
Likens 1979; Gorham and others 1979; Bormann
and others 1998; Chadwick and others 1999). Al-
though numerous studies have been conducted on
this subject, because of the complexity and size of
natural forest ecosystems researchers have found it
difficult to use field and experimental research to
quantify the relative importance of different abiotic
and biotic controls on nutrient export during eco-
system development.
Theoretical research on the controls of nutrient
export during forest ecosystem development began
over three decades ago, when Odum (1969) sug-
gested that the primary role of the2 biota in limiting
nutrient losses during development was to impose
a functional ‘‘strategy’’ that resulted in tighter
nutrient cycles, thus conserving these important
resources. Alternatively, Vitousek and Reiners
(1975) took a ‘‘mass balance’’ approach. According
to this view, biomass accumulation initially con-
tributes to increased storage in the ecosystem, but
as the ecosystem matures and net ecosystem pro-
duction declines, the biota contributes less to stor-
age and consequently increases nutrient losses.
Few recent theoretical studies have been conducted
on the factors controlling forest nutrient export (for
example, Finn 1982), while comparative experi-
mental approaches at several sites have suggested
that multiple factors (for example, soil nutrient
availability, tree density) are important (for exam-
ple, Chapman and others 1949; Zirlewagen and
von Wilpert 2001).
It is difficulty to identify which combination of
factors drives nutrient export because published
empirical results often contradict one another. For
example, some studies suggest an increase in
nutrient losses along successional gradients (Vito-
usek 1977) but a decline in nutrient availability
with age (Bormann and Sidle 1990; Brais and
others 1995), whereas others do not demonstrate
these monotonic patterns (for example, Allen and
others 1997). Another potential complication in
the interpretation of these results is nonadditive
factor interactions.
Few studies on forest ecosystems have explicitly
tested for the role of interactions between factors.
Because ecologists use the term ‘‘interaction’’ in
many different contexts, we need to clarify our use
of the term. Our use is statistical: Different combi-
nations of treatment variables influence the out-
come of the response variable in a nonadditive
manner. In our study, this translates to the fol-
lowing hypothesis: 3Different combinations of cli-
mate, soil, and plant community influence nutrient
export from forest ecosystems in a nonadditive
manner. We refer to this relationship, measured as
statistical interaction, as ‘‘contextual’’ interaction
to differentiate it from other ecological interactions
(for example, competitive interactions between
two species or the additive responses of an organ-
ism to individual environmental factors) and be-
cause it arises out of the context in which a process
takes place. Contextual interactions between fre-
quently investigated factors may explain a sub-
stantial and significant component of ecological
responses at the ecosystem level and may be critical
during ecosystem development. However, only by
addressing contextual interactions explicitly, using
a carefully designed experiment, can their statisti-
cal and ecological importance be evaluated quan-
titatively.
Because a true factor analysis cannot be done
using field studies, empirical interpretation of field
studies can be misleading (Wootton 1994).
Researchers have approached this issue by studying
chronosequences or different-aged stands (that is,
space-for-time substitutions) (Van Cleve and Vie-
reck 1981; Van Cleve and others 1983; Brais and
others 1995); however, these approaches cannot
completely control for site- and time-related dif-
ferences. In this paper, we present an approach that
deals with nonadditive factor interactions and uses
an experimental design based on mesocosms to
provide additional insight into patterns of nutrient
dynamics during ecosystem development (Beyers
and Odum 1993; Bormann and others 1993; Heltai
and others 1995). Although the necessary tradeoff
between ‘‘control’’ and field relevance over longer
periods of time limits the strength of any conclu-
sions involving long-term dynamics, our design can
be used to address specific questions regarding the
critical stage of stand establishment and funda-
mental relationships among factors controlling
nutrient export.
The goal of this research was to identify, quan-
tify, and interpret variation in total annual nutrient
export from forest mesocosms with different abiotic
(climate and soil) and biotic (plant community)
treatments during early stages of ecosystem devel-
opment. More specifically, we sought to quantify
(a) the magnitude of location, soil, and plant
community control of nutrient export during
4-years of primary succession; and (b) the impor-
tance of interactions between and among location,
soil, and plant community factors in controlling
nutrient export during this 4-year period. We chose
2 K. H. Beard and others
sites within a small geographic region that accen-
tuated climatic differences among the experimental
units, but we recognize that site differences include
more factors than climate. Thus, we hereafter refer
to ‘‘location,’’ as opposed to climate, as a factor. We
focused on calcium (Ca), magnesium (Mg), and
potassium (K), so we could observe the response of
several plant nutrients to a variety of factors. Using
our experiment’s ability to quantify sources of
variation, we tested three specific predictions: (a)
Location and soil factors initially control patterns in
nutrient export, (b) plant communities play an
increasingly important and strategic role in nutri-
ent export as the ecosystem develops, and (c)
interactions among location, soil, and plant com-
munity emerge as an important determinant of
nutrient export over time. This research is part of a
longer-term study of ecosystem development using
the same experimental mesocosms.
METHODS
Experimental Mesocosms
Mesocosms were constructed in spring and early
summer of 1995 from 3,600-L commercially man-
ufactured tanks of linear polyethylene (Polytank,
Litchfield, MN, USA). Each tank was 2.4 m in
diameter and 1 m deep to the bottom of the soil fill.
Each tank held 4.7 m3 of soil. A conical section at
the bottom of each tank, below the soil fill, was
filled with 0.7 m3 of nutrient-poor coarse granite to
allow drainage and leachate collection. A fine
geotextile cloth was used to keep soil from infil-
trating the granite layer. A 15.2-cm–diameter
polyvinylchloride (PVC) pipe was placed upright in
the center of the tanks and extended to the tank
bottom. In addition to providing storage for drain-
age water, the pipes were outfitted with a vacuum
extraction system to enable it water removal from
the bottom of the tank.
Experimental Design
The mesocosm experiment was a 2 · 2 · 4 factorial
in a split-plot design with location, soil, and plant
community treated as factors. There were 40 mes-
ocosms in the design—three replicates (or blocks),
each containing eight mesocosms, at the4 USDA
Forest Service Research Laboratory in South Bur-
lington, VT (hereafter referred to as ‘‘SB’’), and two
replicates, each containing eight mesocosms, at the
University of Vermont Wolcott Research Forest in
Wolcott, VT (hereafter referred to as ‘‘Wolcott’’).
Two vegetation-free mesocosms per soil type were
included as controls at each location (four meso-
cosms total), yielding a total of 48 mesocosms in
the experiment. Mesocosm-sized plots, not in-
cluded in the experiments, were planted at each
end of mesocosm rows to reduce ‘‘edge effects’’
(border plots).
Although the two locations are only about 100
km apart, they are climatically different. The SB site
(44�27¢ N; 73�12¢ W; 60 m elevation), located near
Lake Champlain, is more southerly and temperate.
Mean annual temperatures for SB in water years
1997–98, 1998–99, 1999–2000, and 2000–01 were
8.41, 8.98, 7.74, and 7.50�C, respectively, and an-
nual precipitation was 1,363, 768, 947, and 679 L
m)2, respectively 5(all climatic data are from NCDC
2002). However, in 1998–99 and 2000–01, 443 L
m)2 and 104 L m)2 of irrigation water was added
during a few drought periods. Water years at both
locations were estimated from October 1 to Sep-
tember 30 (US Geological Survey Vermont). The
Wolcott site (44�36¢ N; 72�26¢ W; 385 m elevation)
is more northerly and colder than the SB site. In
nearby Morrisville, VT, the mean annual temper-
atures for the same 4 water years were 5.71, 6.19,
5.23, and 4.54�C, respectively. Annual precipita-
tion was 1,261, 924, 1,060, and 832 L m)2,
respectively. In 1998–99, 73 L m)2 of irrigation
water was added. Precipitation chemistry data from
Underhill, VT (44�31¢ N; 72�52¢ W; 399 m), near
SB, a National Atmospheric Deposition Program
(NADP) monitoring site, indicate that Ca, Mg, and
K inputs were less than 2% of outputs at both
locations during this study (NADP/NTN 2002).
One of two unweathered glacial lake deposit
substrates that differed in physical and chemical
properties was placed in each mesocosm (Table 1).
Soils were selected to provide a contrasting envi-
ronment for plant growth that would enable us to
measure nitrogen (N) accumulation and possible
rapid mineral weathering rates. The initial low-N
condition gave us a reasonable chance to measure
statistically significant changes (and therefore pos-
sible interactions) across experimental units. The
difference in availability (on exchange sites) of a
single element (Ca) between the soils was much
greater than the difference of the other major
nutrients (including Mg and K), which gave us the
opportunity to investigate how this condition
might influence the results. We selected soils with
low 6CEC to limit the capacity for abiotic retention
of nutrients from this ecosystem and to enable the
ecosystem to express its biotic capacity. Although
these mined, glacial sands began soil development
at the start of this experiment, they are hereafter
referred to as ‘‘soils.’’ One soil was named after the
company that mined the material, Kullman, in
Ecosystem Controls on Nutrient Export 3
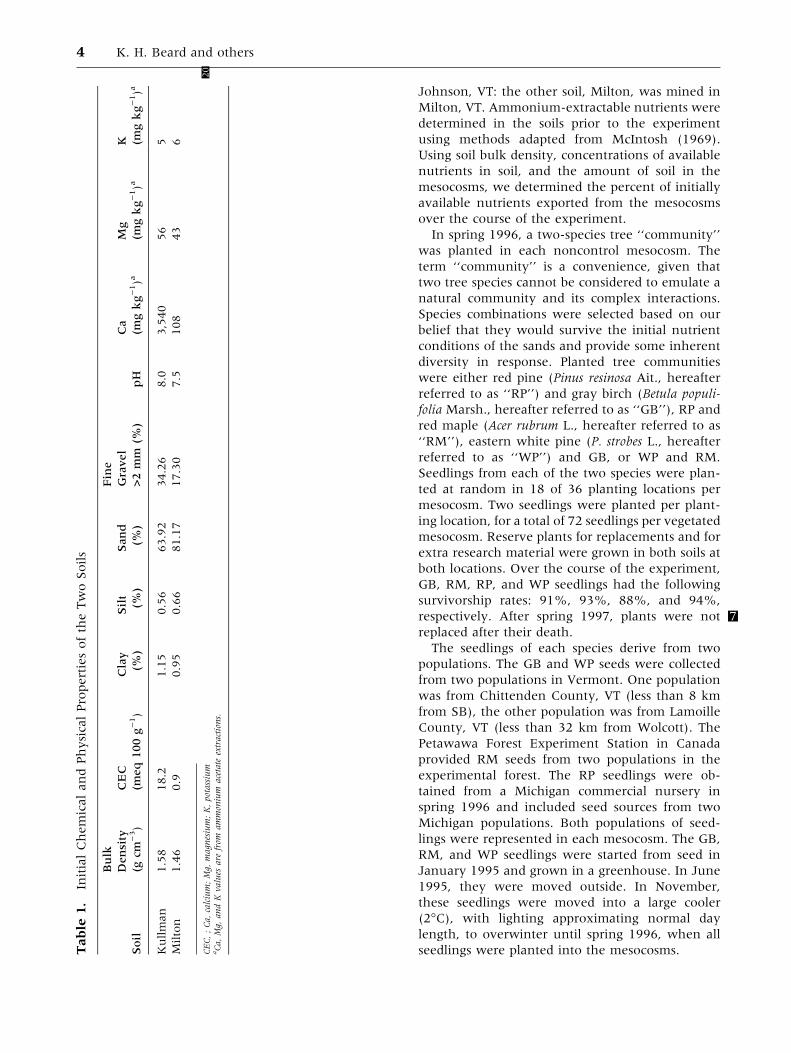
Johnson, VT: the other soil, Milton, was mined in
Milton, VT. Ammonium-extractable nutrients were
determined in the soils prior to the experiment
using methods adapted from McIntosh (1969).
Using soil bulk density, concentrations of available
nutrients in soil, and the amount of soil in the
mesocosms, we determined the percent of initially
available nutrients exported from the mesocosms
over the course of the experiment.
In spring 1996, a two-species tree ‘‘community’’
was planted in each noncontrol mesocosm. The
term ‘‘community’’ is a convenience, given that
two tree species cannot be considered to emulate a
natural community and its complex interactions.
Species combinations were selected based on our
belief that they would survive the initial nutrient
conditions of the sands and provide some inherent
diversity in response. Planted tree communities
were either red pine (Pinus resinosa Ait., hereafter
referred to as ‘‘RP’’) and gray birch (Betula populi-
folia Marsh., hereafter referred to as ‘‘GB’’), RP and
red maple (Acer rubrum L., hereafter referred to as
‘‘RM’’), eastern white pine (P. strobes L., hereafter
referred to as ‘‘WP’’) and GB, or WP and RM.
Seedlings from each of the two species were plan-
ted at random in 18 of 36 planting locations per
mesocosm. Two seedlings were planted per plant-
ing location, for a total of 72 seedlings per vegetated
mesocosm. Reserve plants for replacements and for
extra research material were grown in both soils at
both locations. Over the course of the experiment,
GB, RM, RP, and WP seedlings had the following
survivorship rates: 91%, 93%, 88%, and 94%,
respectively. After spring 1997 7, plants were not
replaced after their death.
The seedlings of each species derive from two
populations. The GB and WP seeds were collected
from two populations in Vermont. One population
was from Chittenden County, VT (less than 8 km
from SB), the other population was from Lamoille
County, VT (less than 32 km from Wolcott). The
Petawawa Forest Experiment Station in Canada
provided RM seeds from two populations in the
experimental forest. The RP seedlings were ob-
tained from a Michigan commercial nursery in
spring 1996 and included seed sources from two
Michigan populations. Both populations of seed-
lings were represented in each mesocosm. The GB,
RM, and WP seedlings were started from seed in
January 1995 and grown in a greenhouse. In June
1995, they were moved outside. In November,
these seedlings were moved into a large cooler
(2�C), with lighting approximating normal day
length, to overwinter until spring 1996, when all
seedlings were planted into the mesocosms.Table
1.
InitialChemicalandPhysicalPropertiesoftheTwoSoils
Soil
Bulk
Density
(gcm
)3)
CEC
(meq100g)1)
Clay
(%)
Silt
(%)
Sand
(%)
Fine
Gravel
>2mm
(%)
pH
Ca
(mgkg)1)a
Mg
(mgkg)1)a
K (mgkg)1)a
Kullman
1.58
18.2
1.15
0.56
63.92
34.26
8.0
3,540
56
5
Milton
1.46
0.9
0.95
0.66
81.17
17.30
7.5
108
43
6
CEC,;
20
Ca,calcium;Mg,
magnesium;K,potassium
aCa,Mg,
andKvalues
are
from
ammonium
acetate
extractions.
4 K. H. Beard and others

Data Collection
Throughout the 1997–2001 water years, the mes-
ocosms were pumped each time 120–375 L of
drainage water (leachate) had accumulated in the
mesocosm tanks. The total volume of leachate re-
moved from each mesocosm on each pumping date
was recorded, and the collected samples were
stored at 2�C. Samples were analyzed for Ca, Mg,
and K concentrations using an ICP/AES (Leeman
Labs PlasmaSpec 2.5). Flux was determined by
multiplying the concentrations of the nutrients in
the leachate by the volume of water leached8 (field
measurements). Measurements were then sum-
med over each water year to determine the annual
flux of each nutrient. Output is expressed as total
grams of cation leached per squaremeter for each
year.
In April 1999, 64 seedlings (eight per soil-species
combination) were harvested from reserve plants at
SB. Plant heights and total oven-dried weights
were measured, and relationships were derived
between height and total biomass for each species.
The relationship between height and total biomass
was significant in all cases (df = 15, P £ 0.001 for
all species; GB: R2 = 0.85, RM: R2 = 0.76, RP:
R2 = 0.59, and WP: R2 = 0.84). The maximum
height values (in cm) used in the regressions (GB:
67.8, RM: 34.5, RP: 29.6, and WP: 28.0) were
similar to the average height values of the plants in
2001 (GB: 60.1, RM: 18.9, RP: 39.4, and WP: 24.6);
therefore, estimates of biomass from these regres-
sions were deemed appropriate throughout the
experiment. These relationships were used to esti-
mate the total biomass from height measurements
taken each year on each seedling.
Above- and belowground biomass of 16 of the
harvested seedlings (two seedlings representing
each soil–species combination) was analyzed for
Ca, Mg, and K concentrations using an ICP/AES.
Sample plant leaves and stems were 0.6% Ca, 0.1%
Mg, and 0.4% K, and plant roots were 0.7% Ca,
0.2% Mg, and 0.4% K, respectively, which are in
the range of expected values (Likens and Bormann
1970; Arthur and others 2001). These percentages
were used to estimate annual cation accumulation
in plant biomass. In June 2001, two soil cores were
taken from the upper 5 cm of each mesocosm. Soil
pH was measured in a 2:1 slurry of deionized water
and 15.0 g of soil.
Data Analysis
Statistical tests were conducted using SAS v. 8. 1 for
Unix (SAS Institute, Cary, NC, USA). Analyses of
variance (ANOVA) were performed for each vari-
able (Ca, Mg, K, and volume of leachate) in each of
the 4 years using a factorial (2 · 2 · 4) in a split-plot
design. Block was the whole-splot unit; location
was the whole-plot factor; mesocosms nested
within blocks were the subplot units; and soil and
plant community were the subplot factors. A sim-
ilar analysis was conducted on soil pH. To assess
potential interactions between year and the
experimental factors, data for all years combined
were analyzed using a repeated-measures design
(that is, a split-plot in time). Transformations were
not deemed necessary to meet model assumption
of normality and homogeneity of variances. A
Student-Newman-Keuls (SNK) test was used to
determine differences among community types,
including the vegetation-free (‘‘bare’’) mesocosms.
In all cases, significant differences were accepted at
P £ 0.05.
We were interested in nonadditive interactions
between and among factors or contextual inter-
actions. Therefore, we specifically investigated
interactions, such as whether soil substrates or the
four plant communities influenced nutrient export
differently in the two locations (for example,
location · soil, location · community). In the
models that included year, we investigated how
year influenced the factors (for example, year ·location) and the interactions (for example, year ·location · community). Expected mean squares
were calculated to determine appropriate error
terms for specific factors and interactions. Because
we were interested in the relative contribution of
each source of variation in determining nutrient
export from each mesocosm, we used variance
components to estimate the percent variation
attributable to main effects and interactions (Steel
and others 1997).
RESULTS
Control of Hydrologic Export
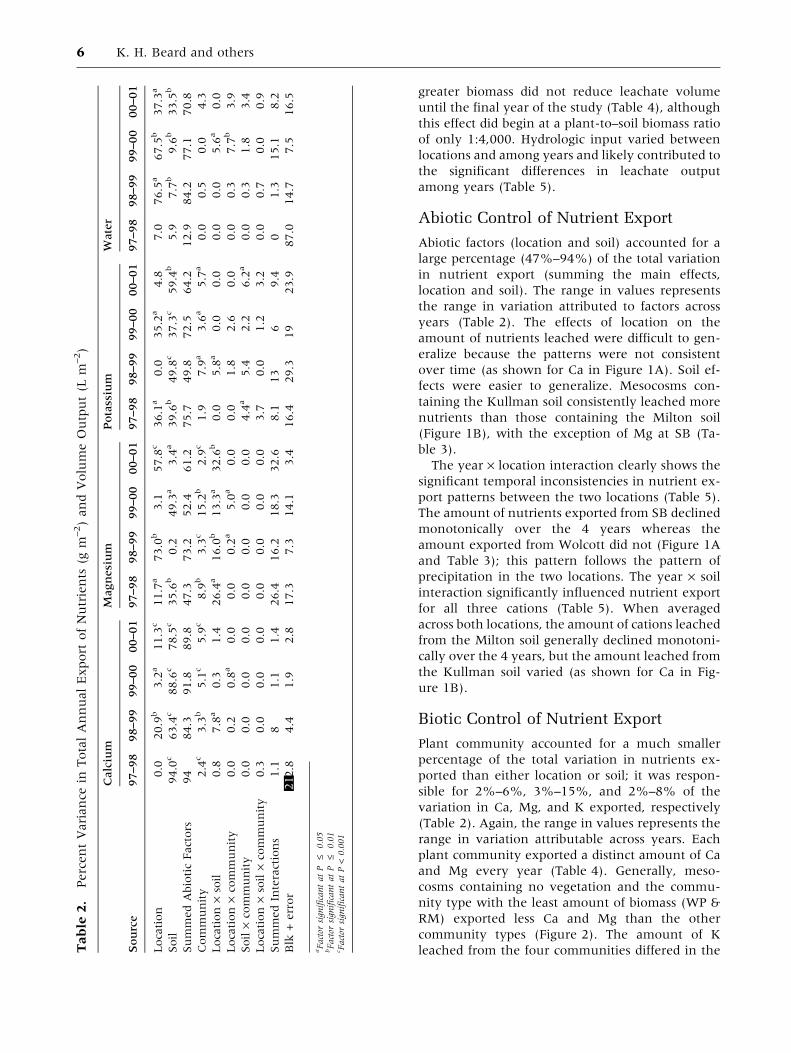
Leachate output in the 1st year was not strongly
influence by any factor, with 87% of the variance
attributable to random factors (Table 2). In the
following 3 years, location differences in output
emerged, and then declined in importance (Ta-
ble 2). Soil became increasingly important, rising to
explain 33% of the total variance by year 4. In all
years, mesocosms containing the Milton soil lea-
ched 20–50 L m–2 y–1 or about 5% more water than
the Kullman soil (Table 3). The bare mesocosms
typically exported more water than the plant
communities (Table 4). Plant communities with
Ecosystem Controls on Nutrient Export 5
greater biomass did not reduce leachate volume
until the final year of the study (Table 4), although
this effect did begin at a plant-to–soil biomass ratio
of only 1:4,000. Hydrologic input varied between
locations and among years and likely contributed to
the significant differences in leachate output
among years (Table 5).
Abiotic Control of Nutrient Export
Abiotic factors (location and soil) accounted for a
large percentage (47%–94%) of the total variation
in nutrient export (summing the main effects,
location and soil). The range in values represents
the range in variation attributed to factors across
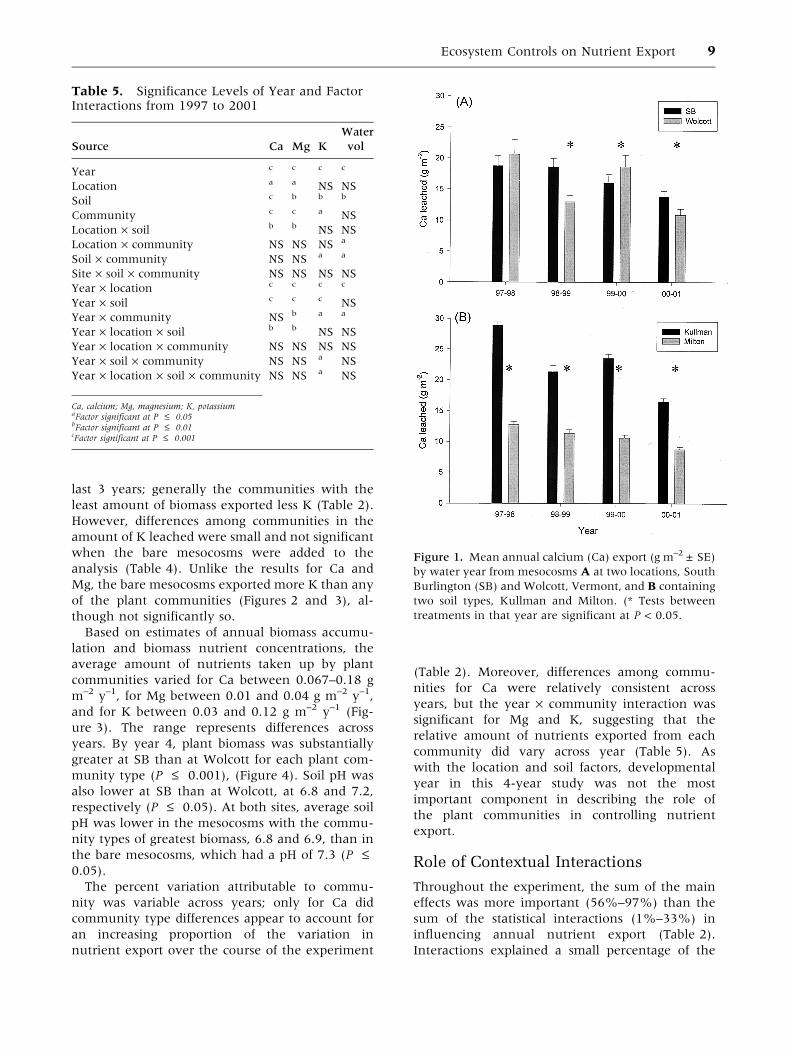
years (Table 2). The effects of location on the
amount of nutrients leached were difficult to gen-
eralize because the patterns were not consistent
over time (as shown for Ca in Figure 1A). Soil ef-
fects were easier to generalize. Mesocosms con-
taining the Kullman soil consistently leached more
nutrients than those containing the Milton soil
(Figure 1B), with the exception of Mg at SB (Ta-
ble 3).
The year · location interaction clearly shows the
significant temporal inconsistencies in nutrient ex-
port patterns between the two locations (Table 5).
The amount of nutrients exported from SB declined
monotonically over the 4 years whereas the
amount exported from Wolcott did not (Figure 1A
and Table 3); this pattern follows the pattern of
precipitation in the two locations. The year · soil
interaction significantly influenced nutrient export
for all three cations (Table 5). When averaged
across both locations, the amount of cations leached
from the Milton soil generally declined monotoni-
cally over the 4 years, but the amount leached from
the Kullman soil varied (as shown for Ca in Fig-
ure 1B).
Biotic Control of Nutrient Export
Plant community accounted for a much smaller
percentage of the total variation in nutrients ex-
ported than either location or soil; it was respon-
sible for 2%–6%, 3%–15%, and 2%–8% of the
variation in Ca, Mg, and K exported, respectively
(Table 2). Again, the range in values represents the
range in variation attributable across years. Each
plant community exported a distinct amount of Ca
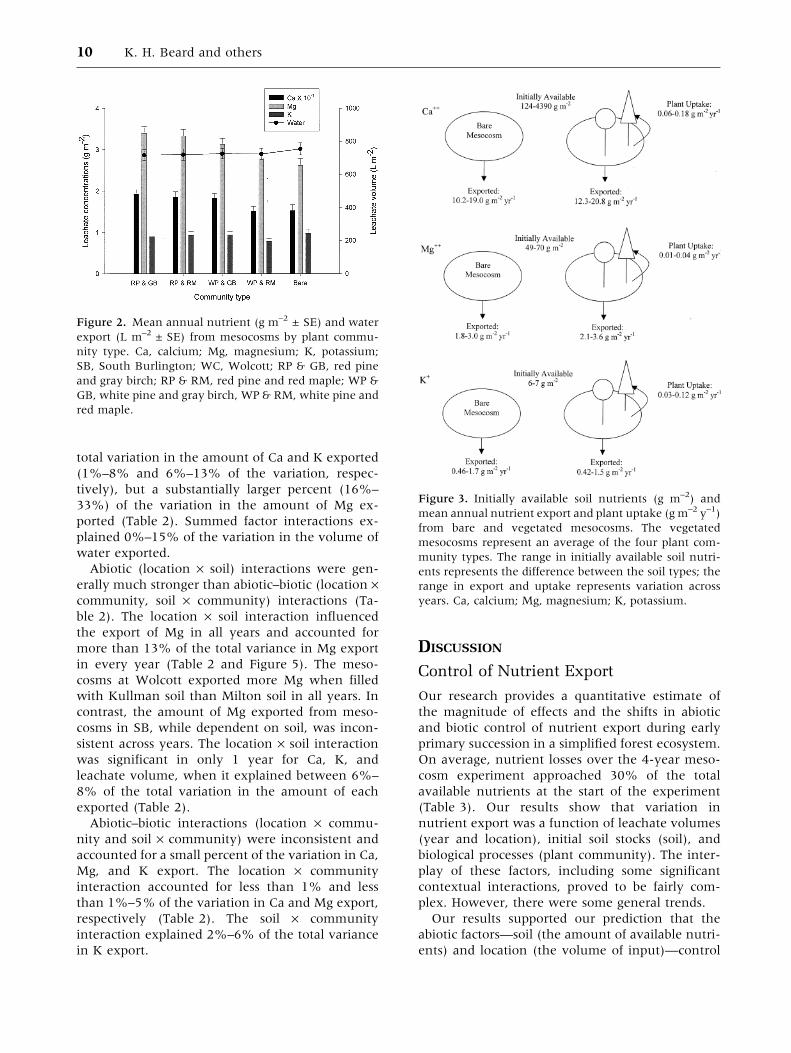
and Mg every year (Table 4). Generally, meso-
cosms containing no vegetation and the commu-
nity type with the least amount of biomass (WP &
RM) exported less Ca and Mg than the other
community types (Figure 2). The amount of K
leached from the four communities differed in theTable
2.
PercentVariance
inTotalAnnualExport
ofNutrients
(gm
–2)andVolumeOutput(L
m–2)
Calcium
Magnesium
Potassium
Water
Source
97–98
98–99
99–00
00–01
97–98
98–99
99–00
00–01
97–98
98–99
99–00
00–01
97–98
98–99
99–00
00–01
Location
0.0
20.9
b3.2
a11.3
c11.7
a73.0
b3.1
57.8
c36.1
a0.0
35.2
a4.8
7.0
76.5
a67.5
b37.3
a
Soil
94.0
c63.4
c88.6
c78.5
c35.6
b0.2
49.3
a3.4
a39.6
b49.8
c37.3
c59.4
b5.9
7.7
b9.6
b33.5
b
SummedAbioticFactors
94
84.3
91.8
89.8
47.3
73.2
52.4
61.2
75.7
49.8
72.5
64.2
12.9
84.2
77.1
70.8
Community
2.4
c3.3
b5.1
c5.9
c8.9
b3.3
c15.2
b2.9
c1.9
7.9
a3.6
a5.7
a0.0
0.5
0.0
4.3
Location·soil
0.8
7.8
a0.3
1.4
26.4
a16.0
b13.3
a32.6
b0.0
5.8
a0.0
0.0
0.0
0.0
5.6
a0.0
Location·community
0.0
0.2
0.8
a0.0
0.0
0.2
a5.0
a0.0
0.0
1.8
2.6
0.0
0.0
0.3
7.7
b3.9
Soil·community
0.0
0.0
0.0
0.0
0.0
0.0
0.0
0.0
4.4
a5.4
2.2
6.2
a0.0
0.3
1.8
3.4
Location·soil·community
0.3
0.0
0.0
0.0
0.0
0.0
0.0
0.0
3.7
0.0
1.2
3.2
0.0
0.7
0.0
0.9
SummedInteractions
1.1
81.1
1.4
26.4
16.2
18.3
32.6
8.1
13
69.4
01.3
15.1
8.2
Blk
+error
212.8
4.4
1.9
2.8
17.3
7.3
14.1
3.4
16.4
29.3
19
23.9
87.0
14.7
7.5
16.5
aFactor
significantatP
£0.05
bFactor
significantatP
£0.01
c Factor
significantatP<0.001
6 K. H. Beard and others
Table
3.
MeanAnnualLoss
ofNutrients
andLeach
ate
Volume(±SE)byLocationandSoilType
WaterYear
Element
Site
Soil
97–98
98–99
99–00
00–01
TotalExported
%Exported
Ca(g
m–2)
SB
Kullman
28.6
(0.6)a,Ab,c
24.5
(0.6)b,A
22.3
(0.6)c,
B17.9
(0.5)d,A
93.3
(1.9)
2.1
Milton
1.34(0.7)a,B
12.7
(0.6)a,C
9.8
(0.5)b,C
9.7
(2.5)b,C
45.5
(2.1)
36.6
WC
Kullman
29.4
(0.8)a,A
16.5
(0.7)c,
B25.4
(1.2)b,A
14.3
(0.6)c,
B85.7
(3.1)
2.0
Milton
11.8
(0.9)a,B
9.4
(0.6)a
b,D
11.9
(0.9)a,C
7.4
(0.4)b,D
40.5
(2.5)
32.6
Mg(g
m–2)
SB
Kullman
4.18(0.1)a,A
3.54(0.1)b,B
3.03(0.00)c,
B2.39(0.04)d,B
13.2
(0.2)
19.0
Milton
3.72(0.2)a,A
4.07(0.1)a,A
2.53(0.01)b,C
2.62(0.06)b,A
13.0
(0.5)
26.3
WC
Kullman
4.19(0.1)a,A
2.42(0.1)b,C
3.58(0.02)c,
A1.98(0.06)d,C
12.2
(0.4)
17.6
Milton
2.40(0.2)a,B
1.87(0.1)b,D
2.51(0.22)a,C
1.27(0.06)c,
D8.06(0.6)
16.3
K(g
m–2)
SB
Kullman
1.59(0.04)a,B
0.84(0.02)b,A
0.72(0.02)c,
B0.48(0.01)d,A
3.63(0.1)
58.5
Milton
1.00(0.02)a,C
0.56(0.02)b,B
0.42(0.02)c,
C0.31(0.01)d,C
2.39(0.1)
34.6
WC
Kullman
2.17(0.15)a,A
0.74(0.04)bc,
A1.00(0.01)b,A
0.53(0.04)c,
A4.44(0.4)
71.6
Milton
1.58(0.11)a,B
0.60(0.04)b,B
0.72(0.01)b,B
0.38(0.03)c,
B3.38(0.2)
49.0
Water(L
·103m
–2)
SB
Kullman
0.96(0.01)a,B
0.68(0.01)c,
B0.72(0.01)b,C
0.46(0.00)d,B
2.82(0.02)
NA
Milton
0.98(0.02)a,AB
0.73(0.02)b,A
0.74(0.01)b,C
0.50(0.01)c,
A3.06(0.05)
NA
WC
Kullman
1.01(0.02)a,AB
0.52(0.01)c,
D0.82(0.02)b,B
0.42(0.01)d,C
2.88(0.05)
NA
Milton
1.03(0.01)a,A
0.57(0.01)c,
C0.90(0.01)b,A
0.46(0.01)d,B
3.06(0.03)
NA
Ca,calcium;Mg,
magnesium;K,potassium;SB,South
Burlington;WC,Wolcott
22
.SignificantdifferencescalculatedbytheStudent-New
man-Keulstestat:P<0.05.
aPercentof
initiallyavailable
nutrientsexported.
bWithin
each
elem
ent,meanvalues
follow
edbythesamelower-case
lettersare
not
significantlydifferentfrom
oneanother
when
comparingwithin
aparticularlocation–soilcombination
acrossawateryear.
c Within
each
elem
ent,meanvalues
follow
edbythesameupper-case
lettersare
not
significantlydifferentfrom
oneanother
when
comparingwithin
ayearacrossalocation–soilcombination.
Ecosystem Controls on Nutrient Export 7
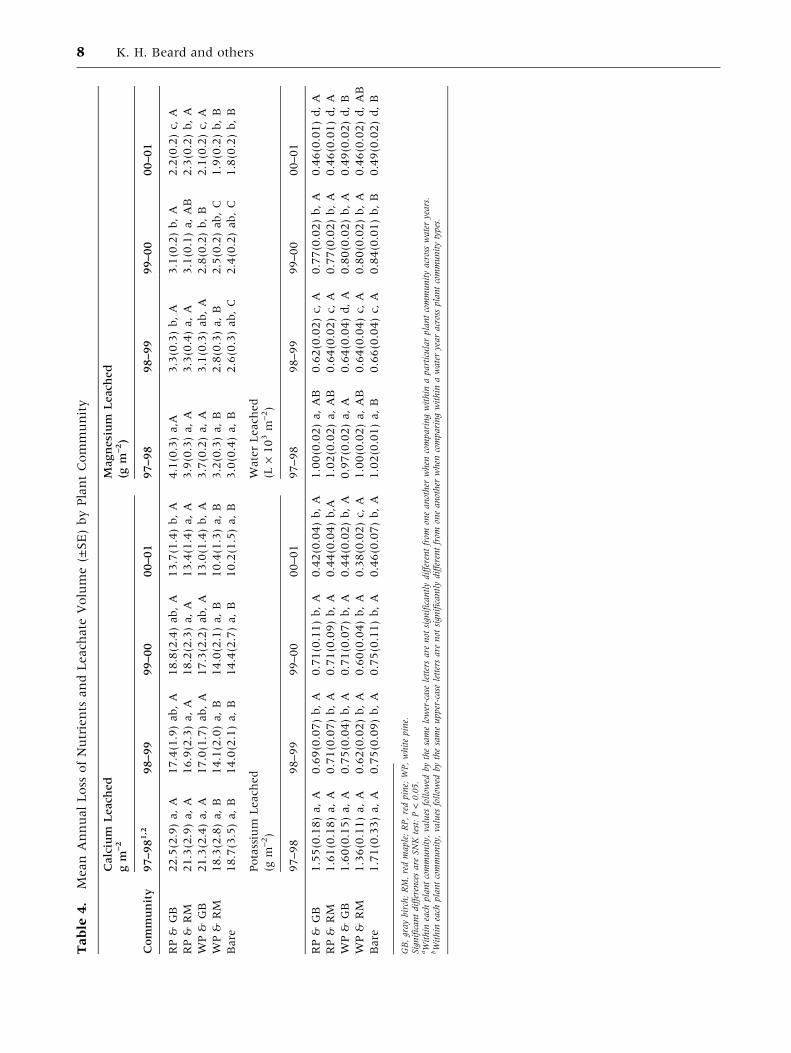
Table
4.
MeanAnnualLoss
ofNutrients
andLeach
ate
Volume(±SE)byPlantCommunity
Calcium
Leach
ed
gm
–2
Magnesium
Leach
ed
(gm
–2)
Community
97–981,2
98–99
99–00
00–01
97–98
98–99
99–00
00–01
RP&
GB
22.5(2.9)a,A
17.4(1.9)ab,A
18.8(2.4)ab,A
13.7(1.4)b,A
4.1(0.3)a,A
3.3(0.3)b,A
3.1(0.2)b,A
2.2(0.2)c,
A
RP&
RM
21.3(2.9)a,A
16.9(2.3)a,A
18.2(2.3)a,A
13.4(1.4)a,A
3.9(0.3)a,A
3.3(0.4)a,A
3.1(0.1)a,AB
2.3(0.2)b,A
WP&
GB
21.3(2.4)a,A
17.0(1.7)ab,A
17.3(2.2)ab,A
13.0(1.4)b,A
3.7(0.2)a,A
3.1(0.3)ab,A
2.8(0.2)b,B
2.1(0.2)c,
A
WP&
RM
18.3(2.8)a,B
14.1(2.0)a,B
14.0(2.1)a,B
10.4(1.3)a,B
3.2(0.3)a,B
2.8(0.3)a,B
2.5(0.2)ab,C
1.9(0.2)b,B
Bare
18.7(3.5)a,B
14.0(2.1)a,B
14.4(2.7)a,B
10.2(1.5)a,B
3.0(0.4)a,B
2.6(0.3)ab,C
2.4(0.2)ab,C
1.8(0.2)b,B
Potassium
Leach
ed
(gm
–2)
WaterLeach
ed
(L·103m
–2)
97–98
98–99
99–00
00–01
97–98
98–99
99–00
00–01
RP&
GB
1.55(0.18)a,A
0.69(0.07)b,A
0.71(0.11)b,A
0.42(0.04)b,A
1.00(0.02)a,AB
0.62(0.02)c,
A0.77(0.02)b,A
0.46(0.01)d,A
RP&
RM
1.61(0.18)a,A
0.71(0.07)b,A
0.71(0.09)b,A
0.44(0.04)b,A
1.02(0.02)a,AB
0.64(0.02)c,
A0.77(0.02)b,A
0.46(0.01)d,A
WP&
GB
1.60(0.15)a,A
0.75(0.04)b,A
0.71(0.07)b,A
0.44(0.02)b,A
0.97(0.02)a,A
0.64(0.04)d,A
0.80(0.02)b,A
0.49(0.02)d,B
WP&
RM
1.36(0.11)a,A
0.62(0.02)b,A
0.60(0.04)b,A
0.38(0.02)c,
A1.00(0.02)a,AB
0.64(0.04)c,
A0.80(0.02)b,A
0.46(0.02)d,AB
Bare
1.71(0.33)a,A
0.75(0.09)b,A
0.75(0.11)b,A
0.46(0.07)b,A
1.02(0.01)a,B
0.66(0.04)c,
A0.84(0.01)b,B
0.49(0.02)d,B
GB,graybirch;RM,redmaple;RP,redpine;WP,whitepine.
Significantdifferencesare
SNK
test:P<0.05.
aWithin
each
plantcommunity,
values
follow
edbythesamelower-case
lettersare
not
significantlydifferentfrom
oneanother
when
comparingwithin
aparticularplantcommunityacrosswateryears.
bWithin
each
plantcommunity,
values
follow
edbythesameupper-case
lettersare
not
significantlydifferentfrom
oneanother
when
comparingwithin
awateryearacrossplantcommunitytypes.
8 K. H. Beard and others
last 3 years; generally the communities with the
least amount of biomass exported less K (Table 2).
However, differences among communities in the
amount of K leached were small and not significant
when the bare mesocosms were added to the
analysis (Table 4). Unlike the results for Ca and
Mg, the bare mesocosms exported more K than any
of the plant communities (Figures 2 and 3), al-
though not significantly so.
Based on estimates of annual biomass accumu-
lation and biomass nutrient concentrations, the
average amount of nutrients taken up by plant
communities varied for Ca between 0.067–0.18 g
m–2 y–1, for Mg between 0.01 and 0.04 g m–2 y–1,
and for K between 0.03 and 0.12 g m–2 y–1 (Fig-
ure 3). The range represents differences across
years. By year 4, plant biomass was substantially
greater at SB than at Wolcott for each plant com-
munity type (P £ 0.001), (Figure 4). Soil pH was
also lower at SB than at Wolcott, at 6.8 and 7.2,
respectively (P £ 0.05). At both sites, average soil
pH was lower in the mesocosms with the commu-
nity types of greatest biomass, 6.8 and 6.9, than in
the bare mesocosms, which had a pH of 7.3 (P £0.05).
The percent variation attributable to commu-
nity was variable across years; only for Ca did
community type differences appear to account for
an increasing proportion of the variation in
nutrient export over the course of the experiment
(Table 2). Moreover, differences among commu-
nities for Ca were relatively consistent across
years, but the year · community interaction was
significant for Mg and K, suggesting that the
relative amount of nutrients exported from each
community did vary across year (Table 5). As
with the location and soil factors, developmental
year in this 4-year study was not the most
important component in describing the role of
the plant communities in controlling nutrient
export.
Role of Contextual Interactions
Throughout the experiment, the sum of the main
effects was more important (56%–97%) than the
sum of the statistical interactions (1%–33%) in
influencing annual nutrient export (Table 2).
Interactions explained a small percentage of the
Table 5. Significance Levels of Year and FactorInteractions from 1997 to 2001
Water
Source Ca Mg K vol
Year c c c c
Location a a NS NS
Soil c b b b
Community c c a NS
Location · soil b b NS NS
Location · community NS NS NS a
Soil · community NS NS a a
Site · soil · community NS NS NS NS
Year · location c c c c
Year · soil c c c NS
Year · community NS b a a
Year · location · soil b b NS NS
Year · location · community NS NS NS NS
Year · soil · community NS NS a NS
Year · location · soil · community NS NS a NS
Ca, calcium; Mg, magnesium; K, potassiumaFactor significant at P £ 0.05bFactor significant at P £ 0.01cFactor significant at P £ 0.001
Figure 1. Mean annual calcium (Ca) export (g m–2 ± SE)
by water year from mesocosms A at two locations, South
Burlington (SB) and Wolcott, Vermont, and B containing
two soil types, Kullman and Milton. (* Tests between
treatments in that year are significant at P < 0.05.
Ecosystem Controls on Nutrient Export 9
total variation in the amount of Ca and K exported
(1%–8% and 6%–13% of the variation, respec-
tively), but a substantially larger percent (16%–
33%) of the variation in the amount of Mg ex-
ported (Table 2). Summed factor interactions ex-
plained 0%–15% of the variation in the volume of
water exported.
Abiotic (location · soil) interactions were gen-
erally much stronger than abiotic–biotic (location ·community, soil · community) interactions (Ta-
ble 2). The location · soil interaction influenced
the export of Mg in all years and accounted for
more than 13% of the total variance in Mg export
in every year (Table 2 and Figure 5). The meso-
cosms at Wolcott exported more Mg when filled
with Kullman soil than Milton soil in all years. In
contrast, the amount of Mg exported from meso-
cosms in SB, while dependent on soil, was incon-
sistent across years. The location · soil interaction
was significant in only 1 year for Ca, K, and
leachate volume, when it explained between 6%–
8% of the total variation in the amount of each
exported (Table 2).
Abiotic–biotic interactions (location · commu-
nity and soil · community) were inconsistent and
accounted for a small percent of the variation in Ca,
Mg, and K export. The location · community
interaction accounted for less than 1% and less
than 1%–5% of the variation in Ca and Mg export,
respectively (Table 2). The soil · community
interaction explained 2%–6% of the total variance
in K export.
DISCUSSION
Control of Nutrient Export
Our research provides a quantitative estimate of
the magnitude of effects and the shifts in abiotic
and biotic control of nutrient export during early
primary succession in a simplified forest ecosystem.
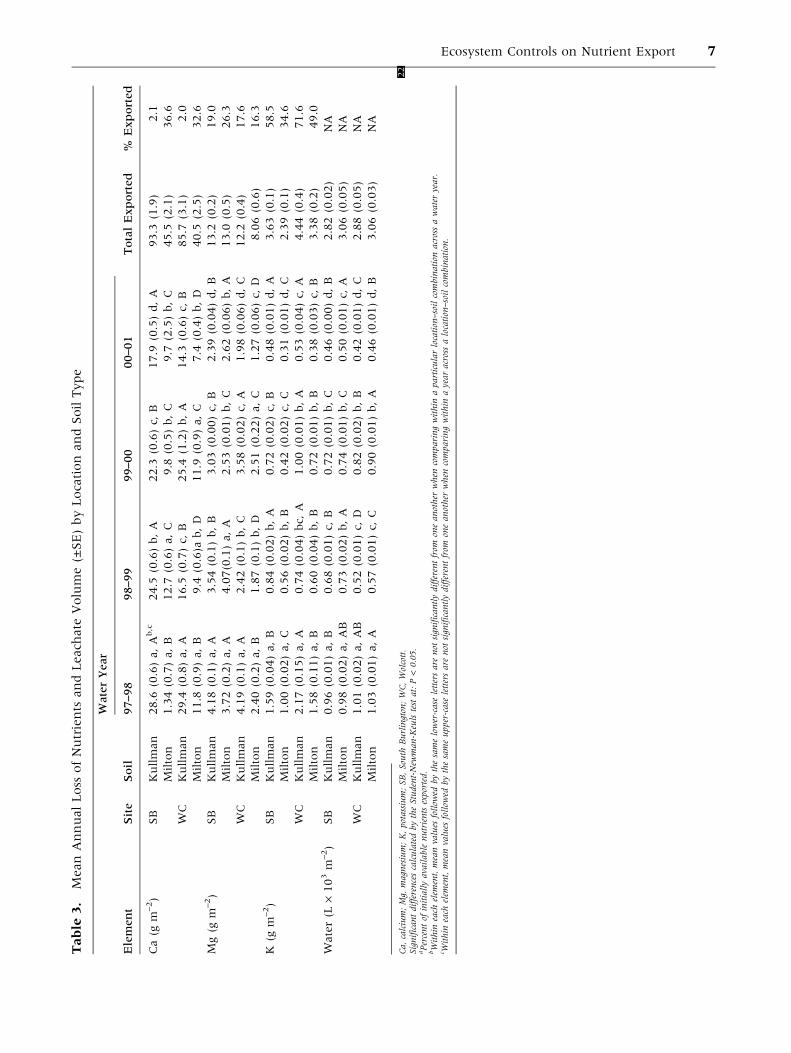
On average, nutrient losses over the 4-year meso-
cosm experiment approached 30% of the total
available nutrients at the start of the experiment
(Table 3). Our results show that variation in
nutrient export was a function of leachate volumes
(year and location), initial soil stocks (soil), and
biological processes (plant community). The inter-
play of these factors, including some significant
contextual interactions, proved to be fairly com-
plex. However, there were some general trends.
Our results supported our prediction that the
abiotic factors—soil (the amount of available nutri-
ents) and location (the volume of input)—control
Figure 2. Mean annual nutrient (g m–2 ± SE) and water
export (L m–2 ± SE) from mesocosms by plant commu-
nity type. Ca, calcium; Mg, magnesium; K, potassium;
SB, South Burlington; WC, Wolcott; RP & GB, red pine
and gray birch; RP & RM, red pine and red maple; WP &
GB, white pine and gray birch, WP & RM, white pine and
red maple.
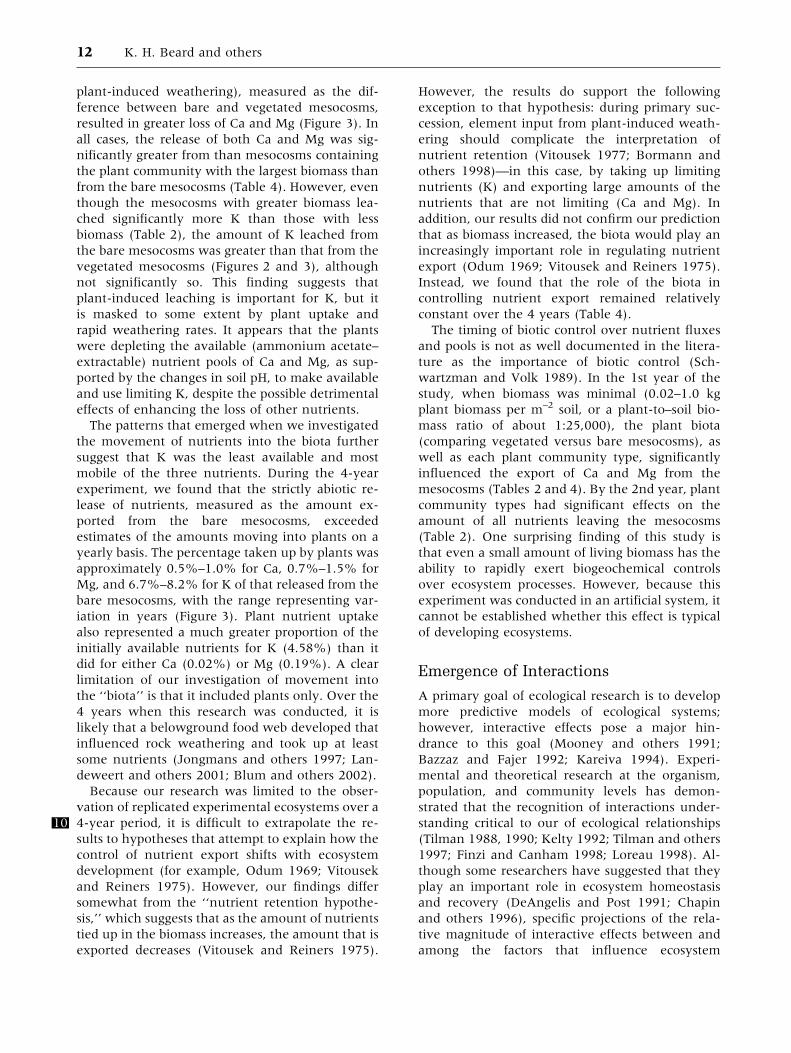
Figure 3. Initially available soil nutrients (g m–2) and
mean annual nutrient export and plant uptake (g m–2 y–1)
from bare and vegetated mesocosms. The vegetated
mesocosms represent an average of the four plant com-
munity types. The range in initially available soil nutri-
ents represents the difference between the soil types; the
range in export and uptake represents variation across
years. Ca, calcium; Mg, magnesium; K, potassium.
10 K. H. Beard and others

variation in nutrient export in the early stages of
ecosystem development (Odum 1969). We were
interested in learning how the relative importance of
these factors in controlling nutrient export changed
over time, including year into development. We
expected the loss of labile cations in the newly ex-
posed substrates to decline over time; themesocosms
demonstrated this trend well for all three9 cation-
s—Ca (Table 3) and K and Mg (Tables 3 and 4).
During the 1st year of the study, the amount of Ca
leached from the Kullman soil and the amount of K
leached from both soils were high compared to
natural temperate, deciduous systems (Likens and
Bormann 1995); during the subsequent 3 years, the
export rates for all cations were in the range typical
of temperate forests (Table 3).
Although there was a general decline in the
amount of nutrients exported over time, significant
year · location and year · soil interactions showed
that the role of these factors in determining nutri-
ent export changed over time (as shown for Ca in
Figure 1). We did not expect this to occur because
some location-associated factors (that is, length of
growing season) and soil-associated factors (that is,
soil texture) were consistent across years. This
finding suggests that the overarching factors we
used do not fully explain nutrient export; therefore
factors associated with location and soil that change
on a yearly basis need to be incorporated into
models of nutrient export. For example, volume of
input, which was associated with location and
changed yearly, appeared to be important in the
export process. To gain a better understanding of
the processes controlling nutrient export, it would
be useful to identify the factors that change with
year and influence the role of the abiotic factors in
controlling leachate chemistry. It would also be
useful to determine how the annual variation we
found affects general patterns at longer time scales.
To test our second prediction, we needed to
evaluate the emergence of the plant communities
as a controlling variable of nutrient export. Despite
low productivity throughout the experiment (on
average, 0.2 kg m–2 after 4 years), plant commu-
nities consistently and significantly affected leach-
ate chemistry. Plant community processes (that is,
Figure 4. Average biomass of the plant communities (g
m–2 ± SE) growing in mesocosms at two locations South
Berlington (SB) and Wolcott (WC) Vermont over 5 years.
19For plant community type, see Figure 2.
Figure 5. Mean annual nutrient export (g m–2 ± SE)
from mesocosms containing two soil types, Kullman and
Milton, at two locations, South Burlington (SB) and
Wolcott (WC), VT, USA, for 4 years. * Tests between soils
at one site are significant at P < 0.05. Ca, calcium; Mg,
magnesium; K, potassium.
Ecosystem Controls on Nutrient Export 11
plant-induced weathering), measured as the dif-
ference between bare and vegetated mesocosms,
resulted in greater loss of Ca and Mg (Figure 3). In
all cases, the release of both Ca and Mg was sig-
nificantly greater from than mesocosms containing
the plant community with the largest biomass than
from the bare mesocosms (Table 4). However, even
though the mesocosms with greater biomass lea-
ched significantly more K than those with less
biomass (Table 2), the amount of K leached from
the bare mesocosms was greater than that from the
vegetated mesocosms (Figures 2 and 3), although
not significantly so. This finding suggests that
plant-induced leaching is important for K, but it
is masked to some extent by plant uptake and
rapid weathering rates. It appears that the plants
were depleting the available (ammonium acetate–
extractable) nutrient pools of Ca and Mg, as sup-
ported by the changes in soil pH, to make available
and use limiting K, despite the possible detrimental
effects of enhancing the loss of other nutrients.
The patterns that emerged when we investigated
the movement of nutrients into the biota further
suggest that K was the least available and most
mobile of the three nutrients. During the 4-year
experiment, we found that the strictly abiotic re-
lease of nutrients, measured as the amount ex-
ported from the bare mesocosms, exceeded
estimates of the amounts moving into plants on a
yearly basis. The percentage taken up by plants was
approximately 0.5%–1.0% for Ca, 0.7%–1.5% for
Mg, and 6.7%–8.2% for K of that released from the
bare mesocosms, with the range representing var-
iation in years (Figure 3). Plant nutrient uptake
also represented a much greater proportion of the
initially available nutrients for K (4.58%) than it
did for either Ca (0.02%) or Mg (0.19%). A clear
limitation of our investigation of movement into
the ‘‘biota’’ is that it included plants only. Over the
4 years when this research was conducted, it is
likely that a belowground food web developed that
influenced rock weathering and took up at least
some nutrients (Jongmans and others 1997; Lan-
deweert and others 2001; Blum and others 2002).
Because our research was limited to the obser-
vation of replicated experimental ecosystems over a
4-year period, it is difficult to extrapolate10 the re-
sults to hypotheses that attempt to explain how the
control of nutrient export shifts with ecosystem
development (for example, Odum 1969; Vitousek
and Reiners 1975). However, our findings differ
somewhat from the ‘‘nutrient retention hypothe-
sis,’’ which suggests that as the amount of nutrients
tied up in the biomass increases, the amount that is
exported decreases (Vitousek and Reiners 1975).
However, the results do support the following
exception to that hypothesis: during primary suc-
cession, element input from plant-induced weath-
ering should complicate the interpretation of
nutrient retention (Vitousek 1977; Bormann and
others 1998)—in this case, by taking up limiting
nutrients (K) and exporting large amounts of the
nutrients that are not limiting (Ca and Mg). In
addition, our results did not confirm our prediction
that as biomass increased, the biota would play an
increasingly important role in regulating nutrient
export (Odum 1969; Vitousek and Reiners 1975).
Instead, we found that the role of the biota in
controlling nutrient export remained relatively
constant over the 4 years (Table 4).
The timing of biotic control over nutrient fluxes
and pools is not as well documented in the litera-
ture as the importance of biotic control (Sch-
wartzman and Volk 1989). In the 1st year of the
study, when biomass was minimal (0.02–1.0 kg
plant biomass per m–2 soil, or a plant-to–soil bio-
mass ratio of about 1:25,000), the plant biota
(comparing vegetated versus bare mesocosms), as
well as each plant community type, significantly
influenced the export of Ca and Mg from the
mesocosms (Tables 2 and 4). By the 2nd year, plant
community types had significant effects on the
amount of all nutrients leaving the mesocosms
(Table 2). One surprising finding of this study is
that even a small amount of living biomass has the
ability to rapidly exert biogeochemical controls
over ecosystem processes. However, because this
experiment was conducted in an artificial system, it
cannot be established whether this effect is typical
of developing ecosystems.
Emergence of Interactions
A primary goal of ecological research is to develop
more predictive models of ecological systems;
however, interactive effects pose a major hin-
drance to this goal (Mooney and others 1991;
Bazzaz and Fajer 1992; Kareiva 1994). Experi-
mental and theoretical research at the organism,
population, and community levels has demon-
strated that the recognition of interactions under-
standing critical to our of ecological relationships
(Tilman 1988, 1990; Kelty 1992; Tilman and others
1997; Finzi and Canham 1998; Loreau 1998). Al-
though some researchers have suggested that they
play an important role in ecosystem homeostasis
and recovery (DeAngelis and Post 1991; Chapin
and others 1996), specific projections of the rela-
tive magnitude of interactive effects between and
among the factors that influence ecosystem
12 K. H. Beard and others
development have not been well established. To
our knowledge, this is the first ecosystem study
explicitly designed to test for and quantify inter-
actions among multiple factors.
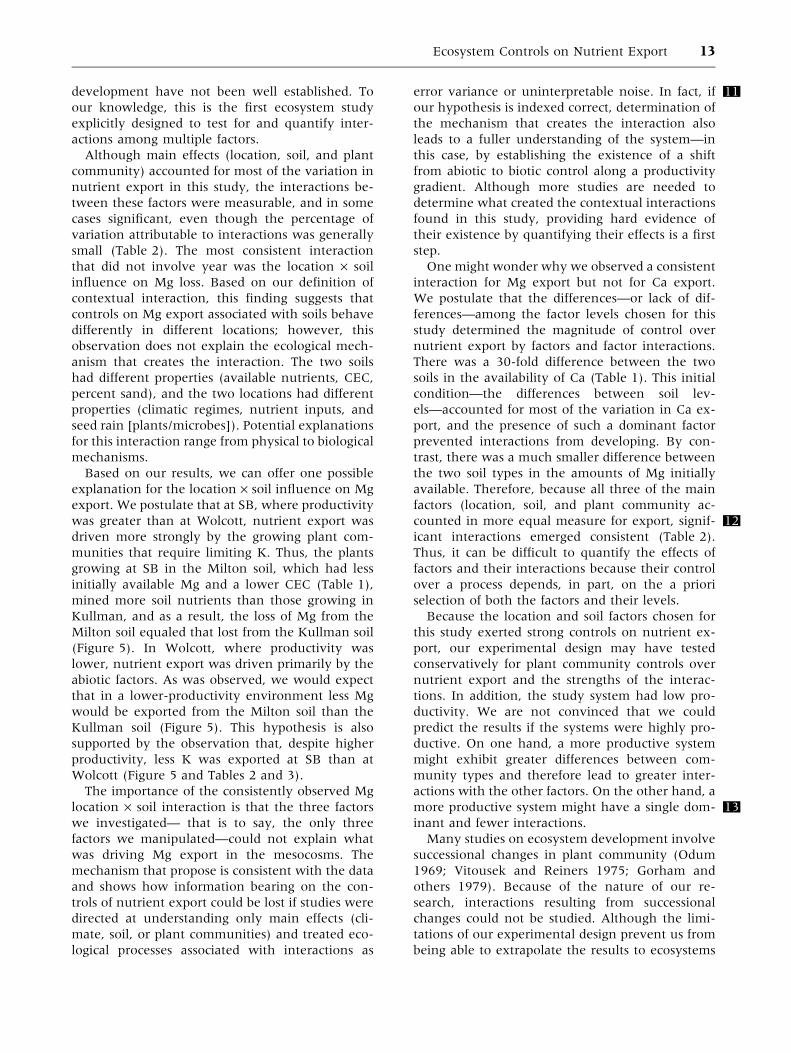
Although main effects (location, soil, and plant
community) accounted for most of the variation in
nutrient export in this study, the interactions be-
tween these factors were measurable, and in some
cases significant, even though the percentage of
variation attributable to interactions was generally
small (Table 2). The most consistent interaction
that did not involve year was the location · soil
influence on Mg loss. Based on our definition of
contextual interaction, this finding suggests that
controls on Mg export associated with soils behave
differently in different locations; however, this
observation does not explain the ecological mech-
anism that creates the interaction. The two soils
had different properties (available nutrients, CEC,
percent sand), and the two locations had different
properties (climatic regimes, nutrient inputs, and
seed rain [plants/microbes]). Potential explanations
for this interaction range from physical to biological
mechanisms.
Based on our results, we can offer one possible
explanation for the location · soil influence on Mg
export. We postulate that at SB, where productivity
was greater than at Wolcott, nutrient export was
driven more strongly by the growing plant com-
munities that require limiting K. Thus, the plants
growing at SB in the Milton soil, which had less
initially available Mg and a lower CEC (Table 1),
mined more soil nutrients than those growing in
Kullman, and as a result, the loss of Mg from the
Milton soil equaled that lost from the Kullman soil
(Figure 5). In Wolcott, where productivity was
lower, nutrient export was driven primarily by the
abiotic factors. As was observed, we would expect
that in a lower-productivity environment less Mg
would be exported from the Milton soil than the
Kullman soil (Figure 5). This hypothesis is also
supported by the observation that, despite higher
productivity, less K was exported at SB than at
Wolcott (Figure 5 and Tables 2 and 3).
The importance of the consistently observed Mg
location · soil interaction is that the three factors
we investigated— that is to say, the only three
factors we manipulated—could not explain what
was driving Mg export in the mesocosms. The
mechanism that propose is consistent with the data
and shows how information bearing on the con-
trols of nutrient export could be lost if studies were
directed at understanding only main effects (cli-
mate, soil, or plant communities) and treated eco-
logical processes associated with interactions as
error variance or uninterpretable noise. In fact, 11if
our hypothesis is indexed correct, determination of
the mechanism that creates the interaction also
leads to a fuller understanding of the system—in
this case, by establishing the existence of a shift
from abiotic to biotic control along a productivity
gradient. Although more studies are needed to
determine what created the contextual interactions
found in this study, providing hard evidence of
their existence by quantifying their effects is a first
step.
One might wonder why we observed a consistent
interaction for Mg export but not for Ca export.
We postulate that the differences—or lack of dif-
ferences—among the factor levels chosen for this
study determined the magnitude of control over
nutrient export by factors and factor interactions.
There was a 30-fold difference between the two
soils in the availability of Ca (Table 1). This initial
condition—the differences between soil lev-
els—accounted for most of the variation in Ca ex-
port, and the presence of such a dominant factor
prevented interactions from developing. By con-
trast, there was a much smaller difference between
the two soil types in the amounts of Mg initially
available. Therefore, because all three of the main
factors (location, soil, and plant community ac-
counted in more equal measure for export, 12signif-
icant interactions emerged consistent (Table 2).
Thus, it can be difficult to quantify the effects of
factors and their interactions because their control
over a process depends, in part, on the a priori
selection of both the factors and their levels.
Because the location and soil factors chosen for
this study exerted strong controls on nutrient ex-
port, our experimental design may have tested
conservatively for plant community controls over
nutrient export and the strengths of the interac-
tions. In addition, the study system had low pro-
ductivity. We are not convinced that we could
predict the results if the systems were highly pro-
ductive. On one hand, a more productive system
might exhibit greater differences between com-
munity types and therefore lead to greater inter-
actions with the other factors. On the other hand, a
more productive system might 13have a single dom-
inant and fewer interactions.
Many studies on ecosystem development involve
successional changes in plant community (Odum
1969; Vitousek and Reiners 1975; Gorham and
others 1979). Because of the nature of our re-
search, interactions resulting from successional
changes could not be studied. Although the limi-
tations of our experimental design prevent us from
being able to extrapolate the results to ecosystems
Ecosystem Controls on Nutrient Export 13
with different starting conditions (for example.,
early colonists or understory plants) or longer-term
processes, it was out intention to show what is
possible, not necessarily what is typical.
Although our measurements revealed that there
were significant interactions among the factors we
studied, our third prediction—that contextual
interactions are increasingly important as a driving
force in influencing nutrient export as the ecosys-
tem develops—was not strongly supported by the
data. This relationship will be investigated as the
experimental mesocosms continue to mature and
we collect more data. The data we have collected to
date do support research suggesting that there are
interactions among the broad factors (climate, soil,
and plant community) often used in studies of
ecosystem development over longer time scale
(Ford 1990; Hotchkiss and others 2000; Ewing
2002). Moreover, our study shows that these
interactions are possible not only after the long
time periods addressed by paleoecological studies,
but also early in ecosystem development.
The contextual interactions found in this study
show that the process of ecosystem development is
much more complex than can be explained solely
by the three factors we investigated. What is most
interesting and unique about our study is its
experimental design. We did not choose to look at
these particular factors because we thought they
were the most important ecosystem drivers. In-
stead, the start of this experiment, they were cho-
sen because they could be easily incorporated into
the experimental design to create differences
among the mesocosms. But ultimately our study
revealed how complex ecosystem development can
become even when starting from this simple state.
In addition, we showed that attempts to identify
the mechanisms underlying significant interactions
can yield useful hypotheses about the functioning
of an ecosystem.
Our simple interpretation of one such interac-
tions underscores the difficulty posed by attempts
to explain contextual interactions. If interactions
truly originate from ‘‘contextual’’ factors that may
change depending on species, location, soil,
topography, and soon, rather than reflecting14 our
lack of knowledge of some other mechanism or
process that could be generalized, then they pres-
ent real challenge to ecologists. The existence of
contextual interactions, by definition, indicates
that the context in which an ecological process
occurs is important;15 thus, different interactions,
and hence new hypotheses that attempt to explain
these interactions, should result in different con-
texts. That is to say, although more factors could be
included in an analysis aimed at explaining an
interaction, their conclusion could lead to even
more multiway interactions, especially in new
contexts. Thus, the problem for ecologists is that
attempts to understand a specific 16contextual inter-
action may not lead to greater general under-
standing of an ecosystem process.
Ecologists working in the field are attempting to
study real ecosystems that are potentially embed-
ded within a complex of contextual interactions
that are not addressed explicitly. Our research does
not provide a solution to this quandry. However, it
does provide evidence that contextual interactions
are measurable and important in a simplified
experimental ecosystem. We think that the next
challenge is to figure out how to apply these in-
sights to the study of real ecosystems. Is there a way
to deconstruct contextual interactions in field
studies that do not have the advantages of a repli-
cated, controlled experimental design? We need to
devise new approach to field work that will incor-
porate the analysis of contextual interactions and
thereby improve our understanding of how real
ecosystems function.
ACKNOWLEDGMENTS
The Andrew W. Mellon Foundation, the USDA
McIntire-Stennis Program, the University of Ver-
mont School of Natural Resources, and the Amer-
ican Association of University Women provided
financial support for this project. We are grateful to
F. H. Bormann, H. Vogelmann, M. Snyder, and D.
Tobi for their valuable input during the planning
stage of this project. We thank E. Leon, A. Cook, J.
Trombley, C. Borer, J. Kusmin, P. MacKay, I.
Martin, C. Anderson, D. Hitchcock, F. Boyle, D.
Kelly, D. Walker, T. Coe, H. Heitz, and T. Smith for
technical assistance. Student interns J. Arrigoni, J.
Cantara, A. Shea, J. Lee, J. Keane, S. Bless, J. Hart,
G. Coffeen, A. Burns, T. Vidal, B. Schneider, and M.
Palmer also provided assistance. Finally, we thank
A. Kulmatiski, K. A. Vogt, H. VanMiegroet, D.
DeAngelis, and three anonymous reviewers for
their thoughtful 17reviews and for greatly improving
the quality of the manuscript.
REFERENCES
Allen RB, Clinton PW, Davis MR. 1997. Cation storage and
availability along a Nothofagus forest development sequence in
New Zealand. Can J For Res 27:323–30.
Arthur MA, Hamburg SP, Siccama TG. 2001. Validating allo-
metric estimates of aboveground living biomass and nutrient
contents of a northern hardwood forest. Can J For Res 31:11–
7.
14 K. H. Beard and others
Bazzaz FA, Fajer ED. 1992. Plant life in a CO2)rich world. Sci
Am 266:68–74.
Beyers RJ, Odum HT. 1993. Ecological microcosms. New York:
Springer-Verlag, 557 p.
Blum JD, Klaue A, Nezat CA, Driscoll CT, Johnson CE, Siccama
TG, Eagar C, and others. 2002. Mycorrhizal weathering of
apatite as an important calcium source in base-poor forest
ecosystems. Nature 417:729–31.
Bormann FH, Likens GE. 1979. Patterns and process in a forest
ecosystem. New York: Springer-Verlag, 253 p.
Bormann BT, Sidle RC. 1990. Changes in productivity and dis-
tribution of nutrients in a chronosequence at Glacier Bay
National Park, Alaska. J Ecol 78:561–78.
Bormann BT, Bormann FH, Pierce RS, Hamburg SP, Wang D,
Snyder MC, Li CY, and others. 1993. Rapid N2 fixation in
pines, alder, and locust: evidence from the sandbox ecosystem
study. Ecology 74:583–98.
Bormann BT, Wang D, Bormann FH, Benoit G, April R, Snyder
MC. 1998. Rapid plant-induced weathering in an aggrading
experimental ecosystem. Biogeochemistry 43:129–55.
Brais S, Camire C, Bergeron Y, Pare D. 1995. Changes in
nutrient availability and forest floor characteristics in relation
to stand age and forest composition in the southern part of
the boreal forest of northwestern Quebec. For Ecol Manage
76:181–9.
Chadwick OA, Derry LA, Vitousek PM, Huebert BJ, Hedin LO.
1999. Changing sources of nutrients during four million years
of ecosystem development. Nature 397:491–7.
Chapin FSI, Torn MS, Tateno M. 1996. Principles of ecosystem
sustainability. Am Nat 148:1016–37.
Chapman HD, Liebig GE, Rayner DS. 1949. A lysimeter inves-
tigation of nitrogen gains and losses under various systems of
cover cropping and fertilization, and a discussion of error
sources. Hilgardia 19:57–128.
DeAngelis DL, Post WM. 1991. Positive feedback and ecosystem
organization. In: Higashi M, Burns TP, editor. Theoretical
studies of ecosystems: the network perspective. Cambridge
(UK): Cambridge University Press. p 155–78.
Ewing HA. 2002. The influence of substrate on vegetation his-
tory and ecosystem development. Ecology 83:2766–81.
Finn JT. 1982. Ecosystems succession, nutrient cycling and
output-input ratios. J Theoret Biol 99:479–89.
Finzi AC, Canham CD. 1998. Non-additive effects of litter mix-
tures on net N mineralization in a southern New England
forest. For Ecol Manage 105:129–36.
Ford MS. 1990. A 10000-yr history of natural ecosystem acidi-
fication. Ecol Monogr 60:57–89.
Gorham E, Vitousek PM, Reiners WA. 1979. The regulation of
chemical budgets over the course of terrestrial ecosystem
succession. Annu Rev Ecol Syst 10:53–84.
Heltai G, Debreczeni K, Bakonyi G, Balint A, Notas E. 1995. An
approach to N-cycling in mesocosm experiments. In: Lee JA,
McNeil S, Rorison IH, editors. Nitrogen as an ecological factor.
Oxford: Blackwell Scientific Publications. p 69–94.
Hotchkiss S, Vitousek PM, Chadwick O, Price J. 2000. Climate
cycles, geomorphological change, and the interpretation of
soil and ecosystem development. Ecosystems 3:522–33.
Jongmans AG, Van Breemen N, Lundstrom U, Van Hees PAW,
Finlay RD, Srinivasan M, Unestam T, others. 1997. Rock-
eating fungi. Nature 389:682 .
Kareiva P. 1994. Higher order interactions as a foil to reduc-
tionist ecology. Ecology 75:U1–U2.
Kelty MJ. 1992. Comparative productivity of monocultures and
mixed species stands. For Sci 40:125–41.
Landeweert R, Hoffland E, Finlay RD, Kuyper TW, Van Breeman
N. 2001. Linking plants to rocks: ectomycorrhizal fungi
mobilize nutrients from minerals. Trends Ecol Evol 16:248–
54.
Likens GE, Bormann FH. 1970. Chemical analyses of plant tis-
sues from the Hubbard Brook Ecosystem in New Hampshire.
Yale Univ School For Bull 79:1–25.
Likens GE, Bormann FH. 1995. Biogeochemistry of a forested
ecosystem. New York: Springer-Verlag, 146 p.
Loreau M. 1998. Ecosystem development explained by compe-
tition within and between material cycles. Proc R Soc London
[B] 265:33–8.
McIntosh JL. 1969. Bray and Morgan soil test extractions mod-
ified for testing acid soils from different parent materials.
Agron J 61:259–65.
Mooney HA, Drake BG, Luxmore RJ, Oechel WC, Pitelka LF.
1991. Predicting ecosystem responses to elevated CO2 con-
centrations. BioScience 41:96–104.
[NADP/NTN]. National Atmospheric Deposition Program (NRSP-
3)/National Trends Network. 2002. 18Champaign (IL): NADP
Program Office.
Odum EP. 1963. Ecology. New York: Holt, Rinehart & Winston,
152.
Odum EP. 1969. The strategy of ecosystem development. Sci-
ence 164:262–70.
Schwartzman DW, Volk T. 1989. Biotic enhancement of
weathering and the habitability of earth. Nature 340:457–60.
Steel RGD, Torrie JH, Dickey DA. 1997. Principles and proce-
dures of statistics: a biometrical approach. New York:
McGraw-Hill, 666 p.
Tilman D. 1988. Plant strategies and the dynamics and structure
of plant communities. Princeton (NJ): Princeton University
Press, 360 p.
Tilman D. 1990. Constraints and tradeoffs: toward a predictive
theory of competition and succession. Oikos 58:3–15.
Tilman D, Knops J, Wedin D, Reich P, Ritchie M, Siemann E.
1997. The influence of functional diversity and composition
on ecosystem processes. Science 277:1300–2.
Van Cleve K, Viereck LA. 1981. Forest succession in relation to
nutrient cycling in the boreal forest of Alaska. In: West DC,
Shugart HH, Botkin BB, editors. Forest succession: concepts
and applications. New York: Springer-Verlag. p 184–211.
Van Cleve K, Oliver LK, Schlentner R, Viereck LA, Dryness CT.
1983. Productivity and nutrient cycling in taiga forest eco-
systems. Can J For Res 13:747–66.
Vitousek PM. 1977. The regulation of element concentration in
mountain streams in the northeastern United States. Ecol
Monogr 47:65–87.
Vitousek PM, Reiners WA. 1975. Ecosystem succession and
nutrient retention: a hypothesis. BioScience 25:376–81.
Wootton JT. 1994. Putting the pieces together: testing the
interdependence of interactions among organisms. Ecology
75:1544–51.
Zirlewagen D, von Wilpert K. 2001. Modeling water and ion
fluxes in a highly structured, mixed-species stand. For Ecol
Manage 143:27–37.
Ecosystem Controls on Nutrient Export 15

Author Query Form
Journal : ECOSYSTEMS
Article No. : 0041y
Disk Usage : h Yes h No
h Incompatible file format h Virus infected
h Discrepancies between electronic file and hard copy
h Other: . . . . . . . . . . . . . . . . . . . . . . . . . . . . . . . . . . . . . . . . . . . . . . . . . . . . . . . . . . . . . . . .
h Manuscript keyed in h Files partly used (parts keyboarded.)
Author Queries
Sr. No. Query Author’s Remarks
1 spell out NASA=AMES?
2 as meant?
3 ok as alterted?
4 spell out USDA?
5 no HCDC 2002 in REFS-� pls add thereor spell out explain there
6 spell out CEC
7 as meant?
8 provide name address of maker
9 as meant?
10 as meant?
11 as meant?
12 as meant?
13 dominant what? factor? species?
14 Para ok as attered sense unclear
15 how does the hypothesis "result" in a diffcontext garbled sense
16 sense of "new contexts" unclear "new inwhat way?
17 no # in Vanmiegroet?
18 provide title of publication
16 K. H. Beard and others

19 5yrs? or 4 yrs?
20 Define CEC in footnote
21 spell out BIK in footnote or table body
22 Define NA in footnote not avaiable?
Ecosystem Controls on Nutrient Export 17