quantifying feeding ecology of macroinvertebrates …
TRANSCRIPT
QUANTIFYING FEEDING ECOLOGY OF MACROINVERTEBRATES IN BOULDER CREEK, COLORADO, USA: HOW DOES ALTITUDE
INFLUENCE FOOD AVAILABILITY? By:
Andrew W. Witt
Dept. of Ecology and Evolutionary Biology, University of Colorado-Boulder
Photo: Andrew Witt
Defense Date: March 21, 2013
Thesis Advisor:
Dr. Suzanne Nelson (IPHY)
Defense Committee:
Dr. Barbara Demmig-Adams (EBIO)
Dr. Brett Melbourne (EBIO)
Dr. Suzanne Nelson (IPHY)
2
Abstract
Not only is water critical for human needs, but also for providing habitat for
aquatic organisms. The Clean Water Act (CWA) was passed in 1972 and requires
protection of chemical, physical, and biological features of our nation’s waters to protect
wildlife as well as maintain quality for human consumption. However, there is a lack of
research to completely understand food availability for fish. Using a quantifiable food
analysis method developed in this paper caloric content of macroinvertebrates was
analyzed at two different altitude sites on Boulder Creek, Colorado, USA. By drying and
weighing a representative sample of invertebrates identified at each site, caloric values
were calculated for food availability in each stream section. Habitat type (shallow, steep
river sections known as riffles vs. deep, flat river sections known as pools), and depth
was compared with respect to caloric content. It was hypothesized that flow regularity
below a reservoir would result in greater macroinvertebrate calories, and that caloric
content would be greater in riffle habitats due to favorable habitat conditions. Results
supported this hypothesis in that the greatest caloric content was found at low altitude
sites, in riffle habitats, and at shallow depths. These results may be the product of
passive macroinvertebrate movement as downstream drift, or maybe due to flow
regulation below a reservoir. This work offers a novel method for quantifying stream
energetics and could potentially benefit multiple stakeholders interested in stream
research and water management.
3
Introduction
Not only is water critical for human needs, but also for providing habitat for
aquatic organisms. The Clean Water Act (CWA) was passed in 1972 and requires
protection of chemical, physical and biological features of our nation’s waters to protect
wildlife as well as maintain quality for human consumption (EPA, 2012). To comply with
the CWA, stream quality is chemically, physically, and biologically measured. Stream
quality, the quality of habitat for fish, macroinvertebrates, and other inhabitants living
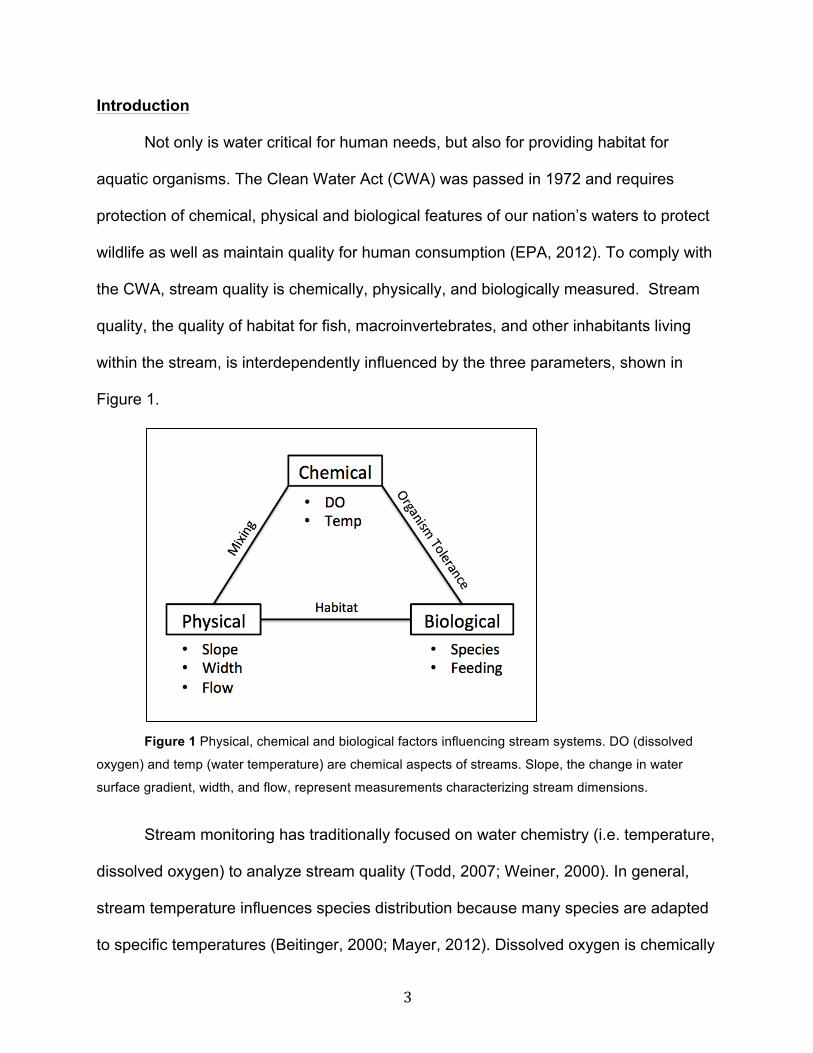
within the stream, is interdependently influenced by the three parameters, shown in
Figure 1.
Figure 1 Physical, chemical and biological factors influencing stream systems. DO (dissolved
oxygen) and temp (water temperature) are chemical aspects of streams. Slope, the change in water
surface gradient, width, and flow, represent measurements characterizing stream dimensions.
Stream monitoring has traditionally focused on water chemistry (i.e. temperature,
dissolved oxygen) to analyze stream quality (Todd, 2007; Weiner, 2000). In general,
stream temperature influences species distribution because many species are adapted
to specific temperatures (Beitinger, 2000; Mayer, 2012). Dissolved oxygen is chemically
4
influenced by temperature. As temperature increases, dissolved oxygen levels
decrease. Decreases in dissolved oxygen levels at higher temperatures can inhibit a
stream organism’s ability to breath, and cause physiological stress (Weiner, 2000;
Mayer, 2012).
Different physical characteristics, such as stream flow, can influence a stream’s
chemical characteristics like temperature and dissolved oxygen (Weiner, 2000).
Streams can be classified along a spectrum from laminar flow to turbulent flow.
However, most stream flow can be classified as turbulent flow, where rocks and stones
in a stream create disturbances aiding in homogenizing temperatures and dissolved
oxygen levels within a stream channel (Anderson, 2010).
Physical stream characteristics, like channel width, the distance from bank to
bank, and depth, the distance between the water surface and stream bottom, can also
affect aquatic organisms (Lewis, 2012). Stream habitats can be split into faster moving,
shallow “riffles” and slower moving, deeper “pools” (Logan, 1983; Lewis, 2012). Riffles
are characterized as shallow stream sections, with greater surface slopes and narrower
channels. Pools have reduced surface slopes and wider channels (Lewis, 2012). More
macroinvertebrates may reside in riffle habitat than in pools, as the majority of
macroinvertebrates species are specialized for riffle habitats (Briggs, 1950; Brown,
1991).
Biological stream research has focused traditionally on how fish respond to
changes in water quality (USFWS, 2013). Fish are not only influenced by their physical
environment, but also by their interactions within the biological community of streams,
i.e. feeding and predation. However, there is a lack of research to fully understand food
5
availability for fish. This begs the question: how do we actually assess food availability
in a stream system?
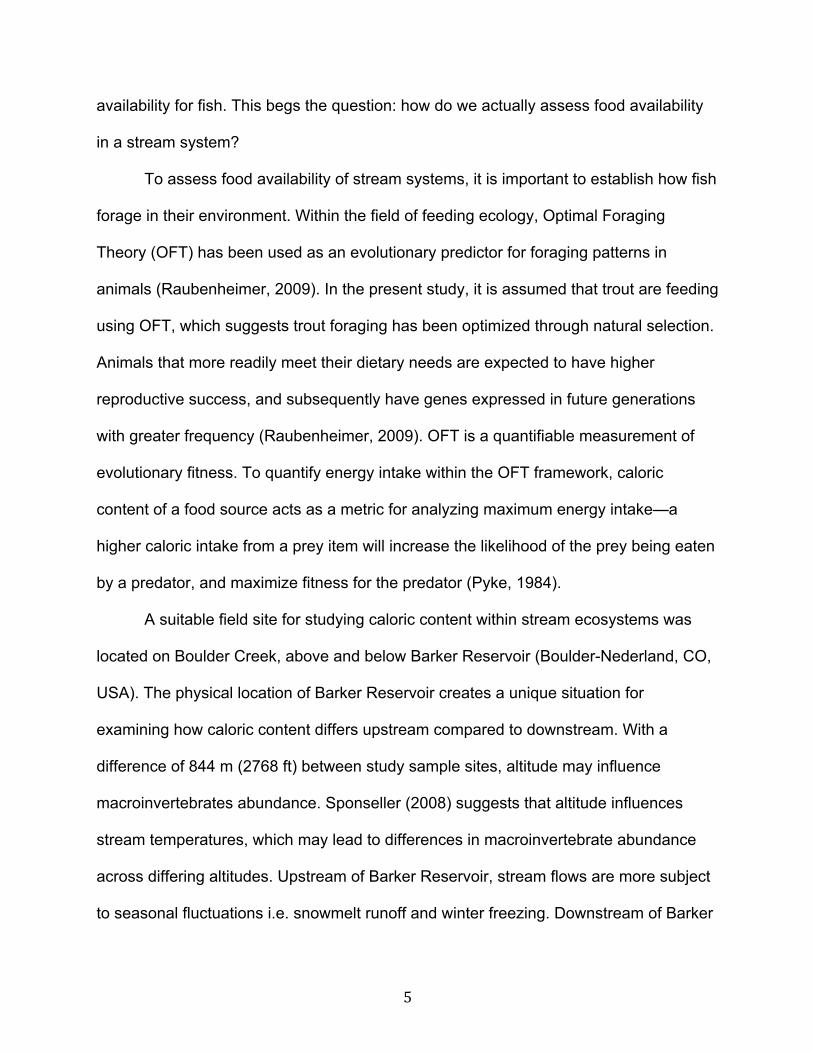
To assess food availability of stream systems, it is important to establish how fish
forage in their environment. Within the field of feeding ecology, Optimal Foraging
Theory (OFT) has been used as an evolutionary predictor for foraging patterns in
animals (Raubenheimer, 2009). In the present study, it is assumed that trout are feeding
using OFT, which suggests trout foraging has been optimized through natural selection.
Animals that more readily meet their dietary needs are expected to have higher
reproductive success, and subsequently have genes expressed in future generations
with greater frequency (Raubenheimer, 2009). OFT is a quantifiable measurement of
evolutionary fitness. To quantify energy intake within the OFT framework, caloric
content of a food source acts as a metric for analyzing maximum energy intake—a
higher caloric intake from a prey item will increase the likelihood of the prey being eaten
by a predator, and maximize fitness for the predator (Pyke, 1984).
A suitable field site for studying caloric content within stream ecosystems was
located on Boulder Creek, above and below Barker Reservoir (Boulder-Nederland, CO,
USA). The physical location of Barker Reservoir creates a unique situation for
examining how caloric content differs upstream compared to downstream. With a
difference of 844 m (2768 ft) between study sample sites, altitude may influence
macroinvertebrates abundance. Sponseller (2008) suggests that altitude influences
stream temperatures, which may lead to differences in macroinvertebrate abundance
across differing altitudes. Upstream of Barker Reservoir, stream flows are more subject
to seasonal fluctuations i.e. snowmelt runoff and winter freezing. Downstream of Barker
6
Reservoir, flows are regulated by humans, and though seasonal fluctuations may be
similar to above the dam, flows are less variable (Acreman, 2009; Magilligan, 2005). I
predicted that, if altitude were related to total caloric value from macroinvertebrate prey,
the lower altitudes (below Barker Reservoir where flows are more regulated) should
exhibit higher densities of macroinvertebrate populations (and greater available calories
to fish predators), as the reservoir provides a more stable environment for stream
residents. It was assumed that flow patterns are directly related to altitude.
Within stream environments, the physical differences between riffles and pools
may cause macroinvertebrates to prefer one type or the other. I predicted that, if
macroinvertebrate presence were related to habitat type, then riffle environments would
contain a greater number of macroinvertebrates (and total caloric content) than pool
environments due to more stream rocks that offer greater protection against fish
predators in riffles. It is assumed within this study that habitat types with greater
densities of macroinvertebrates represent regions of greater food availability for fish.
Using a quantifiable food analysis method developed in this paper, aquatic
ecologists should be able to directly compare caloric content of macroinvertebrates.
This ability may have significant opportunities for directly addressing how much energy
(as food) exists within a stream system, stream restoration projects, and improving fish
stocking projects. Management practices could be updated to apply this quantitative
approach to better describe and understand streams, and stream habitats.
7
Background
Study Species: Brown Trout (Salmo trutta) & Rainbow Trout (Onchorynchus
mykiss)
Both brown trout (Salmo trutta) and rainbow trout (Onchorynchus mykiss) are
aggressive foragers ranking in the top 100 as the world’s most invasive species
outcompeting native fish (Global, 2012). In Colorado, native cutthroat trout are often
jeopardized by the presence of brown and rainbow trout (Global, 2012).
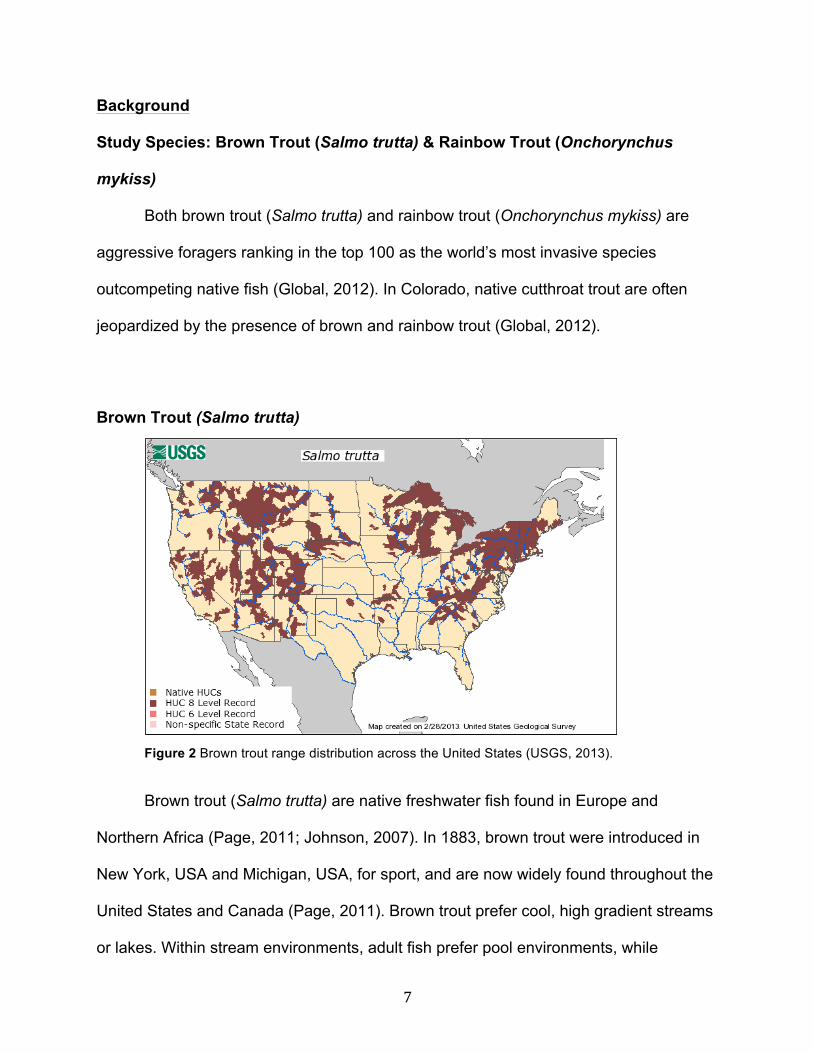
Brown Trout (Salmo trutta)
Figure 2 Brown trout range distribution across the United States (USGS, 2013).
Brown trout (Salmo trutta) are native freshwater fish found in Europe and
Northern Africa (Page, 2011; Johnson, 2007). In 1883, brown trout were introduced in
New York, USA and Michigan, USA, for sport, and are now widely found throughout the
United States and Canada (Page, 2011). Brown trout prefer cool, high gradient streams
or lakes. Within stream environments, adult fish prefer pool environments, while
8
younger fish occupy riffles and pools (Page, 2011; Johnson, 2007). Brown trout are
found within the study site in Boulder Creek, CO, USA, and comprise 96% of fish within
the watershed (Zimmerman, 2009). Brown trout from birth to eight years old may spend
most of their time foraging on macroinvertebrates, especially in spring and fall seasons.
After eight years of age, increased energetic requirements lead to consumption of other
fish as prey (Bachman, 1984).
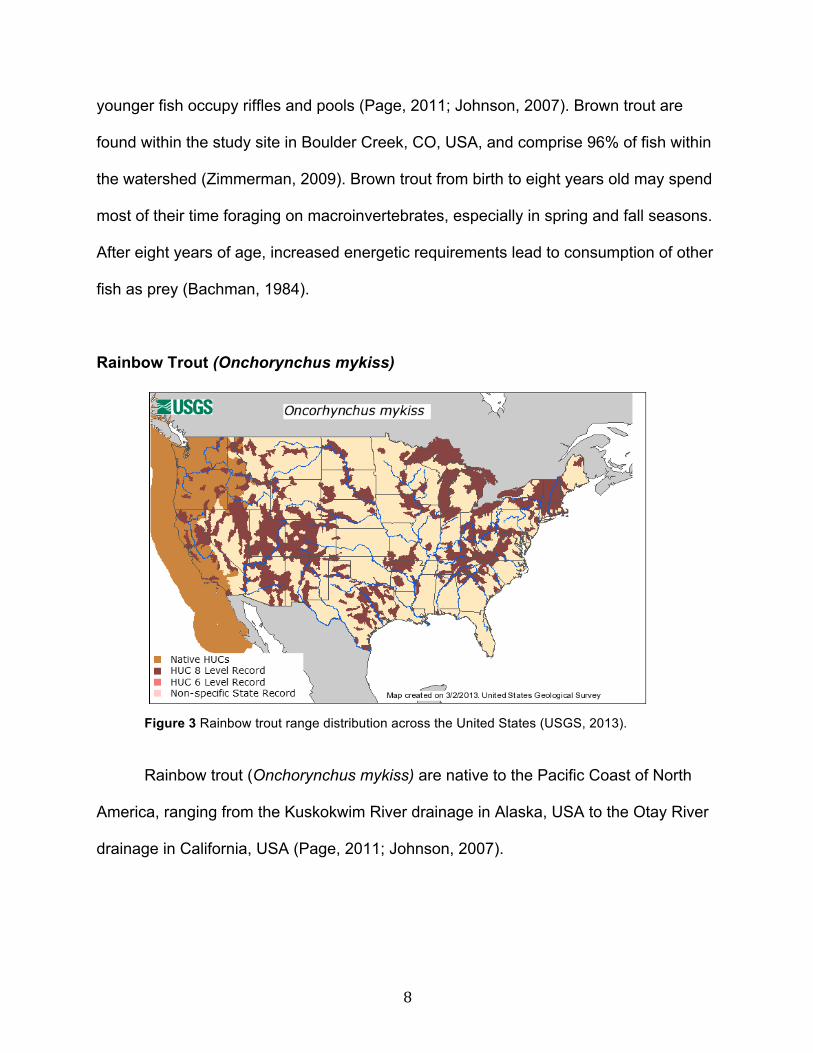
Rainbow Trout (Onchorynchus mykiss)
Figure 3 Rainbow trout range distribution across the United States (USGS, 2013).
Rainbow trout (Onchorynchus mykiss) are native to the Pacific Coast of North
America, ranging from the Kuskokwim River drainage in Alaska, USA to the Otay River
drainage in California, USA (Page, 2011; Johnson, 2007).
9
Like brown trout, rainbow trout have been widely introduced across North America,
including the study site in Boulder Creek, CO, USA. Rainbow trout comprise 4% of fish
within the study watershed (Zimmerman, 2009).
Study Species: Macroinvertebrates
Habitat
Macroinvertebrates are insects commonly found within still or running waters
(Izaak, 2006). They live under and between rocks and vegetation in their immature
larval life stage, and grow into flying adults that emerge from the water (Izaak, 2006;
Riverwatch 2010). Aquatic macroinvertebrates in streams are found in two types of
habitats, fast moving riffle sections, and slow moving pools sections (Logan, 1983). Pool
residents may be less vulnerable to flooding, but both pool and riffle residents are
exposed to similar temperatures. Several studies suggest that individuals tend to reside
in riffle habitat rather than in pools (Briggs, 1950; Brown, 1991). The presence of
invertebrates in pools is often attributed to downstream drift (Brown 1991). Downstream
drift describes a macroinvertebrate’s nocturnal relocation from more populated areas to
less populated areas (Thornton, 2007).
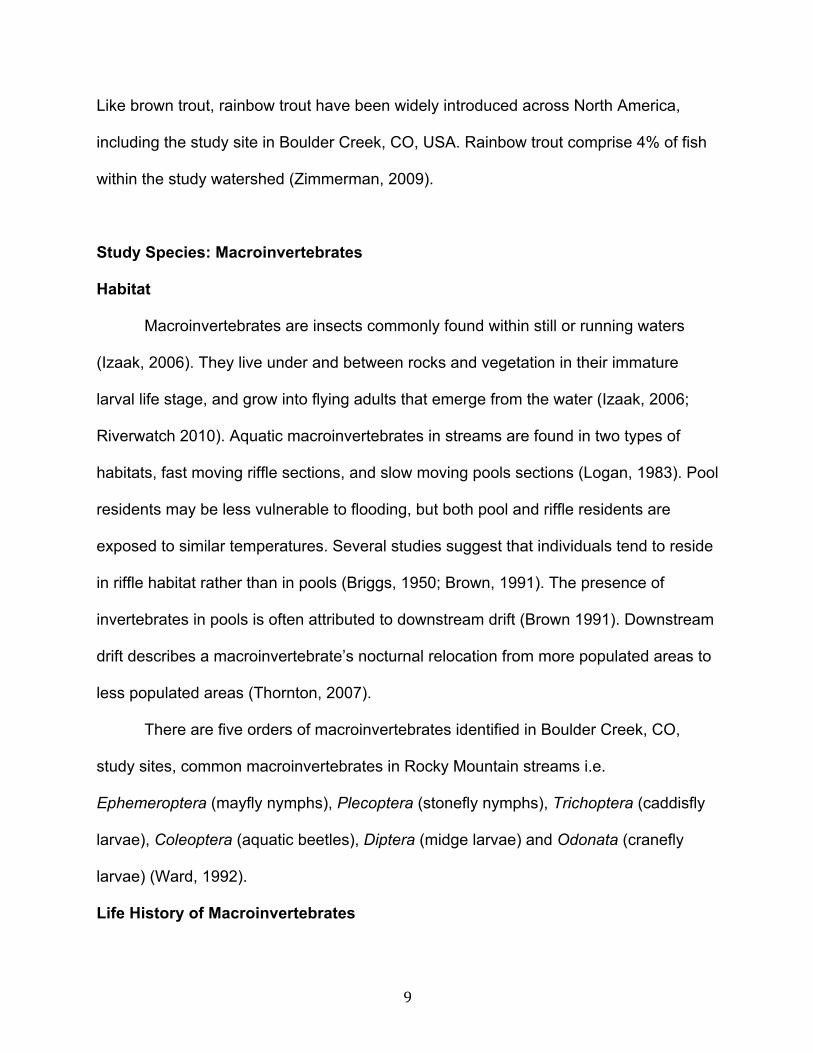
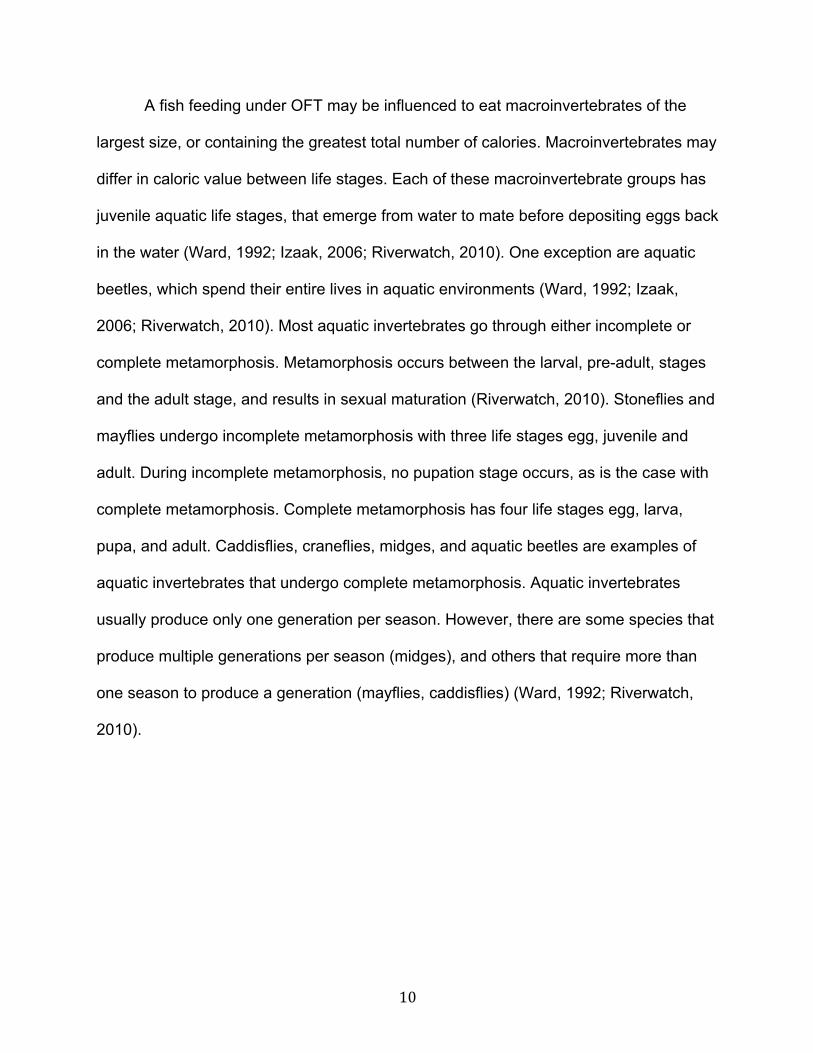
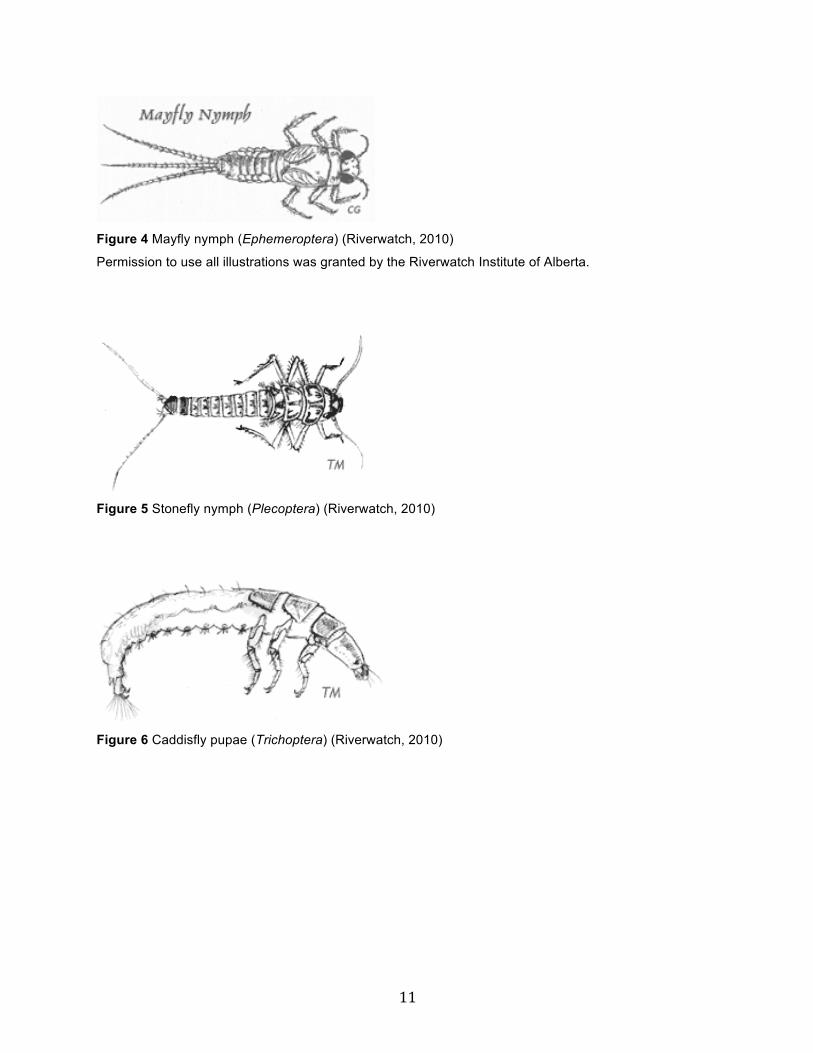
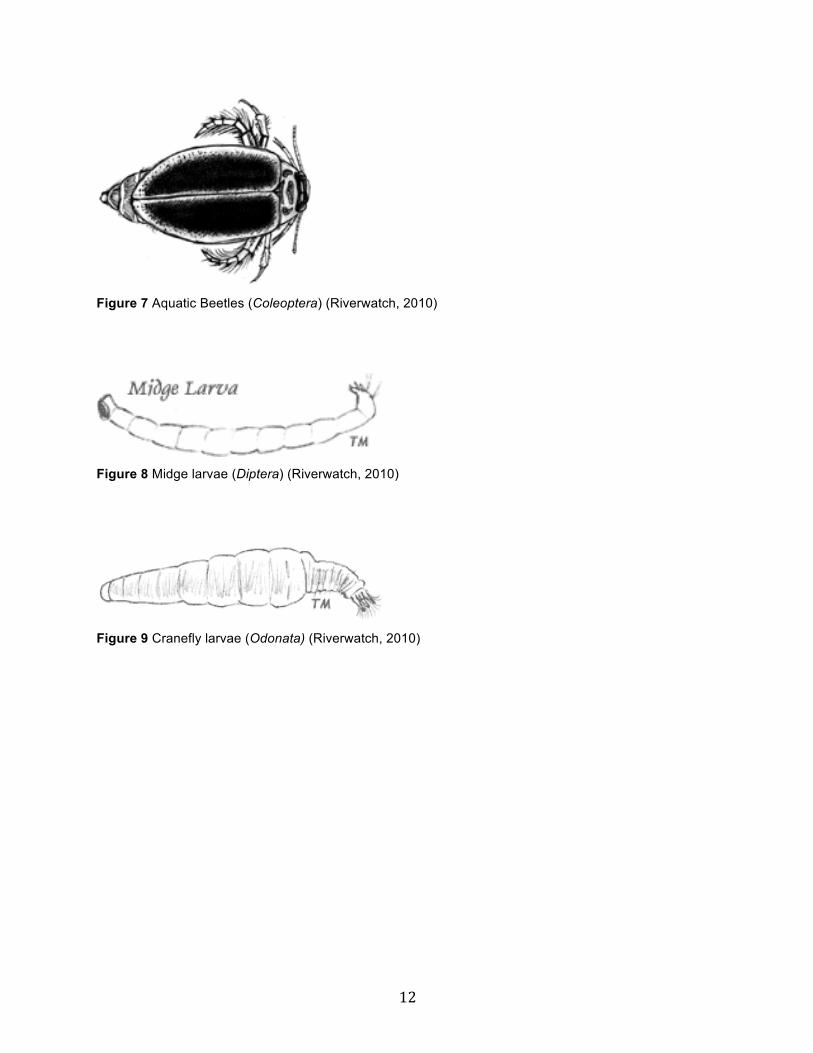
There are five orders of macroinvertebrates identified in Boulder Creek, CO,
study sites, common macroinvertebrates in Rocky Mountain streams i.e.
Ephemeroptera (mayfly nymphs), Plecoptera (stonefly nymphs), Trichoptera (caddisfly
larvae), Coleoptera (aquatic beetles), Diptera (midge larvae) and Odonata (cranefly
larvae) (Ward, 1992).
Life History of Macroinvertebrates
10
A fish feeding under OFT may be influenced to eat macroinvertebrates of the
largest size, or containing the greatest total number of calories. Macroinvertebrates may
differ in caloric value between life stages. Each of these macroinvertebrate groups has
juvenile aquatic life stages, that emerge from water to mate before depositing eggs back
in the water (Ward, 1992; Izaak, 2006; Riverwatch, 2010). One exception are aquatic
beetles, which spend their entire lives in aquatic environments (Ward, 1992; Izaak,
2006; Riverwatch, 2010). Most aquatic invertebrates go through either incomplete or
complete metamorphosis. Metamorphosis occurs between the larval, pre-adult, stages
and the adult stage, and results in sexual maturation (Riverwatch, 2010). Stoneflies and
mayflies undergo incomplete metamorphosis with three life stages egg, juvenile and
adult. During incomplete metamorphosis, no pupation stage occurs, as is the case with
complete metamorphosis. Complete metamorphosis has four life stages egg, larva,
pupa, and adult. Caddisflies, craneflies, midges, and aquatic beetles are examples of
aquatic invertebrates that undergo complete metamorphosis. Aquatic invertebrates
usually produce only one generation per season. However, there are some species that
produce multiple generations per season (midges), and others that require more than
one season to produce a generation (mayflies, caddisflies) (Ward, 1992; Riverwatch,
2010).
11
Figure 4 Mayfly nymph (Ephemeroptera) (Riverwatch, 2010)
Permission to use all illustrations was granted by the Riverwatch Institute of Alberta.
Figure 5 Stonefly nymph (Plecoptera) (Riverwatch, 2010)
Figure 6 Caddisfly pupae (Trichoptera) (Riverwatch, 2010)
12
Figure 7 Aquatic Beetles (Coleoptera) (Riverwatch, 2010)
Figure 8 Midge larvae (Diptera) (Riverwatch, 2010)
Figure 9 Cranefly larvae (Odonata) (Riverwatch, 2010)
13
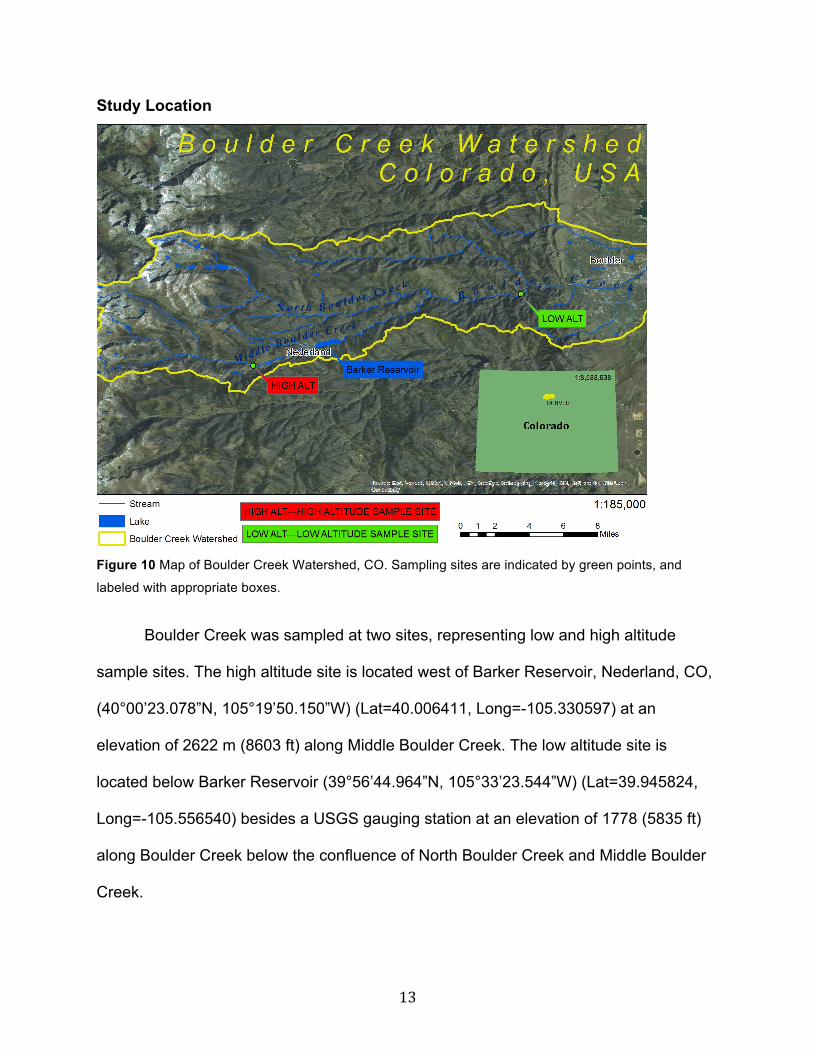
Study Location
Figure 10 Map of Boulder Creek Watershed, CO. Sampling sites are indicated by green points, and
labeled with appropriate boxes.
Boulder Creek was sampled at two sites, representing low and high altitude
sample sites. The high altitude site is located west of Barker Reservoir, Nederland, CO,
(40°00’23.078”N, 105°19’50.150”W) (Lat=40.006411, Long=-105.330597) at an
elevation of 2622 m (8603 ft) along Middle Boulder Creek. The low altitude site is
located below Barker Reservoir (39°56’44.964”N, 105°33’23.544”W) (Lat=39.945824,
Long=-105.556540) besides a USGS gauging station at an elevation of 1778 (5835 ft)
along Boulder Creek below the confluence of North Boulder Creek and Middle Boulder
Creek.
14
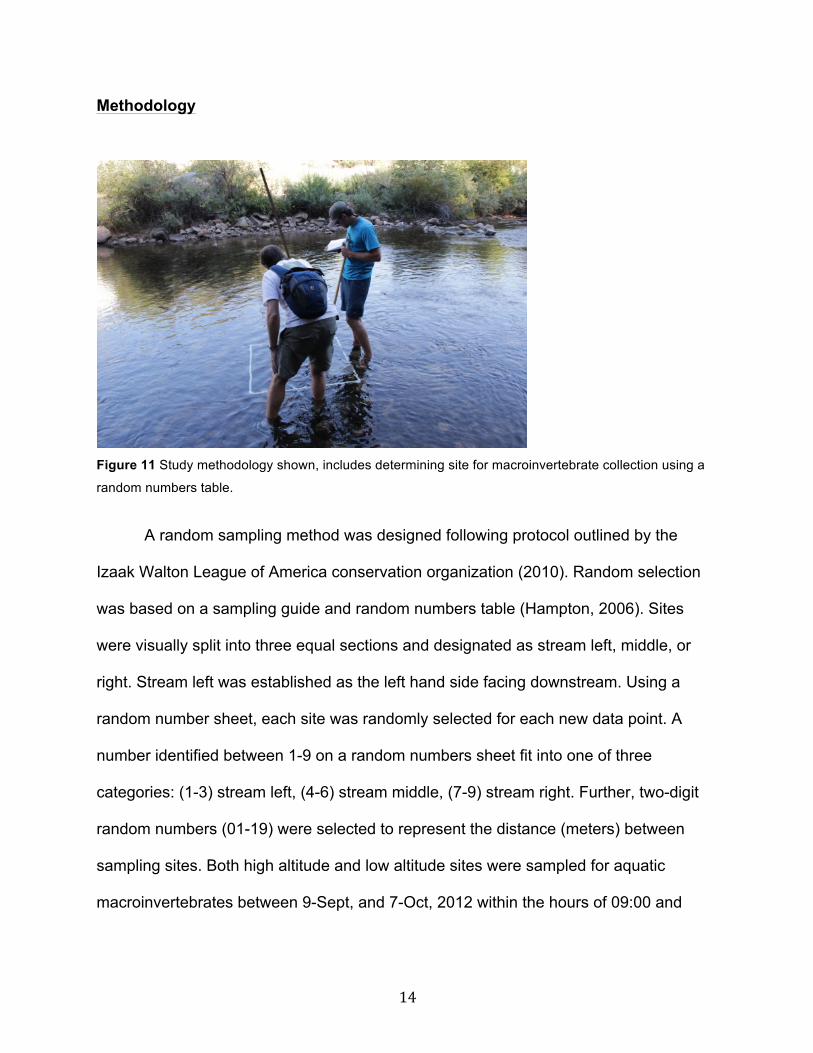
Methodology
Figure 11 Study methodology shown, includes determining site for macroinvertebrate collection using a
random numbers table.
A random sampling method was designed following protocol outlined by the
Izaak Walton League of America conservation organization (2010). Random selection
was based on a sampling guide and random numbers table (Hampton, 2006). Sites
were visually split into three equal sections and designated as stream left, middle, or
right. Stream left was established as the left hand side facing downstream. Using a
random number sheet, each site was randomly selected for each new data point. A
number identified between 1-9 on a random numbers sheet fit into one of three
categories: (1-3) stream left, (4-6) stream middle, (7-9) stream right. Further, two-digit
random numbers (01-19) were selected to represent the distance (meters) between
sampling sites. Both high altitude and low altitude sites were sampled for aquatic
macroinvertebrates between 9-Sept, and 7-Oct, 2012 within the hours of 09:00 and
15
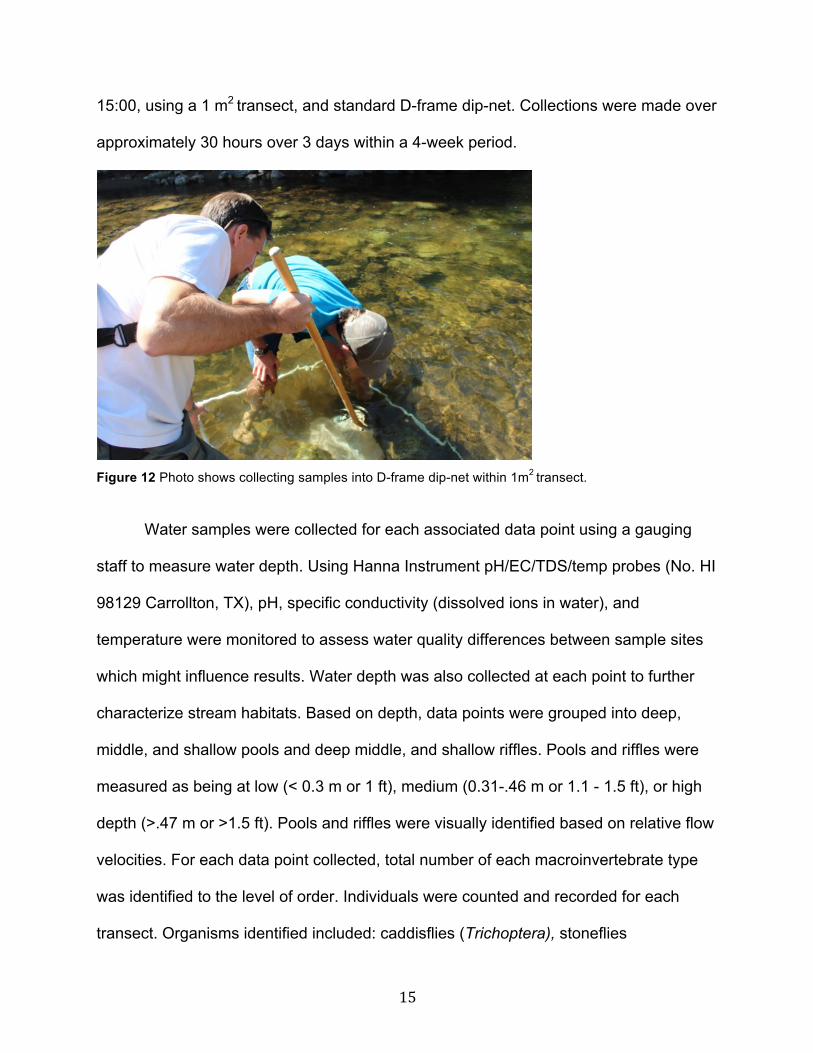
15:00, using a 1 m2 transect, and standard D-frame dip-net. Collections were made over
approximately 30 hours over 3 days within a 4-week period.
Figure 12 Photo shows collecting samples into D-frame dip-net within 1m2 transect.
Water samples were collected for each associated data point using a gauging
staff to measure water depth. Using Hanna Instrument pH/EC/TDS/temp probes (No. HI
98129 Carrollton, TX), pH, specific conductivity (dissolved ions in water), and
temperature were monitored to assess water quality differences between sample sites
which might influence results. Water depth was also collected at each point to further
characterize stream habitats. Based on depth, data points were grouped into deep,
middle, and shallow pools and deep middle, and shallow riffles. Pools and riffles were
measured as being at low (< 0.3 m or 1 ft), medium (0.31-.46 m or 1.1 - 1.5 ft), or high
depth (>.47 m or >1.5 ft). Pools and riffles were visually identified based on relative flow
velocities. For each data point collected, total number of each macroinvertebrate type
was identified to the level of order. Individuals were counted and recorded for each
transect. Organisms identified included: caddisflies (Trichoptera), stoneflies
16
(Plecoptera), mayflies (Ephemeroptera), midges (Diptera), aquatic beetles (Coleoptera),
and craneflies (Tipulidae). Rocks within a 1 m2 transect were upturned, inspected, and
hand-brushed to dislodge and collect invertebrates. Hand-brushing involved dislodging
a rock from the bottom of the stream and scrubbing the rock’s surface with a plastic
bristled brush to detach any macroinvertebrates on the rock. This process was done
underwater, utilizing the stream’s current to transport macroinvertebrates into the
collection net. Rocks more than halfway outside of a transect were not utilized, nor were
rocks too firmly rooted to the streambed to be physically removed.
Energy Calculations of Macroinvertebrates
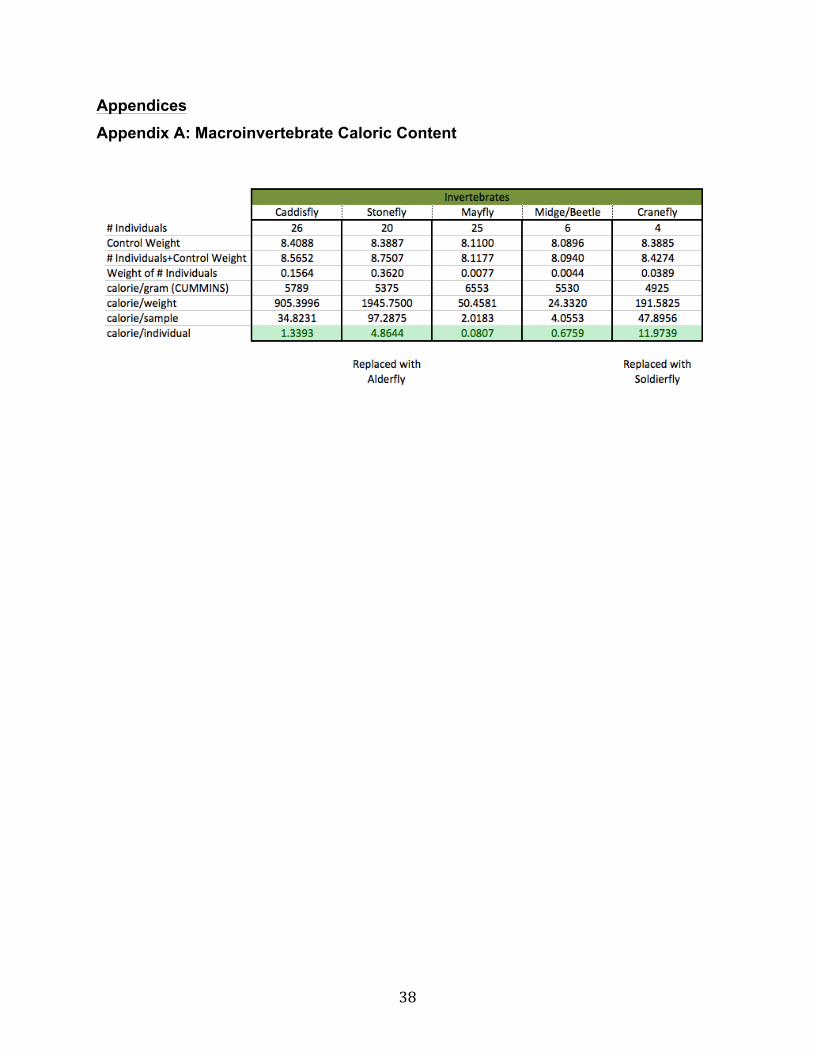
Energy calculations were based on Cummins (1971), Caloric Equivalents for
Investigations in Ecological Energetics, which describes calories/gram for a wide array
of invertebrates and is considered a foundational paper in quantifying feeding ecology in
stream systems. By drying a representative sample of each invertebrate order,
Cummins’ calculation of calories/gram of individual was converted to calories per
individual. Representative samples were based on a known number of
macroinvertebrates. The representative samples included individuals dried at 105°C for
24 hours, to obtain dry weight, following the Cummins protocol. By combining dry weight
of the representative sample and number of individuals represented within the sample,
conversion from calories/gram to calories/individual was obtained. For example,
Cummins calculated 5789 calories per one gram of caddisflies, but does not address
how many caddisflies are represented in that one gram sample. A known number of
caddisflies was collected and dried. After drying and weighing a known number of
17
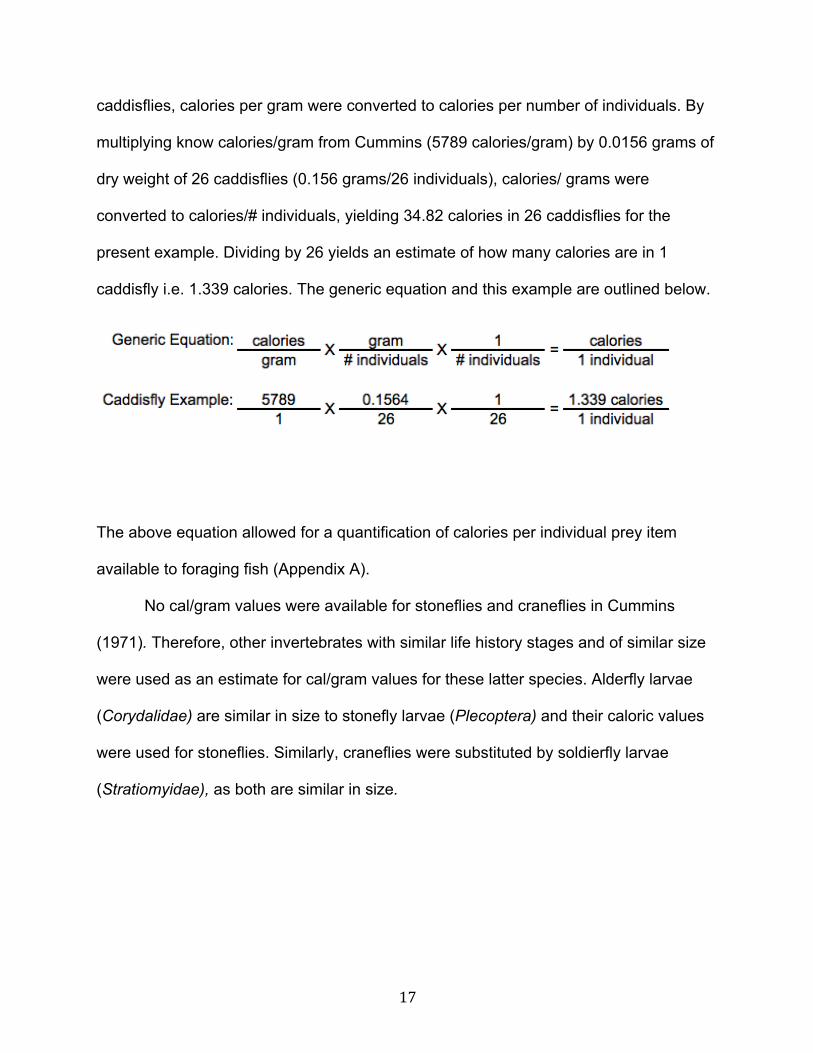
caddisflies, calories per gram were converted to calories per number of individuals. By
multiplying know calories/gram from Cummins (5789 calories/gram) by 0.0156 grams of
dry weight of 26 caddisflies (0.156 grams/26 individuals), calories/ grams were
converted to calories/# individuals, yielding 34.82 calories in 26 caddisflies for the
present example. Dividing by 26 yields an estimate of how many calories are in 1
caddisfly i.e. 1.339 calories. The generic equation and this example are outlined below.
The above equation allowed for a quantification of calories per individual prey item
available to foraging fish (Appendix A).
No cal/gram values were available for stoneflies and craneflies in Cummins
(1971). Therefore, other invertebrates with similar life history stages and of similar size
were used as an estimate for cal/gram values for these latter species. Alderfly larvae
(Corydalidae) are similar in size to stonefly larvae (Plecoptera) and their caloric values
were used for stoneflies. Similarly, craneflies were substituted by soldierfly larvae
(Stratiomyidae), as both are similar in size.

18
Results
Using the statistical program R (Lucent Technologies), data were analyzed via a
three-way pure model I, factorially designed for the response variable of caloric content
(continuous), and the predictor variables of elevation, habitat, and depth (categorical).
The design is factorial because the predictor variables are not nested; depth levels are
constant across other factors (habitat and elevation). Analysis of variance (ANOVA) was
used to compare group’s means to test if group means significantly varied from one
another (Fig. 13, 14, 15), and to examine any interactions between groups (Fig.17, 18).
Finally, water quality parameters, pH, specific conductivity, and temperature, were
compared using independent t-tests (Fig. 19).
19
Elevation
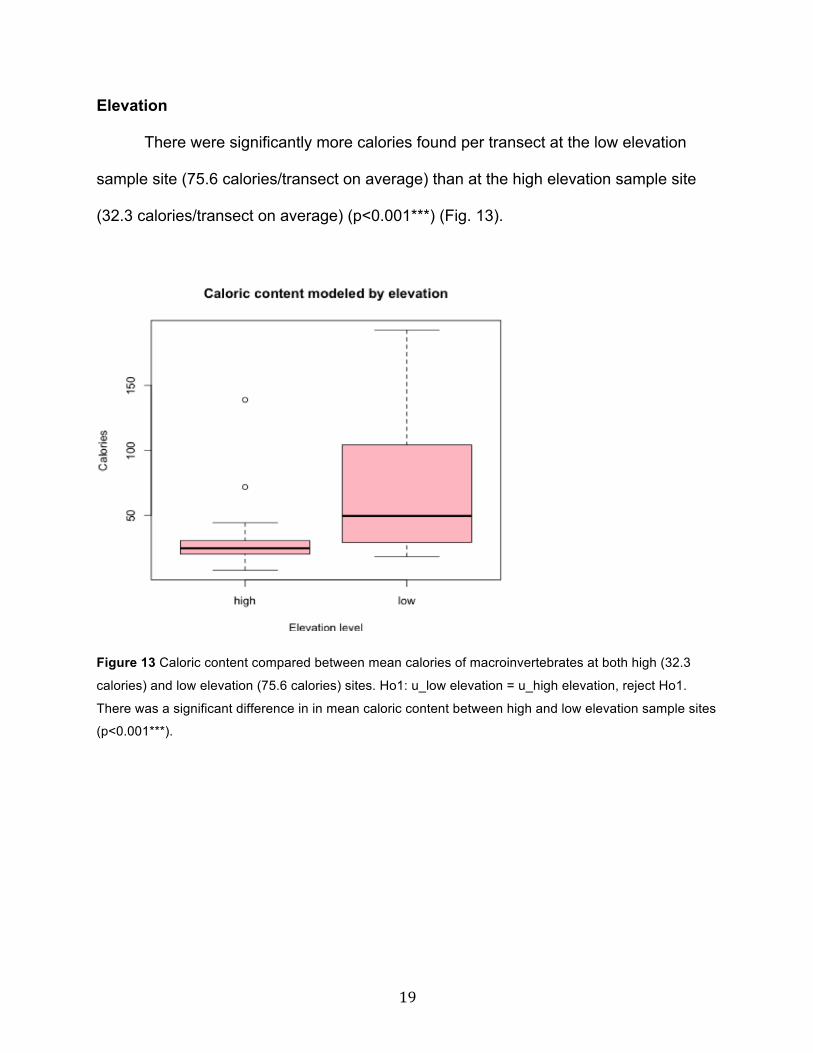
There were significantly more calories found per transect at the low elevation
sample site (75.6 calories/transect on average) than at the high elevation sample site
(32.3 calories/transect on average) (p<0.001***) (Fig. 13).
Figure 13 Caloric content compared between mean calories of macroinvertebrates at both high (32.3
calories) and low elevation (75.6 calories) sites. Ho1: u_low elevation = u_high elevation, reject Ho1.
There was a significant difference in in mean caloric content between high and low elevation sample sites
(p<0.001***).
20
Habitat
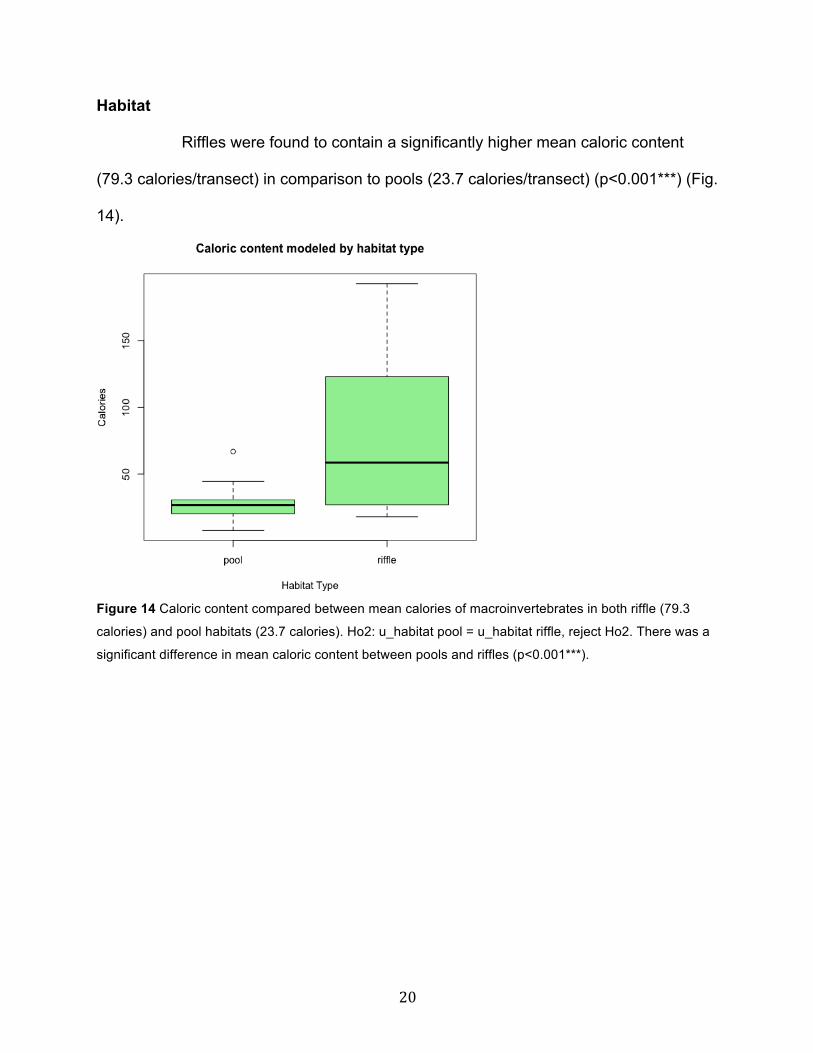
Riffles were found to contain a significantly higher mean caloric content
(79.3 calories/transect) in comparison to pools (23.7 calories/transect) (p<0.001***) (Fig.
14).
Figure 14 Caloric content compared between mean calories of macroinvertebrates in both riffle (79.3
calories) and pool habitats (23.7 calories). Ho2: u_habitat pool = u_habitat riffle, reject Ho2. There was a
significant difference in mean caloric content between pools and riffles (p<0.001***).
21
Depth
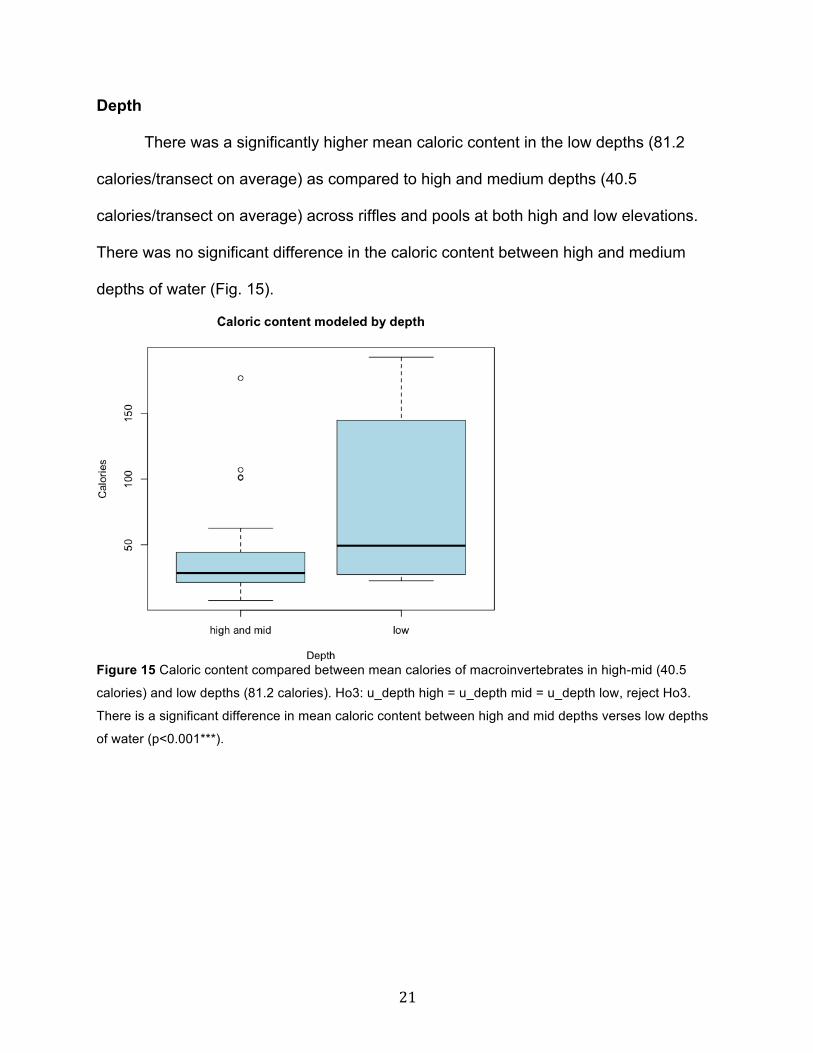
There was a significantly higher mean caloric content in the low depths (81.2
calories/transect on average) as compared to high and medium depths (40.5
calories/transect on average) across riffles and pools at both high and low elevations.
There was no significant difference in the caloric content between high and medium
depths of water (Fig. 15).
Figure 15 Caloric content compared between mean calories of macroinvertebrates in high-mid (40.5
calories) and low depths (81.2 calories). Ho3: u_depth high = u_depth mid = u_depth low, reject Ho3.
There is a significant difference in mean caloric content between high and mid depths verses low depths
of water (p<0.001***).
22
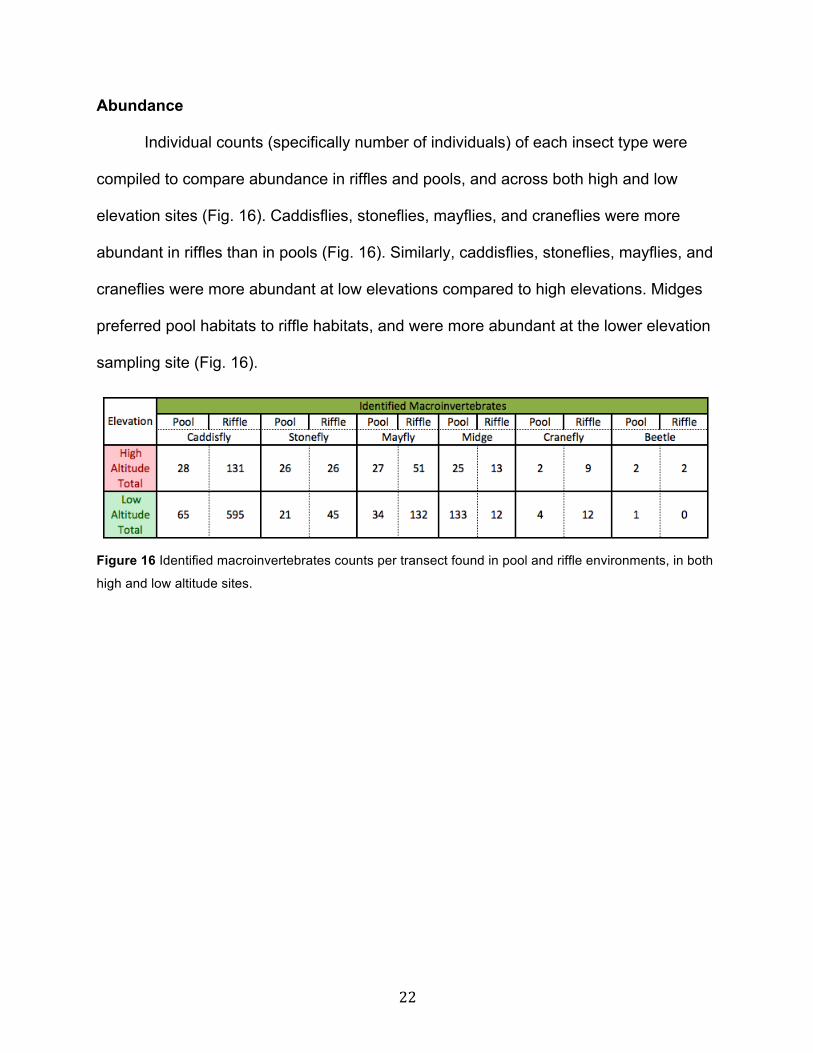
Abundance
Individual counts (specifically number of individuals) of each insect type were
compiled to compare abundance in riffles and pools, and across both high and low
elevation sites (Fig. 16). Caddisflies, stoneflies, mayflies, and craneflies were more
abundant in riffles than in pools (Fig. 16). Similarly, caddisflies, stoneflies, mayflies, and
craneflies were more abundant at low elevations compared to high elevations. Midges
preferred pool habitats to riffle habitats, and were more abundant at the lower elevation
sampling site (Fig. 16).
Figure 16 Identified macroinvertebrates counts per transect found in pool and riffle environments, in both
high and low altitude sites.
23
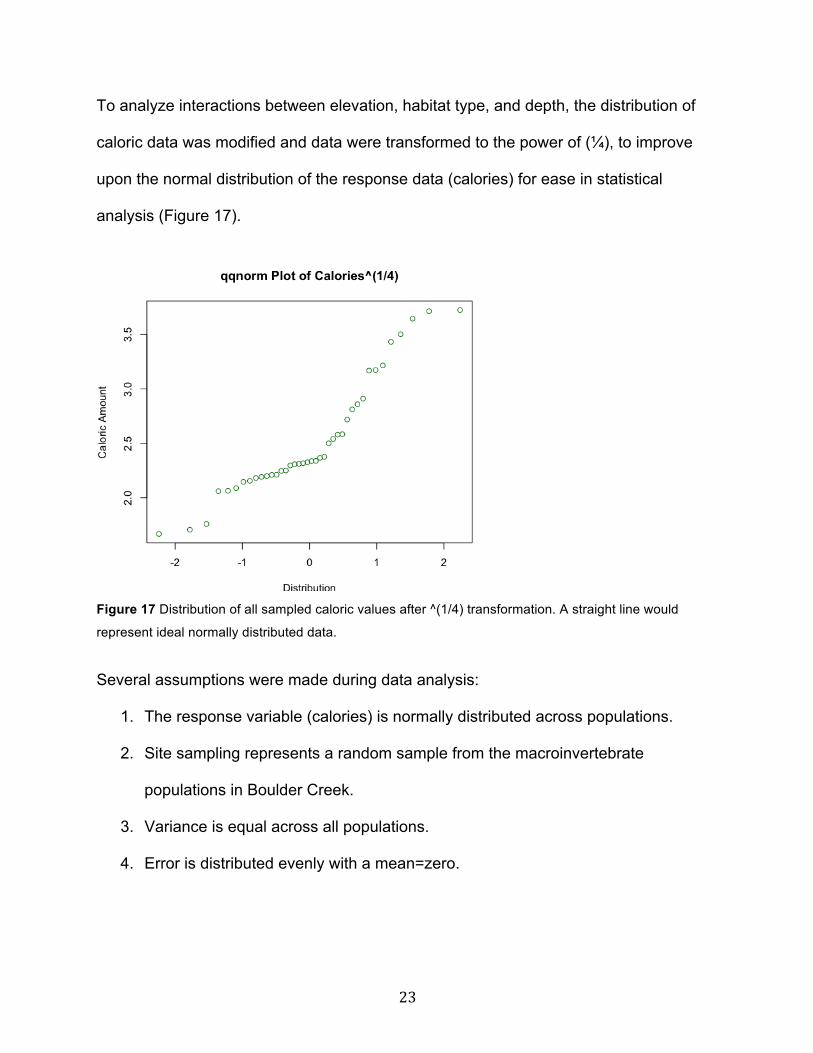
To analyze interactions between elevation, habitat type, and depth, the distribution of
caloric data was modified and data were transformed to the power of (¼), to improve
upon the normal distribution of the response data (calories) for ease in statistical
analysis (Figure 17).
Figure 17 Distribution of all sampled caloric values after ^(1/4) transformation. A straight line would
represent ideal normally distributed data.
Several assumptions were made during data analysis:
1. The response variable (calories) is normally distributed across populations.
2. Site sampling represents a random sample from the macroinvertebrate
populations in Boulder Creek.
3. Variance is equal across all populations.
4. Error is distributed evenly with a mean=zero.
24
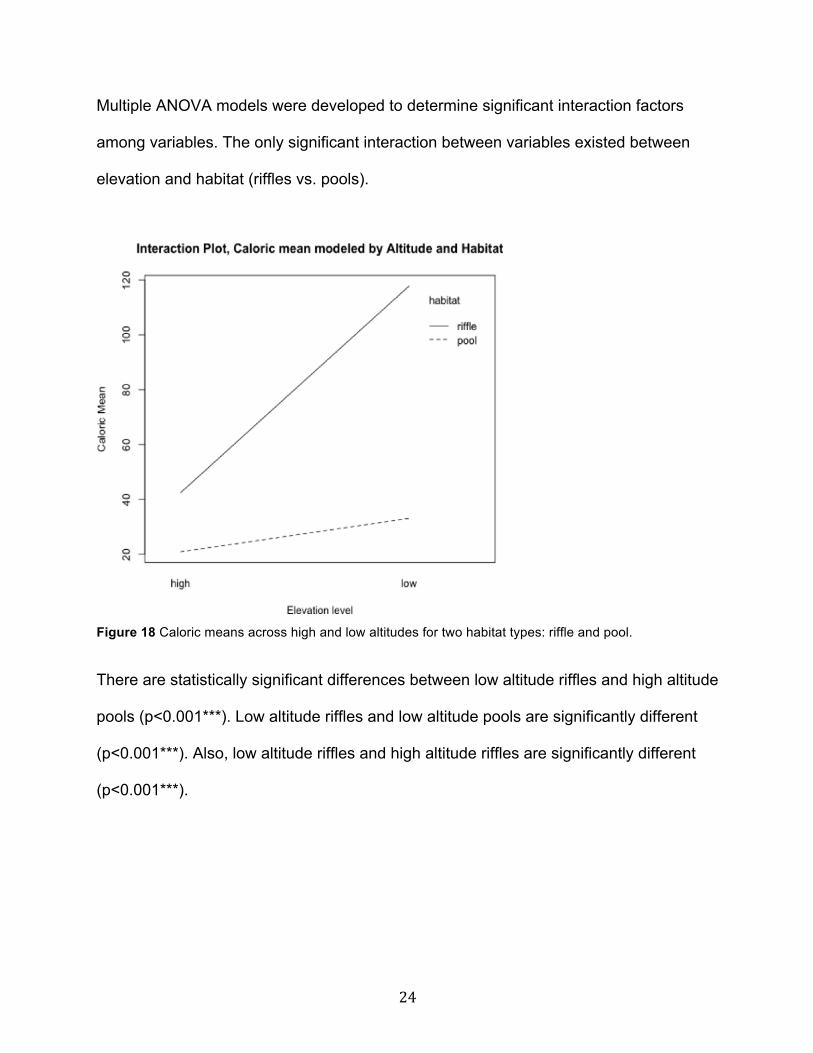
Multiple ANOVA models were developed to determine significant interaction factors
among variables. The only significant interaction between variables existed between
elevation and habitat (riffles vs. pools).
Figure 18 Caloric means across high and low altitudes for two habitat types: riffle and pool.
There are statistically significant differences between low altitude riffles and high altitude
pools (p<0.001***). Low altitude riffles and low altitude pools are significantly different
(p<0.001***). Also, low altitude riffles and high altitude riffles are significantly different
(p<0.001***).
25
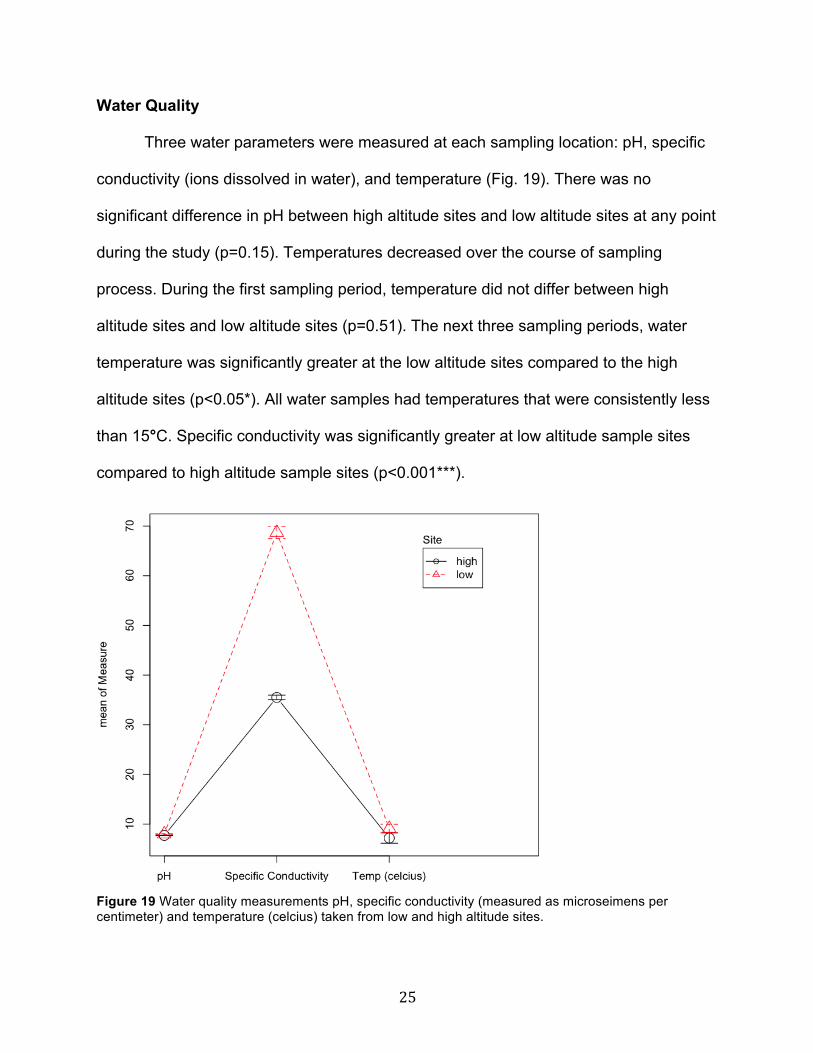
Water Quality
Three water parameters were measured at each sampling location: pH, specific
conductivity (ions dissolved in water), and temperature (Fig. 19). There was no
significant difference in pH between high altitude sites and low altitude sites at any point
during the study (p=0.15). Temperatures decreased over the course of sampling
process. During the first sampling period, temperature did not differ between high
altitude sites and low altitude sites (p=0.51). The next three sampling periods, water
temperature was significantly greater at the low altitude sites compared to the high
altitude sites (p<0.05*). All water samples had temperatures that were consistently less
than 15°C. Specific conductivity was significantly greater at low altitude sample sites
compared to high altitude sample sites (p<0.001***).
Figure 19 Water quality measurements pH, specific conductivity (measured as microseimens per centimeter) and temperature (celcius) taken from low and high altitude sites.
26
Discussion
In this study, shallow, low altitude riffles represent the highest caloric content
identified, while demonstrating a new method for analyzing stream energetics. Similar
species composition was observed in high/low altitude sites, riffle/pool habitats, and
low/mid/high depths, suggesting the species found in both study sites are functioning
within their physiological limits. This similarity functions as a built-in control within the
present study. Similarities between pH at both altitude sites support that species are
functioning within these physiological parameters. Though low altitude sampling sites
had significantly greater specific conductivity than high altitude sampling sites, these
results are expected as dissolved ions naturally accumulate moving downstream
(Anderson, 2010). Water temperature became significantly warmer at low altitude sites
over the course of the study; however all recorded temperatures were lower than the
physiological limits of the observed macroinvertebrate species (<20°C) (Weiner, 2000).
Consistent species composition, coupled with consistent water quality parameters
between both sites, allows for a direct comparison of altitude and habitat.
The greater observed caloric content, and macroinvertebrate distribution at lower
altitudes could either be explained by movement of macroinvertebrates as passive
downstream drift, or as active macroinvertebrate choice. Downstream drift describes
macroinvertebrate’s nocturnal relocation from more populated areas to less populated
areas, where macroinvertebrates passively drift in the current (Beketov, 2008; Thornton,
2007). Downstream drift relocates macroinvertebrates downstream, and may explain
the greater observed caloric content at lower altitudes. Lehmkuhl (1972) noted that
different watersheds have different rates of downstream drift, varying from high rates
27
(10,000 individuals per hour per foot of stream width) to low rates. These widely varying
results suggest drift may be locally dependent on levels of productivity, and predation,
and that different stream systems may have unique downstream drift dynamics
(Lehmkuhl, 1972; Bass, 2004). Water contaminants may also trigger downstream drift,
notably pesticides that have entered a stream (Beketov, 2008). Downstream drift
represents a low energetic cost for macroinvertebrate redistribution.
However, if macroinvertebrates are dispersing based on altitude or habitat
choice, the energetic cost of relocation is much higher. Studying insect dispersal is
challenging (Humphries, 2003). What would drive a macroinvertebrate to disperse to a
shallow low altitude riffle, as observed in the present study? One driver may be the
stability of flow below a dam. Preference for lower altitudes may be the result of
regulated flow regimes from Barker Reservoir. The scheduled controlled release of
water from a dam has been shown to be a main driver of ecological processes in
streams (Martinez, 2013). Specifically, flow regulation from dams changes invertebrate
communities (Ward, 1983). Briggs (1950) found that numbers and weights of
invertebrates were greater downstream of dams than upstream, because flows were
more consistent. Results from the present study support the results of Briggs (1950)
study. Despite unknown causes for macroinvertebrate movement, results from the
present study suggest a difference in feeding ecology between low and high altitude
sites, which may influence predator feeding. This study did not address how
macroinvertebrate caloric content changes seasonally, which may give insight into
explaining macroinvertebrate movement in a watershed over a year period.
28
As a possible effect of movement, macroinvertebrate preference for habitat type
was observed, where macroinvertebrates preferred shallower riffle habitats to deeper
pool habitats. The observation of more macroinvertebrates in riffle habitats than in pool
habitats has been supported outside of this study. Brown (1991) and Logan (1983)
suggest that macroinvertebrates prefer riffle sections to pool sections because
increased flow over riffles provides more oxygen and food compared to slower flow in
pools. Filter-feeding techniques present in some macroinvertebrates may explain
preference of riffle habitats because fast water in riffles delivers a greater amount of
available food than slow moving water in pools, and supports an argument that
macroinvertebrates are feeding using OFT (Riverwatch, 2010). Similarly, as water depth
increases, available food can settle to the bottom of a pool, becoming unavailable to
filter-feeding macroinvertebrates. Brown (1991) supports that midges are more often
found in pools than in riffles. Macroinvertebrate presence in habitats may also be
influenced by fish distribution in streams.
Macroinvertebrate predation by fish may further explain why fewer
macroinvertebrates are abundant in pools. Trout prefer slow, deep pools to provide
protection, and minimize energy expenditure while foraging (Lewis, 2011). These
feeding techniques suggest trout feed using OFT. As a result, macroinvertebrates found
in pools quickly become prey. Macroinvertebrate presence is negatively correlated to
trout presence in pools (Meissner, 2006). However, ideal free distribution theory (IFD)
suggests that trout presence isn’t limited to pools. IFD suggests when no feeding costs
exist in individuals with similar acquisition capabilities; individuals will relocate to where
food is greater (Hakoyama, 2002), and more abundant. When food resources are not
29
limited, individuals will distribute amongst several resource patches, including riffles and
pools (Hakoyama, 2002). IFD would suggest that when no costs exist between
individuals, and when food is readily available, riffles and pools would have similar
abundance of foraging trout. However, the energetic costs of living within a stream may
limit a trout’s ability to forage within riffle environments. Greater trout growth in pools
suggests that pools are preferred habitat as trout grow in size (Rosenfeld, 2011). Future
research can determine food availability of macroinvertebrates in the Boulder Creek
study site to test IFD and predict trout distribution using field data.
The present study offers an exploratory effort to introduce a caloric context to
understanding stream systems. The present study was limited to one study location,
and no control was provided to compare the dammed stream against a non-dammed
stream. Further, it was assumed within the present study that observed caloric content
represents food available for trout, however not all caloric content in the form of
macroinvertebrates will be available to foraging trout, as some macroinvertebrates will
complete their lifecycle and not be available to foragers within a stream. Due to time
constraints and lack of funding, caloric calculations had a limited number of replicates.
This may not have captured the natural variability of macroinvertebrate size or overall
macroinvertebrate biomass- i.e. increases in macroinvertebrate size may directly
correlate with caloric content. Biomass may represent another way to compare
energetic content between macroinvertebrates. However, a caloric approach has been
a valued metric within OFT for trout. Closely examining downstream drift within any
study site could further aid in explaining macroinvertebrate and caloric distributions.
30
However, the novel quantitative approach from the present study offers a new
opportunity to understand stream dynamics. This could potentially help guide future
research questions such as: how does caloric content change seasonally, and across
both low altitude and high altitude sites compared to non-dammed stream systems?
How does caloric content change as juvenile macroinvertebrates develop or pupate?
Does size of macroinvertebrates represent the determining choice in trout feeding, and
consequently does caloric content of macroinvertebrates directly correlate to the size of
the macroinvertebrate? These questions and many others would benefit from more
research and direct observation.
However, in developing the quantification method first established in the present
study, a multitude of stakeholders interested in stream research, and management
could potentially benefit. For example, applying a known value of calories/transect
across a stream section could be used to determine available caloric content with a
stream. By coupling this information with trout energetic needs, carrying capacity, how
many individuals can be supported by the available caloric content in a stream, can be
estimated for trout. This process could potentially provide insight for improving fish
stocking methodology by informing an estimate of the number of fish to stock in a given
area. Water managers may also benefit from this quantitative method. The importance
of riffles as habitat for macroinvertebrates may help prioritize stream restoration
projects. Those involved in dam removal may take interest in data from this study, which
takes some initial steps to analyze the influence of dams on stream food availability and
dam’s ecological effects. In sum, this work represents a new direction for scientists

31
interested in understanding stream systems, and provides a tool for improving
knowledge of ecological energetics in streams.
32
Acknowledgements
I’d like to thank members of my defense committee, Dr. Suzanne Nelson, Dr.
Brett Melbourne and Dr. Barbara Demmig-Adams for guidance during this process.
Also, I’d like to thank Wright Water Engineers for donating use of field equipment, and
the help of Gary Witt for collecting data. I’d also like to thank Dr. Brett Melbourne, Ph.D.
candidate Ty Tuff, and Dr. John Basey for access to a drying oven and a sampling net.
Last but not least, I’d like to thank the RiverWatch Institute of Alberta and the illustrators
of figures 4-9, by Cecilia C. Gonclaves and Tom Milutinovic of Pennan, Inc., for allowing
the use of their macroinvertebrate illustrations. Illustrations were used with permission.
33
Literature Cited Acreman, M., et al. (2009). Environmental Flows from Dams: The Water Framework
Directive. Proceedings of the ICE-Engineering Sustainability. 162-1.
(USACE) Army Corps of Engineers, (EPA) Environmental Protection Agency. (2004).
Physical Stream Assessment: A Review of Selected Protocols for Use in the
Clean Water Act Section 404 Program.
Bachman, R.A. (1984). Foraging Behavior of Free-Ranging Wild and Hatchery Brown
Trout in a Stream. Transactions of the American Fisheries Society. 113-1; 1-32.
Bass, D. (2004). Diurnal Stream Drift of Benthic Macroinvertebrates on Small Oceanic
Island of Dominica, West Indies. Caribbean Journal of Science. 40-2; 245-252.
Boulder, City of. (2004). Barker Reservoir Management Plan. Web.
http://www.bouldercolorado.gov/index.php?option=com_content&view=article&id
=4970&Itemid=2532#EXEC_SUM. 2/19/2013.
Beitinger, T.L., et al. (2000). Temperature Tolerances of North American Freshwater
Fishes Exposed to Dynamic Changes in Temperature. Environmental Biology of
Fishes. 58-3; 237–275.
Beketov, M.A. & Liess, M. (2008). Potential of 11 Pesticides to Initiate Downstream Drift
of Stream Macroinvertebrates. Environmental Contamination and Toxicology. 55-
2; 247-253.
Bernhardt, E.S., et al. (2005). Synthesizing US River Restoration Efforts. Science 308.
636-637.
Briggs, J.C. (1950). The Quantitative Effects of a Dam Upon the Bottom Fauna of a
Small California Stream. Transactions of the American Fisheries Society. 78-1;
70-81.
Brown, A.V. & Brussock, P.P. (1991). Comparisons of Benthic Invertebrates Between
Riffles and Pools. Hydrobiologia. 220-2; 99-108.
Bureau, D.P., et al. (2006). Effect of Feeding Level on Growth and Nutrient Deposition
in Rainbow Trout (Oncorhynchus mykiss Walbaum) Growing from 150 to 600 g.
Aquaculture Research. 37-11; 1090-1098.
34
Cummins, K.W. & Wuycheck J. C. (1971). Caloric Equivalents for Investigations in
Ecological Energetics. International Association of Theoretical and Applied
Limnology. 15.
(EPA) Environmental Protection Agency. (1972). Clean Water Act. 33 U.S.C. §1251 et
seq. http://www.epa.gov/npdes/pubs/cwatxt.txt. Web. 2/14/2013.
Global Invasive Species Database. (2012). 100 of the World’s Worst Invasive Alien
Species. http://www.issg.org/database/species/search.asp?st=100ss. Web.
2/11/2013.
Hakoyama, H. (2002). The Ideal Free Distribution When The Resource Is Variable.
Behavioral Ecology. 14-1. 109-115.
Hampton, R.E. & Havel J.E. (2006). Introductory Biological Statistics. Waveland Press.
Long Grove ,IL.
Hockett, P. & Haws J. (2003). Nutritional Ecology and Diachronic Trends in Paleolithic
Diet and Health. Evolutionary Anthropology: Issues, News and Reviews. 12-5;
211-216.
Humphries, S. & Ruxton, G.D. (2003). Estimation of Intergenerational Drift Dispersal
Distances and Mortality Risk for Aquatic Macroinvertebrates. Limnology and
Oceanography. 48-6; 2117-2124.
Irvine, J.R. (2011). Effects of Successive Flow Perturbations on Stream Invertebrates.
Canadian Journal of Fisheries and Aquatic Science. 42-12; 1922-1927.
Izaak Walton League of America. (2006). Guide to Aquatic Insects & Crustaceans.
Stackpole Books. Mechanicsburg, PA.
Johnson, D. (2007). Fishes of Colorado Field Guide. Adventure Publications Inc.
Cambridge, MN.
Johnson, R.L., et al. (2006). A Bioenergetic Analysis of Factors Limiting Brown Trout
Growth in an Ozark Tailwater. Environmental Biology of Fishes. 77-2; 121-132.
Kaushal, S.S. et al. (2010). Rising Stream and River Temperatures in the United States.
Frontier in Ecology and the Environment. 8-9; 461-466.
Lehmkuhl, D.M. & Anderson, N.H. (1972). Microdistribution and Density as Factors
Affecting the Downstream Drift of Mayfiles. Ecological Society of America. 53-4;
661-667.
35
Lessard, J.L. & Hayes, D.B. (2003). Effects of Elevated Water Temperature on Fish and
Macroinvertebrate Communities Below Small Dams. River Research and
Applications. 19; 721-732.
Lewis, S.L. (2011). Physical Factors Influencing Fish Populations In Pools Of A Trout
Stream. Transactions of the American Fisheries Society. 98-1; 14-19.
Lewis, W.M. (2012). Distribution and Physical Variety of Inland Waters. Pub199.
Boulder, CO.
Logan, P. & Brooker M.P. (1983). The Macroinvertebrate Fauna of Riffles and Pools.
Water Research. 3; 263-270.
Loughna, P.T. & Goldspink, G. (1984). The Effects of Starvation Upon Protein Turnover
in Red and White Myotomal Muscle of Rainbow Trout, Salmo gairdneri
Richardson. Journal of Fish Biology. 25-2; 223-230.
Magilligan, F.J. & Nislow, K.H. (2005). Changes in Hydrologic Regime By Dams.
Geomorphology. 71; 61-78.
Martinez, A., et al. (2013). Stream Regulations By Small Dams Affect Benthic
Macroinverebrates Communities: From Structural Changes To Functional
Implications. Hydrobiologia.
Mayer, T.D. (2012). Controls of Summer Stream Temperature in the Pacific Northwest.
Journal of Hydrology. 475; 323-335.
Meissner, K. & Muotka, T. (2006). The Role of Trout In Stream Food Webs: Integrating
Evidence From Field Studies and Experiments. Journal of Animal Ecology. 75-2;
421-433.
Page, L.M. & Burr, B.M. (2011) Peterson Field Guide to Freshwater Fishes of North
America North of Mexico. Houghton Mifflin Harcourt. New York. p. 400.
Peterson, J.H. & Paukert, C.P. (2011). Development of a Bioenergetics Model for
Humpback Chub and Evaluation of Water Temperature Changes in the Grand
Canyon, Colorado River. Transactions of the American Fisheries Society. 134-4;
960-974.
Pister, E.P. (2001). Wilderness Fish Stocking: History and Perspective. Ecosystems. 4;
279-286.
36
Pyke, G.H. (1984). Optimal Foraging Theory: A Critical Review. Annual Review of
Ecology and Systematics. 15; 523-575.
Raubenheimer, D; Simpson, S.J; Mayntz, D. (2009). Nutrition, Ecology, and Nutritional
Ecology: Toward an Integrated Framework. Functional Ecology. 23; 4-16.
Riverwatch Institute of Alberta. (2010). Invertebrate Identification.
http://www.riverwatch.ab.ca/how_to_monitor/invert_identifying-ident.cfm. Web.
1/31/2013.
Rosenfeld, J.S. & Boss. S. (2001). Fitness Consequences Of Habitat Use For Juvenile
Cutthroat Trout: Energetic Costs And Benefits In Pools and Riffles. Canadian
Journal of Fisheries and Aquatic Sciences. 58-3. 585-593.
Sponseller, R.A., et al. (2008). Relationships Between Land Use, Spatial Scale and
Stream Macroinvertebrate Communities. Freshwater Biology. 46-10; 1409-1424.
Todd, A.S. & McKnight, D.M. (2007). Effects of Acid Rock Drainage on Stocked
Rainbow Trout (Oncorhynchus mykiss): An In-Situ, Caged Fish Experiment.
Environmental Monitoring and Assessment. 130; 111-127.
Thornton, D.P. (2007). Macroinvertebrate Stream Drift-An Australian Example. School
of Science and Technology, Charles Sturt University.
http://www.ecology.kee.hu/pdf/0601_049055.pdf. Web. 2/19/2013
(USFWS) U.S. Fish and Wildlife Service. (2013). Environmental Quality. Web.
http://www.fws.gov/contaminants/Issues/WaterQuality.cfm. 2/14/2013.
(USGS) U.S. Geological Survey (2013). Non-indigenous Aquatic Species-Salmo trutta.
Web. http://nas.er.usgs.gov/queries/factsheet.aspx?SpeciesID=931. 3/6/2013.
(USGS) U.S. Geological Survey (2013). Non-indigenous Aquatic Species-
Onchorynchus mykiss. Web.
http://nas.er.usgs.gov/queries/FactSheet.aspx?speciesID=910. 3/6/2013.
Vannote, R. L., et al. (1980). The River Continuum Concept. Canadian Journal of
Fisheries and Aquatic Science. 37; 130-137.
Ward, J.V. & Stanford, J.A. (1983). Chapter 2: The Serial Discontinuity Concept of Lotic
Ecosystems. Dynamics of Lotic Systems. 29-42.
Ward, J.V. (1986). Altitudinal Zonation in a Rocky Mountain Stream. Hydrobiologia. 2;
133-199.
37
Ward, J.V. & Kondratieff, B.C. (1992). An Illustrated Guide to the Mountain Stream
Insects of Colorado. University Press of Colorado, Niwot, Colorado.
Weiner, E.R. (2000). Applications of Environmental Chemistry. Lewis Publishers. New
York.
Wilkinson, C. (2010). Bird Feeding Ecology and Diversity. Cornell University. Web.
http://entomology.cornell.edu/cals/entomology/extension/outreach/upload/Wilkins
on-Bird-Feeding-Strategies-Teacher-s-Guide.pdf. 1/31/13.
Zimmerman, J. (2009). 4-Year Boulder Creek Study. Independent data collected
between 2005-2008. Personal Communication.
38
Appendices Appendix A: Macroinvertebrate Caloric Content
39
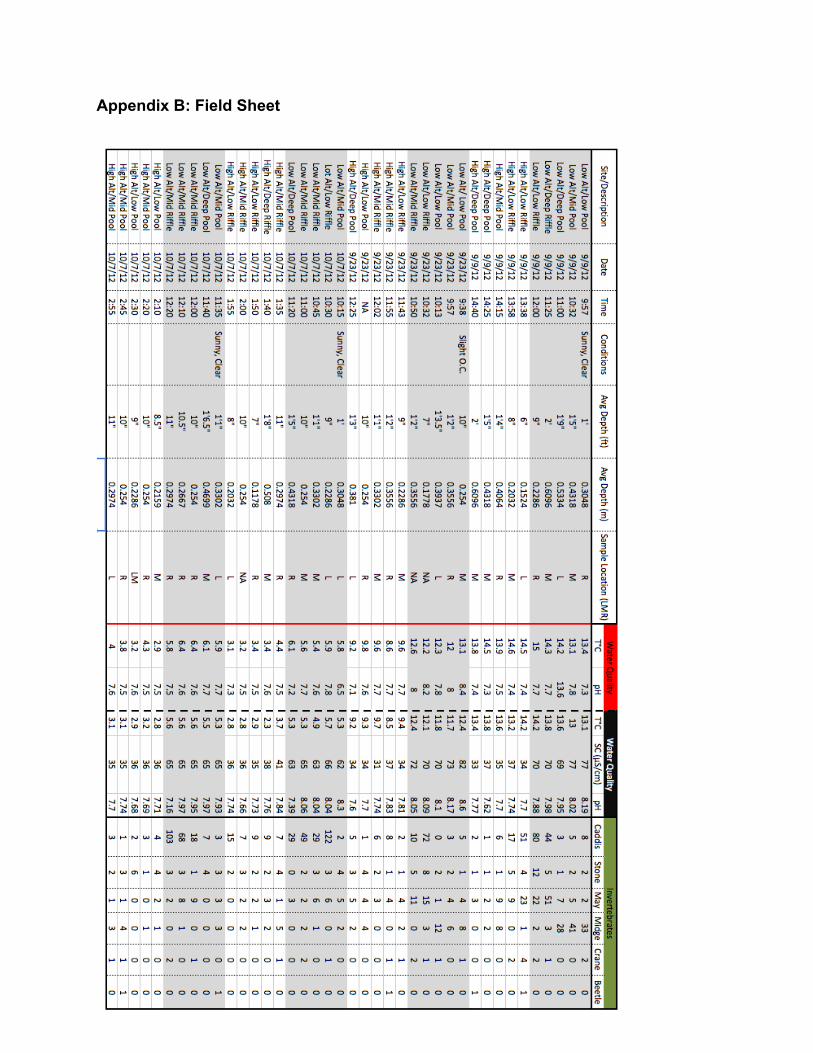
Appendix B: Field Sheet
40
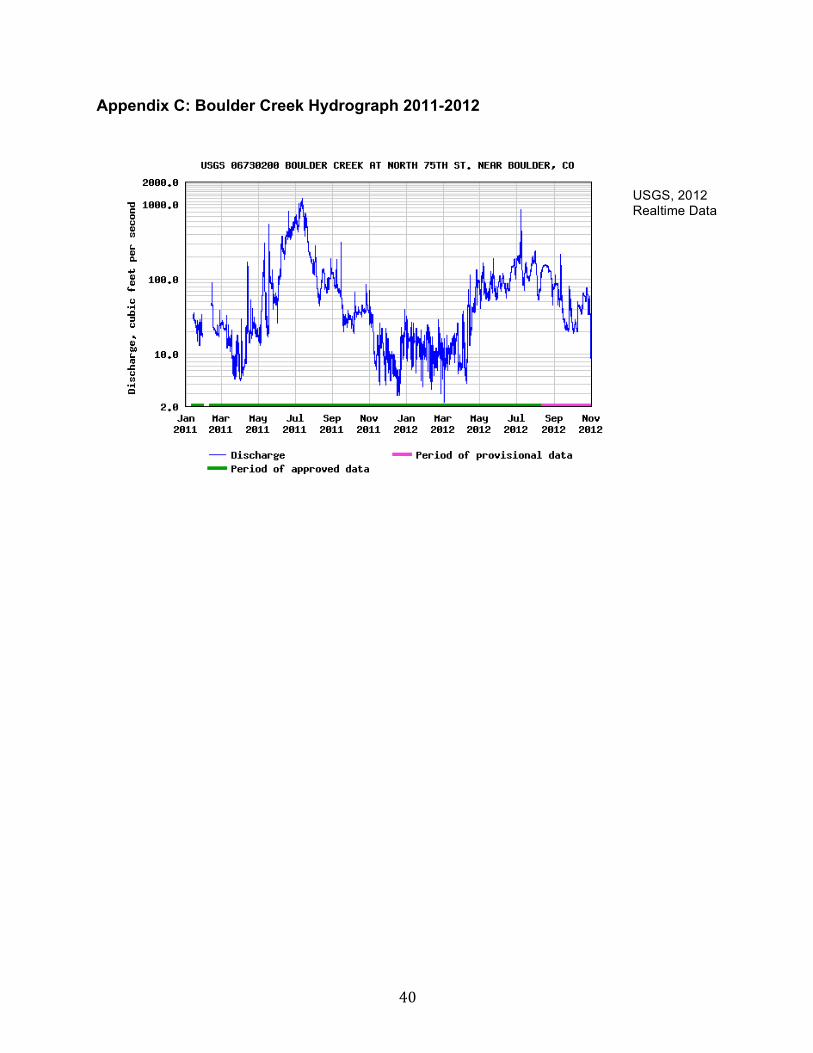
Appendix C: Boulder Creek Hydrograph 2011-2012
USGS, 2012 Realtime Data