quantifying lodging percentage and lodging severity using
TRANSCRIPT

remote sensing
Article
Quantifying Lodging Percentage and LodgingSeverity Using a UAV-Based Canopy Height ModelCombined with an Objective Threshold Approach
Norman Wilke 1,*, Bastian Siegmann 1, Lasse Klingbeil 2 , Andreas Burkart 3, Thorsten Kraska 4,
Onno Muller 1, Anna van Doorn 1, Sascha Heinemann 1 and Uwe Rascher 1
1 Institute of Bio- and Geosciences, Plant Sciences (IBG-2), Forschungszentrum Jülich GmbH, 52428 Jülich,Germany; [email protected] (B.S.); [email protected] (O.M.); [email protected] (A.v.D.);[email protected] (S.H.); [email protected] (U.R.)
2 Department of Geodesy, University of Bonn, 53115 Bonn, Germany; [email protected] JB Hyperspectral Devices UG, 40225 Düsseldorf, Germany; [email protected] Field Lab Campus Klein, Altendorf, University of Bonn, 53359 Rheinbach, Germany; [email protected]* Correspondence: [email protected]; Tel.: +49-2461-61-1733
Received: 31 January 2019; Accepted: 27 February 2019; Published: 3 March 2019�����������������
Abstract: Unmanned aerial vehicles (UAVs) open new opportunities in precision agriculture andphenotyping because of their flexibility and low cost. In this study, the potential of UAV imagerywas evaluated to quantify lodging percentage and lodging severity of barley using structure frommotion (SfM) techniques. Traditionally, lodging quantification is based on time-consuming manualfield observations. Our UAV-based approach makes use of a quantitative threshold to determinelodging percentage in a first step. The derived lodging estimates showed a very high correlation toreference data (R2 = 0.96, root mean square error (RMSE) = 7.66%) when applied to breeding trials,which could also be confirmed under realistic farming conditions. As a second step, an approach wasdeveloped that allows the assessment of lodging severity, information that is important to estimateyield impairment, which also takes the intensity of lodging events into account. Both parameterswere tested on three ground sample distances. The lowest spatial resolution acquired from the highestflight altitude (100 m) still led to high accuracy, which increases the practicability of the method forlarge areas. Our new lodging assessment procedure can be used for insurance applications, precisionfarming, and selecting for genetic lines with greater lodging resistance in breeding research.
Keywords: precision agriculture; remote sensing; unmanned aerial vehicles (UAVs); structure frommotion; ground model; digital terrain model; plant height; canopy height model; lodging percentageand severity; ground sample distance influence
1. Introduction
The rapid development of sensor technology and data processing contributes to increasingdigitalization in agriculture [1,2]. The use of unmanned aerial vehicles (UAVs) can help to advanceand accelerate this process, particularly for field phenotyping and precision agriculture [3–5]. Due tothe low cost, simple handling, and high flexibility of UAVs [6], UAV technology has been increasinglyapplied in different areas in recent years [7–10]. In comparison to satellite and airborne systems,UAVs allow acquisition of image data with high spatial resolution, which is a basic requirement forderiving the three-dimensional (3D) canopy structure of crops using feature matching and structurefrom motion (SfM) techniques [11–13].
To derive the canopy height (CH) from the canopy structure, a nonvegetated ground modelis needed. This ground model represents the topsoil surface, which is usually acquired by a UAV
Remote Sens. 2019, 11, 515; doi:10.3390/rs11050515 www.mdpi.com/journal/remotesensing

Remote Sens. 2019, 11, 515 2 of 18
overflight shortly after sowing or harvest, when agricultural fields are free of vegetation [14,15]. Thiskind of information can also be provided by digital terrain models (DTMs) derived from airbornelight detection and ranging (LIDAR) data. Different studies have already examined the quality andaccuracy of LIDAR DTMs [16–19]. The potential of this data source as an alternative ground model forCH retrieval, however, has not yet been evaluated.
The UAV CH has been investigated in several studies in recent years [20–22]. Noninvasivemeasurement of CH, multitemporal growth curves [23,24], and biomass development [25,26] atdifferent phenological stages is a major requirement for precision agriculture. Crop vitality, fertilizerstatus, soil quality, and water availability influence the aforementioned plant traits and are used tooptimize agricultural management practices or yield predictions [27–31]. Compared to plant heightmeasured with a ruler in the field at a specific location, the UAV-based approach provides informationon the spatial height distribution of a continuous canopy [32,33]. Thus, it contains height informationof numerous single plants, while reference measurements in the field only represent height informationof single plants covering a very limited area.
Furthermore, CH is very well suited to quantify lodged areas. The term “lodging” is defined aspermanent displacement of a plant from the upright position [34,35]. It is a major problem in cerealcrops, because it leads to qualitative and quantitative yield losses up to 45% [34,36–38]. Yield loss isstrongly affected by the lodging severity and the development stage at which it occurs [39–41]. Extremeweather conditions (wind, hail, heavy rain) and other environmental factors, such as excessive nitrogensupply, pests, diseases, and high plant density, can cause lodging before harvesting [42]. Thus, breedingprograms aim to select for genetic lines of cereal crops with greater lodging resistance [37]. Due tothe impacts of climate change, with an increasing number of extreme weather conditions, lodging isstill a major limiting factor in yield impairment, resulting in an increasing need for a cost-efficient andaccurate approach to quantify lodging. The use of UAVs can replace laborious and subjective grounddata collection and enable spatial assessment of lodging by an automated system. Susko et al. [43] triedto assess crop lodging with a field camera track system. Liu et al. [44] used visible and thermal infraredimages derived from UAV for rice lodging estimation. Texture information and canopy structure havealso been used to assess lodging in rice [45]. Murakami et al. [46] quantified lodging in buckwheatusing the 3D canopy structure. In general, the area of lodging can be determined by using a predefinedthreshold at which CH lodging occurs. However, the thresholds applied in different studies [32,45,47]were defined by subjective inspections rather than by mathematical approaches.
The lodging percentage parameter identified with the single threshold approach only enablesto determine the presence or absence of lodging. In recent years, several studies showed that yieldimpairment is additionally affected by lodging severity [34,39,46,48]. The term “lodging severity”is defined as the angle of the permanent displacement of plants from their upright position [34,48].Ground data based on visual lodging scores are generally insufficient in accuracy, efficiency, andobjectivity [46,49]. So far, only Chu et al. [14] have assessed the lodging severity of corn by quantifyingthe number of lodge plants. Due to the typical plant structure and plant density of corn, this approachcannot be applied to cereal crops.
The major aims of this study are to use canopy structure derived from red/green/blue (RGB)image data to determine the factors that affect canopy height and to develop new methodologies forthe assessment of lodging percentage and severity. The primary objectives are: (i) to compare planttraits derived from UAV- and DTM-based ground models to evaluate whether the DTM can serveas an alternative data source; (ii) to investigate the comparability between ground-measured plantheights in the field with UAV-derived CHs, taking factors like canopy structure and plant density intoaccount; (iii) to develop a mathematical approach for the assessment of lodging percentage, avoidingadjusted thresholds and subjective decisions; and (iv) to assess lodging severity with a novel approachbased on canopy height variations.

Remote Sens. 2019, 11, 515 3 of 18
2. Materials and Methods
2.1. Study Area
The study area is located at the field lab on the Campus Klein-Altendorf of the University of Bonn(50◦37′N, 6◦59′E), 40 km south of Cologne, Germany. Within the research campus, 2 experimental siteswere investigated. The first experimental site was sown on 09 April 2016 and consisted of several smallbreeder plots, each 2.62 × 3 m in size. This experiment was the test bed for developing a method thatallows canopy height and lodging assessment. The layout included three summer barley (Hordeum
vulgare) cultivars (HOR 21770, HOR 9707, HOR 3939) and two different sowing densities with sixrepetitions (Figure 1a). The high density (300 seeds m−2) reflected the common sowing density inGermany. The lower density consisted of 150 seeds m m−2. The selected barley cultivars varied incanopy characteristics (Figure 1).
Figure 1. (a) Experimental site 1, consisting of small breeder plots with three summer barley cultivarsand two sowing densities. Representative images of three barley varieties 61 days after sowing (DAS);(b) genotype HOR 3939, characterized by sparser vegetation cover and small soil gaps; (c) HOR 9707,characterized by a closed canopy with fewer gaps; and (d) HOR 21770, characterized by a closed anddense canopy without any gaps.
The second site was a normal production field with a size of 1.5 hectares where winter barleywas sown on 28 September 2017. The variety “Lomerit” was sown with a commonly used density of300 seeds m−2. The lodging assessment approach developed at the first experimental site was appliedto test its robustness and usability on this conventionally treated field. The experiments were fertilizedwith 170 kg nitrogen per hectare and growth inhibitors were applied. The seeds were sown in rowswith 10.9 cm row distance.
2.2. Unmanned Aerial Vehicle Platform and Sensor
The Falcon-8 octocopter (Ascending Technologies GmbH, Krailing, Germany) was used in thisstudy, which proved to be a reliable platform for different scientific purposes [50–52]. The octocopterwas equipped with a Sony Alpha 6000 (Sony Europe Limited, Weybridge, Surrey, UK) RGB wide-anglecamera (24 megapixel, 6000 × 4000 pixels). A fixed lens with 30 mm focal length was mounted on the

Remote Sens. 2019, 11, 515 4 of 18
camera, resulting in 0.54 cm ground sample distance (GSD) at a flight altitude of 35 m above groundlevel (AGL). The RGB camera was mounted and integrated in a gimbal and thus the pitch and rollmovements of the UAV could be compensated. Data acquisition was performed in JPEG format witha shutter speed of 1/1000th second according to a planned waypoints pattern with 60% across and80% along-track overlap. The images did not contain global positioning system (GPS) information.Depending on the battery capacity and weather conditions, the flight duration varied between 10 and15 min.
2.3. Data Processing and Canopy Height Model Generation
Agisoft PhotoScan (Agisoft LLC, Saint Petersburg, Russia, version 1.4.1) was used to processthe single UAV images based on the structure from motion (SfM) technique using algorithms thatidentify corresponding images by feature recognition [53]. Details on the SfM algorithms can be foundin several publications [53–55]. Through a defined number of overlapping images, it recreates theirorientation in a spatial three-dimensional (3D) point cloud [56]. In addition to the 3D point cloud as thefirst product, it provides a two-dimensional orthomosaic [4] as the second product (Figure 2). Furtherevaluation of the 3D point cloud with the necessary processing settings (align photos: High accuracy;building dense cloud: Quality high) was done in CloudCompare (Version 2.9.1) [57]. Georeferencing(UTM zone 32N) of the point clouds was based on 6 ground control points (GCPs) in Agisoft PhotoScanfor each experiment.
Figure 2. Overall flowchart of software products used in this study for data processing and evaluationof the spatial assessment of canopy height, lodging percentage, and lodging severity. UAV = unmannedaerial vehicle; GIS = geographic information system; DTM = digital terrain model; CHM = canopyheight model; ROI = region of interest.
The 3D point cloud contains height information above the ellipsoid. To derive the canopy heightmodel (CHM) the 3D point cloud must be subtracted from an underlying ground model (Figure 2).Two methods were investigated in this study to derive the ground model:
1. Ground model determination based on a UAV overflight shortly after sowing or after harvest(UAV-based ground model), and
Remote Sens. 2019, 11, 515 5 of 18
2. Ground model determination based on a DTM provided by state authorities (DTM-based groundmodel).
Method 1 requires an additional overflight in the time frame shortly after sowing until seedlingemergence with no visible vegetation. By contrast, method 2 is based on the airborne LIDAR datasetthat provides the topsoil surface with a GSD of 1 m. In Germany, DTMs are freely accessible andupdated at least every 6 years [58]. The DTM for the study was acquired in 2015.
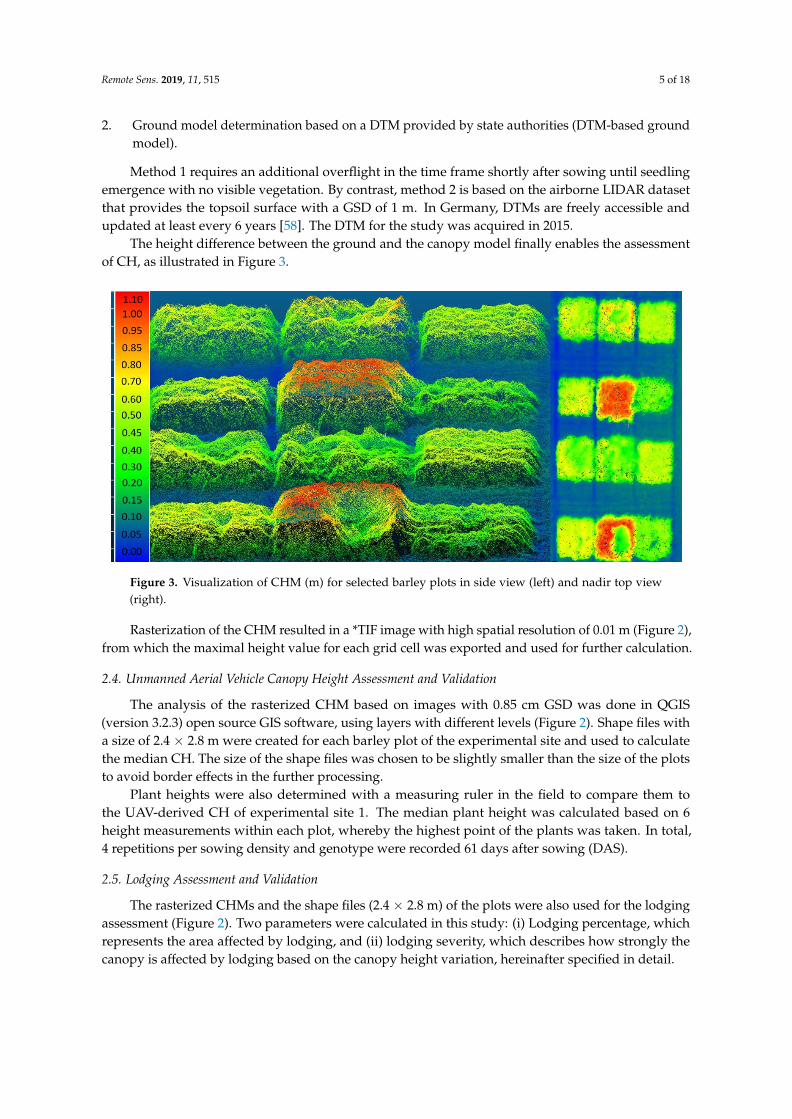
The height difference between the ground and the canopy model finally enables the assessmentof CH, as illustrated in Figure 3.
Figure 3. Visualization of CHM (m) for selected barley plots in side view (left) and nadir top view(right).
Rasterization of the CHM resulted in a *TIF image with high spatial resolution of 0.01 m (Figure 2),from which the maximal height value for each grid cell was exported and used for further calculation.
2.4. Unmanned Aerial Vehicle Canopy Height Assessment and Validation
The analysis of the rasterized CHM based on images with 0.85 cm GSD was done in QGIS(version 3.2.3) open source GIS software, using layers with different levels (Figure 2). Shape files witha size of 2.4 × 2.8 m were created for each barley plot of the experimental site and used to calculatethe median CH. The size of the shape files was chosen to be slightly smaller than the size of the plotsto avoid border effects in the further processing.
Plant heights were also determined with a measuring ruler in the field to compare them tothe UAV-derived CH of experimental site 1. The median plant height was calculated based on 6height measurements within each plot, whereby the highest point of the plants was taken. In total,4 repetitions per sowing density and genotype were recorded 61 days after sowing (DAS).
2.5. Lodging Assessment and Validation
The rasterized CHMs and the shape files (2.4 × 2.8 m) of the plots were also used for the lodgingassessment (Figure 2). Two parameters were calculated in this study: (i) Lodging percentage, whichrepresents the area affected by lodging, and (ii) lodging severity, which describes how strongly thecanopy is affected by lodging based on the canopy height variation, hereinafter specified in detail.

Remote Sens. 2019, 11, 515 6 of 18
2.5.1. Experimental Site 1: Breeding Trials
The first step in the process of quantifying lodging was to determine an objective threshold.First, the maximum canopy heights (MAXCH) of each genotype were calculated based on imageswith 0.85 cm GSD. In the second step, the average MAXCH of all repetitions was used to minimizethe risk of including outliers as maximum values. To determine the UAV lodging percentage, fourlodging percentage thresholds (LPTs) related to the MAXCH were calculated: 80% (80LPT), 70%(70LPT), 60% (60LPT), and 50% (50LPT) of the MAXCH. For example, 70LPT of a MAXCH of 1 m is0.7 m. Based on the different LPTs, the lodging percentage could be determined by a simple query(rasterized CHM < LPT), resulting in a binary image showing areas affected and not affected bylodging (Figure 4c).
Figure 4. (a) High-resolution red/green/blue (RGB) orthomosaic used for manual validation of areasaffected by lodging. (b) Calculated CHM (m) in the region of interest. (c) Binary image calculatedbased on 70% lodging percentage threshold (70LPT) with areas affected (dark red) and not affected(green) by lodging.
For the lodging severity assessment a mixture of four thresholds (80LPT, 70LPT, 60LPT, 50 LPT)related to the MAXCH was used. Based on these thresholds, first the average lodging severity (ALS)and second the weighted average lodging severity (WALS) were determined according to Equations (1)and (2). In comparison to ALS, the WALS parameter additionally rates areas affected by lodging,differentiated to also consider the yield impairment. The applied weighting factors were chosen basedon expertise, adjustments and the expected yield impairment of the LPTs. Sections with CH lowerthan 50% (50LPT) of the MAXCH were weighted twice as much as those with CH lower than 80%(80LPT) of the MAXCH (Equation (2)). The difference between adjacent LPT factors within the WALScalculation was 0.25, so that the value range for both lodging severity parameters varied between 0and 100%.
ALS =80LPT + 70LPT + 60LPT + 50LPT
4(1)
WALS =(0.625 ∗ 80LPT) + (0.875 ∗ 70LPT) + (1.125 ∗ 60LPT) + (1.375 ∗ 50LPT)
4(2)
To validate the accuracy of the UAV lodging percentage, affected areas of each barley plot weremanually determined in a high-resolution orthomosaic (GSD = 0.23 cm). Due to the high spatialresolution, the lodged areas could be easily identified, resulting in a precise lodging percentagedetermination (Figure 4a). These reference data do not consider information on lodging severity andonly provide a differentiation between the presence or absence of lodging.
2.5.2. Experimental Site 2: Farmer Field
For the case study, the above described method was applied to a conventional production field.Due to the lack of repetition in a classical farmer field, the 90th percentile of canopy height distribution

Remote Sens. 2019, 11, 515 7 of 18
was used as MAXCH to minimize the risk of including an outlier as a maximum value. To evaluate theinfluence of the spatial resolution on the assessment of lodging percentage and severity, three datasetswith different GSDs were acquired by adjusting flight altitude: 0.54 cm (35 m AGL), 1.09 cm (70 mAGL), and 1.57 cm (100 m AGL). Data acquisition took place 258 DAS. For validation purposes, theorthomosaic with 0.54 cm GSD was used to manually determine areas affected by lodging.
3. Results and Analysis
3.1. Comparison of Plant Traits Derived from Unmanned Aerial Vehicle- and Digital Terrain Model-BasedGround Models
As aforementioned (Section 2.4), the 3D point cloud has to be subtracted from a ground modelto derive the CHM. The UAV- and DTM-based ground models were used in the first experiment(breeding trials) to determine the average CH (61 DAS) and lodging percentage parameter (75 DAS)for each barley plot. The CHs derived from both ground models showed a high level of agreement (R2
of 0.99) and provided almost the same results (Figure 5a).
Figure 5. Scatter plots of (a) average canopy height 61 days after sowing (DAS) and (b) lodgingpercentage (70LPT) 75 DAS derived from UAV- and DTM-based ground models of experimental site 1.Black line represents regression line with 95% confidence interval; blue line represents 1:1 line.
In comparison to CH, the lodging percentage parameter determined for both ground modelsusing 70LPT resulted in a slightly lower R2 of 0.93 (Figure 5b). Small CH differences can influence thedetermined lodging percentage, especially for plots that are less affected by lodging. By considering the1:1 line, a higher residual deviation can be observed for lower values (Figure 5b). By contrast, valueshigher than 50% showed a better fit with the 1:1 line. Although the correlation of the parameter lodgingpercentage was slightly lower compared to the UAV CH, it still showed a high level of accuracy.
For experimental site 2, both ground models were investigated based on the parameter lodgingpercentage using 70LPT (Table 1). Only a small difference of 3.25% between both ground models couldbe observed. Compared to the reference data, the UAV ground model showed a smaller deviation thanthe DTM ground model. Due to the slightly higher accuracy, the UAV ground model was used in thefurther course of the study.

Remote Sens. 2019, 11, 515 8 of 18
Table 1. Assessment of UAV lodging percentage (70LPT) derived from UAV- and DTM-based groundmodels in comparison to reference data for experimental site 2 258 DAS. UAV: Unmanned aerial vehicle;LPT: lodging percentage threshold; DTM: Digital Terrain Model; DAS: Days after sowing.
Lodging Percentage (%)
UAV-Based Ground Model DTM-Based Ground Model Reference Data
71.81 75.06 70.27
3.2. Unmanned Aerial Vehicle Canopy Height Assessment and Validation
Comparing the UAV-derived CHs of the breeder trial with corresponding plant heights measureddirectly in the field, clear deviations in accuracy could be detected, depending on genotype and sowingdensity. While genotype HOR 3939, with 0.29 m in low density and 0.18 m in high density, showedgreater differences between UAV CH and reference measurements, genotypes HOR 9707 and HOR21770 showed only slight differences (Table 2).
Table 2. Comparison of UAV CH and reference measurement 61 DAS (n = 24). SD, standard deviation.
Genotype Sowing DensityMedian and SD (m) Discrepancy between Reference
Measurements and UAV CH (m)Reference Measurements UAV CH
HOR 3939Low
0.96 ± 0.02 0.67 ± 0.08 (−) 0.29HOR 9707 1.00 ± 0.04 0.92 ± 0.05 (−) 0.08HOR 21770 0.93 ± 0.02 0.90 ± 0.05 (−) 0.03
HOR 3939High
0.94 ± 0.05 0.76 ± 0.06 (−) 0.18HOR 9707 1.02 ± 0.03 0.99 ± 0.04 (−) 0.03HOR 21770 0.93 ± 0.01 0.92 ± 0.01 (−) 0.01
One reason for the more pronounced deviations observed for genotype HOR 3939 was that thecanopy fractional cover was lower than that of the other two cultivars. This resulted in small areasinside the plot without vegetation cover where soil was visible (Figure 1b). Thus, not only was the toplayer of the canopy acquired, but lower parts were also included in the computation of CHM. Thesenonvegetated areas had an influence on the determined median CH and caused underestimation ofthe UAV-based CH retrieval. By contrast, genotype HOR 21770 showed a dense and closed canopywithout any gaps (Figure 1c). Thus, only the top canopy layer was considered in CHM generation,consequently leading to a small deviation of 0.03 m in the low sowing density and 0.01 m in the highsowing density compared to the reference measurements (Table 2).In general, the UAV CH of thehigh-density plots matched better with the plant heights measured in field with an average differenceof 0.07 m in comparison to the lower-density plots with an average difference of 0.13 m. This is also dueto the fact that the lower sowing density resulted in a less dense canopy with gaps and consequentlyinfluenced the UAV CH assessment.
3.3. Lodging Assessment and Validation
3.3.1. Experimental Site 1: Breeding Trials
Permanent displacement of a plant from the upright position can be affected by different lodgingseverity, as illustrated in Figure 6. The first example shows a slightly affected canopy where onlylow-yield loss can be expected (Figure 6a). The same applies for the plot in Figure 6b, where just a fewsmall areas are strongly affected by lodging. Additionally, Figure 6c clearly illustrates the capability ofthe approach to detect lateral lodging. In contrast to the other examples, the canopy in Figure 6d isheavily affected by lodging, so that parts of the plot lay completely on the ground.

Remote Sens. 2019, 11, 515 9 of 18
Figure 6. RGB images of barley plots showing different types (a–d) of lodging (top) and correspondinglodging severity derived from the CHM (middle), as well as canopy height distributions withvisualization of different lodging percentage thresholds (LPTs) (bottom).
In order to identify the most suitable threshold for lodging percentage assessment, four LPTs(80LPT, 70LPT, 60LPT, 50LPT) were compared to the reference data. The UAV lodging percentagederived from 80LPT has a high root mean square error (RMSE) of 18.78% (Figure 7a). It became clearthat the absolute height differences between MAXCH and 80LPT were small and varied between0.13 m (HOR 3939, high sowing density) and 0.22 m (HOR 21770, low sowing density) (Table 3).The naturally occurring plant height variation was higher than the predefined lodging threshold,resulting in an overestimation of lodging (Figure 7a).
The UAV lodging percentage derived from 70LPT took into account the naturally occurring plantheight variation in the field and led to the highest correlation (R2 = 0.96) (Figure 7b) and the lowestRMSE. The low amount of scattering indicated that 70LPT can be applied independently from theamount of lodged plants. No influence of the aforementioned differentiated canopy characteristicsand canopy heights was observed. In comparison to the reference data, the UAV lodging percentagederived with 60LPT and 50LPT showed lower correlations (Figure 7c,d). Canopy areas affected bylodging were partly not identified when the lower CH thresholds were applied. Thus, the lodgingpercentage was underestimated, especially in strongly affected plots, where the CH threshold wasmore relevant.

Remote Sens. 2019, 11, 515 10 of 18
Figure 7. Scatter plots of manually determined lodging percentage and calculated UAV-based lodgingpercentage for (a) 80LPT, (b) 70LPT, (c) 60LPT, and (d) 50LPT as well as lodging severity parameters (e)ALS and (f) WALS 75 DAS. Black line represents regression line with 95% confidence interval; blue linerepresents 1:1 line (n = 36). LPT: lodging percentage threshold; ALS: average lodging severity; WALS:weighted average lodging severity, RMSE: root mean square error.

Remote Sens. 2019, 11, 515 11 of 18
Table 3. Overview of MAXCH, UAV lodging percentage for four LPTs (80%, 70%, 60%, 50%), ALS andWALS, and manually determined lodging percentage reference data for different sowing densities andgenotypes 75 DAS (n = 36). MAXCH, maximum canopy height; LPT: lodging percentage threshold;WALS: weighted average lodging severity; ALS: average lodging severity.
GenotypeSowingDensity
MAXCH(m)
Lodging Percentage (%) Lodging Severity (%)
80 LPT 70 LPT 60 LPT 50 LPT Reference Data WALS ALS
HOR 3939Low
0.72 74.70 59.94 41.74 20.76 53.97 43.66 49.29HOR 9707 0.79 84.90 70.54 54.35 34.48 70.54 55.84 61.07HOR 21770 1.12 44.59 26.86 16.21 9.77 24.81 20.76 24.35
HOR 3939High
0.66 94.52 86.90 73.00 50.10 77.27 71.53 76.13HOR 9707 0.68 98.10 92.86 80.94 58.44 73.28 78.49 82.58HOR 21770 1.03 92.45 85.75 78.30 69.37 80.90 79.07 81.47
In comparison to the single threshold approach normally used, a combination of differentthresholds can provide additional information for the lodging percentage assessment. The average ofall four thresholds used in the ALS calculation enabled estimation of the lodging percentage on a pixelbasis with high accuracy (R2 = 0.94, RMSE = 8.22%) (Figure 7e). The WALS parameter, by contrast,provided slightly lower accuracy (R2 = 0.921, RMSE = 11.53%) (Figure 7f), because of the weightingprocedure that was implemented within the parameter calculation (Equation (2)).
The aforementioned lodging severity variation cannot be determined by applying a singlethreshold approach, because that only represents a binary distinction between lodged and nonlodgedareas. Consequently, 70LPT, for example, cannot distinguish between slightly affected areas(Figure 6a,b), where a low-yield impairment can be expected, and heavily affected areas (Figure 6d),which necessarily cause yield loss. As a second step, the WALS parameter took these CH variationsinto account by its inbuilt weighting procedure and therefore can be used as an indicator foryield impairment.
The reference data displayed in Table 3 clearly show that the lower sowing density with anaverage of 50% was less affected by lodging compared to plots with the higher sowing densityaveragely affected by 77%. Moreover, 50LPT applied to the lower-density plots allowed detectionof only 35% of lodged area at maximum and 10% at minimum. Contrarily, 70LPT determined adistinctly higher amount of 71% lodge area at maximum and 27% at minimum. The applied weightingprocedure within the WALS calculation based on the different thresholds was able to consider thislodging intensity variation and, compared to the lodging percentage derived from 70LPT, led to adifference of 16% at maximum (Table 3). The disparity between the WALS and reference data wasinfluenced by the fact that the determined reference data were only an indicator for the presence orabsence of lodging and did not provide information on lodging severity. The plots with high sowingdensity showed distinctly larger areas heavily affected by lodging, with 69% at maximum and 50% atminimum for 50LPT. This higher lodging severity led to a stronger correlation between the WALS anddetermined reference data (Table 3). Nevertheless, the variations still present between the differentLPTs resulted in a deviation of 15% at maximum between 70LPT and WALS for the plots with highsowing density. The average difference considering all genotypes and sowing densities between bothparameters was 12% (SD ± 4.2).
Comparing ALS and WALS clarified that ALS without the weighting procedure slightlyoverestimated the lodging severity (Table 3). The difference between WALS and ALS was 6% atmaximum; the average difference was 4% (SD ± 1.1).
3.3.2. Experimental Site 2: Farmer Field
The results for the developed lodging assessment procedure applied to an entire farmer field fordifferent GSDs are summarized in Table 4. The 70LPT calculated for the highest spatial resolution(0.54 cm) showed the closest match to the reference data. Therefore, 70LPT again seemed to be mostsuitable to assess the lodging percentage. The results for 70LPT determined for the image data with
Remote Sens. 2019, 11, 515 12 of 18
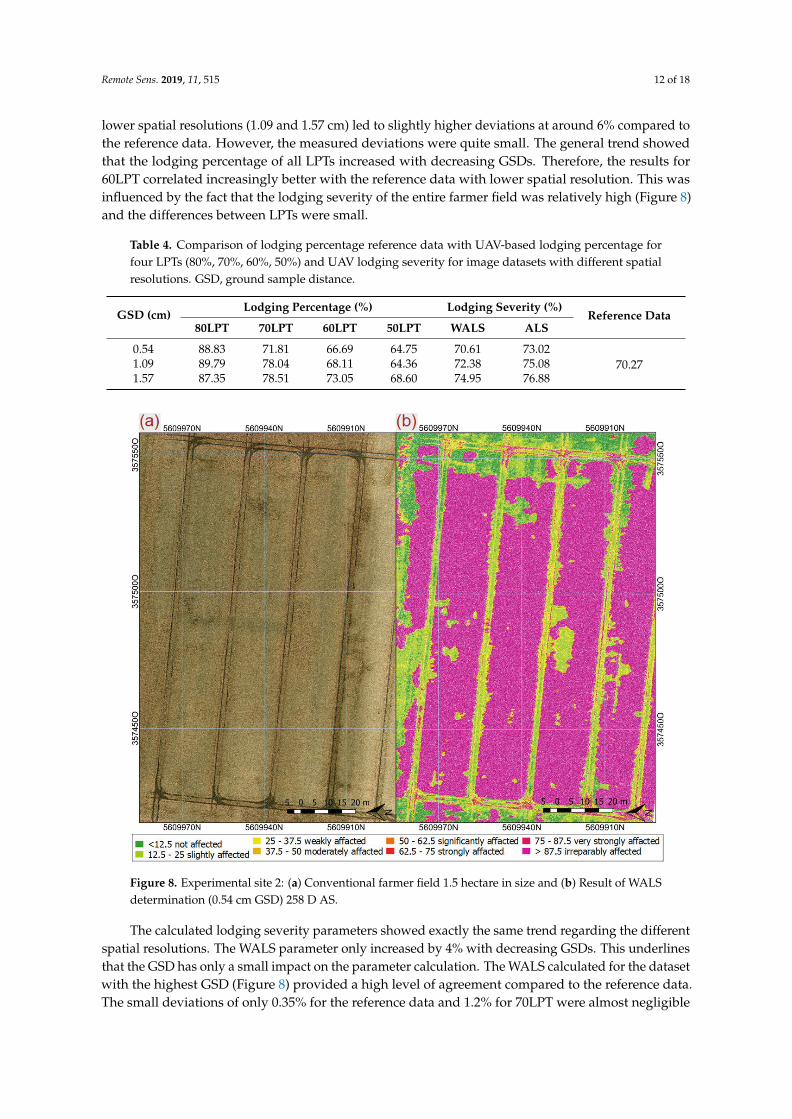
lower spatial resolutions (1.09 and 1.57 cm) led to slightly higher deviations at around 6% compared tothe reference data. However, the measured deviations were quite small. The general trend showedthat the lodging percentage of all LPTs increased with decreasing GSDs. Therefore, the results for60LPT correlated increasingly better with the reference data with lower spatial resolution. This wasinfluenced by the fact that the lodging severity of the entire farmer field was relatively high (Figure 8)and the differences between LPTs were small.
Table 4. Comparison of lodging percentage reference data with UAV-based lodging percentage forfour LPTs (80%, 70%, 60%, 50%) and UAV lodging severity for image datasets with different spatialresolutions. GSD, ground sample distance.
GSD (cm)Lodging Percentage (%) Lodging Severity (%)
Reference Data80LPT 70LPT 60LPT 50LPT WALS ALS
0.54 88.83 71.81 66.69 64.75 70.61 73.0270.271.09 89.79 78.04 68.11 64.36 72.38 75.08
1.57 87.35 78.51 73.05 68.60 74.95 76.88
Figure 8. Experimental site 2: (a) Conventional farmer field 1.5 hectare in size and (b) Result of WALSdetermination (0.54 cm GSD) 258 D AS.
The calculated lodging severity parameters showed exactly the same trend regarding the differentspatial resolutions. The WALS parameter only increased by 4% with decreasing GSDs. This underlinesthat the GSD has only a small impact on the parameter calculation. The WALS calculated for the datasetwith the highest GSD (Figure 8) provided a high level of agreement compared to the reference data.The small deviations of only 0.35% for the reference data and 1.2% for 70LPT were almost negligible

Remote Sens. 2019, 11, 515 13 of 18
and again were influenced by the high amount of plants strongly affected by lodging determined for50LPT (Table 4).
The ALS once more probably slightly overestimated the lodging severity because of the missingweighting procedure. The difference between the two parameters, however, was only 3% at maximumbecause of the small variations between the different LPTs (Table 4).
4. Discussion
In the presented study, different methods for high-throughput field phenotyping based on UAVimage data were developed. In the following, the results achieved for the investigations are discussedin detail: A comparison of UAV-based and DTM-based ground models, comparability betweenmeasured plant heights in the field and UAV-derived CHs, and a spatially precise assessment oflodging percentage and severity.
The quality assessment of DTMs derived from airborne LIDAR data was mostly based onstatistical methods [16,17,19]. Comparing the LIDAR DTM in this study with a UAV-acquired groundmodel, the results showed that the LIDAR DTM can be used as an almost equivalent ground model todetermine accurate CHMs. A direct comparison of the ground models independent from plant traitswas not done, because the average height difference between the two ground models would considerirrelevant information. Agricultural activities such as deeper wheel tracks were more pronouncedin the UAV ground model because of the distinctly higher spatial resolution in comparison to theLIDAR DTM. Areas like this were not relevant for the CH and lodging assessment and thereforecan be neglected. The results in this study are independent from the year (2016—Experimental site1, 2017—Experimental site 2) and location of data collection. Without extensive changes caused byhuman impact or agricultural crop rotation, it can be assumed that the renewed interval every sixyears provides sufficiently up-to-date information to obtain a precise ground model. However, alarger-scale experiment considering different locations and years needs to be conducted in the futureto exploit the potential of DTM-based ground models in more detail. Nevertheless, the DTM has thepotential to substitute for the mandatory UAV overflight and thus substantially reduce the effort indata collection. In this way, the time needed for data collection and data processing to determinelodging can be reduced by half. The included height information of the topsoil surface every squaremeter can be a benefit for large fields or hilly areas.
As already demonstrated in different studies [14,24,26], the UAV-based CH can be highlycorrelated with manually determined plant heights collected with a measuring ruler in the field.The study additionally shows that the UAV-derived information on the spatial height distribution ofthe canopy was affected by the canopy structure, the sowing density, and correspondingly also thesowing heterogeneity. By contrast, manual plant height measurements only represent single pointsin the field associated with subjective decisions, in particular with high plot heterogeneity. For thatreason, the UAV-derived CH should be considered as an autonomous trait with a different definitioncompared to the plant height measurements. A validation of the UAV CH using the plant heightmeasurements was correspondingly only possible to a limited extent. The UAV assessment enabledrepresentative information on plots with high heterogeneity that can be measured manually only withgreat effort. Especially for breeders, the CH determination enabled simplifying complex crop andplant surfaces on an objective scale to estimate genetic effects. Furthermore, canopy homogeneitycan be investigated for entire farmer fields because it carries information on the heterogeneity of theunderlying soil and the factors influencing crop growth.
The developed approach for lodging percentage assessment provided very high accuracy inbreeding trials (R2 = 0.96, RMSE = 7.66%) and led to a slight overestimation of 2% when applied to aclassical farmer field. Compared to other approaches where thresholds are normally chosen basedon subjective decisions without a mathematical approach and reference data for validation [32,45,47],70LPT enabled the precise detection of lodged areas within the canopy and took into account thenaturally occuring plant height variations in the field. Furthermore, the implemented method for

Remote Sens. 2019, 11, 515 14 of 18
detection of an objective threshold considered the aforementioned factors influencing the CHM. Theresults showed that the developed method is well suited for barley genotypes with differentiatedcanopy structures and therefore has the potential to be applied to other cereal crops, such as wheat.
In the process of determining lodging percentage in rice using structure, texture, and thermalinformation derived from UAV images, Liu et al. [44] and Yang et al. [45] obtained high R2 valuesgreater than 0.9. The accuracy of the lodging percentage determined from textural information,however, is strongly dependent on a trained support vector machine (SVM) and the dataset used.Changing illumination conditions during the flight, general illuminance, sun angle, shadow effects,plant development stages, and color variance between genotypes and species can influence the method.For that reason, the approach is not transferable without having to adapt the SVM to other datasets.The quantification of lodging from thermal images is also very challenging, because external factorssuch as small changes in wind speed and cloud cover strongly influence the derived canopy surfacetemperatures [47,59]. The temperature difference between lodged and nonlodged plants was quitelow, which can only be determined from image data recorded by precisely calibrated camera systemscombined with accurate processing from raw data to final products.
The lodging assessment based on RGB images to derive the relevant CH presented in this study isalmost independent from abiotic and external factors. Just a consumer RGB camera is needed, withoutthe demand for calibration. In general, only large canopy height variations within a field can causeproblems. In this extreme case, lower grown plants would be labeled as lodged plants. This issue,however, can be considered in the workflow by applying differentiated MAXCH values in areas withstrong CH variations caused, for example, by different soil or nutrition conditions.
An advantage of the newly developed WALS and ALS lodging severity parameters is that theyadditionally take CH variance into account and enable the quantification of yield impairment causedby lodging. Several studies only considered the presence or absence of lodging, and different lodgingseverities as illustrated in Figure 6, were treated equally [32,44,45,47]. Already Fischer and Stapper [39]and Berry and Spink [34] showed that the yield potential was influenced by the intensity of thepermanent displacement of crops from their upright position. Additionally, Murakami et al. [46]investigated the usability of UAV data to assess lodging and showed that the yield was strongerimpaired by higher lodging scores and low average CHs. Taking this into account, the novel WALSparameter was designed to consider the influence of lodging on yield. For the general lodging severityassessment the ALS parameter is adequate. However, to quantify the yield impairment caused bylodging, the LTP has to be weighted (WALS) to improve the prediction accuracy. In future studies, thefactors applied to lower LPTs (Equation (2)) should be weighted more strongly and compared to yielddata to investigate the potential in more detail.
The average difference of 12% between the lodging percentages derived from 70LPT and WALSof experimental site 1 illustrates the need to differentiate between the lodging percentage and lodgingseverity. Even though plots with high sowing density were partly strongly influenced by lodging,there was still variation between the different LPTs, resulting in a reasonable deviation between thetwo parameters (Table 3). This discrepancy between 70LPT and WALS decreased with less divergentLPTs, as ascertained for the farmer field of experimental site 2 (Table 4). The higher the deviationbetween LPTs was, the higher the difference between 70LPT and WALS. For the lodging severity ingeneral the ALS parameter is more objective without the weighting factors. However, for the yieldimpairment caused by lodging the LTP has to be weighted to improve the prediction.
The results showed finally, that detection of lodge areas was still possible with the lowest spatialresolution (1.57 cm GSD) from the highest flight altitude (100 m) without a substantial decline inaccuracy. Nevertheless, for very high accuracy, it is recommended to use images with higher spatialresolution (0.5 cm GSD), otherwise small patches with differentiated lodging severity will hardly bedetected and severity values will increase.
To summarize, the developed lodging assessment approach can be used for insurance applications,precision farming, and breeding research. In addition to selecting for genetic lines with higher lodging

Remote Sens. 2019, 11, 515 15 of 18
resistance, the different lodging severities and consequently yield impairments can be quantifiedas additional information. The approach additionally enabled determination of the recovery rateof crops. Navabi et al. [60] demonstrated on over 140 different wheat genotypes that the extent ofrecovery capability varied among genotypes. Similar results were found by Briggs [41] for barley.The pixel-based lodging severity information based on the WALS parameter, illustrated in Figure 6, canbe further used in precision farming to generate harvest maps and improve yield quality by avoidingareas in the harvest process that sprout again after heavy lodging events during the early stages ofplant development.
5. Conclusions
At present, UAV technology is widely used because the data acquisition is relatively easy, timely,flexible, and cheap. The acquired data can provide timely, detailed information on the current statusof plants, which is valuable for breeders, insurance companies, and farmers. Breeding trials areparticularly difficult to monitor on a regularly basis within a reasonable time, resulting in an increasingneed for faster selection of superior lines. The UAV-based CH assessment provides spatial informationon the canopy height distribution and offers much more information compared to the classical plantheight measurements of single spots in the field. The UAV-derived CH enables simplification ofa complex crop surface with an objective scale to estimate genetic effects. The presented lodgingassessment approach based on 3D canopy structure has many advantages over other methods, becauseit is more independent from external conditions, which increases its practicability. Furthermore, themethod makes it possible to estimate yield impairment caused by lodging. Future studies need to beconducted to evaluate the accuracy in more detail. Finally, it was shown that areas affected by lodgingcould be detected with high accuracy even at the lowest spatial resolution (1.57 cm GSD). The higherthe flight altitude is, the shorter the flight time, the smaller the number of recorded images, and theshorter the processing time. Therefore, fixed-wing UAVs, normally operated at higher altitudes tocover large areas, can be used for lodging assessment. This also substantially increases the practicabilityof the developed method, especially for large agricultural fields. Moreover, first steps were realized inthis study to use an airborne LIDAR DTM provided by national authorities as an alternative groundmodel for CHM generation. The comparison of the DTM with the UAV ground model demonstratedthat the DTM information can be used as a ground model and can help to reduce the effort in datacollection and processing. Further investigations are needed to evaluate the robustness of groundmodels derived from LIDAR data under different conditions and in different locations.
Author Contributions: Conceptualization: N.W., B.S., L.K., A.B., O.M., and U.R.; Designed the experiment: T.K.,O.M.; Data curation: N.W., B.S., A.B., and S.H.; Formal analysis: N.W., B.S., and A.B.; Funding acquisition: O.M.;Investigation: N.W. and T.K.; Methodology: N.W., B.S., L.K., A.B., and U.R.; Project administration: T.K. and O.M.;Supervision: B.S., L.K., A.B., O.M., and U.R.; Validation: N.W. and S.H.; Visualization: N.W.; Writing—originaldraft: N.W. and B.S.; Writing—review and editing: N.W., B.S., L.K., T.K., A.v.D., and U.R.
Funding: This study was performed within the German Plant Phenotyping Network (DPPN), which is fundedby the German Federal Ministry for Education and Research (BMBF), project identification number BMBF031A053. The work was additional supported by SPECTORS, which is funded by INTERREG V A-ProgrammDeutschland-Nederland, project identification number 143081.
Conflicts of Interest: The authors declare no conflict of interest.
References
1. Atzberger, C. Advances in remote sensing of agriculture: Context description, existing operational
monitoring systems and major information needs. Remote Sens. 2013, 5, 949–981. [CrossRef]
2. Siegmann, B.; Jarmer, T. Comparison of different regression models and validation techniques for the
assessment of wheat leaf area index from hyperspectral data. Int. J. Remote Sens. 2015, 36, 4519–4534.
[CrossRef]
3. Burkart, A.; Hecht, V.L.; Kraska, T.; Rascher, U. Phenological analysis of unmanned aerial vehicle based time
series of barley imagery with high temporal resolution. Precis. Agric. 2017, 19, 134–146. [CrossRef]

Remote Sens. 2019, 11, 515 16 of 18
4. Gómez-Candón, D.; De Castro, A.I.; López-Granados, F. Assessing the accuracy of mosaics from unmanned
aerial vehicle (UAV) imagery for precision agriculture purposes in wheat. Precis. Agric. 2014, 15, 44–56.
[CrossRef]
5. Zhang, C.; Kovacs, J.M. The application of small unmanned aerial systems for precision agriculture: A review.
Precis. Agric. 2012, 13, 693–712. [CrossRef]
6. Candiago, S.; Remondino, F.; Giglio, M.; De Dubbini, M.; Gattelli, M. Evaluating Multispectral Images and
Vegetation Indices for Precision Farming Applications from UAV Images. Remote Sens. 2015, 7, 4026–4047.
[CrossRef]
7. Grenzdörffer, G.; Engel, A.; Teichert, B. The photogrammetric potential of low-cost UAVs in forestry and
agriculture. Int. Arch. Photogramm. Remote Sens. Spat. Inf. Sci. 2008, 1, 1207–1213. [CrossRef]
8. Eling, C.; Wieland, M.; Hess, C.; Klingbeil, L.; Kuhlmann, H. Development and evaluation of a UAV based
mapping system for remote sensing and surveying applications. Int. Arch. Photogramm. Remote Sens. Spat.
Inf. Sci. ISPRS Arch. 2015, 40, 233–239. [CrossRef]
9. Mancini, F.; Dubbini, M.; Gattelli, M.; Stecchi, F.; Fabbri, S.; Gabbianelli, G. Using unmanned aerial vehicles
(UAV) for high-resolution reconstruction of topography: The structure from motion approach on coastal
environments. Remote Sens. 2013, 5, 6880–6898. [CrossRef]
10. Hodgson, J.C.; Baylis, S.M.; Mott, R.; Herrod, A.; Clarke, R.H. Precision wildlife monitoring using unmanned
aerial vehicles. Sci. Rep. 2016. [CrossRef] [PubMed]
11. Dandois, J.P.; Ellis, E.C. High spatial resolution three-dimensional mapping of vegetation spectral dynamics
using computer vision. Remote Sens. Environ. 2013. [CrossRef]
12. Turner, D.; Lucieer, A.; Watson, C. An automated technique for generating georectified mosaics from
ultra-high resolution Unmanned Aerial Vehicle (UAV) imagery, based on Structure from Motion (SFM) point
clouds. Remote Sens. 2012, 4, 1392–1410. [CrossRef]
13. Colomina, I.; Molina, P. Unmanned aerial systems for photogrammetry and remote sensing: A review.
ISPRS J. Photogramm. Remote Sens. 2014, 92, 79–97. [CrossRef]
14. Chu, T.; Starek, M.J.; Brewer, M.J.; Murray, S.C.; Pruter, L.S. Assessing lodging severity over an experimental
maize (Zea mays L.) field using UAS images. Remote Sens. 2017, 9, 923. [CrossRef]
15. Bendig, J.; Bolten, A.; Bareth, G. UAV-based Imaging for Multi-Temporal, very high Resolution Crop Surface
Models to monitor Crop Growth Variability. Photogramm.-Fernerkund.-Geoinf. 2013, 6, 551–562. [CrossRef]
16. Li, Z. On the measure of digital terrain model accuracy. Photogramm. Rec. 1988. [CrossRef]
17. Podobnikar, T. Methods for visual quality assessment of a digital terrain model. Surv. Perspect. Integrating
Environ. Soc. 2009, 1, 1–24. [CrossRef]
18. Hirt, C. Digital Terrain Models; Springer International Publishing: Berlin, Germany, 2014; pp. 1–6. [CrossRef]
19. Kraus, K.; Briese, C.; Attwenger, M.E.; Pfeifer, N. Quality Measures for Digital Terrain Models; The International
Archives of the Photogrammetry, Remote Sensing and Spatial Information Sciences: Hannover, Germany,
2004.
20. Anthony, D.; Elbaum, S.; Lorenz, A.; Detweiler, C. On crop height estimation with UAVs. In Proceedings of
the 2014 IEEE/RSJ International Conference on Intelligent Robots and Systems, Chicago, IL, USA, 14–18
September 2014.
21. De Souza, C.H.W.; Lamparelli, R.A.C.; Rocha, J.V.; Magalhães, P.S.G. Height estimation of sugarcane using
an unmanned aerial system (UAS) based on structure from motion (SfM) point clouds. Int. J. Remote Sens.
2017. [CrossRef]
22. Stanton, C.; Starek, M.J.; Elliott, N.; Brewer, M.; Maeda, M.M.; Chu, T. Unmanned aircraft system-derived crop
height and normalized difference vegetation index metrics for sorghum yield and aphid stress assessment.
J. Appl. Remote Sens. 2017. [CrossRef]
23. Chu, T.; Starek, M.J.; Brewer, M.J.; Masiane, T.; Murray, S.C. UAS imaging for automated crop lodging
detection: A case study over an experimental maize field. SPIE Commer. Sci. Sens. Imaging 2017. [CrossRef]
24. Holman, F.H.; Riche, A.B.; Michalski, A.; Castle, M.; Wooster, M.J.; Hawkesford, M.J. High throughput field
phenotyping of wheat plant height and growth rate in field plot trials using UAV based remote sensing.
Remote Sens. 2016, 8, 1031. [CrossRef]
25. Bendig, J.; Yu, K.; Aasen, H.; Bolten, A.; Bennertz, S.; Broscheit, J.; Gnyp, M.L.; Bareth, G. Combining
UAV-based plant height from crop surface models, visible, and near infrared vegetation indices for biomass
monitoring in barley. Int. J. Appl. Earth Obs. Geoinf. 2015, 39, 79–87. [CrossRef]

Remote Sens. 2019, 11, 515 17 of 18
26. Bendig, J.; Bolten, A.; Bennertz, S.; Broscheit, J.; Eichfuss, S.; Bareth, G. Estimating biomass of barley using
crop surface models (CSMs) derived from UAV-based RGB imaging. Remote Sens. 2014, 6, 10395–10412.
[CrossRef]
27. Adamchuk, V.I.; Ferguson, R.B.; Hergert, G.W. Soil Heterogeneity and Crop Growth. In Precision Crop
Protection-the Challenge and Use of Heterogeneity; Oerke, E.-C., Gerhards, R., Menz, G., Sikora, R.A., Eds.;
Springer: Dordrecht, The Netherlands, 2010; pp. 3–16. ISBN 978-90-481-9277-9.
28. Shanahan, J.F.; Schepers, J.S.; Francis, D.D.; Varvel, G.E.; Wilhelm, W.W.; Tringe, J.M.; Schlemmer, M.R.;
Major, D.J. Use of remote-sensing imagery to estimate corn grain yield. Agron. J. 2001. [CrossRef]
29. Mulla, D.J. Twenty five years of remote sensing in precision agriculture: Key advances and remaining
knowledge gaps. Biosyst. Eng. 2013. [CrossRef]
30. Hansen, P.M.; Schjoerring, J.K. Reflectance measurement of canopy biomass and nitrogen status
in wheat crops using normalized difference vegetation indices and partial least squares regression.
Remote Sens. Environ. 2003. [CrossRef]
31. Bareth, G.; Aasen, H.; Bendig, J.; Gnyp, M.L.; Bolten, A.; Jung, A.; Michels, R.; Soukkamäki, J. Low-weight and
UAV-based Hyperspectral Full-frame Cameras for Monitoring Crops: Spectral Comparison with Portable
Spectroradiometer Measurements. Photogramm.-Fernerkund.-Geoinf. 2015. [CrossRef]
32. Bendig, J.V. Unmanned Aerial Vehicles (UAVs) for Multi-Temporal Crop Surface Modelling. Ph.D. Thesis,
Universität zu Köln, Cologne, Germany, 2015.
33. Aasen, H.; Burkart, A.; Bolten, A.; Bareth, G. Generating 3D hyperspectral information with lightweight
UAV snapshot cameras for vegetation monitoring: From camera calibration to quality assurance. ISPRS J.
Photogramm. Remote Sens. 2015. [CrossRef]
34. Berry, P.M.; Spink, J. Predicting yield losses caused by lodging in wheat. Field. Crops Res. 2012, 137, 19–26.
[CrossRef]
35. Rajapaksa, S.; Eramian, M.; Duddu, H.; Wang, M.; Shirtliffe, S.; Ryu, S.; Josuttes, A.; Zhang, T.; Vail, S.;
Pozniak, C.; et al. Classification of Crop Lodging with Gray Level Co-occurrence Matrix. In Proceedings
of the 2018 IEEE Winter Conference on Applications of Computer Vision (WACV) (2018), Lake Tahoe, NV,
USA, 12–15 March 2018. [CrossRef]
36. Peng, D.; Chen, X.; Yin, Y.; Lu, K.; Yang, W.; Tang, Y.; Wang, Z. Lodging resistance of winter wheat (Triticum
aestivum L.): Lignin accumulation and its related enzymes activities due to the application of paclobutrazol
or gibberellin acid. Field. Crop. Res. 2014. [CrossRef]
37. Pinthus, M.J. Lodging in Wheat, Barley, and Oats: The Phenomenon, its Causes, and Preventive Measures.
Adv. Agron. 1974. [CrossRef]
38. Weibel, R.O.; Pendleton, J.W. Effect of Artificial Lodging on Winter Wheat Grain Yield and Quality (AJ).
Agron. J. 1964, 48, 452–455. [CrossRef]
39. Fischer, R.A.; Stapper, M. Lodging effects on high-yielding crops of irrigated semidwarf wheat.
Field. Crop. Res. 1987, 17, 245–258. [CrossRef]
40. Berry, P.M.; Sterling, M.; Spink, J.H.; Baker, C.J.; Sylvester-Bradley, R.; Mooney, S.J.; Tams, A.R.; Ennos, A.R.
Understanding and Reducing Lodging in Cereals. Adv. Agron. 2004, 84, 215–269.
41. Briggs, K.G. Several Six-Row Barley Cultivars. AGRIS 1990, 181, 173–181. [CrossRef]
42. Grant, B.L. Types of Plant Lodging: Treating Plants Affected by Lodging. Available online: https://www.
gardeningknowhow.com/edible/vegetables/vgen/plants-affected-by-lodging.htm/?print=1&loc=top
(accessed on 28 January 2019).
43. Susko, A.Q.; Gilbertson, F.; Heuschele, D.J.; Smith, K.; Marchetto, P. An automatable, field camera track
system for phenotyping crop lodging and crop movement. HardwareX 2018, 4. [CrossRef]
44. Liu, T.; Li, R.; Zhong, X.; Jiang, M.; Jin, X.; Zhou, P.; Liu, S.; Sun, C.; Guo, W. Estimates of rice lodging using
indices derived from UAV visible and thermal infrared images. Agric. For. Meteorol. 2018, 252, 144–154.
[CrossRef]
45. Yang, M.D.; Huang, K.S.; Kuo, Y.H.; Tsai, H.; Lin, L.M. Spatial and spectral hybrid image classification for
rice lodging assessment through UAV imagery. Remote Sens. 2017, 9, 583. [CrossRef]
46. Murakami, T.; Yui, M.; Amaha, K. Canopy height measurement by photogrammetric analysis of aerial images:
Application to buckwheat (Fagopyrum esculentum Moench) lodging evaluation. Comput. Electron. Agric.
2012, 89, 70–75. [CrossRef]
Remote Sens. 2019, 11, 515 18 of 18
47. Chapman, S.; Merz, T.; Chan, A.; Jackway, P.; Hrabar, S.; Dreccer, M.; Holland, E.; Zheng, B.; Ling, T.;
Jimenez-Berni, J. Pheno-Copter: A Low-Altitude, Autonomous Remote-Sensing Robotic Helicopter for
High-Throughput Field-Based Phenotyping. Agronomy 2014, 4, 279–301. [CrossRef]
48. Michael, P.M. Predicting Lodging in Winter Wheat. Ph.D. Thesis, University of Nottingham, Nottingham,
UK, 1998.
49. Simko, I.; Piepho, H.P. Combining phenotypic data from ordinal rating scales in multiple plant experiments.
Trends Plant Sci. 2011, 16, 235–237. [CrossRef] [PubMed]
50. Wilke, N.; Siegmann, B.; Burkard, A.; Klingbeil, L.; Rascher, U. Quantifizierung der Ährenanzahl mittels
UAV gestützter Bildaufnahmen. Wissenschaftlich-Technische Jahrestagung der DGPF und PFGK18 Tagung in
München 2018, 38, 274–284.
51. Burkart, A.; Aasen, H.; Alonso, L.; Menz, G.; Bareth, G.; Rascher, U. Angular dependency of hyperspectral
measurements over wheat characterized by a novel UAV based goniometer. Remote Sens. 2015, 7, 725–746.
[CrossRef]
52. Bláha, M.; Eisenbeiss, H.; Grimm, D.; Limpach, P. Direct georeferencing of uavs. ISPRS Int. Arch. Photogramm.
Remote Sens. Spat. Inf. Sci. 2012. [CrossRef]
53. Agisoft, L.L.C. Agisoft Agisoft PhotoScan User Manual. Available online: http://www.agisoft.ru/pscan/
help/en/pscan_pro.pdf (accessed on 3 May 2011).
54. Lowe, D.G. Distinctive image features from scale-invariant keypoints. Int. J. Comput. Vis. 2004, 60, 91–110.
[CrossRef]
55. Kersten, T.P. Auf Knopfdruck–Auswertung und Resultate UAV-gestützter Bildflugdaten. UAV
2016-Vermessung Mit Unbemannten Flugsystemen Schriftenr. Des DVW 2016, 82, 135–158.
56. Westoby, M.J.; Brasington, J.; Glasser, N.F.; Hambrey, M.J.; Reynolds, J.M. ‘Structure- from- Motion’
photogrammetry: A low- cost, effective tool for geoscience applications. Geomorphology 2012, 179, 300–314.
[CrossRef]
57. Danielgm.net CloudCompare: 3D Point Cloud and Mesh Processing Software, Open Source Project. Available
online: http://www.danielgm.net/cc/ (accessed on 3 December 2018).
58. Land NRW: Datenlizenz Deutschland - Namensnennung - Version 2.0. Available online: www.govdata.de/
dl-de/by-2-0 (accessed on 3 January 2019).
59. Jackson, R.D.; Hatfield, J.L.; Reginato, R.J.; Idso, S.B.; Pinter, P.J. Estimation of daily evapotranspiration from
one time-of-day measurements. Agric. Water Manag. 1983. [CrossRef]
60. Navabi, A.; Iqbal, M.; Strenzke, K.; Spaner, D. The relationship between lodging and plant height in a diverse
wheat population. Can. J. Plant Sci. 2006, 86, 723–726. [CrossRef]
© 2019 by the authors. Licensee MDPI, Basel, Switzerland. This article is an open access
article distributed under the terms and conditions of the Creative Commons Attribution
(CC BY) license (http://creativecommons.org/licenses/by/4.0/).