quantifying management's role in bank survival - dallas … · quantifying management's...
TRANSCRIPT
Thomas F. SiemsSenior EconomistFederal Reserve Bank of Dallas
Quantifying Management's Rolein Bank Survival
Banking liter~lture often cites mismanagementas the most imporunt cause of bank failures.
Pantalone and Platt ( 19i"i7l state that "it is themanagement of the hank that determines success orfailure Most often, hanks fail hecause they havechosen paths that are excessively risky for thereturns that they receive and hecause these pathsmake them particularly vulnerahle to adverseeconomic conditions." Sehallos and Thomson(1(90) recently wrote that "the ultimate determinantof whether or not a hank fails is the ability of itsmanagement to operate the institution efficientlyand to e\'aluate and m~lllage risk" Additionally. in astudy hy the Office of the Comptroller of theCurrency to uncover specific reasons for bankfailures, Graham and Horner (1988) concluded that"the difference hetween the f~liled hanks and thosethat remained healthy or recovered from problemswas the caliber of management.·'
No specific quantit~ltive measure currentlyexists to assess the quality of hank management.Rather. generally bank examiners regularly \'isithanks and conduct on-site examinations to assessthem. From these examinations. examiners givehanks a CAVlHf, rating. which is an overall evaluation of a bank's health and is an acronym basedon the follOWing five factors:
Capital adequacy,A<;set quality.Management qu~dity,
Earnings ability. andLiquidity.
use of CAMEL factors in evaluating a hank's healthhas become widespread because of hoth itssimplicity and use hy regulators.
Financial data and relationships are the principal ingredients for scoring capital, asset quality,earnings, ;ll1d liquidity. Assessing managementquality, however, is considered qualitative andtherefore requires professional judgment of a bank'scompliance with policies and procedures, aptitudefor risk-taking, development of strategic plans, andthe degree of involvement hy the bank's officersand directors in the decisionmaking process.
In this article. I present a new model toquantitatively measure bank management quality.This model considers the essential intermediationfunctions of a hank and uses multiple inputs andoutputs to compute a scalar measure of efficiency.[ compute the dficiency metric, a proxy formanagement quality, using a linear programmingtechnique known as data enuelopment ana~Y:-il's
(OEA). DEA has been used successfully to providea new definition of efficiency in many applications.including schools (Bessent and others 1982),courts (Lewin. Morey, and Cook 1982), strip mines(Hyrnes, Eire, and Grosskopf 1984), and healthcare (Nunamaker 19H'S and Sherman 1984).
I huilt the efficiency model presented in thisarticle on the notion of using the metric as avariable in a bank-failure prediction equation.Given that we wish to differentiate banks that failfrom those that survive, I include in the modelvariables that I believe capture the importance of
Examiners score each of these factors as a singlenumber from one to five. with one being thestrongest rating, and develop an overall CAMELrating from one to five from the factor scores. The
I wish to thank Robert T. Clair, Gerald P O'Oriscoll, and
Kevin J Yeats for helpfUl comments and suggestions Any
remaining errors are solely my responsibility
Economic Review - January 1992 29
This publication was digitized and made available by the Federal Reserve Bank of Dallas' Historical Library ([email protected])

management in a bank's survival, that is, thenecessary input allocation and product mixdecisions needed to acquire deposits and subsequently make loans and investments. While thismetric, which is based strictly on publicly availablefinancial information, may not replace an examiner'sassessment of management completed during anon-site examination, it can assist examiners asan early warning tool. I
While others may disagree with my choiceof input and output variables for this model, theempirical results support the argument that management quality is very important to a bank's survivaV
The importance of management
An institution's management quality isimportant to its long-term survival Cates (985)states, "[Blank failure, which affects only a handfulof banks, is caused by mismanagement; mismanagement, furthermore, of the basic, old-fashionedrisks of banking like lending, liquidity, and control ,.Bank managers make the decisions and fashionthe plans that define the direction for the institution. Management determines allocation of thebank's resources, establishes the internal controlsand procedures, organizes strategic plans, andresponds to changes in the external environment.
Because banks operate in a competitive,uncertain, changing environment, bank managersmust learn to deal with and manage the inherentrisks. As Kaufman (986) states, "[Tlo survive in arisky world, banking firms must cope with riskand manage it."
I Siems (1991) found the management qualily metric to be ahighly slgmficant variable In both one-year-ahead (twelve
month to eighteen-month) and two-year-ahead (twenty
four-month to thirty-month) bank-failure prediction models
Furthermore, the predictive accuracy of these models sig
nificantly improved with the inclusion of this variable
2 The objective is not so much the theoretical development of
a model to prove efficiency but rather the construction of ameasure to help distinguish banks that survive from those
that fail The model developed herein is a useful proxy for
management quality because the variables focus on bank
management's basic allocation. control, and product mix
decisions
30
Measuring bank management quality
To proxy bank management quality, Ipresent a model to measure the efficiency bywhich management can transform inputs intooutputs. I built the model on the notion of usingthe measure to help discriminate banks thatsurvive from those that fail. Hence, the modelincludes variables that are most descriptive ofmanagement's decisionmaking role in a bank'sintermediation process.
Because of the multitude of functionsperformed and decisions made by management, adescriptive model of bank management qualitymust contain several inputs and outputs. Singleratios, such as total operating income divided bytotal operating expense, suffer from severallimitations. For example, while such ratios mayprovide an overall measure of operational efficiency, they fail to indicate the resource allocationand product decisions made by managementbecause the numerator and denominator areaggregate measures.
Moreover, when several nonaggregatedsingle input-output ratios are used to assess themyriad of decisions made by management, theratios collectively present a morass of numbersthat give no clear evidence of the efficiency of abank. One ratio may show that the bank is highlyefficient, while another displays a highly inefficientoperation. Sexton (986) argues that such ambiguitymakes ratio analysis ineffective in measuring trueefficiency.
Clearly, a model that captures bank management's allocation and control decisions is needed.Such a model requires the identification of severalinputs and outputs. What are the allocation andcontrol decisions that managers make to operatea bank?
Essential functions in banking
The banking industry has changed over theyears, but the functions of operating as a financialintermediary have remained basically unchanged.For the model presented herein, commercial banksare represented in a two-stage process in whichthey first acquire deposits and then bundle togetherthese monies to make loans and investments.
In a manner similar to that of Berg, Forsund,
Federal Reserve Bank of Dallas

Figure 1Commercial Bank Decisionmaking Model: Two-Stage Representation
tI
..-~.~~------.---_ ..._..... -..... _..
Full-Time Equivalent EmployeesSalary ExpensesPremises and Fixed AssetsOther Noninterest Expenses
Sla98 2; --- EamlflQ AssetsMaKe
LQans and --- Total In aOlSI Income
Investments
/ .. - .__..--_ _ _-_ ...
...----"-,Stage 1 Core Deposits @
'-
_A_nrad_--, . _OI=h:.;e,..:Oe=IlOS'=ts:....- C:;:lS -------Oepo<.1S -
I I-----------'
Total InterestExoense
PurchasedFunds
and Jansen (989), the model interprets depositsas intermediary outputs, which is also consistentwith the view advocated by Kolari and Zardkoohi(1987). This two-stage representation aids ininterpretation because deposits are produced inthe first stage and used as inputs to the production of loans and investments in the second stage.
A new model to measure bankmanagement quality
I have identified a subset of inputs (resources) and outputs (products and services) thatI believe model the quality of commercial bankmanagement from a failure-prediction perspective.That is, the model includes certain inputs andoutputs that I feel are critically important to themanagement of a bank. 5
Considering again the two main functions ofa bank-acquiring deposits and making loans andinvestments-I developed a two-stage model thatemploys multiple inputs and outputs to assessmanagement efficiency. As Figure 1 shows, bothstages utilize four inputs that primarily representoperating expenses. These four inputs are thenumber of full-time equivalent employees, salaryexpenses, value of premises and fixed assets, andother noninterest expenses as reported on abank's Consolidated Report of Condition andIncome to its primary regulator. The operation ofall bank activities involves labor, materials,
machines, and buildings, and managementcertainly has a great deal of discretion concerningthe allocation of these resources.
Management determines the number ofemployees needed to perform desired functions ata desired level of service. They establish salarylevels, and they determine the types of facilities tobuild, where to build them, and how to furnishand operate them.4 Management also decides(possibly as a result of previous decisions) whatother noninterest expenses to incur, such as legal
3 The number of DEA efficiency models applied to banking
are relatively few and recent. In general. researchers have
developed models to measure either the relative efficiencyof bank branches or the overall efficiency of the banking
industry Charnes and others (1990), Berg, Forsund, andJansen (1989), Rangan and others (1988), Parkan (1987),
and Sherman and Gold (1985) provide five different DEAmodels applied to banking Another useful reference
concerning efficiency in banking is Evanoff and fsrailevich(1991), in which they discuss the concept ofefficiency and
define the means to measure it Their article also includesa review of relevant literature regarding inefficiency in the
banking industry
4 Some of these input factors, such as salary expenses, arelargely determined by market forces, however. bank man·agement ultimately makes decisions regarding the overall
level of salaries, which can influence past-due collections,loan portfolio quality decisions, etc
Economic Review-January 1992 31

assistance and administrative expenditures relatedto maintaining and liquidating foreclosed realestate and other assets.
Another input associated with acquiringdeposits in stage one is total interest expense.Management establishes the types of deposits theywish to attract and the interest rate levels offeredto depositors. \V'hile interest rates are largelyinfluenced by market forces and monetary policy,management makes decisions regarding thecomposition of deposits, which directly influencestotal interest expenditures.
Purchasedfunds, the final input in themodel, represents funds needed in addition to allother deposits to adequately service the bank'sinvestments and provide needed liquidity.) Highpurchased funds signal that management has notattracted enough stable or core deposits for thevolume of loans it is currently servicing. Whenthis happens, the bank must buy funds andsubject itself to increased liquidity risk.!>
Humphrey (1991) argues that the user costsof demand deposits, small time and savings deposit,>,and purchased funds must be included as appropriate inputs along with labor and physical capital.He states that operating costs are less than onethird of total banking costs at typical banks andtherefore do not give an overall picture of productivity in banking. Other models that show purchasedfunds as an appropriate banking input includeRangan and others (1988) and Triplett (1991).
The obvious output from the first stage ofthe model is total deposits. For a bank, depositscan be considered as either an input or an output.In this model, core deposits are interpreted as anintermediary output These are relatively stabledeposits obtained by the bank. Finally, the second
5 Purchased funds include federal funds purchased and
securities sold under agreements to repurchase, demand
notes issued to the U S Treasury. other borrowed money,
lime certificates of deposit of $100,000 or more, and open
account time deposits of $100,000 or more
, In addition, Gunther (1989) states that "a high reliance on
purchased or wholesale funds, such as large certificates of
deposit, federal funds purchased, and securities sold un
der agreement to repurchase, is often associated with high
asset growth and aggressive lending strategies "
32
stage has two outputs: earning assets, whichinclude all interest-earning assets, and totalinterest income.
The outputs in this new model also appear tobe a direct result of management's decisions. Coredeposits represent stable funds desired by theorganization for lending and investment purposes.Earning assets and total interest income result frommanagement's decisions regarding where to investfund'>. Management makes decisions concerning therelative riskiness of each asset in which it invest').
The most etTicient banks allocate resourcesand control internal processes by effectivelymanaging the number of employees, salaryexpenses, facilities, other noninterest expenses,total interest expenses, and purchased funds whileworking to maximize core deposits, earning assets,and total interest income. To do this, efficient bankmanagers establish controls and procedures thatkeep operating expenses relatively low while stillattracting an adequate volume of core deposits(so that purchased funds remain low).
Prudent managers also devise loan policiesthat discriminate creditworthy borrowers fromthose in danger of default to increase the value ofearning assets and operating income. By evaluating the riskiness of potential loans, management isbetter able to choose which loans to make. Failedbanks historically exhibited more lending problems (that is, mismanagement of the loan portfolio) than other operating inefficiencies. Grahamand Horner (1988) found that 86 percent of thefailed banks they studied had inappropriatelending policies, including liberal repaymentterms, collection practices, or credit standards
Overall, bank managers must integratepolicies and techniques for managing the moneyposition, providing liquidity, lending profitably,and investing rationally in a practical asset/liabilitymanagement framework. The most efficient banksdo this by controlling operating expenses, managinginterest rate sensitivity, utilizing risk managementtechniques, and strategically planning for the bankand its markets for the future.
Quantifying bank management quality
Data envelopment analysis computes abank's efficiency in transforming inputs intooutputs, relative to its peers. First developed by
Federal Reserve Bank of Dallas

Charnes, Cooper, and Rhodes (978), who builton the concept of technical efficiency by Farrell(957), DEA provides a new definition of efficiency DEA is a linear programming techniquethat converts multiple inpurs and outputs into ascalar measure of efficiency.' This conversion isaccomplished by comparing the mix and volumeof services provided and the resources used byeach bank compared with all other banks. Eachbank is evaluated against a hypothetical bankwith an identical output mix that is constructed asa combination of efficient banks.
DEA identifies the most efficient banks in apopulation and provides a measure of inefficiencyfor all others. The most efficient banks are rated ascore of one, while the less efficient institutionsscore between zero and one. DEA does not give ameasure of optimal efficiency; it '''ill only differentiate the least efficient banks from the set of allbanks (even where all hanks might be inefficient).Thus, the efficient institutions calculated usingDEA establish the best practice frontier.
DEA was designed specifically to measurerelative efficiency using multiple inputs andoutputs with no a priori infonnation regardingwhich inputs and outputs are most important indetermining an efficiency score. The relativeefficiency of a bank is defined as the ratio of itstotal weighted output to its total weighted input.Mathematically, this is represented as
.'L, u,kOUFPUT,k
EFFICIENCY I, =-'~-~-,----L,viJNPUF".;=1
where It ... is the unit weight placed on output rand Vi. is the unit weight placed on input i by thekth bank in a population of banks Using thisnotation, there are s output variables and m inputvariables used to calculate efficiency.
Now, how should the weights (the u's andv's) be selected? DEA selects the weights thatmaximize each bank's efficiency score as long asno weight is negative and the weights are universal (that is, any bank should be able to use thesame set of weights to evaluate its own efficiencyratio, and the resulting ratio must not exceedone). That is, for each bank, DEA will maximizethe ratio of its own weighted output to its own
Economic Review -January 1992
weighted input. In general, banks will have higherweights on those inputs that it uses least andthose outputs that it produces most.H
Graphical representation of DEA
In this section, I illustrate graphically a smallproblem VisualiZing the concepts underlying DEAwill assist with its interpretation for larger andmore complex problems
Consider five banks, each using one input to
produce two outputs. Table 1 shows the levels ofthe input required to produce the outputs foreach bank. Single inpUHJutput analyses can beused to characterize each bank using the singleinput (INPUT
j) and the two outputs (OUTPUT]
and OUTPUT).? In fact, by normalizing eachoutput relative to the level of input required toproduce it, each bank can be graphically represented in a two-dimensional space, as Figure 2shows. In this figure, each bank is represented bya point whose coordinates are simply the normalized output levels shown in Table 1.
Any hank located both above and to theright of another bank is clearly more efficient,because it is producing higher levels of both
1 See Seiford (1990) for an eXlensive bibliography of DEA
related publicatIons
8 The DEA model for a specific bank can be formulated as a
linear fractional problem. which can be eaSilY solved if it is
transformed into an equivalent linear program in which the
bank's input and output weights are the decision variables
A complete DEA solution requires that one such linear
program be solved for each bank See Barr and Siems
(1991a) for technical details regarding the mathematical
formulation of DEA
9 While ratios can provide useful information aboutefficiency,
they fail to accommodate multiple inputs and outputs when
accurate objective weights for the inputs and outputs are
not known tn this example, ifOUTPUT/INPUT, was the only
ratio used to measure efficiency, bank A would be rated as
the least efficient and bank C as the mosl efficient Ifmanagement decided to measure efficiency by using aweight of 0 8 for OUTPUT/INPUT, and 02 for OUTPUT/
INPUT,> then bank A would be rated as the most efficienl
and bank C as the second least efficient Clearly, with more
inputs and outputs the task of measuring efficiency in this
manner becomes even more complex and subjective
33

Table 1Sample Data for DEA Example
Bank INPUT, OUTPUT, OUTPUT2OUTPUT/INPUT, OUTPUT/INPUT,
A 5 25 10 5 2B 6 24 24 4 4C 8 16 40 2 5D 4 16 12 4 3E 7 7 21 1 3
Output/Input,
Figure 2Normalized Output Levels for Five Banks
\\ hich is ~l theoretical point on the rmntier havingthc' s~lme output mix as the hank under e\'aluation. The efficiency score for each envelopedhank is simply the ratio of the actu~i1 output levelsrml11 the hank to the theoretical k'\'c!s of itshypothetical comparison hank,
Figure 4 sho\\'s ho\\' the en iciency scores arecomputed for each hank. Each h~lnk that formsthe frontier (for example. hanks /\. B. and C) has
outputs while using the same 1<.:\'(.:'1 of input.Figure 3 sh(l\\ s th~lt hanks A. B. and C define theefficient frontier (representcd hy the thick. hlackline) as a piccewise linear curve These hankshave the property that no other hank is supcrioron both dimensions
Every l);Ink is in one of three places: on theefficient frontier. on one of the extensions frol11 thefrontier to one of the axes. or some\\'here hem'eenthe origin and the frontier A hank on an extension is called a lI'mkl)' cllicicllt hank That is. thehank \\'ill han' an efficiency score of one. hut it isnot technically on the clTicicnt frontier hecauseanother hank is superior on at least one dimension.Banks that arc inside the piece\vise linear curvethat forms the efficient frontier (including theextensions) arc CIlIY>/O!)cc!; hence this analyticaltechnique is called data ClllYl/opment ana/)'si.\~
Each hank gets an efficiency score in termsof its position relative to the frontier. 1" Banks onthe frontier arc the !Jcs/ JJILlc/icC' firms. \yhich usccurrent technologies and mdhods in the hankingindustry most efficiently ~l11d therefore hm'edliciency scores of one. Each enveloped hank iscompared with a hypothetical comparison hank.
6
5
3
2
1\•o e• •
c•m Efficiency, as used here refers to a bank's ability to trans
form a set of inputs into a set of outputs This ability differs
from models designed to measure profit maximization A
bank might be able to increase proMs by changing J/s
product miX but thiS change may not necessarily make the
bank more efficient given the mputs and outputs selected
for this model
o
E•2 3 4
Outputilnput,
5 6
34 Federal Reserve Bank of Dallas

Figure 3DEA Efficient Frontier
Figure 4Efficiency Scores for Banks 0 and E
Output/Input, Output/I nput,
6 6
s.---------l.....AAy
s.-------tL..
E'
4
3
2
o
E•X
2 3 5 6
Output ;Input,
3
2
.. ,..,.. '.. '
2 3
Oulpu Input
5 6
an efficiency score of one. The efficiency score forbank D is 0.92, a number between zero and onethat is the ratio of the distance of line segmentOD (5.00) to line segment OD' (5.45).11 BecauseD' (the hypothetical comparison hank for hank D)is on line segment AB, hanks A and 13 form theefficiency reference set for hank D. Clearly, onlyefficient banks can compose the efficiencyreference set for an inefficient hank.
Similarly, the efficiency score for hank E is0.60 and is computed by taking the ratio of OE toOE'. Obviously, bank E is the most inefficient of thefive banks. Epstein and Henderson (989) point outthat "the concepts of data envelopment, efficientfrontier, efficiency score, efficiency reference set,and hypothetical comparison unit are easily extended to higher dimensions and are thus applicahlein a multiple-input, multiple-output context."
feasible. In other words, any point along thepiecewise linear curve is assumed feasible eventhough there may not be a bank at that particularpoint on the frontier. Sexton (986) argues that"this assumption is questionable when there areonly a small numher of production technologiesfrom which to choose and where such weightedaverages have no counterpart in reality." In otherwords, it may not be reasonable to assume thathank D could change its input or output mix tomove to point D' on the frontier. It may be easierfor bank D to move toward point 13, because thisis a known feasible point on the frontier. Themost optimal path for an inefficient institution tohecome efficient is an area for future research.
Second, in Figure 3 the efficient frontier wasextended vertically from point C to point X andhorizontally from point A to point Y. Other
Some limitations of DEA
Several assumptions are made in evaluatinghanks in this manner. First, hypothetical hanks,like point D' in Figure 4, are assumed to he
., See Barr andSiems (1991a) for mathematical computations
to calculate individual efficiency scores using the OEA
linear programming formulation
Economic Review - January 1992 35

8
Output/Input,
Figure 5Efficient Frontier Change fromDropping Bank C from the Population
efficient frontier to change. For example, as Figure5 shows, if bank C were dropped from the set ofbanks, only banks A and B would form theefficient frontier. Furthermore, bank E's efficiencyscore would improve from 0.60 to 0.75 becausethe efficient frontier (and its extension to thehorizontal axis) is closer to bank E with theremoval of bank C. Similar comments apply ifnew banks are added to the analysis; if newbanks become part of the frontier, existing banksmay have their efficiency scores altered.
The value of DEA to banking
Bank managers and regulators can use DEAin several important ways. First, the DEA efficiency scores can identify the banks that need themost attention. The least efficient banks can beanalyzed on-site more thoroughly to identifyspecific problems.
Second, for all banks with less-than-perfectefficiency scores, a subset of efficient banks--theeffiCiency reference set--exists. From this infonl1ation, managers and regulators can formulatestrategies to improve the less-than-efficient banks.The DEA results allow an analyst to build atheoretical or hypothetical bank that uses fewerinputs than the inefficient bank but produces thesame outputs, thereby increasing the bank'sefficiency.
Third, DEA can help identify efficient banksthat are managed differently from most otherbanks because they use an unconventionalmixture of inputs or produce a different mixtureof outputs. Additional in-depth analyses of thesebanks may help identify some underlying managerial techniques that could improve the performance of other banks.
65
c•..................
2 3
Quip Input
2
5i---------;a..
methods of forming the outer edges of the frontiercould result in much different efficiency scores forbanks near the outer areasY Additionally, using aray out of the origin to measure efficiency is justone way to compute efficiency.13
Third, the efficiency scores for each bankare computed relative to all other banks underevaluation. Changes in the number of banks inthe population and changes in the set of inputand output variables in the model can cause the
3
4
Management quality in survivingand failed banks
12 Banks near the outer edges emphasize certain inputs and
outputs to a greater degree than others Because of distor
tions that this emphasis can create in computing efficiency
scores. a minimum levelofa given input oroutputmayneed
to be specified before including a bank in the population
13 I have presented here the original approach in measuring
overall efficiency (see Charnes, Cooper, and Rhodes 1978)
Seiford and Thrall (1990) describe many recent develop
ments in DEA. contrasltng the original model with newerproposed DEA models
To test the usefulness of DEA in measuringmanagement quality, I compared average DEAscores for failed banks with scores for those thatsurvived. Surviving banks are those institutions inoperation from 1984 through 1989. Failed banks arethose institutions declared insolvent by a regulatoryagency sometime between 1986 and 1988.
The sample population had 611 survivors
6 Federal Reserve Bank of Dallas

Table 2Average DEA Scores for Survivors and Failure Groups
Date SURV 88:2 88:1 87:2 87:1 86:2 86:1
December 1984 .82 .74 .80 .77 .76 .75 .74June 1985 .83 .72 .77 .76 .72 72 68December 1985 .83 .74 .78 .75 .72 .72 .68June 1986 .82 .72 .73 .69 .67 .65December 1986 .84 .72 .73 .70 .64June 1987 .81 66 .67 .63
NOTE: SURV = Survivors88:2 = Banks failing between JUly 1, 1988, and December 31, 198888:1 = Banks failing between January 1, 1988, and June 30, 198887:2 = Banks failing between July 1, 1987, and December 31, 198787:1 = Banks failing between January 1, 1987, and June 30, 198786:2 = Banks failing between July 1, 1986, and December 31, 198686:1 = Banks failing between January 1, 1986, and June 30,1986
SOURCE OF PRIMARY DATA: Consolidated Report of Condition and Income statements
SI'I~\ = Suni\ors
:lI1d .1 I\) fa iImes, \\'it h tol:i I asscts between S20million :l11d S500 million, :l11d c:lch hank ',Yas atleast threc \'ears old. I
' T r:,ndoml) 'eil'cted the (111sun i\ ing institutions from the tot:t1 popu!:ltiun ofmorL' th:ln 12.000 national l'<lIl1ml'1"cial banks. :111c1
thL' Ltilcd institutions \\"LTl' :dso n:ltional IXlllks. Toan:t1yl.l' the managcmcnt qu:t1ity Illetric, I di\ idnltill' h:lnks into the following Sl'\'cn groups:
HH: 2 =
HH: 1=
H'7:1 =
H(1:2 =
H6:1 =
Banks failing hu\\ Cl'n Juh- I, 19HH.:Ind Dl'ceml1l'r :) I. 19H!)
Banks failing hct\\ Cl'n .!:lnUalY I.19HH, and June 50. 19HHBanks failing betwccn July I, 19H7.ami Dcce1l1hl'1" ,11, 19H7
B:lTlks failing het\\ C'L'n January 1.19W', and ,lune 50. 19,<1-'-Banks failing het\\ l'en ,lulY 1. 19H(J.and Decemhcr :) I. I91i()Banks failing hct\\"l'cn janu:llY I.1986. and june .--10. I\)x6
for each group for each six-month rcriod fr mDeccmher 19K'f to JUlll' 19H7.
One call dr:1\\ t\\ 0 general conclusions fromthis anah-sis Firs!. the closer a bank is to its LliJuredale. the lo\yer its DEA score is. on a\ l'rage ForL'x:lI11ple, the :l\'('r:lgl' DEA score for HH: I hanksrebtive to all otlllT h:lTlks in the sampll' at the l'ndof 19H4 ,,,as O.HO. As thl' group's railurl' dateapproaches (ml)\ ing down the column). thl':l\'erage DEA scorL' generally declines, In jlllll'19W:i. the group's :I\'l'rage DEA scorl' \\':IS 0 7 7 Bythl' end of 19H5. thL' :l\"t'l"age score had risL'1l slightlyto (PH, hut it quickly tdl to 0,75 by,lulll' 19H(1.
The gl'lll'ral degradation in till' HH: 1 :lverageDEA scores cOlltillues as time progrl'ssc's. By June19H7, only six to t\velve months bdore r~lilurl', thegroup's <In:ragl' DEA score was 0.67. Oyer thesl'[\\"0 ~1l1c1 one-h:dr years (from Decl'J11hl'r 19H+ to
I .sing :1 DEA computl'r code described amidocuml'nted in Kennington ( 1()HO) and Ali andothers ( 19H I J. Tcomputed rL'sulls to c\'aluate therelati\ L' ellil'ienc\ of all h:lnks in the sample Thc1l1:ltri:-; in T:lhlc 2 sho\\s till' :I\t'ragc DEA scores
Ecollomk' Review - January 1992
The age andsize limitations will allow lor an analysis 01a key
segment 01 the banking industry that has tile greatest need
ofproblem identification Most mId-sized banks (those with
$20 million to $300 million in total assets) operate according
to the ImanClal intermediary model presented In this article
and are roughly 71 percent 01 all banks operating in the
United States
37

Average DEA score
SOURCE OF PRIMARY DATA: Consolidated Report of Condition andIncome statements.
65+----.-----r------r---~---...,
Dec 1984 June 1985 Dec 1985 June 1986 Dec 1986 June 1987
Conclusion
dates get nearer (reading left to right across therow). The average score for the group failing inthe second half of 1988 was 0.72. For banksfailing in the first half of 1988, the DEA score wasslightly higher at 0.73, but for failures occurring inthe second half of 1987 the average score waslower at 0.69. Moving left to right across the row,the average DEA scores continue to decline.
To further examine the significance of thisresult, I performed t tests for statistical differencesin the mean scores of the failure groups as compared with those of the survivors. Table 3 showsthe t values for the average DEA scores of thefailed bank groups compared with those of thesurvivors for each six-month period. All the comparisons are significant at the 0.01 level for theDecember 1984 data except for banks failing in thefirst half of 1988. Here, the t value is 1.72, whichcorresponds to a significance level of roughly 0.10.
The results in Table 3 show that the averageDEA scores for failed banks are significantlydifferent from the scores of surviving banks at the0.01 level for every six-month period up to twoand one-half years before the bank's failure. As agroup's actual failure date nears, the differences inmeans generally become more significant.
In this article, I have shown that the qualityof bank management can be quantified just likecapital, asset quality, liquidity, and earnings. Icomputed this new management quality metric byusing data envelopment analysis to proxy themultiple-input, multiple-output transformationalefficiency of a bank.
The important contribution from this analysisis that by utilizing DEA with the six inputs andthree outputs identified herein, the surviving andfailing groups can be statistically differentiated onthe basis of the resulting efficiency scores. Longbefore failure occurs, there appear to be significant statistical differences between the quality ofmanagement for banks that fail and those thatsurvive. This result, that management is importantto the success or failure of a bank, is intuitivelyappealing and validated statistically in this study.Banks whose managers poorly allocate resourcesand disregard the needs of their customers andmarkets have a greater chance of failing. 15
................................................•••.•••• 988 Fpllures
.....................................
".'..........••....
'.
75
85
70
.80
Figure 6Average DEA Scores for Survivorsand First-Half 1988 Failures
" Evanoff and Israilevich (1991) state that "firms whose man
agement does an inadequate job of utilizing factor inputs
may soon find it difficult to survive in the more competitivemarket. "
June 1987), this group's average DEA score declinedby 0.13, while the average score of the survivorsdeclined by less than 0.01. Figure 6 displays theaverage DEA scores for the survivors and the 88:1failure group from December 1984 to June 1987.
A similar deterioration in average DEAscores occurs for all the failure groups, Only afew anomalies exist when the average DEA scorerises instead of falls for each successive periodcloser to a group's failure date. In all cases,however, there is a statistically significant drop inaverage DEA scores from the first date analyzed(December 1984) umil the group's actual failure.
Second, the average DEA score for thesurvivors is higher than that for the failed groups.In Table 2, examine the row that corresponds toJune 1986. The average DEA score for the survivors was 0.82. For the failure groups, the scoresgenerally decline as the individual groups' failure
3 Federal Reserve Bank of Dallas
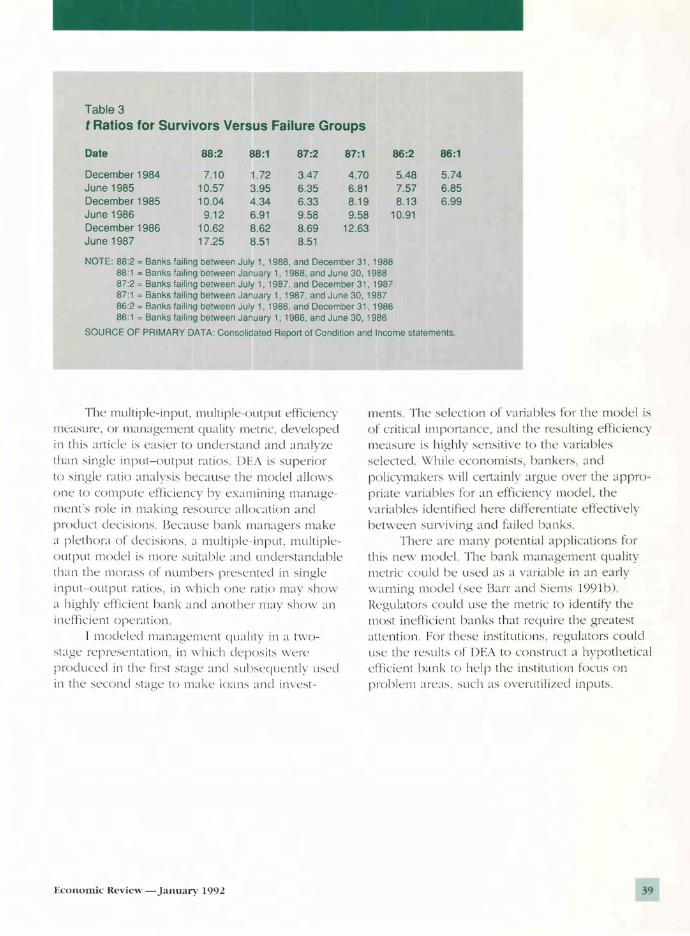
Table 3
t Ratios for Survivors Versus Failure Groups
Date 88:2 88:1 87:2 87:1 86:2 86:1
December 1984 710 1.72 3.47 4.70 5.48 5.74June 1985 10.57 3.95 6.35 6.81 7.57 6.85December 1985 10.04 4.34 6.33 8.19 8.13 6.99June 1986 912 6.91 9.58 9.58 10.91December 1986 10.62 8.62 8.69 12.63June 1987 17.25 8.51 8.51
NOTE: 88:2 = Banks failing between JUly 1, 1988, and December 31, 198888:1 = Banks failing between January 1,1988, and June 30,198887:2 = Banks failing between July 1, 1987, and December 31, 198787:1 = Banks failing between January 1, 1987, and June 30, 198786:2 = Banks failing between July 1, 1986, and December 31, 198686:1 = Banks failing between January 1, 1986, and June 30,1986
SOURCE OF PRIMARY DATA: Consolidated Report of Condition and Income statements
The muiliple-input, muilipil.'-oulput efficiencyIlle;lsure. or l1unagement Cju:t1ity IlK'lric, developed
in this article is L'asier to undersland and :ll1alvze
Ihan single in put-output r;ttios I)F:\ i.s superior
10 .single Lilio ;\Il;lh sis hecause the model :l!lcm s
one lo compulL' L'fTiciency h\ e";llllining manageI11L'nt's role in 1ll:lking resource ;t1location and
product decisions. Ikcause han k m:ll1:tgers ma ke
;t plethora of dL'cisions. a muiliple-inpul. multiple(lutput mock·1 is more suitahle ;\Ild understanclahle
lh:ln the 1ll0r:lSS 01 Ilumhers presL'nled in single
inpu\-outpU\ r;ltios. in \\'hich one r:ltio mav shcm
;1 highly elriL iL'nl hank :lnd anollllT m:ty sh(m :\Il
ind'ficient O!x'I';ltion.
[ mock'lnl 1ll;\Ilagement <jU:t1II\ in a t\\·o
.suge reprL'.senl:lli'lI1. in \vhich ciL'p< l.sits \',erL>
produced in tlw I-Irst .stage ;\Ilcl .suhseCjuenth' usnl
in the second .sUge \0 makL' IO:ll1s and il1\est-
Economic Review - January 1992
ments The scleC'lion of vari:thles for the model is
of critical importance, and the resulting efficiency
measure is highl) sensitin' to till' \'ariahles
selected, \"hiil.' economists, h:mkers. and
polic\'l11:lkers \\ ill certainly argue ()\ er the appro
priate \'ariahles for an efficiency model. the
\':triahles ident if iec! here ditlerenti:lte effectively
hetween surviving and failed hanks
There ;lre manv potential applications forthis ne,v model. The hank managcmcnt quality
metric could he used as a \ :tri;thle in an earl}
\\arning Illodel (sec Barr ami Siems 1991h)
]kgulat()l"s could use the metric to identify the
most inellicienl hanks that require the greatest
:lllention. For these institutions, regulators could
u.se the results or DEA to construct :t hvpothetic:t!
L'flicient h:tnk to help the institution focus on
prohlem :lre;I.S..such as ()\'Crulilizcd inputs.
39

--- - -------
References
Ali, I., A. Bessent, W. Bessent, and J. Kennington(981), "Data Envelopment Analysis of theEfficiency to Decision-Making Units with theDEA3 Code (Version 3.0)," Research ReportCCS 410 (Austin, Texas: University of Texas,Center for Cybernetic Studies, July).
Barr, R. S., and T. F. Siems 0991a), "A NewParadigm for Assessing the ManagementQuality of Banking Institutions," FederalReserve Bank of Dallas Research Paper,forthcoming.
---, and --- 0991b), "Predicting BankFailure Using DEA to Quantify ManagementQuality," Federal Reserve Bank of DallasResearch Paper, forthcoming.
Berg, S. A., F. R. Forsund, and E. S. Jansen (989),"Bank Output Measurement and the Construction of Best Practice Frontiers," ResearchReport, Bank of Norway, July.
Bessent, A., W. Bessent, J. Kennington, and B.Reagan (982), "An Application of MathematicalProgramming to Assess Productivity in theHouston Independent School District," Management Science 28 (2): 1355-67.
Byrnes, P., R. Eire, and S. Grosskopf (984),"Measuring Productive Efficiency: An Application to Illinois Strip Mines," ManagementScience 30 (6): 671-81.
Cates, D. C. (985), "Bank Risk and PredictingBank Failure," Issues in Bank Regulation 9(2): 16-20.
Charnes, A., W. W. Cooper, Z. M. Huang, and D.B. Sun (990), "Polyhedral Cone-Ratio DEAModels with an Illustrative Application toLarge Commercial Banks," Journal ofEconometrics 46 0/2, October/November): 73-91.
---, ---, and E. Rhodes (978), "Measuringthe Efficiency of Decision-Making Units,"European Journal ofOperational Research 2(6): 429-44.
Epstein, M. K., and J. c. Henderson (989), "DataEnvelopment Analysis for Managerial Controland Diagnosis," Decision Sciences 20 (1):
90-119.
Evanoff, D. D., and P. R. Israilevich (991), "Productive Efficiency in Banking," Federal ReserveBank of Chicago Economic Perspectives 15(4): 11-32.
Farrell, M. J. (957), "The Measurement of Productive Efficiency," Journal ofthe Royal StatisticalSociety, Series A, 253-81.
Graham, F. c., and J. E. Horner (988), "BankFailure: An Evaluation of Factors Contributingto the Failure of National Banks," Issues inBank Regulation 12 (2): 8-12.
Gunther, J. W. (989), "Texas Banking Conditions:Managerial Versus Economic Factors," FederalReserve Bank of Dallas Financial IndustryStudies, October.
Humphrey, D. B. (991), "Flow Versus StockIndicators of Banking Output: Effects onProductivity and Scale Economy Measurement," paper presented at the Western Economic Association meetings in Seattle,Washington, June 29-July 3.
Kaufman, G. G. (986), "Banking Risk in Historical Perspective," Federal Reserve Bank ofChicago Bank Structure and Competition,May, 231-49.
Kennington, J. (980), "A Primal Simplex Code forComputing the Efficiency of Decision-MakingUnits," Technical Report OREM 80001 (Dallas:Southern Methodist University, Department ofOperations Research).
Kolari,]., and A. Zardkoohi (987), Bank Costs,Structure, and Peiformance (Lexington, Mass.:D. C. Heath and Company).
Lewin, A. Y, R. . Morey, and T. J. Cook (982),"Evaluating lh ' Administrative Efficiency of
Federal Reserve Bank of Dallas

Courts," Omega: Internationaljournal ofManagement Science 10 (4): 401-11.
Nunamaker, T. R. (985), "Using Data Envelopment Analysis to Measure the Efficiency ofNon-Profit Organizations: A Critical Evaluation,"Managerial and Decision Economics 6 (1):
50-58.
Pantalone, C. c., and M. B. Platt (987), "PredictingCommercial Bank Failure Since Deregulation,"Federal Reserve Bank of Boston New EnglandEconomic ReView, July/August, 37-47.
Parkan, C. (987), "Measuring the Efficiency ofService Operations: An Application to BankBranches," Engineering Costs and ProductionEconomics 12, 237-42.
Rangan, N., R. Grabowski, H. Y. Aly, and C.Pasurka (988), "The Technical Efficiency ofU.S. Banks," Economics Letters 28, 169-75.
Seballos, L. D., and J. B. Thomson (990), "Underlying Causes of Commercial Bank Failures inthe 1980s," Federal Reserve Bank of ClevelandEconomic Commentary, September.
Seiford, L. M. (990), "A Bibliography of DataEnvelopment Analysis 0978-1990)," Version5.0, Technical Report (Amherst, Mass.: University of Massachusetts, Department of IndustrialEngineering, April).
Economic Review - January 1992
---, and R. M. Thrall (990), "Recent Developments in DEA: The Mathematical ProgrammingApproach to Frontier Analysis," journal ofEconometrics 46 0/2, October/November}7-38.
Sexton, T. R. (986), "The Methodology of DataEnvelopment Analysis," in Measuring Efficiency: An Assessment ofData EnvelopmentAnalysis, ed. R. H. Silkman (San Francisco:Jossey-Bass).
Sherman, H. D. (984), "Improving the Productivityof Service Businesses," Sloan ManagementReview, Spring, 11-23.
---, and F. Gold (985), "Bank Branch Operating Efficiency: Evaluation with Data Envelopment Analysis," journal ofBanking andFinance 9 (2) 297-315.
Siems, T. F. (991), "An Envelopment-AnalysisApproach to Measuring Management Qualityand Predicting Failure of Banks," Ph.D. dissertation, Southern Methodist University.
Triplett, J. E. (991), "Measuring the Output ofBanks: What Do Banks Do?" paper presentedat the Western Economic Association meetingsin Seattle, Washington, June 29-July 3.
41