quantifying path exploration in the internet - uclalixia/papers/09tonpath.pdf · quantifying path...
TRANSCRIPT

IEEE/ACM TRANSACTIONS ON NETWORKING, VOL. 17, NO. 2, APRIL 2009 445
Quantifying Path Exploration in the InternetRicardo Oliveira, Member, IEEE, Beichuan Zhang, Dan Pei, and Lixia Zhang
Abstract—Previous measurement studies have shown the exis-tence of path exploration and slow convergence in the global In-ternet routing system, and a number of protocol enhancementshave been proposed to remedy the problem. However, existing mea-surements were conducted only over a small number of testing pre-fixes. There has been no systematic study to quantify the perva-siveness of Border Gateway Protocol (BGP) slow convergence inthe operational Internet, nor any known effort to deploy any of theproposed solutions.
In this paper, we present our measurement results that identifyBGP slow convergence events across the entire global routing table.Our data shows that the severity of path exploration and slow con-vergence varies depending on where prefixes are originated andwhere the observations are made in the Internet routing hierarchy.In general, routers in tier-1 Internet service providers (ISPs) ob-serve less path exploration, hence they experience shorter conver-gence delays than routers in edge ASs; prefixes originated fromtier-1 ISPs also experience less path exploration than those origi-nated from edge ASs. Furthermore, our data show that the conver-gence time of route fail-over events is similar to that of new routeannouncements and is significantly shorter than that of route fail-ures. This observation is contrary to the widely held view from pre-vious experiments but confirms our earlier analytical results. Oureffort also led to the development of a path-preference inferencemethod based on the path usage time, which can be used by futurestudies of BGP dynamics.
Index Terms—AS topology completeness, Border Gateway Pro-tocol (BGP), inter-domain routing, Internet topology.
I. INTRODUCTION
T HE Border Gateway Protocol (BGP) is the routing pro-tocol used in the global Internet. A number of previous
analytical and measurement studies [1]–[3] have shown the ex-istence of BGP path exploration and slow convergence in theoperational Internet routing system, which can potentially leadto severe performance problems in data delivery. Path explo-ration suggests that, in response to path failures or routing policychanges, some BGP routers may try a number of transient paths
Manuscript received November 29, 2006; revised September 19, 2007; ap-proved by IEEE/ACM TRANSACTIONS ON NETWORKING Editor Z.-L. Zhang.Current version published April 15, 2009. This material is based upon worksupported by the Defense Advanced Research Projects Agency (DARPA) underContract N66001-04-1-8926 and by the National Science Foundation (NSF)under Contract ANI-0221453. Any opinions, findings, and conclusions or rec-ommendations expressed in this material are those of the authors and do notnecessarily reflect the views of the DARPA or NSF.
R. Oliveira and L. Zhang are with the Computer Science Department, Univer-sity of California, Los Angeles, CA 90095 USA (e-mail: [email protected];[email protected]).
B. Zhang is with the Computer Science Department, University of Arizona,Tucson, AZ 85721 USA (e-mail: [email protected]).
D. Pei is with AT&T Labs–Research, Florham Park, NJ 07932 USA (e-mail:[email protected]).
Color versions of one or more of the figures in this paper are available onlineat http://ieeexplore.ieee.org.
Digital Object Identifier 10.1109/TNET.2009.2016390
Fig. 1. Path exploration triggered by a fail-down event.
before selecting a new best path or declaring unreachability toa destination. Consequently, a long time period may elapse be-fore the whole network eventually converges to the final deci-sion, resulting in slow routing convergence. An example of pathexploration is depicted in Fig. 1, where node C’s original pathto node E (path 1) fails due to the failure of link D–E. C reactsto the failure by attempting two alternative paths (paths 2 and 3)before it finally gives up. The experiments in [1]–[3] show thatsome BGP routers can spend up to several minutes exploring alarge number of alternate paths before declaring a destinationunreachable.
The analytical models used in the previous studies tend to rep-resent worst case scenarios of path exploration [1], [2], and themeasurement studies have all been based on controlled exper-iments with a small number of beacon prefixes. In the Internetoperational community, there exist various different views re-garding whether BGP path exploration and slow convergencerepresent a significant threat to the network performance, orwhether the severity of the problem, as shown in simulationsand controlled experiments, would be rather rare in practice. Asystematic study is needed to quantify the pervasiveness and sig-nificance of BGP slow convergence in the operational routingsystem, which is the goal of this paper.
In this paper, we provide measurement results from the BGPlog data collected by RouteViews [4] and RIPE [5]. For all thedestination prefixes announced in the Internet, we cluster theirBGP updates into routing events and classify the events intodifferent convergence classes. We then characterize path explo-ration and convergence time of each class of events. The resultsreported in this paper are obtained from BGP logs of Januaryand February 2006, which are representative of data we haveexamined during other time periods. The main contributions ofthis paper are summarized as follows.
• We provide the first quantitative assessment on path explo-rations for the entire Internet destination prefixes. Our re-
1063-6692/$25.00 © 2009 IEEE
Authorized licensed use limited to: Barbara Lange. Downloaded on April 15, 2009 at 01:13 from IEEE Xplore. Restrictions apply.

446 IEEE/ACM TRANSACTIONS ON NETWORKING, VOL. 17, NO. 2, APRIL 2009
sults confirmed the wide existence of path exploration andslow convergence in the Internet but also revealed that theextent of the problem depends on where a prefix is orig-inated and where the observation is made in the Internetrouting hierarchy. When observed from a top-tier Internetservice provider (ISP), there is relatively little path explo-ration, and this is especially true when the prefixes beingobserved are also originated from some other top-tier ISPs.On the other hand, an observer in an edge network is likelyto notice a much higher degree of path exploration and slowconvergence, especially when the prefixes being observedare originated from other edge networks. In other words,the existing different opinions on the extent of path explo-ration and slow convergence may be a reflection of whereone takes measurement and which prefixes are being ex-amined.
• We provide the first measurement and analysis on theconvergence times of route change events in the entireoperational Internet. Our results show that route fail-overevents, where the paths move from shorter or more pre-ferred ones to longer or less preferred ones, has muchshorter convergence time than route failure events, wherethe destinations become unreachable. Moreover, we findthat, on average, the durations of various route conver-gence events take the following order: Among all routingevents, those moving from longer or less preferred toshorter or more preferred paths, symbolically denotedas events, have the shortest convergence delay,which are closely followed by new prefix announcements(denoted as event), which in turn have similar con-vergence delay as the routing events of moving fromshorter to longer paths (denoted as ). Finally, routefailure events, denoted as , have a substantiallylonger delay than all the above events. In short, we have
regarding their con-vergence delays. Note that is significantly shorterthan , which is a noticeable departure from widelyaccepted views based on the previous “worst-case” exper-iments [1] but is in accordance to our previous theoreticalanalysis results presented in [6].
• A major challenge in our data analysis is how to differ-entiate and events, which requires knowingrouters’ path preferences. We have developed a new pathranking algorithm to infer relative preference of each pathamong all the alternative paths to the same destinationprefix. We believe that our path ranking algorithm can beof useful in many other BGP data analysis studies.
The rest of the paper is organized as follows. Section II de-scribes our general methodology and data set, where we developa path ranking algorithm to classify events into different types.We analyze the extent of path exploration and slow convergencefor each type of events in Sections III and IV. Section V dis-cusses related work, and Section VI concludes the paper.
II. METHODOLOGY AND DATA SET
Previous measurement results on BGP slow convergencewere obtained through controlled experiments. In these exper-iments, a small number of “beacon” prefixes are periodically
announced and withdrawn by their origin ASs at fixed timeintervals [7], [8], and the resulting routing updates are collectedat remote monitoring routers and analyzed. In addition, to gen-erate announcements and withdrawals ( and events),one can also use a beacon prefix to generate events bydoing AS prepending [1]. For a given beacon prefix, becauseone knows exactly what, when, and where is the root cause ofeach routing update, one can easily measure the routing con-vergence time by calculating the difference between when theroot cause is triggered and when the last update due to the sameroot cause is observed. Although routing updates for beaconprefixes may also be generated by unexpected path changes inthe network, those updates can be clearly identified throughthe use of anchor prefixes, as explained later in this section.Unfortunately, one cannot assess the overall Internet routingperformance from observing the small number of existingbeacon prefixes.
Our observation of routing dynamics is based on a set ofrouters, termed monitors, that propagate their routing table up-dates to collector boxes, which store them in disks (e.g. Route-Views [4]). To obtain a comprehensive understanding of BGPpath explorations in the operational Internet, we first clusterrouting updates from the same monitor and for the same prefixinto events, sort all the routing events into several classes, andthen measure the duration and number of paths explored foreach class of events. Our task is significantly more difficult thanmeasuring the convergence delay of beacon prefixes for the fol-lowing reasons. First, there is no easy way to tell whether a se-quence of routing updates is due to the same or different rootcauses in order to properly group them into events. Second, uponreceiving an update for a prefix, one cannot tell what is the rootcause of the update, as is the case with beacon prefixes. Further-more, when the path to a given destination prefix changes, it isdifficult to determine whether the new path is a more, or less,preferred path compared to the previous one, i.e. whether theprefix experiences a or a event in our event classi-fication.
To address the above problems, we take advantage of beaconupdates to develop and calibrate effective heuristics and thenapply them to all the prefixes. In the rest of this section, we firstdescribe our data set, then discuss how we use beacon updates tovalidate a timer-based mechanism for grouping routing updatesinto events and how we use beacon updates to develop a usage-based path ranking method, which is then used in our routingevent classifications.
A. Data Set and Preprocessing
To develop and calibrate our update grouping and pathranking heuristics, we used eight BGP beacons, one from PSG[7] (psg01), the other seven from RIPE [8] (rrc01, rrc03, rrc05,rrc07,rrc10, rrc11 and rrc12). All eight beacon prefixes are an-nounced and withdrawn alternately every 2 h. We preprocessedthe beacon updates following the methods developed in [3].First, we removed from the update stream all the duplicate up-dates, as well as the updates that differ only in COMMUNITYor MED attribute values because they are usually caused byinternal dynamics inside the last-hop AS. Second, we used theanchor prefix of each beacon to detect routing changes other
Authorized licensed use limited to: Barbara Lange. Downloaded on April 15, 2009 at 01:13 from IEEE Xplore. Restrictions apply.

OLIVEIRA et al.: QUANTIFYING PATH EXPLORATION IN THE INTERNET 447
than those generated by the beacon origins. An anchor prefix isa separate prefix announced by a beacon prefix’s origin AS andis never withdrawn after its announcement. Thus, it serves asa calibration point to identify routing events that are not orig-inated by the beacon injection/removal mechanism. Becausethe anchor prefix shares the same origin AS, and hopefully thesame routing path, with the beacon prefix, any routing changesthat are not associated with the beacon mechanism will triggerrouting updates for both the anchor and the beacon prefixes. Toremove all beacon updates triggered by such unexpected routingevents, for each anchor prefix update at time , we ignore allbeacon updates during the time window . Weset ’s value to 5 min, as the results reported in [3] show thatthe number of beacon updates remains more or less constantfor min. After the above two steps of preprocessing,beacon updates are mainly comprised of those triggered by thescheduled beacon activity at the origin ASs.
To assess the degree of path exploration for all the prefixes inthe global routing table, we used the public BGP data collectedfrom 50 full-table monitoring points by RIPE [5] and Route-Views [4] collectors during the months of January and February2006. We used the data from January to evaluate the differentpath comparison metrics, and we later analyzed the events inboth months. We removed from the data all the updates that werecaused by BGP session resets between the collectors and themonitors, using the minimum collection time method describedin [9]. Those updates correspond to BGP routing table transfersbetween the collectors and the monitors, and therefore shouldnot be accounted in our study of the convergence process.
The 50 monitors were chosen based on the fact that each ofthem provided full routing tables and continuous routing dataduring our measurement period. One month was chosen as ourmeasurement period based on the assumption that ISPs are un-likely to make many changes of their interconnectivity within aone-month period, so we can assume the AS level topology didnot change much over our measurement time period, an assump-tion that is used in our AS path comparison later in the paper.
B. Clustering Updates Into Events
Some of the previous BGP data analysis studies [10]–[12] de-veloped a timer-based approach to cluster routing updates intoevents. Based on the observation that BGP updates come inbursts, two adjacent updates for the same prefix are assumed tobe due to the same routing event if they are separated by a timeinterval less than a threshold . A critical step in taking thisapproach is to find an appropriate value for . A value that istoo high can incorrectly group multiple events into one. On theother hand, a value that is too low may divide a single event intomultiple ones. Since the root causes of beacon routing events areknown, and the beacon update streams contain little noise afterthe preprocessing, we use beacon prefixes to find an appropriatevalue for .
Fig. 2 shows the distribution of update interarrival times ofthe eight beacon prefixes as observed from the 50 monitors. Allthe curves start flattening out either before or around 4 min (thevertical line in the figure). If we use 4 min as the threshold valueto separate updates into different events, i.e. min, inthe worst case (rrc01 beacon) we incorrectly group about 8%
Fig. 2. CCDF of interarrival times of BGP updates for the eight beacon prefixesas observed from the 50 monitors.
Fig. 3. Difference in number of events per [monitor,prefix] for and8 min, relatively to min, during one-month period.
of messages of the same event into different events; this cor-responds to the interarrival time difference between the cuttingpoint of the rrc01 curve at 4 min and the horizontal tail of thecurve. The tail drop of all the curves at 7200 s corresponds tothe 2-h interval between the scheduled beacon prefix activities.1
Although the data for the beacon updates suggests that athreshold of min may work well for grouping up-dates into events, no single value of would be a perfectfit for all the prefixes and all the monitors. Thus, we need toassess how sensitive our results may be with the choice of
min. Fig. 3 compares the result of using minwith that of min and min for clustering theupdates of all the prefixes collected from all the 50 monitorsduring our one-month measurement period. Letbe the number of events identified by monitor for prefix
1The psg01 curve reaches a plateau earlier than the other curves, indicatingthat it suffers less from slow routing convergence. However, one may note itsabsence of update interarrivals between 100 and 3600 s, followed by a highnumber of interarrivals around 3600 s. As hinted in [3], this behavior could beexplained by BGP’s route flat damping, and 1 h is the default maximum sup-pression time applied to an unstable prefix when its announcement goes througha router that enforces BGP damping.
Authorized licensed use limited to: Barbara Lange. Downloaded on April 15, 2009 at 01:13 from IEEE Xplore. Restrictions apply.

448 IEEE/ACM TRANSACTIONS ON NETWORKING, VOL. 17, NO. 2, APRIL 2009
Fig. 4. Event taxonomy.
using min. and are similarlydefined but with min and min respectively.Fig. 3 shows the distribution of and
, which reflects the impact of usinga higher or lower timeout value, respectively. As one can seefrom the figure, in about 50% of the cases, the three different
values result in the same number of events, and in morethan 80% of the cases, the results from using the differentvalues differ by at most two events. Based on the data, we canconclude that the result of event clustering is insensitive to thechoice of min. This observation is also consistent withprevious work. For example, [12] experimented with varioustimeout threshold values between 2 and 16 min and found nosignificant difference in the clustering results. In the rest of thepaper, we use min.
C. Classifying Routing Events
After the routing updates are grouped into events, we clas-sify the events into different types based on the effect that eachevent has on the routing path. Let us consider two consecutiveevents and for the same prefix observed by the samemonitor. We define the path in the last update of event as theending path of event , which is also the starting path for event
. Let and denote an event’s starting and endingpaths, respectively, and denote the path in a withdrawal mes-sage (representing an empty path). If the last update in an eventis a withdrawal, we have . Based on the relation be-tween and of each event, we classify all the routingevents into one of the following categories, as shown in Fig. 4.2
1) Same Path : A routing event is classified as aif its , and every update in the event
reports the same AS path as , although they maydiffer in some other BGP attribute such as MED or COM-MUNITY value. events typically reflect the routingdynamics inside the monitor’s AS.
2) Path Disturbance : A routing event is classified asif its and at least one update in the
event carries a different AS path. In other words, the ASpath is the same before and after the event, with some tran-sient change(s) during the event. events are likely re-sulted from multiple root causes, such as a transient failureclosely followed by a quick recovery, hence the name ofthe event type. When multiple root causes occur closelyin time, the updates they produce also follow each other
2To establish a valid starting state, we initialize for each (mon-itor,prefix) pair with the path extracted from the routing table of the corre-sponding monitor.
very closely, and no timeout value would be able to accu-rately separate them out by the root causes. In our study,we identify these events but do not include them inthe convergence analysis.
3) Path Change: A routing event is classified as a path changeif its . In other words, the paths before andafter the event are different. Path change events are furtherclassified into five categories based on whether the des-tination becomes available or unavailable, or changed toa more preferred or less preferred path, at the end of theevent. Let represent a router’s preference of path
, with a higher value representing a higher preference.• : A routing event is classified as a if its
. A previously unreachable destination becomes reach-able through path by the end of the event.
• : A routing event is classified as if its. That is, a previously reachable destination
becomes unreachable by the end of the event.• : A routing event is classified as if its
, , and ,indicating a reachable destination has changed the pathto a more preferred one by the end of the event.
• : A routing event is classified as a event if its, , and ,
indicating a reachable destination has changed the pathto a less preferred one by the end of the event.
• : A routing event is classified as if its, , and .
That is, a reachable destination has changed the path bythe end of the event, but the starting and ending pathshave the same preference.
A major challenge in event classification is how to differ-entiate between and events, a task that requiresjudging the relative preference between two given paths. Indi-vidual routers use locally configured routing policies to choosethe most preferred path among available ones. Because we donot have precise knowledge of the routing policies, we must de-rive effective heuristics to infer a routers’ path preference. It ispossible that our heuristics label two paths with equal prefer-ence, in which case the event will be classified as . How-ever, a good path-ranking heuristic should minimize such ambi-guity.
D. Comparing AS Paths
If a routing event has nonempty and , then the rela-tive preference between and determines whether theevent is a or . In the controlled experiments usingbeacon prefixes, one can create such events by manipulating ASpaths. For example in [1], AS paths with length up to 30 AS hopswere used to simulate events.
However, in general there has been no good way to inferrouters’ preferences among multiple available AS paths to thesame destination. Given a set of available paths, a BGP routerchooses the most preferred one through a decision process.During this process, the router usually considers several factorsin the following order: local preference (which reflects thelocal routing policy configuration), AS path length, the MEDattribute value, IGP cost, and tie-breaking rules. Some of the
Authorized licensed use limited to: Barbara Lange. Downloaded on April 15, 2009 at 01:13 from IEEE Xplore. Restrictions apply.
OLIVEIRA et al.: QUANTIFYING PATH EXPLORATION IN THE INTERNET 449
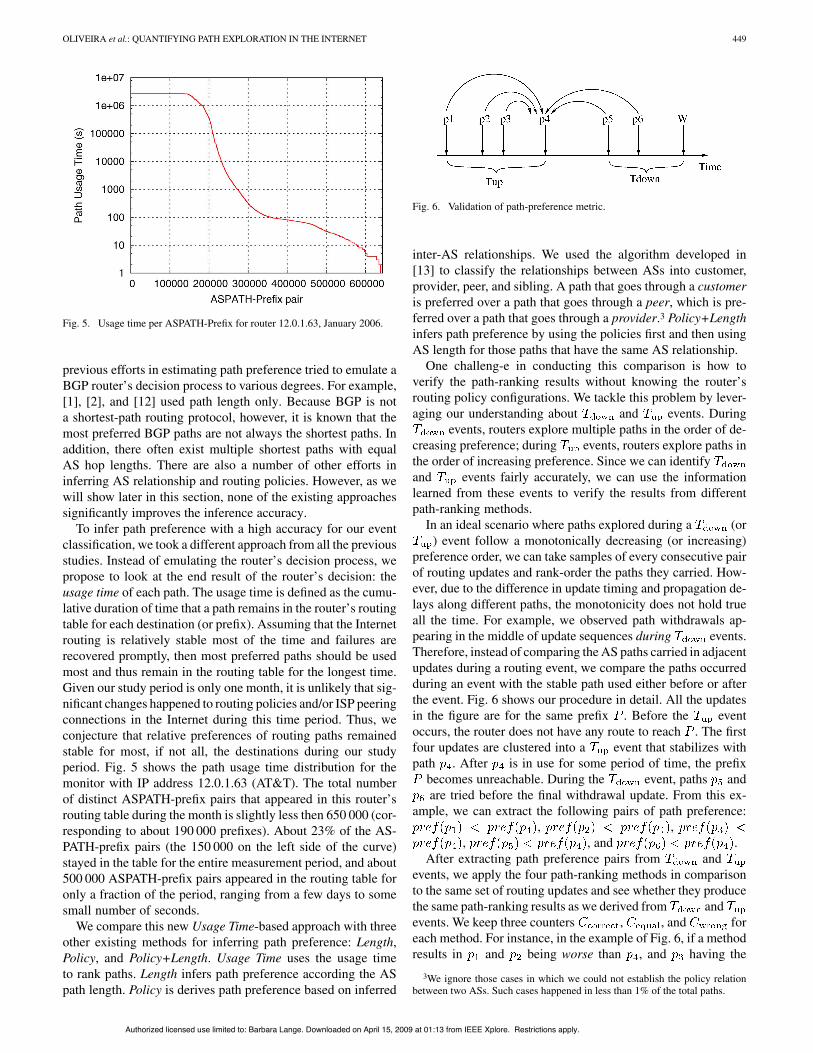
Fig. 5. Usage time per ASPATH-Prefix for router 12.0.1.63, January 2006.
previous efforts in estimating path preference tried to emulate aBGP router’s decision process to various degrees. For example,[1], [2], and [12] used path length only. Because BGP is nota shortest-path routing protocol, however, it is known that themost preferred BGP paths are not always the shortest paths. Inaddition, there often exist multiple shortest paths with equalAS hop lengths. There are also a number of other efforts ininferring AS relationship and routing policies. However, as wewill show later in this section, none of the existing approachessignificantly improves the inference accuracy.
To infer path preference with a high accuracy for our eventclassification, we took a different approach from all the previousstudies. Instead of emulating the router’s decision process, wepropose to look at the end result of the router’s decision: theusage time of each path. The usage time is defined as the cumu-lative duration of time that a path remains in the router’s routingtable for each destination (or prefix). Assuming that the Internetrouting is relatively stable most of the time and failures arerecovered promptly, then most preferred paths should be usedmost and thus remain in the routing table for the longest time.Given our study period is only one month, it is unlikely that sig-nificant changes happened to routing policies and/or ISP peeringconnections in the Internet during this time period. Thus, weconjecture that relative preferences of routing paths remainedstable for most, if not all, the destinations during our studyperiod. Fig. 5 shows the path usage time distribution for themonitor with IP address 12.0.1.63 (AT&T). The total numberof distinct ASPATH-prefix pairs that appeared in this router’srouting table during the month is slightly less then 650 000 (cor-responding to about 190 000 prefixes). About 23% of the AS-PATH-prefix pairs (the 150 000 on the left side of the curve)stayed in the table for the entire measurement period, and about500 000 ASPATH-prefix pairs appeared in the routing table foronly a fraction of the period, ranging from a few days to somesmall number of seconds.
We compare this new Usage Time-based approach with threeother existing methods for inferring path preference: Length,Policy, and Policy+Length. Usage Time uses the usage timeto rank paths. Length infers path preference according the ASpath length. Policy is derives path preference based on inferred
Fig. 6. Validation of path-preference metric.
inter-AS relationships. We used the algorithm developed in[13] to classify the relationships between ASs into customer,provider, peer, and sibling. A path that goes through a customeris preferred over a path that goes through a peer, which is pre-ferred over a path that goes through a provider.3 Policy+Lengthinfers path preference by using the policies first and then usingAS length for those paths that have the same AS relationship.
One challeng-e in conducting this comparison is how toverify the path-ranking results without knowing the router’srouting policy configurations. We tackle this problem by lever-aging our understanding about and events. During
events, routers explore multiple paths in the order of de-creasing preference; during events, routers explore paths inthe order of increasing preference. Since we can identifyand events fairly accurately, we can use the informationlearned from these events to verify the results from differentpath-ranking methods.
In an ideal scenario where paths explored during a (or) event follow a monotonically decreasing (or increasing)
preference order, we can take samples of every consecutive pairof routing updates and rank-order the paths they carried. How-ever, due to the difference in update timing and propagation de-lays along different paths, the monotonicity does not hold trueall the time. For example, we observed path withdrawals ap-pearing in the middle of update sequences during events.Therefore, instead of comparing the AS paths carried in adjacentupdates during a routing event, we compare the paths occurredduring an event with the stable path used either before or afterthe event. Fig. 6 shows our procedure in detail. All the updatesin the figure are for the same prefix . Before the eventoccurs, the router does not have any route to reach . The firstfour updates are clustered into a event that stabilizes withpath . After is in use for some period of time, the prefix
becomes unreachable. During the event, paths andare tried before the final withdrawal update. From this ex-
ample, we can extract the following pairs of path preference:, ,
, , and .After extracting path preference pairs from and
events, we apply the four path-ranking methods in comparisonto the same set of routing updates and see whether they producethe same path-ranking results as we derived from andevents. We keep three counters , , and foreach method. For instance, in the example of Fig. 6, if a methodresults in and being worse than , and having the
3We ignore those cases in which we could not establish the policy relationbetween two ASs. Such cases happened in less than 1% of the total paths.
Authorized licensed use limited to: Barbara Lange. Downloaded on April 15, 2009 at 01:13 from IEEE Xplore. Restrictions apply.

450 IEEE/ACM TRANSACTIONS ON NETWORKING, VOL. 17, NO. 2, APRIL 2009
Fig. 7. Comparison between , , and of Length, Policy,and Usage Time metrics for (a) and (b) events of beacon prefixes.
same preference of (equal), then for the event we have, , and . Likewise, for the
event, if a method results in being better than andbeing equal to , then we have , ,
and . To quantify the accuracy of different inferencemethods, we define
. We use as a measure of accuracy in our com-parison.
To compare the four different path-ranking methods, we firstapplied them to our beacon data set, which contains updatesgenerated by and events, and computed the values of
, , and for each of the four methods. Fig. 7shows the result. As one can see from the figure, Length worksvery well in ranking paths explored during events, giving93% correct cases and 5% equal cases. However, it performsmuch worse in ranking the paths explored during events,producing 40% correct cases and 40% wrong cases. During
events, many “invalid” paths are explored and they arevery likely to be longer than the stable path. However, during
events, only “valid” paths are explored, and their prefer-ences are not necessarily based on their path lengths.
Policy performs roughly equally for ranking paths duringand events. It does not make many wrong choices
but produces a large number of equal cases (around 70% ofthe total). This demonstrates that the inferred AS relationship
Fig. 8. Comparison between accuracy of Length, Policy, and Usage Time met-rics.
and routing policies provide insufficient information for pathranking. They do not take into account many details—suchas traffic engineering, AS internal routing metric, etc.—thataffect actual routes being used. Compared with Length,Policy+Length has a slightly worse performance withevents and a moderate improvement with events. Ourobservations are consistent with a recent study that concludesthat per-AS relationships is not fine-grained enough to computerouting paths correctly [14].
Usage Time works surprisingly well and outperforms theother three in both and events. Its is about96.3% in and 99.4% in events. Its valueis 0 in both and events. This is because we aremeasuring the path usage time using the unit of second, whicheffectively puts all the paths in strict rank order. We also noticethat for events, about 3.7% of the comparisons are wrong,whereas for events this number is as low as 0.6%. Webelieve this noticeable percentage of wrong comparisons inevents is due to path changes caused by topological changes,such as a new link established between two ASs as a result of acustomer switching to a new provider. Because the new pathshave low usage time, our Usage Time-based inference will givethem a low rank, although these paths are actually the preferredones. Nevertheless, the data confirmed our earlier assumptionthat, during our one-month measurement period, there wereno significant changes in Internet topology or routing polices.Otherwise, we would have seen a much higher percentage ofwrong cases produced by Usage Time.
We now examine how the value of varies betweendifferent monitors under each of the four path-ranking methods.Fig. 8 shows the distribution of for different methods,with X-axis representing the monitors sorted in decreasing orderof their value. The value of for each monitor iscalculated over all the and events in our beacon dataset. When using the path usage time for path ranking, we ob-serve an accuracy between 84% and 100% across all the moni-tors, whereas with using path length for ranking, we observe the
value can be as low as 31% for some monitor. Usingpolicy for path ranking leads to even lower values.
Authorized licensed use limited to: Barbara Lange. Downloaded on April 15, 2009 at 01:13 from IEEE Xplore. Restrictions apply.

OLIVEIRA et al.: QUANTIFYING PATH EXPLORATION IN THE INTERNET 451
Fig. 9. Number of events per monitor.
After we developed and calibrated the usage-time-based path-ranking method using beacon updates, we applied the method,together with the other three, to the BGP updates for all theprefixes collected from all the 50 monitors, and we obtained theresults similar to that from the beacon update set. Consideringthe aggregate of all monitors and all prefixes, is 17%for Policy, 65% for Length, 73% for Policy+Length, and 96.5%for Usage Time. Thus, we believe usage time works very wellfor our purpose and use it throughout our study.
To the best of our knowledge, we are the first to propose themethod of using usage time to infer relative path preference.We believe this new method can be used for many other studieson BGP routing dynamics. For example, [12] pointed out thatif after a routing event, the stable path is switched from P1 toP2, the root cause of the event should lie on the better path ofthe two. The study used length-only in their path ranking, andthe root cause inference algorithm produced a mixed result. Ourresult shows that using length for path ranking gives only about65% accuracy, and usage time can give more than 96% accuracy.Using usage time to rank path can potentially improve the resultsof the root-cause inference scheme proposed in [12].
III. CHARACTERIZING EVENTS
After applying the classification algorithm to BGP data, wecount the number of events observed by each monitor asa sanity check. A event means that a previously reachableprefix becomes unreachable, suggesting that the root cause ofthe failure is very likely at the AS that originates the prefix andshould be observed by all the monitors. Therefore, we expectevery monitor to observe roughly the same number ofevents. Fig. 9 shows the number of events seen by eachmonitor. Most monitors observe a similar number ofevents, but there are also a few outliers that observe either toomany or too few events. Too many events canbe due to failures that are close to monitors and partition themonitors from the rest of the Internet or underestimation ofthe relative timeout used to cluster updates. Too fewevents can be due to missing data during monitor downtimeor overestimation of the relative timeout . In order to keepconsistency among all monitors, we decided to exclude the
TABLE IEVENT STATISTICS FOR JANUARY 2006 (31 DAYS)
TABLE IIEVENT STATISTICS FOR FEBRUARY 2006 (28 DAYS)
Fig. 10. Duration of events for January 2006.
head and tail of the distribution, reducing the data set to 32monitors.
Now we examine the results of event classification. Tables Iand II show the statistics for January and February respectivelyfor each event class, including the total number of events, the av-erage event duration, the average number of updates per event,and the average number of unique paths explored per event. Weexclude events from the table since their percentage isnegligible. Comparing the results from the two months, we notethat the values are very close, as can also be observed by com-paring the distribution of event duration on Figs. 10 and 11.Given this similarity, we will base our following analysis on Jan-uary data, although the same observations apply to February.
There are three observations. First, the three high-level eventcategories in Fig. 4 have approximately the same number ofevents: Path-Change events are about 36% of all the events,Same-Path 34%, and Path-Disturbance 30%. Breaking downPath-Change events, we see that the number of balancesthat of , and the number of balances that of . This
Authorized licensed use limited to: Barbara Lange. Downloaded on April 15, 2009 at 01:13 from IEEE Xplore. Restrictions apply.

452 IEEE/ACM TRANSACTIONS ON NETWORKING, VOL. 17, NO. 2, APRIL 2009
Fig. 11. Duration of events for February 2006.
Fig. 12. Number of updates per event, January 2006.
Fig. 13. Number of unique paths explored per event, January 2006.
makes sense since failures are recovered with events,and failures are recovered with events.
Second, the average duration of different types of events canbe ordered as follows:
.4 Fig. 10 shows the distributions of event dura-tions,5 which also follow the same order. Note that the shape ofthe curves is stepwise with jumps at multiples of around 26.5 s.The next section will explain that this is due to the MinRouteAd-vertisementInterval (MRAI) timer, which controls the intervalbetween consecutive updates sent by a router. The default rangeof MRAI timer has the average value of 26.5 s, making eventslast for multiples of this value. Table I also shows thatevents have the longest duration and most updates and explorethe most unique paths. This suggests that likely containstwo events very close in time, e.g., a link failure followed shortlyby its recovery. A study [15] on network failures inside a tier-1provider revealed that about 90% of the failures on high-failurelinks take less than 3 min to recover, while 50% of optical-re-lated failures take less than 3.5 min to recover. Therefore, thereare many short-lived network failures, and they can very wellgenerate routing events like . On the other hand,events are much shorter and have less updates. It is because that
is likely due to routing changes inside the AS hostingthe monitor and, thus, does not involve interdomain path explo-ration.
Third, among the path changing events, events last thelongest, have the most updates, and explore the most uniquepaths. Figs. 10, 12, and 13 show the distributions of event dura-tion, number of updates per event, and number of unique pathsexplored per event, respectively. The results show that routefail-down events last considerably longer than routefail-over events . In fact, Fig. 10 shows that about 60% of
events have duration of zero, while 50% of eventslast more than 80 s. In addition, Fig. 12 shows that about 60% of
events have only one update, while about 70% ofevents have three or more updates. Fig. 13 shows thatexplore more unique paths than . These results are in ac-cordance with our previous analytical results in [6] but con-trary to the results of previous measurement work [2], whichconcluded that the duration of events is similar to that of
and longer than that of and . In [6], we showedthat the upper bound of convergence time is proportionalto , where is the MRAI timer value, is the pathlength of to the destination after the event, and is the distancefrom the failure location to the destination. Since is typicallysmall for most Internet paths, and could be anywhere between0 and , the duration of most events should be short. Webelieve that the main reason [2] reached a different conclusion isbecause they conducted measurements by artificially increasing
to 30 AS hops using AS prepending. The analysis in [6] showsthat an overestimate of would result in a longer con-vergence time, which would explain why they observed longerdurations for beacon prefixes than what we observed for opera-tional prefixes.
A. The Impact of Unstable Prefixes
So far we have been treating all destination prefixes in thesame way by aggregating them in a single set in our measure-ments. However, previous work [10] showed that most routing
4The order of and average durations invert on February 2006,even though the values remain very close to each other.
5The curve is omitted from the figure for clarity.
Authorized licensed use limited to: Barbara Lange. Downloaded on April 15, 2009 at 01:13 from IEEE Xplore. Restrictions apply.
OLIVEIRA et al.: QUANTIFYING PATH EXPLORATION IN THE INTERNET 453
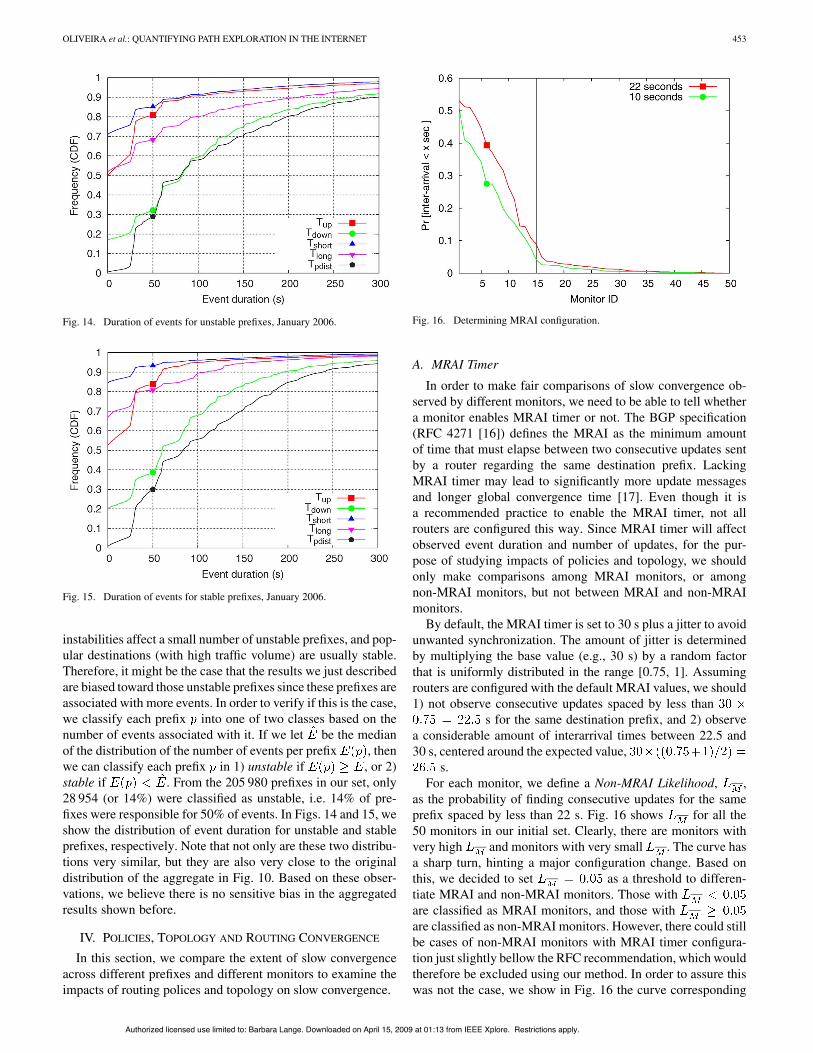
Fig. 14. Duration of events for unstable prefixes, January 2006.
Fig. 15. Duration of events for stable prefixes, January 2006.
instabilities affect a small number of unstable prefixes, and pop-ular destinations (with high traffic volume) are usually stable.Therefore, it might be the case that the results we just describedare biased toward those unstable prefixes since these prefixes areassociated with more events. In order to verify if this is the case,we classify each prefix into one of two classes based on thenumber of events associated with it. If we let be the medianof the distribution of the number of events per prefix , thenwe can classify each prefix in 1) unstable if , or 2)stable if . From the 205 980 prefixes in our set, only28 954 (or 14%) were classified as unstable, i.e. 14% of pre-fixes were responsible for 50% of events. In Figs. 14 and 15, weshow the distribution of event duration for unstable and stableprefixes, respectively. Note that not only are these two distribu-tions very similar, but they are also very close to the originaldistribution of the aggregate in Fig. 10. Based on these obser-vations, we believe there is no sensitive bias in the aggregatedresults shown before.
IV. POLICIES, TOPOLOGY AND ROUTING CONVERGENCE
In this section, we compare the extent of slow convergenceacross different prefixes and different monitors to examine theimpacts of routing polices and topology on slow convergence.
Fig. 16. Determining MRAI configuration.
A. MRAI Timer
In order to make fair comparisons of slow convergence ob-served by different monitors, we need to be able to tell whethera monitor enables MRAI timer or not. The BGP specification(RFC 4271 [16]) defines the MRAI as the minimum amountof time that must elapse between two consecutive updates sentby a router regarding the same destination prefix. LackingMRAI timer may lead to significantly more update messagesand longer global convergence time [17]. Even though it isa recommended practice to enable the MRAI timer, not allrouters are configured this way. Since MRAI timer will affectobserved event duration and number of updates, for the pur-pose of studying impacts of policies and topology, we shouldonly make comparisons among MRAI monitors, or amongnon-MRAI monitors, but not between MRAI and non-MRAImonitors.
By default, the MRAI timer is set to 30 s plus a jitter to avoidunwanted synchronization. The amount of jitter is determinedby multiplying the base value (e.g., 30 s) by a random factorthat is uniformly distributed in the range [0.75, 1]. Assumingrouters are configured with the default MRAI values, we should1) not observe consecutive updates spaced by less than
s for the same destination prefix, and 2) observea considerable amount of interarrival times between 22.5 and30 s, centered around the expected value,
s.For each monitor, we define a Non-MRAI Likelihood, ,
as the probability of finding consecutive updates for the sameprefix spaced by less than 22 s. Fig. 16 shows for all the50 monitors in our initial set. Clearly, there are monitors withvery high and monitors with very small . The curve hasa sharp turn, hinting a major configuration change. Based onthis, we decided to set as a threshold to differen-tiate MRAI and non-MRAI monitors. Those withare classified as MRAI monitors, and those withare classified as non-MRAI monitors. However, there could stillbe cases of non-MRAI monitors with MRAI timer configura-tion just slightly bellow the RFC recommendation, which wouldtherefore be excluded using our method. In order to assure thiswas not the case, we show in Fig. 16 the curve corresponding
Authorized licensed use limited to: Barbara Lange. Downloaded on April 15, 2009 at 01:13 from IEEE Xplore. Restrictions apply.

454 IEEE/ACM TRANSACTIONS ON NETWORKING, VOL. 17, NO. 2, APRIL 2009
to the probability of finding consecutive updates spaced by lessthan 10 s. We note that the 10-s curve is very close to the 22-scurve, and therefore we are effectively only excluding monitorsthat depart significantly from the 30-s base value of the RFC.
Using this technique, we detect that 15 routers from the initialset of 50 are non-MRAI (see the vertical line in Fig. 16), and 10of them are part of the set of 32 routers we used in the previoussection. We will use this set of monitors forthe next subsection to compare the extent of slow convergenceacross monitors.
B. The Impact of Policy and Topology on Routing Convergence
Internet routing is policy-based. The “no-valley” policy [13],which is based on inter-AS relationships, is the most preva-lent one in practice. Generally, most ASs have relationshipswith their neighbors as provider–customer or peer–peer. Ina provider–customer relationship, the customer AS pays theprovider AS to get access service to the rest of the Internet. Ina peer–peer relationship, the two ASs freely exchange trafficbetween their respective customers. As a result, a customerAS does not forward packets between its two providers, and apeer–peer link can only be used for traffic between the two in-cident ASs’ customers. For example, in Fig. 19, paths [C E D],[C E F], and [C B D] all violate the “no-valley” policy andgenerally are not allowed in the Internet.
Based on AS connectivity and relationships, the Internetrouting infrastructure can be viewed as a hierarchy.
• Core: Consisting of a dozen or so tier-1 providers formingthe top level of the hierarchy.
• Middle: ASs that provide transit service but are not part ofthe core.
• Edge: Stub ASs that do not provide transit service (they arecustomers only).
We collect an Internet AS topology [18], infer inter-AS relation-ships using the algorithm from [19], and then classify all ASsinto these three tiers. Core ASs are manually selected based ontheir connectivity and relationships with other ASs [18], EdgeASs are those that only appear at the end of AS paths, and therest are middle ASs. With this classification, we can locate mon-itors and prefix origins with regard to the routing hierarchy.
Our set of 22 monitors consists of four monitors in the core,15 in the middle and three at the edge. We would like to havea more representative set of monitors at the edge, but we onlyfound these many monitors in this class with consistent datafrom the RouteViews and RIPE data archive. The results pre-sented in this subsection might not be quantitatively accuratedue to the limitation of the monitor set, but we believe they stillqualitatively illustrate the impact of monitor location on slowconvergence.
In the previous section, we showed that events haveboth the longest convergence time and the most path explorationfrom all path change events. Furthermore, in a event, theroot cause of the failure is most likely inside the destination AS,and thus all monitors should observe the same set of events.Therefore, the events provide a common base for compar-ison across monitors and prefixes, and the difference betweenconvergence time and the number of updates should be mostpronounced. In this subsection, we examine how the location of
Fig. 17. Duration of events as seen by monitors at different tiers.
Fig. 18. Number of unique paths explored during as seen by monitorsat different tiers.
prefix origins and monitors impact the extent of slow conver-gence.
Fig. 17 shows the duration of events seen by monitorsin each tier. The order of convergence time is
, and the medians of convergence times are 60, 84, and84 s for core, middle, and edge, respectively. Taking into ac-count that our edge monitor ASs are well connected—one hasthree providers in the core, and the other two reach the corewithin two AS hops—we believe that, in reality, edge will gen-erally experience even longer convergence times than the valueswe measured. Fig. 18 shows that monitors in the middle and atthe edge explore two or more paths in about 60% of the cases,whereas monitors in the core explore at most one path in about65% of the cases.
In a event, the monitor will not finish the convergenceprocess until it has explored all alternative paths. Therefore,the event duration depends on the number of alternative pathsbetween the event origin and the monitor. In general, due tono-valley policy [13], tier-1 ASs have fewer paths to explorethan lower tier ASs. For example, in Fig. 19, node D (repre-senting a tier-1 AS) has only one no-valley path to reach node G(path 4), while node E has three paths to reach the same destina-tion: paths 1, 2, and 3. In order to reach a destination, tier-1 ASs
Authorized licensed use limited to: Barbara Lange. Downloaded on April 15, 2009 at 01:13 from IEEE Xplore. Restrictions apply.

OLIVEIRA et al.: QUANTIFYING PATH EXPLORATION IN THE INTERNET 455
Fig. 19. Topology example.
Fig. 20. Duration of events observed and originated in different tiers.
can only utilize provider–customer links and peer–peer links toother tier-1s, but a lower tier AS can also use customer–providerlinks and peer–peer links in the middle tier, which leads to morealternative paths to explore during events.
We have studied how events are experienced by moni-tors in different tiers. We now study how the origin of the eventimpacts the convergence process. Note that we must again di-vide the results according to the monitor location; otherwise, wemay introduce bias caused by the fact that most of our monitorsare in the middle tier. We use the notation , where is thetier where the event is originated from and is the tierof the monitor that observes the event. In our measurements, weobserved that the convergence times of case were closeto the case. Therefore, from these two cases, we will onlyshow the case where we have a higher percentage of monitors.For instance, between and cases,we will only show the latter since our monitor set covers about27% of the core but only a tiny percentage of the edge. Fig. 20shows the duration of events for prefixes originated andobserved at different tiers. We omit the casesand for clarity of the figure since they al-most overlap with curves and ,respectively. The figure shows that the case is thefastest, and the and cases are the
Fig. 21. Number of paths explored during events observed and origi-nated in different tiers.
Fig. 22. Median of duration of events observed and originated in dif-ferent tiers.
slowest. This observation is also confirmed by Fig. 21, whichshows the number of paths explored during . Fig. 22 liststhe median durations of events originated and observed atdifferent tiers. Events observed by the core have the shortest du-rations, which confirms our previous observation (see Fig. 17).Note that the convergence is slightly faster thanthe convergence. We believe this happens be-cause, as mentioned before, our set of edge monitors are veryclose to the core. Therefore, they may not observe so much pathexploration as the middle monitors, which may have a numberof additional peer links to reach other edge nodes without goingthrough the core.
Note that we expect that the case reflects mostof the slow routing convergence observed in the Internet becauseabout 80% of the autonomous systems in the Internet are at theedge, and about 68% of the events are originated at theedge, as shown in the next subsection.
C. Origin of Fail-Down Events
We now examine where the events are originatedin the Internet hierarchy. Since we expect the set ofevents to be common to all the 32 monitors of our data set(Section III), we will use in this subsection a single monitor,the router 144.228.241.81 from Sprint. Note that similar resultsare obtained from other monitors.
Because our data set spans a one-month period, we do notknow if during this time there was any high-impact event thattriggered an abnormal number of failures, which couldbias our results if we simply use daily count or hourly count.
Authorized licensed use limited to: Barbara Lange. Downloaded on April 15, 2009 at 01:13 from IEEE Xplore. Restrictions apply.

456 IEEE/ACM TRANSACTIONS ON NETWORKING, VOL. 17, NO. 2, APRIL 2009
Fig. 23. Number of events over time.
TABLE IIIEVENTS BY ORIGIN AS
Instead, Fig. 23 plots the cumulative number of eventsas observed by the monitor during January 2006, and the timegranularity is second. The cumulative number of events growslinearly, with an approximate constant number of 3600events per day. This uniform distribution along the time dimen-sion seems also to suggest that most fail-down events have arandom nature.
Table III shows the breakdown of events by the tierfrom which they are originated. We observe that about 68% ofthe events are originated at the edge. However, the edge also an-nounces a chunk of 56% of the prefixes. Therefore, in order toassess the stability of each tier, and since our identification ofevents is based on prefix, a simple event count is not enough.A better measure is to divide the number of events originatedat each tier by the total number of prefixes originated from thattier. The row “No. events per prefix” in Table III shows thatif the core originates events per prefix, the middle originates
and the edge originates such events, yielding theinteresting proportion 1:2:3. This seems to indicate that, gener-ally, prefixes in the middle are twice as unstable as prefixes inthe core, and prefixes at the edge are three times as unstable asprefixes in the core.
D. Impact of Fail-Down Convergence
The ultimate goal of routing is to deliver data packets. Onemay argue that although events have the longest conver-gence time, they do not make the performance of data deliveryworse because the data packets would be dropped anyway if theprefix is unreachable. However, this is not necessarily true. Inthe current Internet, sometimes the same destination networkcan be reached via multiple prefixes. Therefore, the failure to
Fig. 24. Case where convergence disrupts data delivery.
reach one prefix does not necessarily mean that the destinationis unreachable because it may be reachable via another prefix.
Fig. 24 shows a typical example. Network A has twoproviders, B and C. To improve the availability of its In-ternet access, A announces prefix 131.179/16 via B and prefix131.179.100/24 via C. In this case, 131.179/16 is called the“covering prefix” [20] of 131.179.100/24. As routing is doneby longest prefix match, data traffic destined to 131.179.100/24normally takes link A–C to enter network A. When link A–Cfails, ideally, data traffic should switch to link A–B quicklywith minimal damage to data delivery performance. How-ever, the failure of link A–C will result in a event for131.179.100/24. Before the convergence process completes,routers will keep trying obsolete paths to 131.179.100/24 ratherthan switching to paths toward 131.179/16. This can result inpackets lost and long delays, which probably will have seriousnegative impacts on data delivery performance.
We analyzed routing tables from RouteViews and RIPE mon-itors to see how frequent the scenarios illustrated by Fig. 24are. The result shows that routing announcements like the onein Fig. 24 are a common practice in the Internet. In the globalrouting table, 50% of prefixes have covering prefixes being an-nounced through a different provider and are, therefore, vulner-able to the negative impacts caused by fail-down convergence.A recent study [21] showed that about 50% of VOIP glitchesas perceived by end users may be caused by BGP slow conver-gence.
V. RELATED WORK
There are two types of BGP update characterization work inthe literature: passive measurements [10], [12], [22]–[28] andactive measurements [1]–[3]. The work presented in this paperbelongs to the first category. We conducted a systematic mea-surement to classify routing instability events and quantify pathexploration for all the prefixes in the Internet. Our measurementalso showed the impact of AS’s tier level on the extent of pathexplorations.
Existing measurements of path exploration and slow con-vergence have all been based on active measurements [1]–[3],where controlled events were injected into the Internet froma small number of beacon sites. These measurement resultsdemonstrated the existence of BGP path exploration and slowconvergence but did not show to what extent they exist on theInternet under real operational conditions. In contrast, in thispaper, we classify routing events of all prefixes, as opposedto a small number of beacon sites, into different categories,
Authorized licensed use limited to: Barbara Lange. Downloaded on April 15, 2009 at 01:13 from IEEE Xplore. Restrictions apply.

OLIVEIRA et al.: QUANTIFYING PATH EXPLORATION IN THE INTERNET 457
and for each category we provide measurement results on theupdates per event and event durations. Given we examine theupdates from multiple peers for all the prefixes in the globalrouting table, we are able to identify the impact of AS tierlevels on path exploration. Regarding the relation between thetier levels of origin ASs, our results agree with previous activemeasurement work [2] (using a small number of beacon sites)that prefixes originated from tier-1 ASs tend to experience lessslow convergence compared to prefixes originated from lowertier ASs. Moreover, our results also showed that, for the sameprefix, routers of different AS tiers observe different degrees ofslow convergence, with tier-1 ASs seeing much less than lowertier ASs.
Existing passive measurements have studied the instability ofall the prefixes. The focuses have been on update interarrivaltime, event duration, location of instability, and characteriza-tion of individual updates [10], [12], [22]–[28]. There is no pre-vious work on classifying routing events according to their ef-fects (e.g. whether path becomes better or worse after the event).Our paper describes a novel path preference heuristic based onpath usage time, and studies in detail the characteristics of dif-ferent classes of instability events in the Internet.
Our approach shares certain similarities with [10], [12], and[28] in that we all use a timeout-based approach to group up-dates into events. Such an approach can mistakenly group up-dates of multiple root causes that happened close to each otheror overlapped in time into a single event. As we discussed ear-lier, the events in our Path-Disturbance category can be exam-ples of grouping updates of overlap root causes because the pathto a prefix changed at least twice, and often more times, duringone event. We moved a step forward by detecting and separatingthese overlapping events into a different category. It is mostlikely that those Path-Change events with very long durationsare also overlapping events, and one possible way to identifythem is to set a time threshold on the event duration, which weplan to do in the future.
VI. CONCLUSION
We conducted the first systematic measurement study toquantify the existence of path exploration and slow conver-gence in the global Internet routing system. We first developed anew path-ranking method based on the usage time of each pathand validated its effectiveness using data from controlled exper-iments with beacon prefixes. We then applied our path-rankingmethod to BGP updates of all the prefixes in the global routingtable and classified each observed routing event into threeclasses: Path Change, Path Disturbance, and Same Path. ForPath Change events, we further classified them into 4 subcat-egories: , , , and . We measured the pathexploration, convergence duration, and update count for eachtype of event.
Our work shows several significant results. First, althoughthere is a wide existence of path exploration and slow con-vergence in the global routing system, the significance of theproblem can vary considerably depending on the locations ofboth the origin ASs and the observation routers in the routingsystem hierarchy. In general, routers in tier-1 ISPs observe lesspath exploration and shorter convergence delays than routers in
edge ASs, and prefixes originated from tier-1 ISPs also expe-rience much less slow convergence than those originated fromedge ASs.
Second, events have short duration, in general, that arecomparable to that of and events. This is in accor-dance to our previous theoretical analysis results presented in[6] and is a noticeable departure from widely accepted viewsbased on the previous experiments [1].
Furthermore, our data shows that the Same Path events ac-count for about 34% of the total routing events, which seems analarmingly high value. Since this class of events is most likelycaused by internal routing changes within individual ASs, mostof them probably should not have existed in the first place. Fur-ther investigations are needed to better understand the causesof the Same Path events. We also observed that about 30% ofthe routing events are due to transient route changes (which arecaptured as path disturbance events in our measurement) and areresponsible for close to half of all the routing updates (47%).It would be interesting to identify the causes of these transientrouting changes in order to further stabilize the global routingsystem.
REFERENCES
[1] C. Labovitz, A. Ahuja, A. Abose, and F. Jahanian, “Delayed Internetrouting convergence,” IEEE/ACM Trans. Netw., vol. 9, no. 3, pp.293–306, Jun. 2001.
[2] C. Labovitz, A. Ahuja, R. Wattenhofer, and S. Venkatachary, “The im-pact of Internet policy and topology on delayed routing convergence,”in Proc. IEEE INFOCOM, Anchorage, AK, Apr. 2001, pp. 537–546.
[3] Z. M. Mao, R. Bush, T. Griffin, and M. Roughan, “BGP beacons,” inProc. ACM SIGCOMM Internet Meas. Conf. (IMC), Miami Beach, FL,Oct. 2003, pp. 1–14.
[4] “The RouteViews project,” 2005 [Online]. Available: http://www.routeviews.org/
[5] “The RIPE routing information services,” 2008 [Online]. Available:http://www.ris.ripe.net
[6] D. Pei, B. Zhang, D. Massey, and L. Zhang, “An analysis of path-vectorrouting protocol convergence algorithms,” Comput. Netw., vol. 50, no.3, pp. 398–421, 2006.
[7] “PSG beacon list,” [Online]. Available: http://www.psg.com/~zmao/BGPBeacon.html
[8] “RIPE beacon list,” [Online]. Available: http://www.ripe.net/ris/docs/beaconlist.html
[9] B. Zhang, V. Kambhampati, M. Lad, D. Massey, and L. Zhang, “Identi-fying BGP routing table transfers,” in Proc. ACM SIGCOMM MineNetWorkshop, Philadelphia, PA, Aug. 2005, pp. 213–218.
[10] J. Rexford, J. Wang, Z. Xiao, and Y. Zhang, “BGP routing stability ofpopular destinations,” in Proc. ACM SIGCOMM Internet Meas. Work-shop (IMW), Marseille, France, 2002, pp. 197–202.
[11] D. Chang, R. Govindan, and J. Heidemann, “The temporal and topo-logical characteristics of BGP path changes,” in Proc. Int. Conf. Netw.Protocols (ICNP), Atlanta, GA, Nov. 2003, pp. 190–199.
[12] A. Feldmann, O. Maennel, Z. M. Mao, A. Berger, and B. Maggs, “Lo-cating Internet routing instabilities,” in Proc. ACM SIGCOMM, Port-land, OR, 2004, pp. 205–218.
[13] L. Gao, “On inferring autonomous system relationships in the Internet,”IEEE/ACM Trans. Netw., vol. 9, no. 6, pp. 733–745, Dec. 2001.
[14] W. Mühlbauer, S. Uhlig, B. Fu, M. Meulle, and O. Maennel, “In searchfor an appropriate granularity to model routing policies,” in Proc. ACMSIGCOMM, Kyoto, Japan, 2007, pp. 145–156.
[15] A. Markopoulou, G. Iannaccone, S. Bhattacharyya, C.-N. Chuah, andC. Diot, “Characterization of failures in an IP backbone network,” inProc. IEEE INFOCOM, Hong Kong, Mar. 2004, Sprint ATL ResearchReport.
[16] Y. Rekhter, T. Li, and S. Hares, “Border gateway protocol 4,” InternetEngineering Task Force, RFC 4271, Jan. 2006, , .
[17] T. G. Griffin and B. J. Premore, “An experimental analysis of BGP con-vergence time,” in Proc. Int. Conf. Netw. Protocols (ICNP), Riverside,CA, Nov. 2001, pp. 53–61.
Authorized licensed use limited to: Barbara Lange. Downloaded on April 15, 2009 at 01:13 from IEEE Xplore. Restrictions apply.

458 IEEE/ACM TRANSACTIONS ON NETWORKING, VOL. 17, NO. 2, APRIL 2009
[18] B. Zhang, R. Liu, D. Massey, and L. Zhang, “Collecting the Internetas-level topology,” ACM SIGCOMM Comput. Commun. Rev., vol. 35,no. 1, pp. 53–62, Jan. 2005.
[19] J. Xia and L. Gao, “On the evaluation of AS relationship inferences,”in Proc. IEEE GLOBECOM, Dec. 2004, vol. 3, pp. 1373–1377.
[20] X. Meng, Z. Xu, B. Zhang, G. Huston, S. Lu, and L. Zhang, “IPv4 ad-dress allocation and BGP routing table evolution,” in Proc. ACM SIG-COMM Comput. Commun. Rev. (CCR) Special Issue on Internet VitalStatistics, Jan. 2005, pp. 71–80.
[21] N. Kushman, S. Kandula, and D. Katabi, “Can you hear me now?!: Itmust be BGP,” SIGCOMM Comput. Commun. Rev., vol. 37, no. 2, pp.75–84, 2007.
[22] C. Labovitz, G. Malan, and F. Jahanian, “Internet routing instability,”in Proc. ACM SIGCOMM, Cannes, France, Sep. 1997, pp. 115–126.
[23] C. Labovitz, R. Malan, and F. Jahanian, “Origins of Internet routinginstability,” in Proc. IEEE INFOCOM, New York, NY, Mar. 1999, pp.218–226.
[24] C. Labovitz, A. Ahuja, and F. Jahanian, “Experimental study of In-ternet stability and backbone failures,” in Proc. FTCS, Madison, WI,Jun. 1999, pp. 278–285.
[25] L. Wang, X. Zhao, D. Pei, R. Bush, D. Massey, A. Mankin, S. F.Wu, and L. Zhang, “Observation and analysis of BGP behavior understress,” in Proc. ACM SIGCOMM Internet Meas. Workshop (IMW),Marseille, France, 2002, pp. 183–195.
[26] D. Andersen, N. Feamster, S. Bauer, and H. Balakrishnan, “Topologyinference from BGP routing dynamics,” in Proc. ACM SIGCOMM In-ternet Meas. Workshop (IMW), Marseille, France, 2002, pp. 243–248.
[27] O. Maennel and A. Feldmann, “Realistic BGP traffic for test labs,” inProc. ACM SIGCOMM, Pittsburgh, PA, 2002, pp. 31–44.
[28] J. Wu, Z. M. Mao, J. Rexford, and J. Wang, “Finding a needle ina haystack: Pinpointing significant BGP routing changes in an IPnetwork,” in Proc. Symp. Netw. Syst. Design Implementation (NSDI),Boston, MA, May 2005, vol. 2, pp. 1–14.
Ricardo Oliveira (M’08) received the B.S. inelectrical engineering from the Engineering Facultyof Porto University (FEUP), Porto, Portugal, in 2001and the M.S. degree in computer science from theUniversity of California, Los Angeles (UCLA) in2005. He has been pursuing the Ph.D. degree incomputer science at UCLA since 2005.
His research interests include Internet topology,next generation routing architectures, and develop-ment of Internet monitoring and measurement plat-forms. He is a student member of the Association for
Computing Machinery.
Beichuan Zhang received the B.S. degree from Bei-jing University, Beijing, China, in 1995 and the Ph.D.degree in computer science from the University ofCalifornia, Los Angeles in 2003.
He is an Assistant Professor in the Departmentof Computer Science at the University of Arizona,Tucson. His research interests include Internetrouting and topology, multicast, network measure-ment, and security.
Dan Pei received the B.S. and M.S. degrees from Ts-inghua University, Beijing, China, in 1997 and 2000,respectively, and the Ph.D. degree from the Univer-sity of California, Los Angeles, in 2005.
He is a Researcher at AT&T Research, FlorhamPark, NJ. His current research interests are networkmeasurement and security.
Lixia Zhang received the Ph.D. degree in computerscience from the Massachusetts Institute of Tech-nology, Cambridge.
She was a Member of the research staff at theXerox Palo Alto Research Center before joining thefaculty of the Computer Science Department at theUniversity of California, Los Angeles, in 1995.
Dr. Zhang has served as the Vice Chair of ACMSIGCOMM and as Co-Chair of IEEE Commu-nication Society Internet Technical Committee.She is on the editorial board for the IEEE/ACM
TRANSACTIONS ON NETWORKING. She is currently serving on the InternetArchitecture Board.
Authorized licensed use limited to: Barbara Lange. Downloaded on April 15, 2009 at 01:13 from IEEE Xplore. Restrictions apply.