quantifying roadside rest area usagedocs.trb.org/00941461.pdf · iii quantifying roadside rest area...
TRANSCRIPT

i
Quantifying Roadside Rest Area Usage
Dr. Per E. Gårder, PI
Mr. Nicolas Bosonetto, Research Assistant
Prepared for The New England Transportation Consortium
November 27, 2002
NETCR38 Project No. 99-4
This report, prepared in cooperation with the New England Transportation Consortium, does not constitute a standard, specification, or regulation. The contents of this report reflect the views of the authors who are responsible for the facts and the accuracy of the data presented herein. The contents do not necessarily reflect the views of the New England Transportation Consortium or the Federal Highway Administration.

ii
Technical Report Documentation Page
1. Report No. NETCR 38
2. Government Accession No.
N/A 3. Recepient’s Catalog No.
N/A
4. Title and Subtitle
5. Report Date
November 27, 2002
6. Performing Organization Code
N/A
7. Author(s) 8. Performing Organization Report No.
Dr. Per E. Gårder and Mr. Nicolas Bosonetto N/A
9. Performing Organization Name and Address
10 Work Unit No. (TRAIS)
Department of Civil and Environmental Engineering University of Maine Orono, Maine 04469-5711
N/A
11. Contract or Grant No.
N/A
13. Type of Report and Period Covered 12. Sponsoring Agency Name and Address
New England Transportation Consortium 179 Middle Turnpike University of Connecticut, U-202 Storrs, CT 06269-5202
Technical Report: 1999-2002
14. Sponsoring Agency Code
NETC 99-4 Quantifying Roadside Rest Area Usage
15 Supplementary Notes
N/A 16. Abstract
17. Key Words
Rest area, Interstate, New England, prefer-ences, motorists
18. Distribution Statement
No restrictions. This document is available to the public through the National Technical Information Service, Springfield, Virginia 22161.
19. Security Classif. (of this report) Unclassified
20. Security Classif. (of this page) Unclassified
21. No. of Pages
113 21. Price
N/A Form DOT F 1700.7 (8-72) Reproduction of completed page authorized
Quantifying Roadside Rest Area Usage
This report outlines issues relevant to the design and operation of Interstate rest areas. The study concentrates on the New England Region and is sponsored by the NETC. Usage trends and motorists’ preferences were collected through a survey program conducted at eleven sites and with residents of all the New England states. Motorists in general see rest areas as a necessity, and favor keeping them, but many have issues with public safety and cleanliness. The results also show that restrooms are the primary demand but that road condition and tourism information services are rated as highly desirable by some rest area users. This report suggests a kiosk system to provide this information to travelers using a GIS interface. Other recommendations include region-wide comprehensive parking development and management, as well as improvements in waste water systems. Rest area improvements are essential to the New England tourism and freight sectors of the economy.

iii
QUANTIFYING ROADSIDE REST AREA USAGE
Prepared by: Per E. Gårder, Professor
Nicolas Bosonetto, Research Assistant Department of Civil and Environmental Engineering
The University of Maine
Final Report November 2002
For the New England Transportation Consortium
Abstract: This report outlines issues relevant to the design and operation of Interstate rest areas. The study concentrates on the New England Region and is sponsored by the NETC. Usage trends and motorists’ preferences were collected through a survey program conducted at eleven sites and with residents of all the New England states. Motorists in general see rest areas as a necessity, and favor keeping them, but many have issues with public safety and cleanliness. The results also show that rest-rooms are the primary demand but that road condition and tour-ism information services are rated as highly desirable by some rest area users. This report suggests a kiosk system to provide this information to travelers using a GIS interface. Other rec-ommendations include region-wide comprehensive parking de-velopment and management, as well as improvements in waste water systems. Rest area improvements are essential to the New England tourism and freight sectors of the economy.
iv
ACKNOWLEDGMENTS Mr. Nicolas Bosonetto and I would first of all like to thank the New England Transporta-tion Consortium for funding the project and providing assistance through its Technical Committee. Mr. Robert LaRoche of Maine Department of Transportation has chaired the Technical Committee. Other committee members were Mr. Joseph J. Amatore of Rhode Island, Mr. Mark K. Berger of the Mass Highway Department, Mr. Kenneth T. Kyle, of New Hampshire Department of Transportation, Ms. Karen Songhurst of Vermont (for-merly Head of the Association of Chamber of Commerces in Vermont) and Ms. Dionysia F. Oliveira, of the Connecticut Department of Transportation. From Connecticut De-partment of Transportation, comments were also received from Mr. Thomas E. Daly and Mr. Jeffrey T. Harper. From Vermont, Mr. Dick Foster, Director of Welcome & Infor-mation Centers provided valuable information. We would also like to thank the thesis committee members, Professors Bryan Pearce and Willem Brutsaert for their input and all others who participated in this project. We would especially like to mention Glenn Correll for his assistance in conducting field studies and Mary Burton from the Univer-sity of Maine. And we would like to thank our wives, Jill, Nicolas’s wife, for all her pa-tience, and Eva, my wife, for supporting me in this work even though she was unsuccess-fully trying to fight off metastatic cancer at the end of 2000.
Much of what is presented in this report was also presented in a Master’s Thesis with the same title that Nicolas Bosonetto presented in December of 2000.
Per Gårder

v
TABLE OF CONTENTS
TECHNICAL REPORT DOCUMENTATION PAGE ............................................................ii1 EXECUTIVE SUMMARY.......................................................................................... 1 2 INTRODUCTION........................................................................................................ 3 2.1 Problem Statement .................................................................................................... 3 2.2 Objective of the Research ......................................................................................... 3 2.3 Organization of the Report........................................................................................ 4 3 BACKGROUND.......................................................................................................... 5 3.1 Services ..................................................................................................................... 5 3.2 Interstate Rest Areas Types ...................................................................................... 6 3.3 Truck Parking............................................................................................................ 8
3.3.1 Truck Safety ................................................................................................................................8 3.3.2 Commercial Driver Rest and Parking Requirements.................................................................11 3.3.3 Rest Area Forum: Summary of Proceedings .............................................................................13 3.3.4 Media Coverage ........................................................................................................................13 3.3.5 State-Level Studies....................................................................................................................13
3.4 Rest Areas Away From Interstates ......................................................................... 15 3.5 Rest Area Commercialization ................................................................................. 16 3.6 Rest Area Design .................................................................................................... 17 3.7 Security Concerns ................................................................................................... 18 4 ECONOMIC ANALYSIS.......................................................................................... 18 4.1 Economic Benefits .................................................................................................. 18
4.1.1 Commerce .................................................................................................................................19 4.1.2 Tourism .....................................................................................................................................21
4.2 Financial.................................................................................................................. 21 4.2.1 Current Uses and Leases ...........................................................................................................21 4.2.2 Connecticut................................................................................................................................21 4.2.3 Maine.........................................................................................................................................22
4.3 Commercialization.................................................................................................. 22 4.3.1 Traffic Characteristics ...............................................................................................................23 4.3.2 Site Characteristics ....................................................................................................................23 4.3.3 Conclusions ...............................................................................................................................23
5 SURVEY OF REST AREA USE............................................................................... 23 5.1 Number of Motorists Stopping ............................................................................... 23
5.1.1 New Hampshire .........................................................................................................................24 5.1.2 Vermont.....................................................................................................................................25 5.1.3 Chelmsford, Massachusetts .......................................................................................................26 5.1.4 Augusta, Maine .........................................................................................................................27 5.1.5 Long-Weekend Uses .................................................................................................................31 5.1.6 Conclusions of Parking Analysis...............................................................................................38
5.2 Preference Study User Groups................................................................................ 39 5.2.1 Commercial Drivers ..................................................................................................................39 5.2.2 Motorists on Vacation / Recreational Trips...............................................................................40 5.2.3 Commuters ................................................................................................................................40 5.2.4 General Motorists ......................................................................................................................40
5.3 Survey Method........................................................................................................ 40 5.4 Survey Forms .......................................................................................................... 41 5.5 Survey Locations .................................................................................................... 44 5.6 Survey Results ........................................................................................................ 47
5.6.1 Motorist Surveys .......................................................................................................................47

5.6.2 Commercial Driver Surveys ......................................................................................................48 5.6.3 Preferences Survey ....................................................................................................................49
6 ADDITIONAL TRAVELER SURVEYS.................................................................. 51 6.1 Purpose and Method ............................................................................................... 51
6.1.1 Travel Diaries ............................................................................................................................51 6.1.2 In-depth Interviews....................................................................................................................52
6.2 Results and Conclusions ......................................................................................... 52 6.2.1 Travel Diaries ............................................................................................................................52 6.2.2 Restrooms Stops ........................................................................................................................52 6.2.3 Stops to Nap ..............................................................................................................................53 6.2.4 Personal and Traffic Safety .......................................................................................................54 6.2.5 Maintenance and Operations .....................................................................................................55 6.2.6 Smoking ....................................................................................................................................55 6.2.7 Services to be Added .................................................................................................................55 6.2.8 Services Potentially to be Eliminated ........................................................................................56 6.2.9 Physical Layout .........................................................................................................................56 6.2.10 Distance between Rest Areas ....................................................................................................56 6.2.11 Summary ...................................................................................................................................57
7 REST AREA TECHNOLOGY SERVICES.............................................................. 57 7.1 Catalog Map............................................................................................................ 58 7.2 GIS Information Kiosks........................................................................................59
7.2.1 Financing Kiosks .......................................................................................................................60 7.2.2 Current Uses ..............................................................................................................................61
7.3 ITS........................................................................................................................... 62 8 DESIGN ..................................................................................................................... 64 8.1 Safety ...................................................................................................................... 64 8.2 Scenic Design.......................................................................................................... 66 8.3 Wastewater Management & Water Conservation................................................... 67
8.3.1 Compressed Air Toilets .............................................................................................................67 8.3.2 Effluent and Gray-Water Recycling ..........................................................................................72 8.3.3 Composting System...................................................................................................................74 8.3.4 Chemical Toilets........................................................................................................................74 8.3.5 Automated Restroom Fixtures...................................................................................................77 8.3.6 Wastewater Conclusions ...........................................................................................................77
8.4 Building Design ...................................................................................................... 77 9 MANAGEMENT ACCOUNTABILITY PROCESS (MAP) .................................... 78 9.1 Washington State’s MAP........................................................................................ 78 9.2 Rest Area Maintenance and Service Levels............................................................ 79 9.3 Suggested Management Accountability Process for New England States ............. 81
9.3.1 Spacing of Rest Areas ...............................................................................................................81 9.3.2 Coordination Between States.....................................................................................................81 9.3.3 General Recommendations........................................................................................................81 9.3.4 Maintenance Concerns ..............................................................................................................82 9.3.5 Suggested Priorities ...................................................................................................................82
10 CONCLUSIONS AND RECOMMENDATIONS..................................................... 83 10.1 Conclusions............................................................................................................. 83 10.2 Recommendations................................................................................................... 84 11 REFERENCES........................................................................................................... 87 11.1 LIST OF TABLES............................................................................... .................. 90
– SURVEY RESULTS ..........................................................................91 12 APPENDIXvi
11.2 LIST OF FIGURES......................................................................... ...................... .90

vii
13 APPENDIX B – STATISTICAL ANALYSIS ..........................................................10014 APPENDIX C—GIS MAPPING PROGRAM ........................................................ 104 14.1 Data Setup............................................................................................................. 104 14.2 Creating Routes..................................................................................................... 105 14.3 Creating Route Events .......................................................................................... 105 14.4 Data Conversion.................................................................................................... 105

1
QUANTIFYING ROADSIDE REST AREA USAGE
1 EXECUTIVE SUMMARY Interstate rest areas are valuable resources to the New England states. They provide
useful services to travelers who need a break from driving, while at the same time allow-ing the state to make a positive impression and facilitate tourism and commerce. The ob-jective of this research has been to find which rest-area services motorists deem neces-sary, important and of little use.
Rest areas must be managed and renovated to meet the demands of increasing traffic volumes and changing needs and desires. The three major issues facing rest-area facili-ties are inadequate quantity of large commercial vehicle parking spaces, outdated traveler information systems and inefficient wastewater management. These problems were found to be important through a combination of background research, interviews with state and federal transportation officials, surveys of motorists and conversations with rest area managers and support personnel.
Surveys were the primary method used in finding the public’s opinions regarding rest area facilities. Through these surveys motorists were asked to rate the necessity for various services on a Likert Scale (1 to 5). The study was conducted at eleven rest areas located throughout all six New England states. Commercial truck drivers, commuters, tourists, and people on personal trips completed a total of 562 surveys. In addition, some motorists were interviewed in depth about their opinions. The samples were taken from people of all ages, races, and economic and education levels, with some surveys being conducted in Spanish.
Some of the important findings were: 1. The primary reason motorists stop at rest areas is to use the restrooms in 56.7% of
the cases. Toilets should therefore always be provided. 2. 21.1 % of the time, resting/taking a nap is the primary reason among motorists for
stops. 3. The primary reason truck drivers stop is to use the restroom in 39.0% of the cases. 4. Resting is the primary reason 25.4% of the time for truck drivers to stop. 5. 93.2% of truck drivers perceive a shortage of parking spaces at rest areas. 6. Truck drivers consider 55 miles the optimal spacing between rest areas. 7. Truck drivers rated telephones as the most valuable service along with road in-
formation and vending machines. 8. Motorists consider clean restrooms as the most important amenity followed by
tourist and road information. 9. Overall, rest area users rated commercial services such as ATMs, fuel and hot
foods towards the bottom of the list. 10. To the average motorist, the least useful amenities were pet areas, picnic areas
and barbecue grills. These surveys show that the traveling public desires clean restrooms, staffed facili-
ties, useful information, vending machines and telephones. In order to provide these ser-vices for free, it is necessary to find non-commercial funding for the facilities. One method of funding is the leasing of rest areas to tourism departments or chambers of commerce. The lessee pays to operate and maintain the facilities at a financial loss be-cause they gain economically by facilitating tourist dollars into their local economies.

2
Truck parking is an important issue concerning road safety and freight movements. The majority of freight traveling into, out off, and within the New England region con-sists of tractor-trailers traveling the Interstate system. The drivers of these commercial vehicles depend on rest areas to rest and refresh themselves, and for access to road infor-mation and telephones. Studies conducted by The Federal Highway Administration (FHWA) show a severe shortage of parking capacity at rest areas for these vehicles, es-pecially in the New England region. Government action, however, is impeded by the competing interests between the National Association of Truck Stop Operators (NA-TSO), freight fleet operators and public safety advocates. The Federal government will, however, provide 100% matching funds towards the building of more parking lot facili-ties. The study “Interstate Oasis Program Need for Action” concludes that roadside truck parking lots (limited size and facilities) should be built every 70 miles, with large parking lots located at information centers and larger rest area facilities located in between these.
From the surveys conducted at rest areas, it was found that most motorists and com-mercial drivers rate tourist and road condition information as highly necessary. Cur-rently, information kiosks are beginning to enter service at rest area facilities throughout the country. These kiosks use Geographic Information System (GIS) software as the method to query and display directions, tourist destinations, construction zones, and weather and traffic conditions. These systems could become financially feasible by using advertising revenues and in-house state transportation agency GIS and Intelligent Trans-portation System (ITS) departments. There is also limited funding available from FHWA.
Almost every rest area visitor uses the restroom, and its cleanliness and capacity are critical to the overall customer satisfaction of the rest area. Motorists also rated hands-free restroom fixtures as their top necessity. Movement sensors currently used for flush-ing systems are expensive, unpredictable and easily vandalized. A better option may be to add foot-operated (pedal) flushing valves for those people who do not want to touch handles. However, ADA–approved flushing must still be maintained. Another option is to use waterless (composting) restroom systems. Composting toilets are currently used in some Massachusetts rest areas and these help reduce the amount of water used. Water conservation helps reduce a rest area’s environmental impact as a major source of waste-water.
In-depth interviews with 127 residents of the New England states show that a major-ity of people prefers to stop at rest areas for napping as well as for using restrooms com-pared to using commercial facilities at exits. However, typical, younger females avoid rest areas because of concerns with cleanliness and safety.
As previously stated, the primary objective of this research has been to find which services motorists value. Using the collected data, various alternatives are presented sug-gesting how to increase the level of service and attain the maximum economic and finan-cial benefits to the state. Finally, it is recommended that rest areas be incorporated into a comprehensive highway plan to assure complementary goals are met. For example, rest areas can contribute to highway safety and traveler information goals. With passage of the Intermodal Surface Transportation Efficiency Act (ISTEA) and the Transportation Equity Act for the 21st Century (TEA-21), the federal government and its funds have moved from road building to traffic management as the principal means of dealing with increased traffic. Rest area facilities can play a role in this shift towards intermodalism and intelligent transportation systems.

3
2 INTRODUCTION
2.1 Problem Statement Rest areas are state-owned and -operated facilities that provide services to the trav-
eling public. The cost to provide these services includes construction of the facilities, utilities, management, maintenance, security and personnel. Costs vary depending on the level and type of services offered and the age and size of the buildings. It is necessary, in the interest of efficiency, to try to maximize the benefits gained by these expenses. This report discusses the role of rest areas in highway travel as well as management options.
Rest areas provide many benefits to the traveling public, but they do not generate direct profits and possibly not enough benefits to always be justified. In order to offer a high level of service to travelers, it may be necessary to find alternatives, e.g., private partnerships, to help defer costs while cutting back on services that are not essential.
2.2 Objective of the Research The primary objective of the research is to clarify which services are essential,
highly appreciated, somewhat appreciated, and of little value, and how these needs vary over the day. A service may be essential even if there is a fairly low demand for it. For example, if only one in ten thousand motorists passing a rest area is so sleepy that he/she needs to stop, providing a safe place to take a nap for that person may save his/her life as well as other people’s lives. On the other hand, a rest area may attract hundreds or thou-sands of motorists every day because it is a convenient place to buy snacks or obtain tour-ist information. But if the rest area were to be closed, existing fast food restaurants and convenience stores at the next exit may easily be able to provide the same services, if in-formation is provided to the motorist. There may certainly be exceptions to this in areas that are rural. In other words, it is not only quantifying rest area usage that should form the basis of whether to keep a rest area or not and which services to provide there. Also, the necessity of these services and available alternatives should be considered. Con-versely, usage volumes – which are correlated with sales revenue—are what count when negotiating leasing fees. Thus, the opinion of the public regarding the (quantitative) im-portance of services provided at rest areas should form the basis of such an analysis. It is important that these studies use validated techniques so that expressed opinions (stated preferences) will be matched by actual behavior (revealed preferences). Another objec-tive of this research is to help provide the New England state transportation agencies with adequate (and accurate) information about usage and revenue generation. It may be pos-sible to use such information as a basis for negotiating optimal lessee fees with vendors.
The goal has been to use public input in determining the need for and spacing be-tween roadside rest areas along the New England Interstate system. The survey results can be used as a basis for allocation of state funds, based on which services return the most benefit vs. their costs.
The detailed objectives of the research presented here has closely tracked the follow-ing:
1. Develop method to determine rest area use and revenue generation as well as the contribution to the state’s economy.

4
2. Determine how the motoring public rates the importance of services pro-vided at rest areas.
3. Develop a prioritized list as to which services to invest in (to upgrade, to maintain at present level or to downgrade).
4. Determine what services are considered essential and which, if any, could be eliminated.
5. Determine overall public satisfaction with roadside rest areas. 6. Assess design practices for effectiveness. 7. Develop a Maintenance Accountability Process similar to that of Wash-
ington State DOT. The nature of the research is to find out what needs to be done by asking the people
that use rest areas, work at rest areas or are otherwise involved in the everyday operation of rest areas. This method ensures that the people who will be affected by any changes in rest area policy are the ones that have the most input.
The result of this research is here reported to the New England Transportation Con-sortium (NETC), which is a research coalition formed by the state transportation agencies of all the New England states. This report contains much of the same material as a thesis presented in December 2000 with the same title.
2.3 Organization of the Report The main body of this report includes nine sections as described below. Section 2 contains the introduction to the report. It is based on the proposal to the
New England Transportation Consortium (NETC). Section 3 is a literature review, which presents available information on rest area is-
sues. The literature includes research papers, news articles, DOT guidelines and regula-tions as well as publications by private and public organizations with interests in rest ar-eas.
Next, Section 4 analyzes the economic benefits that rest areas provide and their financial possibilities. Issues such as tourism, privatization and leasing are covered in this section.
Then follows, Sections 5 and 6 describing the survey method, procedure and results. It is an in-depth explanation of how rest area users were interviewed, and provides the basis for this report. Rest area users provided both their perceptions on facilities and im-provements as well as factual data on actual services used.
Section 7 covers technological issues and consists of a service catalogue system con-structed on a GIS base. This computer project also delves into possible ITS applications.
Section 8 views facility design and operation. This section covers safety, landscape, wastewater, facilities and parking concerns when designing a rest area.
Section 9 presents the Management Accountability Process. Section 10 contains the conclusions and recommendations. There are three appendices at the end of the report. These appendices provide further
detail into the database of collected samples, analysis of the surveys as well as technical information on the GIS system.

5
3 BACKGROUND Before commencing the study, background research was conducted to gain a compre-
hensive overview of rest area issues. Sources of information consisted of published and unpublished papers, interviews with DOT personnel, internet searches, and information from printed media outlets and television.
3.1 Services Rest areas provide important services to the traveling public and are used for several
purposes. Examples of services provided at rest areas may include: • A safe place to take a nap, stretch, freshen up or otherwise rest from a
long drive; • Sanitation facilities with diaper changing stations; • Pet exercise areas; • Long term (8 hrs) parking for sleeping (mostly commercial drivers); • Tourist information showing travel destinations and maps; • Weather and road condition information; • Picnic areas with barbecue grills and tables; • Drinks and snacks from vending machines; • Drinking water; • Public phones; • Trash cans; • Vista points to gaze at scenic views.
Other services also encountered are playgrounds, park-n-ride lots, newspaper vending machines, attraction pamphlets and free hotel and restaurant guides.
Currently, there is a small wave of commercialization sweeping rest areas nationwide. It is now possible to find sites that sell tourist-related merchandise, hot coffee, donuts/pastries, sandwiches and postcards. Vending machines are also becoming more sophisticated and dispense ice cream, hot drinks, calling cards and lottery tickets. There are even Internet kiosks that operate like video-game machines at arcades, allotting five minutes of Internet access for $1 (simply paid in quarters or bills). Although federal law prohibits this commercialization of rest areas, it is a tangible part of a wide movement towards implementing privatized management and operation of rest areas.
Fuel and restaurant service may be found even at non-toll Interstate rest areas. These service plazas consist of gas stations, convenience stores and fast-food franchises. Ser-vice plazas along Interstate 95 through Connecticut contain fuel and restaurants that were grandfathered and allowed to continue operations when Connecticut passed a law remov-ing the tolls making it into a free limited-access road. That is also the case in Massachu-setts along Interstate 95/Route 128.
Some rest-area services may be essential for the safety of the public, while other ser-vices provide convenience-based assistance to the traveler. Information and tourism are fast growing segments of the overall economy, and are starting to be the major force be-hind providing services at rest areas.
6
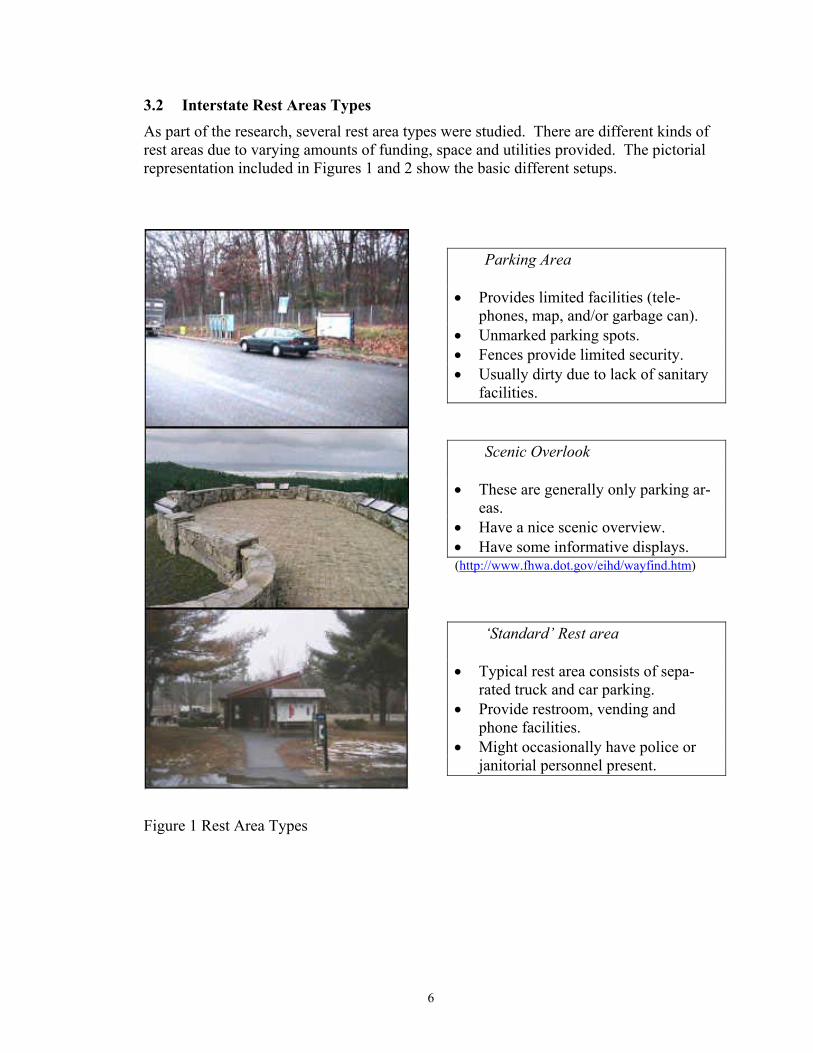
3.2 Interstate Rest Areas Types As part of the research, several rest area types were studied. There are different kinds of rest areas due to varying amounts of funding, space and utilities provided. The pictorial representation included in Figures 1 and 2 show the basic different setups.
Figure 1 Rest Area Types
Parking Area • Provides limited facilities (tele-
phones, map, and/or garbage can). • Unmarked parking spots. • Fences provide limited security. • Usually dirty due to lack of sanitary
facilities. Scenic Overlook • These are generally only parking ar-
eas. • Have a nice scenic overview. • Have some informative displays. (http://www.fhwa.dot.gov/eihd/wayfind.htm) ‘Standard’ Rest area • Typical rest area consists of sepa-
rated truck and car parking. • Provide restroom, vending and
phone facilities. • Might occasionally have police or
janitorial personnel present.

7
Welcome Center • A visitor center is usually a large fa-
cility located at entry points into the states.
• Their purpose is to provide people entering the state with tourist infor-mation.
• Inside, there is a large forayer area where local business and industry is showcased.
• They also provide restrooms, vend-ing and phone services.
Service Plaza • Roadside fuel stations and fast food
restaurants. • Also contain restrooms and tele-
phones. • Found along Connecticut’s former
turnpike and in Massachusetts. Weight Area • Weight areas are designed for vehi-
cle inspections. • Some weight areas allow for over-
night truck parking. • They consist of a large parking lot. • The inspection station is sometimes a
portable trailer. Toilets may be pro-vided.
(Photos by N. Bosonetto)
Figure 2 – More Rest Area Types
Some rest areas also have integrated uses. The eastbound rest area along I-84 in Con-necticut has DOT storage sheds with an attendant available 24 hours a day. This person performs janitorial and maintenance duties as well as manning the office. On the west-bound side there is a fishery where people come to fly fish year around for trout as well as a tourist information center. By combining operations, it is possible to increase effi-ciency and provide an extra level of service.
8
3.3 Truck Parking For commercial drivers, there are federally regulated limits on driving time. The U.S.
Department of Transportation governs work hours and other working conditions of truck drivers engaged in interstate commerce. For example, a long-distance driver cannot work more than 60 hours in any 7-day period. Federal regulations also require that truckers rest 8 hours for every 10 hours of driving. Many drivers, particularly on long runs, work close to the maximum time permitted because they are typically compensated by the number of miles or hours they drive. Drivers on long runs may face boredom, loneliness, and fa-tigue. Drivers frequently travel at night, on holidays, and weekends to avoid traffic delays and deliver cargo on time. (U.S. Dept of Labor; http://stats.bls.gov/oco/ocos246.htm)
It is a well-known fact that some commercial drivers do not always follow the work-ing-hour rules. A 1997 University of Michigan survey, published by AAA Michigan1, concludes that “the majority of drivers work up to or beyond the 60 hours per week per-mitted by (federal) regulations.” These long hours, say researchers, are a result both of industry demand for just-in-time service, and drivers’ efforts to maintain a middle-class income. It is also possible to follow the rules and still fall asleep at the wheel. This is a serious problem since a truck veering out of its lane is very heavy and large. It can easily cause a fatal accident if there is a collision with a smaller vehicle. For this reason, tired truckers have been the focus of public interest during the 1990’s. Research suggests that fatigue and lack of sleep are the number one cause of heavy truck crashes (30 to 40 per-cent), a greater danger than either alcohol or drugs. According to a 1994 Michigan State University survey of nearly 5,000 Michigan truckers, 37 percent of the respondents found it necessary to drive when tired, “in order to meet tight delivery schedules.” Also, solu-tions to the problem have actively been searched as manifested in reports by the FHWA, NHTSA and the National Sleep Foundation; see, e.g., “Use of Continuous Shoulder Rumble Strips,” A Consensus Report by the National Sleep Foundation, June 1997.
Safe rest areas are a very important part in the quest to reduce sleep-related accidents. It is clearly shown that a 15 to 20 minute nap is the most effective way of rejuvenating a sleepy driver (“Use of Continuous Shoulder Rumble Strips,” A Consensus Report by the National Sleep Foundation, June 1997). Truck drivers often have comfortable and safe berths in their cabs. But they certainly need places to stop their trucks, not only to meet federal time rules but also whenever they are tired. Rest areas are preferred for naps since they are easily accessible, close to the Interstate and also provide other services such as caffeineated drinks, restrooms and telephones. As a consequence of sleepy truck drivers, rest areas have attracted attention from many constituencies.
3.3.1 Truck Safety
Trucking issues have in the last few years sometimes almost dominated the news. This is due to a public interest in truck safety. The issue is complicated because there are so many interests at play in the debate. Public safety groups are interested in safe roads free of dangerously tired truckers. Truck drivers have an interest in driving-time deregu-lation, since they have tight schedules with long and irregular working hours. Truck-stop operators are concerned with their business interests and do not want competition from
1 http://www.autoclubgroup.com/michigan/about_us/press_releases.asp?articleID=97&view=archive)

9
rest areas. Finally, it is the government’s duty to show action in solving the problem while balancing everybody’s concerns.
Due to their long hours on the road, truck drivers sometimes become exhausted and may cause accidents by either falling asleep at the wheel or by pulling over on the side of the road where people may crash into them. These accidents usually cause injury to peo-ple in smaller vehicles because of the overmatch between a 40-ton truck and a 2-ton ve-hicle. In many states it is difficult to successfully prosecute and penalize a truck driver for a fall-asleep crash exacerbating the grief of those injured.
The National Highway Traffic Safety Administration (NHTSA) has two databases, FARS (Fatality Analysis Reporting System) and GES (General Estimates System), from which it publishes safety statistics. The report data for 1998 is shown in Table 1.
Table 1 - Traffic Safety Facts 1998
Vehicles Involved in Crashes by Vehicle Type and Crash Severity Crash Severity Fatal Injury Property Damage Only Total Vehicle Type Number Percent Number Percent Number Percent Number Per-cent Passenger Car 28,992 51.0 2,545,000 67.7 4,896,000 64.5 7,470,000 65.5 Light Truck 19,217 33.8 1,059,000 28.2 2,315,000 30.5 3,393,000 29.8 Large Truck 4,935 8.7 89,000 2.4 318,000 4.2 412,000 3.6 Motorcycle 2,324 4.1 45,000 1.2 9,000 0.1 55,000 0.5 Bus 285 0.5 13,000 0.3 40,000 0.5 53,000 0.5 Other 450 0.8 7,000 0.2 9,000 0.1 16,000 0.1 Total* 56,865 100.0 3,757,000 100.0 7,587,000 100.0 11,400,000 100.0 *Includes 662 vehicles of unknown type involved in fatal crashes From p.62 of Traffic Safety Facts 1998
This table shows that in fatal accidents 8.7% of the vehicles involved are large trucks. In those fatal accidents involving large trucks, 76% were combination trucks2. It is ap-parent that although trucks constitute about 8% of total traffic volume3, they are involved in only 3.6% of total accidents4. However, the 8.7% involvement in fatal crashes gives a high risk to occupants of smaller vehicles since few of these crashes result in the death of the truck driver.
2 A combination truck is defined by NHTSA to be “a truck tractor not pulling a trailer; a tractor pulling at
least one full or semi-trailer; or a single-unit truck pulling at least one trailer.” 3 In 1999, heavy-duty vehicles (heavy trucks and buses) accounted for 204 billion miles of travel out of
the 2,598 billion miles traveled on the highways according to the Department of Energy, http://www.eia.doe.gov/oiaf/servicerpt/eppats/table28.html page last modified on 12/07/2001 16:40:14
4 If all crashes involve two vehicles, and eight percent of the vehicles are trucks, one would expect 15% [8% + 8% - (8%)(8%)] of all crashes to involve trucks if their involvement rate was the same as other vehicles. In reality, there were 1.51 vehicles per crash involved in the fatal crashes, and based on that number, we would expect around 12% of all fatal crashes to involve heavy trucks.

10
A study conducted by Taylor and Sung (1998) investigated fatigue-related truck crashes, and how they were related to the availability of rest areas. They developed a hazard function that measured the probability that a crash would occur at determined in-tervals between rest areas. Taylor and Sung’s hazard function graph5 is shown below in Figure 3 for data collected in Michigan along rural freeways used for long distance haul-ing (I-69, I-75, I-94 and I-96). The key finding was that the probability of a nighttime, single-vehicle truck accident increases rapidly when distances between rest areas increase beyond 30 miles. A distance between the rest areas longer than 55 miles should obvi-ously not be considered based on these results and a shorter distance should be consid-ered. There may be Interstate sections that have longer spacing, e.g., in northern Maine.
Figure 3 - Hazard Model of Rest Area Spacing for Nocturnal Truck Accidents (Taylor & Sung)
Although truck accidents are in proportion to truck traffic volumes, a truck’s size makes these accidents more serious and visible. Another reason truck accidents can be costly is that cargo which is spilled can close a whole highway. Since truck traffic has
5 The unit on the Y-axis “Cumulative Hazard” may not be self-explanatory. One of the authors, Professor
William Taylor of Michigan State [[email protected]] was therefore asked to explain the index. He replied in an e-mal on September 7, 2001, “Assume you have data that shows there were 100 accidents between rest area that were 50 miles apart. If the accidents were uniformly distributed you would expect two accidents to occur in each mile. The plot is the expected number of accidents if all the remaining accidents that had not happened were uniformly distributed over the remaining miles. If the first acci-dent occurred at mile 5, then the expected number of accidents for the next mile would be 99/45, as op-posed to 100/50. Since more of the accidents occur in the last 20 miles than would be expected based on the linear hypothesis, the hazard index is higher than in the first 30 miles. The analysis is cumulative, so you do not experience short distance discontinuities. That is the basic concept behind the index.”

11
become one of the major modes of transportation of goods across state lines, it has a na-tional character and the problem has attracted the Federal government’s attention.
3.3.2 Commercial Driver Rest and Parking Requirements
In 1992, the U.S. Congress ordered a study into truck driver fatigue and directed the FHWA’s Office of Motor Carriers to carry out “…evaluation of the adequacy of places for truck drivers to stop and rest, both public and private”(FHWA 1996, p. I).
This research, published in 1996, had two major findings. First, it found a shortage in truck parking spaces nationwide. Specifically, Table 2 shows the shortfall in spaces for the New England region. The second finding was a suggestion that “private truck stops and public rest areas may not be direct substitutes for each other, but in fact, may serve to complement each other” (p. 83).
Table 2 - Truck Parking Shortages
ME NH VT MA CT RI Truck Parking Space shortfall 181 327 58 392 1,025 N/A
*(FHWA 1996, p. 23)
The American Trucking Association (ATA) conducted the research through its Trucking Research Institute (TRI). Subcontractors included Apogee Research, Inc., and Wilbur Smith Associates. The research included creating a database of parking facilities available and parking behavior, as well as conducting 500 driver and 330 motor carrier surveys. This data was then used to create a Capacity Utilization Model and a Parking Demand Model.
Truck stop operators were also included in the survey, but most of the 170 surveyed believed there was no parking shortage. A follow up survey was mailed to 987 NATSO (National Association of Truck Stop Operators) members, and 381 responded. This was done to “try and create a reliable, unified database that could define both public and pri-vate space availability and needs” (FHWA-MC pg xvi ).
Other major findings from this study were that (FHWA, 1996):
• A difference in truck driver’s utility of rest areas vs. private rest stop (short term vs. long term).
• A nationwide average of 54% shortage of truck parking spaces at rest areas. • 90% of sampled truck drivers perceive shortage of parking. • Truck stop parking and rest area parking are complementary, not substitutes. • 56% of drivers said the problem is worst in the Northeast. • Recreational vehicles or cars occupied 10% of truck parking at rest areas.
Many solutions have been suggested to relieve truck parking at rest areas. The origi-nal recommendations are included in Table 3.

12
Table 3 - FHWA Recommended Options
13
3.3.3 Rest Area Forum: Summary of Proceedings
After the initial study was finished, these findings came under criticism from the Na-tional Association of Truck Stop Operators (NATSO) for inaccuracies in reporting the truck stops’ ability to meet parking demand. The following complaints were mentioned in a letter to the chairman of the Subcommittee on Ground Transportation following the hearings:
1. The truck stops are adding capacity where the market dictates. 2. No one has actually counted spaces available at private plazas. 3. The survey of NATSO members was biased against the operators. 4. More money towards rest areas will not reduce fatigue-related accidents, but
will divert money from other safety projects. As a consequence of lobbying by this powerful group of diesel merchants, TEA-21
calls for an extension of the 1996 study in Section 4027. This new study “will determine the location and quantity of parking facilities at commercial truck-stops and travel plazas and public rest areas that could be used by motor carriers…” (FHWA 1999, p. 5).
The first step in creating the new study was to formulate a statement of objectives. For this purpose, the FHWA Office of Motor Carrier and Highway Safety (OMCHS) conducted a forum in Atlanta, Georgia, in June of 1999. The forum sought to include all the interest groups in the beginning stages to help create a consensus of the different needs and values of the groups involved. Included were representatives of the FHWA, AASHTO, the American Trucking Association, commercial drivers, NATSO, the Com-mercial Vehicle Safety Alliance, independent drivers and those citizen coalitions con-cerned with safety.
After many speeches and discussions, the stakeholders concluded that safety and se-curity at public and private parking facilities are important. They also agreed that in-creased police protection as well as improved lighting and landscaping could help reduce crime. Overall, everyone thought that more parking spaces were needed and better park-ing information could help drivers find space for their trucks.
3.3.4 Media Coverage
Inside Edition ©, the television news magazine, did a cover story which aired on July 28, 2000. This story investigated the safety of trucks parked on the side of the Interstates. It revealed serious accidents where cars crashed into trucks parked on the shoulder at night. Interviews with truck drivers placed an emphasis on truck drivers not being able to find sufficient parking spaces at overcrowded rest areas.
The Cable News Network (CNN) has also aired a story based on the Rest Area Fo-rum, presenting the issues and players.
3.3.5 State-Level Studies
The DOT’s freight transportation offices include state-level studies of truck parking in relation to rest areas as part of their program. Because there is no formal office for rest areas, the job of managing them falls on many separate departments such as maintenance or tourism.
Connecticut is currently conducting a “Truck Stop and Rest Area Parking Study” (TSRAPS). The study seeks to “identify the demand for truck parking and methods of

14
alleviating the conditions that contribute to truck drivers parking in unsafe and undesig-nated parking areas along the highway” (Connecticut DOT 2000, p. 1).
Connecticut’s efforts have centered on surveying truck drivers to find out their needs. This study also includes all five private truck stops located within its boundaries to de-termine their facilities’ ability to provide parking.
Connecticut’s study found that the FHWA’s previous study had over-counted truck parking spots at rest areas by 76, meaning that Connecticut has a shortage of 1,101 spaces. The demand is forecasted to increase 33.5% by the year 2020 for a total shortage of 1462 truck parking spaces. Currently, I-95 carries the highest truck volume in the state. The highest accident rates are also on this highway, although it is important to note that the ratios of truck to automobile traffic and truck accident to automobile accidents are both 1:10. At rest areas, however, 25% to 30% of all accidents involve trucks. The exact reasons for this high percentage is unknown and contacts with the National Traffic Safety Administration6 reveals that FARS and other governmental statistics do not ana-lyze crash data separately for rest areas; it is not a category in the coding systems. The causes of the crashes could be analyzed by scrutinizing individual crash reports, but that has not been done within this project. However, it may not be surprising that there are many truck crashes at rest areas since the relationship of vehicle size and number is changed by the rest area properties. A typical rest area on I-95 is shown in Figure 4. Most rest areas are quite small and have only about 10 to 20 truck parking spaces.
The survey, conducted between February and March of 2000 by the Connecticut Of-fice of Intermodal Project Planning, was of mail-in type. The questionnaires were dis-tributed to all rest areas and private truck stops. A total of 593 forms were returned and tabulated into the following truck driver answers:
• 50% had a pick up or delivery in the state, and 15% had both ends within the state.
• 81% use I-95 when traveling through the state and 73% use I-84. • 56% frequently use rest areas because they are convenient (40%), the
parking is free (15%), or the private lots are full (13%). • 52% use private stops because they offer more services (31%), they feel
safer (20%), or the public lots are full (17%). • 52% regularly buy fuel in Connecticut. • 98% believe there is a shortage of parking spaces in Connecticut. • 71% believe the shortage is worse in Connecticut than in adjoining states. • 84% sometimes park in undesignated areas when no spaces are open. • 3% confess to parking illegally simply because it is more convenient. • 46% have been asked to move out of illegal spots by state officials.
Overall, 93% of respondents believe that more legal parking spaces will eliminate roadside parking.
6 Telephone information by Mr. Lorenzo Daniels (202) 366 1417

15
Figure 4 - Branford Rest Area (Photo by N. Bosonetto)
Minnesota DOT conducted a three-year study entitled “Commercial Truck Usage Nighttime Parking Demand Analysis” (1998). This study is of interest because, in addi-tion to affirming the FHWA’s conclusions, it has set a standard method of easily studying nighttime parking. Beginning in 1995, maintenance personnel at the rest areas keep re-cords of truck numbers parked at midnight and in the early morning. This simple count is added to other facility management records and helps to determine exactly where the problems exist.
3.4 Rest Areas Away From Interstates Rest areas are also used along rural, 2-lane highways. At least in New England, these
rest areas usually fall into the category of Parking Areas, Picnic Areas, or small Visitor Centers. There is usually only one rest area at a given location servicing both directions of traffic since the highway is not divided and both lanes of traffic can use it. In western Vermont, there are also several rest areas along 2-lane, limited access roads (personal in-formation from Ms. Karen Songhurst, March 19, 2001).
Rest areas away from limited-access highways are different than those on Interstates since along minor highways there are typically many opportunities for travelers to pull over and access services at the many towns along the road. For example, rural Route 2 across Maine, New Hampshire and Vermont have rest areas and visitor centers bordering the rivers and national parks. These rest areas serve mostly as picnic grounds and scenic areas. Facilities usually only include a small restroom, picnic tables and barbecue grills. These rest areas are usually seasonal in that they close for the winter.
When a rural highway is extremely desolate, e.g., Route 9 through eastern Maine (also called the Airline road), rest areas may become almost necessary. It is often diffi-
16
cult to find a parking space along such roads, especially for truckers. During the recent reconstruction of Route 9, a rest area was added, which has given truckers a place to stop. Rural rest areas on 2-lane roads are not covered in this report because the committee de-cided to put the emphasis on multi-lane limited access facilities. Also, they are by many considered to be less critical to the traveling public than Interstate highway sites.
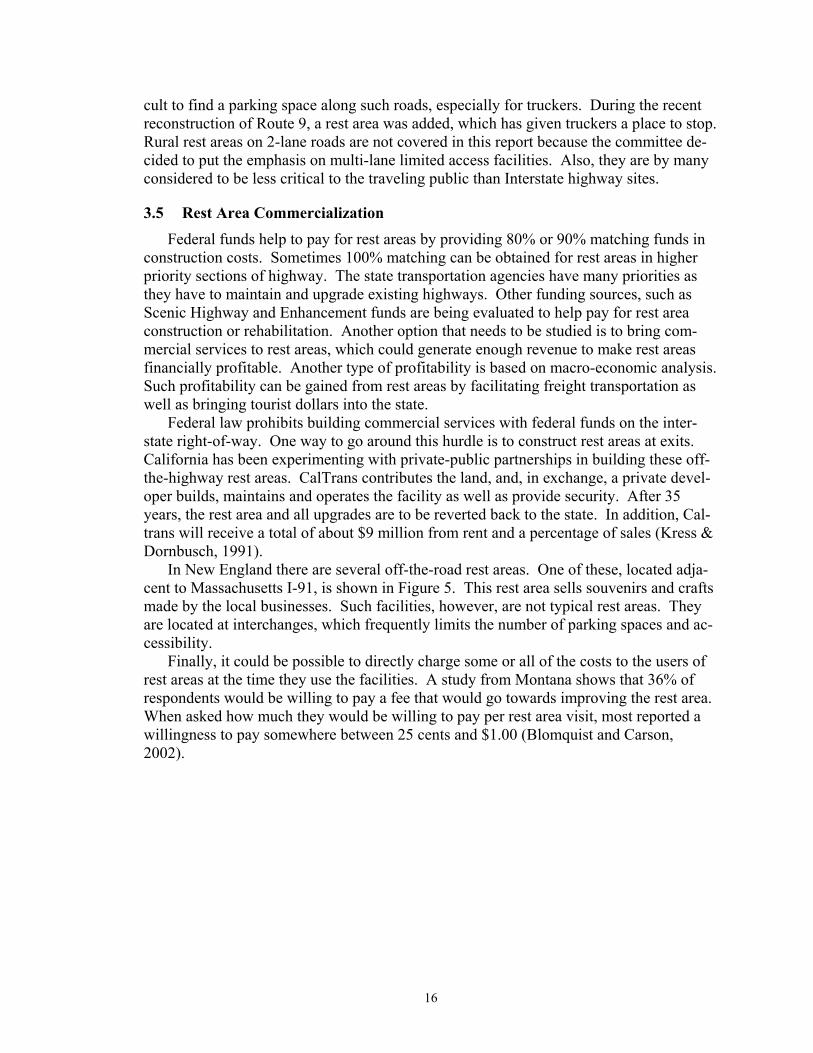
3.5 Rest Area Commercialization Federal funds help to pay for rest areas by providing 80% or 90% matching funds in
construction costs. Sometimes 100% matching can be obtained for rest areas in higher priority sections of highway. The state transportation agencies have many priorities as they have to maintain and upgrade existing highways. Other funding sources, such as Scenic Highway and Enhancement funds are being evaluated to help pay for rest area construction or rehabilitation. Another option that needs to be studied is to bring com-mercial services to rest areas, which could generate enough revenue to make rest areas financially profitable. Another type of profitability is based on macro-economic analysis. Such profitability can be gained from rest areas by facilitating freight transportation as well as bringing tourist dollars into the state.
Federal law prohibits building commercial services with federal funds on the inter-state right-of-way. One way to go around this hurdle is to construct rest areas at exits. California has been experimenting with private-public partnerships in building these off-the-highway rest areas. CalTrans contributes the land, and, in exchange, a private devel-oper builds, maintains and operates the facility as well as provide security. After 35 years, the rest area and all upgrades are to be reverted back to the state. In addition, Cal-trans will receive a total of about $9 million from rent and a percentage of sales (Kress & Dornbusch, 1991).
In New England there are several off-the-road rest areas. One of these, located adja-cent to Massachusetts I-91, is shown in Figure 5. This rest area sells souvenirs and crafts made by the local businesses. Such facilities, however, are not typical rest areas. They are located at interchanges, which frequently limits the number of parking spaces and ac-cessibility.
Finally, it could be possible to directly charge some or all of the costs to the users of rest areas at the time they use the facilities. A study from Montana shows that 36% of respondents would be willing to pay a fee that would go towards improving the rest area. When asked how much they would be willing to pay per rest area visit, most reported a willingness to pay somewhere between 25 cents and $1.00 (Blomquist and Carson, 2002).

17
Figure 5 - Massachusetts I-91 Gift Shop Rest Area (photo by N. Bosonetto)
Iowa has also experimented with commercializing rest areas. Their design consists of a Welcome Center located at an interchange, but it has stores located behind the parking lot, outside the limits of the site itself. This experiment has been conducted along I-35 in north central Iowa. The welcome center was a partnership between the Iowa Department of Economic Development (tourism) and the Department of Transportation. The Tour-ism Division leases room and has a gift shop. A private consortium of business leaders from the community built the stores and a sewage disposal pond. After this project was started, the Iowa legislature passed a bill that outlawed any further partnerships between DOT and private enterprises. The welcome center continues to be open and is projecting a savings of $3.5 million over a 30-year period (Gray-Fisher, 1998).
Within this project, there will be no in-depth analysis of such off-the-interstate com-mercial rest areas since there are very few in New England. The commercialization of rest areas that will be discussed to some extent are those with leases with tourism de-partments or those service plazas grand-fathered into existence from old turnpikes.
3.6 Rest Area Design AASHTO has recently prepared a guideline entitled “A Guide for Development of
Rest Areas on Major Arterials and Freeways.” It endorses rest area development and planning on a statewide basis, and it provides in-depth guidelines. The clear objective of this is to promote rest areas as an integral part of the highway system providing safety value, tourism benefits, and motorist services. It seeks to create a comprehensive plan for rest areas that encompasses development, planning, designing, funding, maintaining and operating a statewide rest area system.
18
3.7 Security Concerns Rest area security, also sometimes referred to as safety, is an issue on many drivers’
minds, especially if the rest area is close to an urbanized area. Media coverage of several murders at Florida rest areas has caused concern with motorists afraid of stopping to nap at rest areas in general. Florida experienced a drop in tourism due to these incidents and had to close many rest areas because they became ‘untouchable.’ Murders and abduc-tions have also occurred at rest areas at other locations around the US (Visitor Crime In Florida: The Perception vs the Reality A Special Briefing for Lieutenant Governor Buddy McKay, January 22, 1996).
Security is a very important aspect of a rest area. Not having security invites vandals and criminals to pray on the traveling public at a time when they are the most (physically) vulnerable. With increase in crime, a decrease in use will occur, which means the state loses money (less useful facility). Perhaps the best example of this is the rest area on I-4 in Orlando, Florida, where a homicide was committed. The rest areas (both sides) are now closed permanently incurring a loss of a large facility and a potential huge loss in tourism dollars.
There are also issues of prostitution, drug use, sexual deviants and vandalism that af-fect both rest area users and the staff working there. Truck drivers are adamant about “lot lizards,” which are all the undesirable people who bother them during the night. This helps to explain why some truck drivers park their vehicles on the ramps of rest areas even when the lot is empty. By parking close to the road, they feel somewhat safer.
4 ECONOMIC ANALYSIS
The interstate highway system is sometimes referred to as the largest civil engineer-ing project in U.S. history. During its initial planning stages, it was decided not to permit commercial services like those found on toll roads. This decision was made to gain sup-port from business people along the highway corridor who would have viewed roadside services as a source of competition. It was imperative to gain their support in the plan-ning stages and, therefore, “avoid the granting of ‘monopoly positions’” (Levy, J.M. 2000).
At the time of its implementation, however, no one foresaw the changes an interstate system would cause in our nation’s economy. Truck traffic has overtaken rail as the method for transporting goods and service and retail businesses have relocated from downtown buildings into shopping plazas next to exits. Also, the U.S. population travels far and wide on the highways to visit family and friends as well as for vacationing. Rest areas also serve business people who travel to their work. It is necessary to study how rest areas are developing to meet different existing and new needs.
4.1 Economic Benefits
Economic benefits refer to how rest areas facilitate commerce and tourism and how they contribute towards a state’s revenue generation. It also implies that safety benefits are economic benefits.

19
Economic benefits differ from financial benefits in that they are indirect. These in-clude passive values from increased safety of the interstate, tourism advertisement, and the support of our freight transportation system.
4.1.1 Commerce
The shipment of commodities and manufactured goods by truck is often said to be the backbone of our economy. Trucks use the Interstate to travel between major population centers from coast to coast. The relatively low price of diesel fuel has made this feasible, and the restructuring of business towards on-time delivery has made truck transportation the primary choice of many businesses.
A quick visual survey of highway rest areas usually will show a variety of trucks parked. These trucks carry food, paper products, consumer electronics, raw materials, construction equipment, large industrial machinery, household goods, petrochemicals, etc.
Trucks are versatile since they cannot only use our entire vehicular infrastructure, and, therefore, form a transport mode all by themselves, but also create the last links be-tween other modes and origin and destination points. Whether cargo arrives by rail, wa-ter or air, trucks are often used as the delivery mode to the final destination.
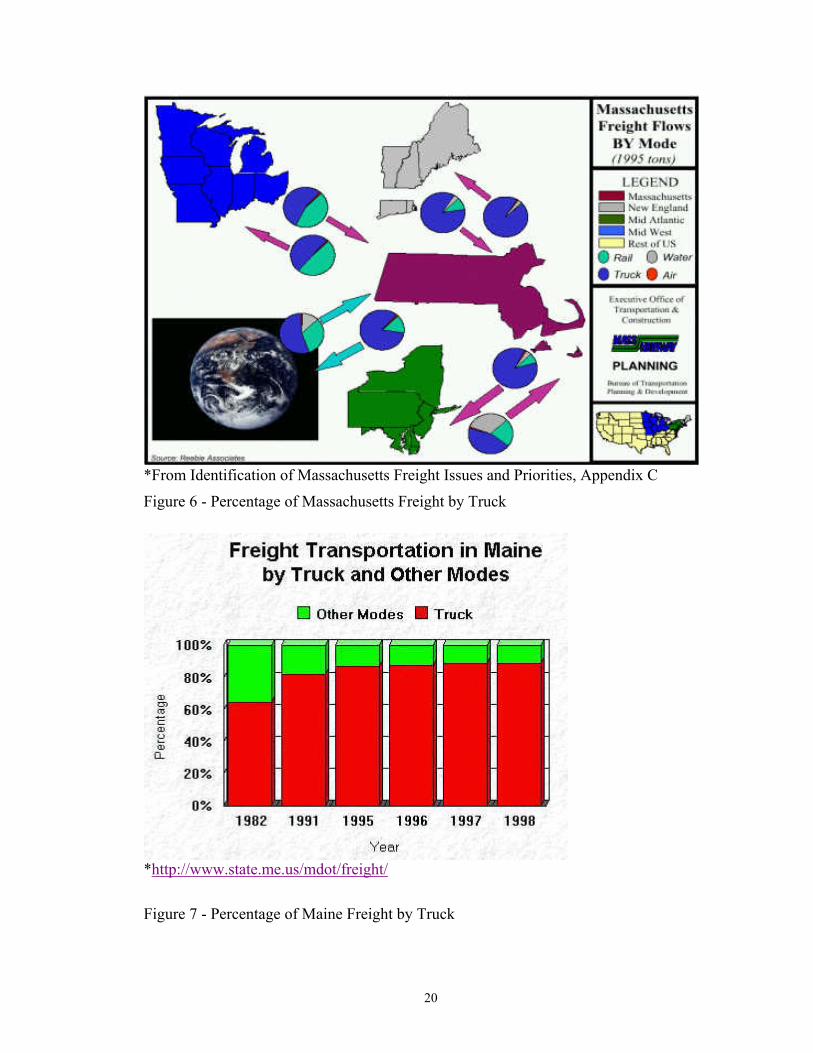
State transportation agencies spend a lot of effort tracking freight movements through their states. A sample of this work can be found in publications such as “Identification of Massachusetts Freight Issues and Priorities,” published by MassHighway. A portion of this work is shown in Table 4 and Figure 6, which detail the amount and percent of movement, by trucks. It is shown that a majority of cargo leaving the state is carried by truck. A similar situation exists in Maine as shown by Figure 7.
Table 4 – Massachusetts Freight Flow by Truck
1995 Tons From Massachusetts To Massachusetts New England 8,437,718 4,329,334 Mid Atlantic 3,420,512 4,736,143 Mid West 1,284,131 3,438,145 Rest of US 1,956,534 7,100,467 *From Identification of Massachusetts Freight Issues and Priorities, Appendix C
Although freight transportation by truck would exist with or without rest areas, it is important to note the role they play. Recent truck driver strikes in Europe have shown just how delicate our economies are to disruptions in truck transportation. Store shelves become empty, fuel does not get delivered and nations stall. Rest areas facilitate truck travel and provide an aid in making trucking a reasonably efficient and safe mode of transportation. Rest areas provide accessible services that help drivers locate their desti-nations, keep in contact using phones and use rest and restroom facilities.
20
*From Identification of Massachusetts Freight Issues and Priorities, Appendix C
Figure 6 - Percentage of Massachusetts Freight by Truck
*http://www.state.me.us/mdot/freight/
Figure 7 - Percentage of Maine Freight by Truck

21
4.1.2 Tourism
According to the Rhode Island Travel and Tourism Research Report (Tyrell, 1999), one of the tourism industry indicators is based on the number of visitors stopping at the I-95 welcome center (p. 7). The actual numbers grew from 688,591 in 1997 to 708,067 in 1998. This 2.8% increase matches with other indicators reflecting an increase in tourism. Also, according to the report, 67% of all visitors to Rhode Island are just passing through although this group only account for 8% of visitor expenditures. It is possible that these passing-through visitors could be made to spend more money with direct and indirect sales at the welcome center.
Tourism is big business all over New England. In Rhode Island, it is the second big-gest employer with about 33,000 jobs supported. It also generates an additional $2.5 tril-lion dollars in sales revenue (Tyrell, 1999). Vermont, New Hampshire and Maine are also popular destination points that get a large percentage of money from tourism accord-ing to the Maine Tourism Association.
Welcome centers give an image to the people traveling into a state or region. Travel-ing on the Interstate provides a very limited, narrow corridor to view a state from. When motorists stop at dilapidated facilities, their image of the state as a whole can become negative. Accordingly, a well-staffed and -maintained rest area can provide a good im-pression and influence how long travelers stay in the state and whether they will return or not.
4.2 Financial Although the economic perspective can show how rest areas help the overall econ-
omy, rest areas still need real money to be built and operated. As of November 28, 1995, federal share funds will match 100% of a state’s rest area program in locations where the Secretary of Transportation finds there is a shortage of facilities. (Davis, 1997) Since the FHWA report found that the Northeast has one of the worst problems, it should be possi-ble to use these funds in New England. Other forms of funding include using money for Interstate Maintenance, Scenic Highways, Enhancement as well as state funds, and, for rest areas away from the Interstate system, Surface Transportation Program (STP) money. Also, leasing rest areas to tourism offices, and combining DOT functions at rest areas can be a way to financially support rest areas.
4.2.1 Current Uses and Leases
Many partnerships and innovative uses have developed out of sheer necessity of mar-ket economics. These economic forces include the large market provided by a limited access highway and the fiscal realities of maintaining and operating rest areas. Some of the large forces in this game have been chambers of commerce, regional economic devel-opment groups, tourist bureaus and private enterprises (concessions and fuel).
4.2.2 Connecticut
Connecticut has a series of creative practices in order to maximize use of their rest ar-eas. There are commercial rest areas located on the former turnpike (now I-95) and they also combine DOT facilities with rest areas as mentioned below.

22
McDonald’s has a contract to operate 10 sites along I-95 for a total of 20 years start-ing in 1985. The restaurant agrees to pay a percentage (13% to 18%) of gross receipts with a guaranteed minimum. The restaurant also operates the facilities and maintains the building (including cleaning restrooms). Mobil Gas has a total of 23 sites on the Con-necticut Interstates. The General Transportation Fund receives an 11-cent royalty per gal-lon delivered to the stations and 5% of gross receipts of all other sales (convenience store).
Overall, the Connecticut transportation agency receives in excess of ten million dol-lars ($10,000,000) per year from these private enterprises. The state treasury also collects their usual sales taxes apart from this figure. Overall, DOT does not maintain the build-ings and they receive a substantial amount of money from these service areas. Though it has to be remembered that these facilities were grandfathered and that with present legis-lation this concept cannot be duplicated at other locations.
Connecticut also uses rest areas to base DOT personnel and tourism information cen-ters. For example, the Willington rest areas provide a DOT shed and maintenance office on I-84 eastbound (EB), and a tourist information booth on the westbound (WB) side. The WB side also has a fishery that is open year round for trout (supposedly the only one in the state). Overall, Connecticut has many beneficial systems to deal with rest areas by distributing costs.
4.2.3 Maine
Maine’s rest areas use tourism as a financial aid. The Hampden rest areas sell fishing and hunting licenses to tourists. The northbound side provides information on Bar Harbor and other areas. These rest areas are well maintained and staffed. Maine Department of Transportation booths cut down on crime and loitering since there are staff present.
In Maine, people mostly complain about the Tourist Information Center in Houlton and the Pittsfield Interstate rest area because of their unkempt appearances (Mr. Dick Stedman, Maine DOT).
4.3 Commercialization While currently prohibited by federal law, the commercial potential of a rest area is
an important factor in the leasing of the facility. A valuable rest area can be considered to have a higher potential to attract motorists and therefore increased profitability to ven-dors and advertisers. Kress & Dornbusch, 1991, recommend using the following criteria to analyze the commercial value of rest areas:
• Average Annual Daily Traffic (AADT) passing rest area; • Traffic seasonability and peak volumes; • User groups; • Percentage of traffic using rest areas; • Survey results showing rest area use; • Competition from other commercial enterprises in area; • Sizes and proximity of population centers; • Visibility and accessibility of the site; • Site capacity (utilities, parking); • Site design characteristics; and,

23
• Land use restrictions, environmental restrictions. These criteria can be reduced to two main components: traffic characteristics and site
characteristics.
4.3.1 Traffic Characteristics
Traffic characteristics refer to the volume and constitution (types) of vehicles using a rest area. Volume can be determined as a percentage of mainline traffic (cars traveling by on the highway). Traffic characteristics are discussed in Section 5.1 below.
4.3.2 Site Characteristics
It is obvious that site-specific characteristics such as visibility, capacity and accessi-bility can influence the use of a rest area. At least part of a rest area should be visible from the highway for people to feel safe. Also a rest area ought to be kept to a reasonable size, if it becomes too big or too crowded it is not as comfortable or relaxing to use. Geo-graphic location can determine commercial advantages or disadvantages based on compe-tition and services available.
4.3.3 Conclusions
In conclusion, rest area commercialization could be considered in a future if the fed-eral policy allows such. Terms of leasing would require a great deal of legal and business consultations. The character of the rest area may also change, from a calm oasis into a situation of marketing. Some users will like this; others will not. Ideally, rest areas with different characteristics should be offered to travelers but that is an option only in heavily traveled areas where enough users can fill nearby facilities. In areas where traffic vol-umes are low and therefore few facilities can be supported, it may be impossible to have a viable commercially basis but with some public funding supporting the commercial en-terprise, such facilities may still be feasible.
5 SURVEY OF REST AREA USE
5.1 Number of Motorists Stopping
As stated above in Section 4.3.1, user volumes can be expressed as a percentage of mainline traffic (cars traveling by on the highway). An alternative to using mainline vol-umes is the total volume approaching the rest-area exit, i.e. the sum of mainline traffic and rest-area traffic. These volumes are typically reported as Average Daily Traffic (ADT) or as Average Annual Daily Traffic (AADT). All states maintain traffic counts for sections of their Interstates. There is much less information on rest area traffic vol-umes. State transportation agencies typically don’t include rest areas in their counting programs. Information is limited to special projects or studies. The type of vehicles us-ing a facility is even more difficult to attain since it requires visual observations. Surveys, such as the one conducted for this project, help to show what people use rest areas for. This use is highly dependent on the road-user type. For example, truck drivers will not use tourist information as much as tourists traveling by passenger cars or in RVs. Traffic seasonability is an important variable because the tourist season is typically the busiest

24
time for rest areas. Peak use can be expected when families travel the most as during long weekends in the summer and around Thanksgiving. In Vermont, only 11% of tour-ism (out-of-state travel for leisure purposes) is for skiing purposes. The peak travel in Vermont extends from July through the foliage season in September/October (personal information from Ms. Karen Songhurst, March 19, 2001).
5.1.1 New Hampshire
Extensive data are available from some sites. For example, traffic counts were con-ducted by New Hampshire DOT from 1995 to 1998. Results over the three-year period were averaged out and are shown in Table 5. This New Hampshire count study also kept occupancy counts which showed an average of 2.09 to 2.34 persons per vehicle (cars and pick-ups). The differences in average occupancy may be attributed at least partially to the length of the counts and the different types of days covered. The results of the indi-vidual counts from New Hampshire Interstates and Turnpikes are shown in Table 6.
Table 5 – New Hampshire Rest Area Use, Welcome Centers, etc.
Rest Area Location Direction Daily Average Mainline % Using Rest Area Salem NB 53,000 3.2
Seabrook NB 36,000 5.3 Canterbury NB 13,000 5.2 Hooksett NB 33,000 9.1
Table 6 – New Hampshire Rest Area Use, ‘All’ Locations
Name Direction Dates of count Daily Avg.Mainline
Daily Avg.Rest Area
Percentage Using Rest Area
Sutton SB 6/27 - 7/10/95 8221 616 7.49% Canterbury NB 8/25 - 9/5/95 15424 1023 6.63% Salem NB 10/7 - 10/18/95 50724 1723 3.40% Seabrook NB 11/07-11/20/95 32215 1703 5.29% Hooksett NB 05/18-5/31/96 35010 3240 9.25% Sanbornton SB 6/27-7/10/96 12569 838 6.67% Lebanon SB 6/29-7/11/96 16697 515 3.08% Littleton Both ≈ same 8/24-9/9/96 5264 231 4.39% Springfield NB 10/5-10/17/96 7984 778 9.74% Hooksett SB 10/29-11/12/96 23614 1600 6.78% Springfield NB 05/05-5/16/97 6599 511 7.74% Canterbury NB 5/17-5/31/97 18767 704 3.75% Sanbornton SB 6/27-7/7/97 14114 923 6.54% Salem NB 10/10-10/15/97 55590 1878 3.38% Seabrook NB 11/10-11/12/97 33612 1650 4.91% Lebanon SB 5/15-5/31/98 17217 436 2.53% Hooksett SB 6/27-7/3/98 29371 2587 8.81% Hooksett NB 6/27-7/7/98 31528 3227 10.24% Sutton SB 8/29-9/8/98 4654 561 12.05% Seabrook NB 10/3-10/15/98 42829 1425 3.33% Canterbury NB 11/10-11/15/98 10402 522 5.02% Antrim seasonal 5/26/97 1879 179 9.53% Colebrook seasonal 6/26-7/20/97 3978 65 1.63%
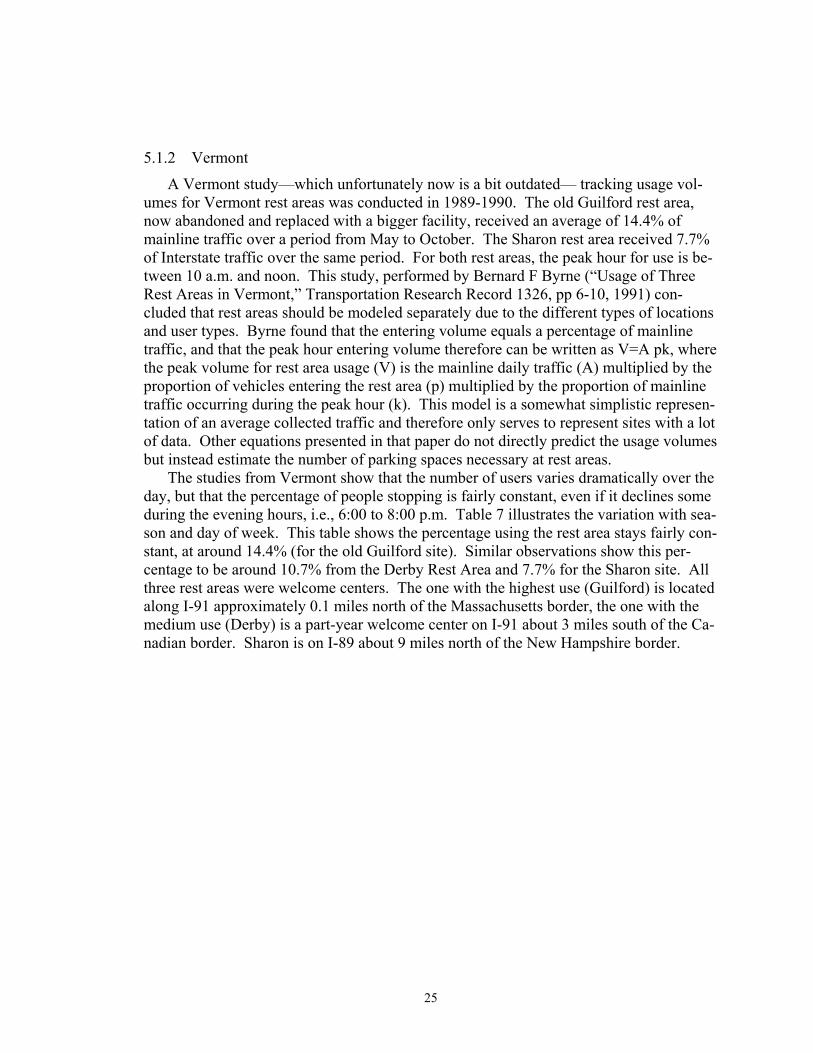
25
5.1.2 Vermont
A Vermont study—which unfortunately now is a bit outdated— tracking usage vol-umes for Vermont rest areas was conducted in 1989-1990. The old Guilford rest area, now abandoned and replaced with a bigger facility, received an average of 14.4% of mainline traffic over a period from May to October. The Sharon rest area received 7.7% of Interstate traffic over the same period. For both rest areas, the peak hour for use is be-tween 10 a.m. and noon. This study, performed by Bernard F Byrne (“Usage of Three Rest Areas in Vermont,” Transportation Research Record 1326, pp 6-10, 1991) con-cluded that rest areas should be modeled separately due to the different types of locations and user types. Byrne found that the entering volume equals a percentage of mainline traffic, and that the peak hour entering volume therefore can be written as V=A pk, where the peak volume for rest area usage (V) is the mainline daily traffic (A) multiplied by the proportion of vehicles entering the rest area (p) multiplied by the proportion of mainline traffic occurring during the peak hour (k). This model is a somewhat simplistic represen-tation of an average collected traffic and therefore only serves to represent sites with a lot of data. Other equations presented in that paper do not directly predict the usage volumes but instead estimate the number of parking spaces necessary at rest areas.
The studies from Vermont show that the number of users varies dramatically over the day, but that the percentage of people stopping is fairly constant, even if it declines some during the evening hours, i.e., 6:00 to 8:00 p.m. Table 7 illustrates the variation with sea-son and day of week. This table shows the percentage using the rest area stays fairly con-stant, at around 14.4% (for the old Guilford site). Similar observations show this per-centage to be around 10.7% from the Derby Rest Area and 7.7% for the Sharon site. All three rest areas were welcome centers. The one with the highest use (Guilford) is located along I-91 approximately 0.1 miles north of the Massachusetts border, the one with the medium use (Derby) is a part-year welcome center on I-91 about 3 miles south of the Ca-nadian border. Sharon is on I-89 about 9 miles north of the New Hampshire border.

26
Table 7 - Use of the Guilford Welcome Center
Month Mon Tues Wed Thurs Fri Sat Sun Totals May 1,603 1,330 1,220 889 3,306 3,306 2,056 13,710 Entering Traffic 10,368 9,502 10,084 6,211 22,466 20,887 14,482 94,000 Mainline Traffic 15.5% 14.0% 12.1% 14.3% 14.7% 15.8% 14.2% 14.6% % entering June 3,315 2,780 2,938 4,166 8,289 5,104 4,323 30,915 Entering Traffic 20,559 20,272 22,416 30,478 57,613 32,952 28,490 212,780 Mainline Traffic 16.1% 13.7% 13.1% 13.7% 14.4% 15.5% 15.2% 14.5% % entering July 4,415 3,490 3,489 3,122 7,114 10,623 7,116 39,369 Entering Traffic 28,478 23,823 26,598 28,782 51,620 63,296 46,369 268,966 Mainline Traffic 15.5% 14.6% 13.1% 10.8% 13.8% 16.8% 15.3% 14.6% % entering August 3,971 5,001 5,183 5,785 8,099 7,401 5,461 40,901 Entering Traffic 24,940 33,936 35,770 41,343 56,044 46,343 36,563 274,939 Mainline Traffic 15.9% 14.7% 14.5% 14.0% 14.5% 16.0% 14.9% 14.9% % entering September 3,526 2,977 3,024 3,376 8,916 8,115 4,695 34,629 Entering Traffic 22,035 22,421 23,538 26,021 66,073 54,275 32,813 247,176 Mainline Traffic 16.0% 13.3% 12.8% 13.0% 13.5% 15.0% 14.3% 14.0% % entering October 22,350 1,673 1,276 1,322 2,486 4,685 4,895 38,687 Entering Traffic 141,534 15,568 11,387 12,410 21,939 31,385 33,740 267,963 Mainline Traffic 15.8% 10.7% 11.2% 10.7% 11.3% 14.9% 14.5% 14.4% % entering Total 39,180 17,251 17,130 18,660 38,210 39,234 28,546 198,211 Entering Traffic 247,914 125,522 129,793 145,245 275,755 249,138 192,457 1,365,824 Mainline Traffic 15.8% 13.7% 13.2% 12.8% 13.9% 15.7% 14.8% 14.5% % entering
5.1.3 Chelmsford, Massachusetts
This NETC-project made an in-depth study of a rest area located on Interstate 495 in Chelmsford, Massachusetts. Only the northbound side was considered. Here, loop counters are installed into the road. These magnetic counters keep continuous track of vehicles traveling over them. Data is recorded as the number of vehicles traveling over a given point for every hour of every day. For this project, count data from the highway before the rest area, and data on the entrance of the rest area were used. In this way a sta-tistical relationship between mainline traffic (highway) and rest area traffic (entering) was sought. Traffic volumes from MassHighway reports for the month of September 1999 were used for a linear regression analysis. A model was built on data consisting of counts for every hour of the day (24) for days ranging from Sundays through Wednes-days. The data set consisted of a total of 96 points, ranging through various traffic pat-terns which give the model a wide range of application. This data showed a regression function of Y=24.973+0.017X where Y is the hourly rest-area volume and X is mainline volume. The correlation coefficient R was 0.735; the squared coefficient (R2) was 0.541. The standard error of the constant was 4.261 and the standard error of the x-coefficient was 0.002. This gives us a 95% confidence interval for the constant of 16.5 to 33.4 and for the x-coefficient of 0.014 to 0.020. Or in plain English, the hourly volume of vehicles entering is around 25 cars an hour plus 1.7% of mainline traffic. The rest-area daytime usage varied between 50 and 140 vehicles per hour; the mainline volume varied between 2,000 and 5,200 vehicles per hour.

27
5.1.4 Augusta, Maine Observations within this project of the Augusta rest area were made in January of
2000. Southbound volumes are presented in Table 8 and northbound volumes in Table 9.
Table 8 - Rest Area Use, southbound Augusta, Maine
date 1/12/00 1/12/00 1/12/00 1/12/00 1/19/00 1/19/00 1/19/00 SUM day of week w w w w w w w Time start 7:34 8:14 8:47 9:15 10:30 11:35 12:49 state ME ME ME ME ME ME ME route 95 95 95 95 95 95 95 direction SB SB SB SB SB SB SB SB Time (min) 15 15 15 15 15 15 15 Highway cars 267 146 137 114 101 94 123 982 tractor trailer 17 29 33 33 31 20 19 182 pickups 63 37 28 30 0 27 20 205 veh w/trailers 1 0 2 2 0 2 2 9 buses 1 0 0 0 0 0 0 1 campers 0 0 0 0 0 0 0 0 Rest Area cars 3 3 1 6 4 2 4 23 arriving tractor trailer 0 1 2 1 2 5 1 12 pickups 0 1 1 0 0 0 1 3 veh w/trailers 0 2 2 1 0 0 0 5 buses 0 0 0 0 0 0 0 0 campers 0 0 0 0 0 0 0 0 storage cars 2 3 2 0 2 2 5 16 before tractor trailer 1 1 1 2 2 3 2 12 count pickups 1 1 2 2 0 1 1 8 veh w/trailers 0 0 0 0 0 0 0 0 buses 0 0 0 0 0 0 0 0 campers 0 0 0 0 0 0 0 0 storage cars 2 3 0 1 1 0 3 10 after tractor trailer 0 1 2 1 1 7 1 13 count pickups 1 1 1 0 0 1 2 6 veh w/trailers 0 0 1 0 0 0 0 1 buses 0 0 0 0 0 0 0 0 campers 0 0 0 0 0 0 0 0 % using cars 1.11% 2.01% 0.72% 5.00% 3.81% 2.08% 3.15% 2.29% tractor trailer 0.00% 3.33% 5.71% 2.94% 6.06% 20.00% 5.00% 6.19% total pass veh7 0.90% 2.14% 1.20% 4.00% 3.81% 1.63% 3.38% 2.14% heavy vehicles8 0.00% 9.38% 10.26% 5.41% 6.06% 18.52% 4.55% 8.13%
7 Cars plus pickups 8 Tractor trailers, all vehicles with trailers, buses and campers/RVs
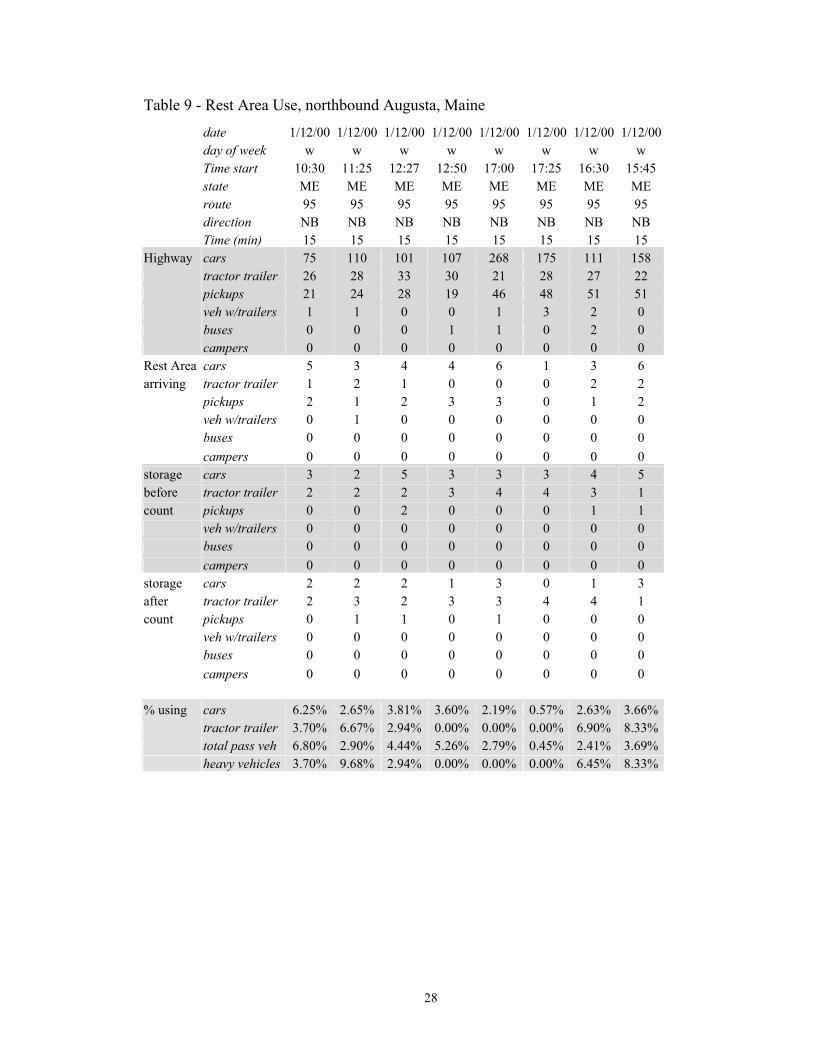
28
Table 9 - Rest Area Use, northbound Augusta, Maine
date 1/12/00 1/12/00 1/12/00 1/12/00 1/12/00 1/12/00 1/12/00 1/12/00 day of week w w w w w w w w Time start 10:30 11:25 12:27 12:50 17:00 17:25 16:30 15:45 state ME ME ME ME ME ME ME ME route 95 95 95 95 95 95 95 95 direction NB NB NB NB NB NB NB NB Time (min) 15 15 15 15 15 15 15 15 Highway cars 75 110 101 107 268 175 111 158 tractor trailer 26 28 33 30 21 28 27 22 pickups 21 24 28 19 46 48 51 51 veh w/trailers 1 1 0 0 1 3 2 0 buses 0 0 0 1 1 0 2 0 campers 0 0 0 0 0 0 0 0 Rest Area cars 5 3 4 4 6 1 3 6 arriving tractor trailer 1 2 1 0 0 0 2 2 pickups 2 1 2 3 3 0 1 2 veh w/trailers 0 1 0 0 0 0 0 0 buses 0 0 0 0 0 0 0 0 campers 0 0 0 0 0 0 0 0 storage cars 3 2 5 3 3 3 4 5 before tractor trailer 2 2 2 3 4 4 3 1 count pickups 0 0 2 0 0 0 1 1 veh w/trailers 0 0 0 0 0 0 0 0 buses 0 0 0 0 0 0 0 0 campers 0 0 0 0 0 0 0 0 storage cars 2 2 2 1 3 0 1 3 after tractor trailer 2 3 2 3 3 4 4 1 count pickups 0 1 1 0 1 0 0 0 veh w/trailers 0 0 0 0 0 0 0 0 buses 0 0 0 0 0 0 0 0 campers 0 0 0 0 0 0 0 0 % using cars 6.25% 2.65% 3.81% 3.60% 2.19% 0.57% 2.63% 3.66% tractor trailer 3.70% 6.67% 2.94% 0.00% 0.00% 0.00% 6.90% 8.33% total pass veh 6.80% 2.90% 4.44% 5.26% 2.79% 0.45% 2.41% 3.69% heavy vehicles 3.70% 9.68% 2.94% 0.00% 0.00% 0.00% 6.45% 8.33%

29
Table 9 continued - Rest Area Use, northbound Augusta, Maine date 1/19/00 1/19/00 1/19/00 1/19/00 1/19/00 SUM day of week w w w w w Time start 6:17 6:55 7:40 8:03 8:45 state ME ME ME ME ME route 95 95 95 95 95 direction NB NB NB NB NB NB Time (min) 15 15 15 15 15 Highway cars 54 80 112 228 114 1693 tractor trailer 14 20 24 46 22 341 pickups 17 22 22 64 25 438 veh w/trailers 0 1 2 8 2 21 buses 0 0 0 1 0 5 campers 0 0 0 0 0 0 Rest Area cars 2 1 4 15 6 60 arriving tractor trailer 2 3 1 0 0 14 pickups 0 1 0 2 1 18 veh w/trailers 0 0 1 1 0 3 buses 0 0 0 0 0 0 campers 0 0 0 0 0 0 storage cars 0 1 0 1 0 30 before tractor trailer 4 3 3 3 5 39 count pickups 0 0 1 0 0 5 veh w/trailers 0 0 0 0 0 0 buses 0 0 0 0 0 0 campers 0 0 0 0 0 0 storage cars 0 0 1 0 2 17 after tractor trailer 4 1 2 2 3 34 count pickups 0 0 0 0 1 4 veh w/trailers 0 0 0 0 0 0 buses 0 0 0 0 0 0 campers 0 0 0 0 0 0 % using cars 3.57% 1.23% 3.45% 6.17% 5.00% 3.42% tractor trailer 12.50% 13.04% 4.00% 0.00% 0.00% 3.94% total pass veh. 2.74% 1.92% 2.90% 5.50% 4.79% 3.53% heavy vehicles 12.50% 13.04% 7.69% 2.08% 0.00% 4.43%
The lowest percentage of cars using the rest area in the southbound direction was
0.72% or 1 out of 138 approaching the rest area entrance. One out of 138 is not statisti-cally significantly different than 2.29% (p>0.08). The highest southbound percentage was 5% or 6 in 120. Six in 120 is also not statistically different than 2.29% (p>0.06). Analyses of “total passenger cars” and heavy vehicles also show that the rate is not statis-tically varying between the different observation periods.
In the northbound direction, the most deviating observation (in percentage) is that of “total passenger vehicles” around 5 p.m. on January 12, when only 0.45% of the vehicles stopped. This is one vehicle out of 224. This is statistically significantly less than the

30
average 3.53% (p<0.003). Cars alone, for the same time period, has one in 176 stopping. This is marginally significantly different than the average value (p<0.04). The lowest percentage for another time period is that for ‘cars’ only of 1.23% or one out of 81. This is not statistically deviating from the average for cars of 3.42% (p>0.23). The highest percentage in the northbound direction is 6.80% (for total passenger vehicles) or 7 in 103. That is marginally statistically more than the average (p<0.03). Passenger cars alone for that time period do not deviate from their average (p>0.05).
In the two directions, there are 20 observation periods for cars alone and 20 for “total passenger vehicles”, and that one of those deviates statistically significantly (p<0.05) from the expected value would randomly occur in one of these twenty cases. That three of them are outside the expected range show that the percentage stopping may not be ab-solutely constant. However, the only clear deviation is the lower than expected observa-tion around 5 p.m. That is in consistence with what is reported from Vermont above. And it makes sense that commuters going home around 5 or 6 p.m. are less likely to stop at rest areas than long-distance travelers that make up a higher percentage of the road us-ers away from commuting hours. The marginally higher observation than average is from the mid morning.
The percentage variation over the day can be seen in Figure 8. It should be noted, from the discussion above, that small numbers might mean that the percentages change drastically even if the variation is within what should be expected from random variations with a constant rate.
Figure 8 - Percentage stopping at the Augusta, Maine rest area
An examination of Figure 8 shows that the rate may be slightly lower during commut-ing hours in the early morning and late afternoon. Nighttime percentages have not been established through these studies, but typically, parking supply is not an issue for passen-ger vehicles during the nighttime.

31
5.1.5 Long-Weekend Uses
Columbus Day 2001 Rest areas are probably used more during the long weekends in the summer and early
fall than during any other time of year. Studies of rest-area usage along I-95 through Maine, New Hampshire and northern Massachusetts were conducted on the afternoon of Columbus Day, October 8, 2001. This coincided with the peak of leaf-peeking season in northern New England. Also, it occurred after the September 11 attack, meaning that a higher percentage of people would travel by car since airplane travel was perceived as dangerous by many travelers. Columbus Day occurred before there were specific threats to bridges in the region and before Anthrax-like powder was seen at rest areas. The stud-ies focused on the southbound direction since most travelers were heading south on this Monday, the last day of the long weekend. Studies of occupancy showed that, on this day, approximately 42% of passenger cars had one occupant, 39% two occupants, 11% three occupants, 7% four occupants and 1% more than four occupants.
Observations were typically done for about 30 minutes. The studies at all the rest ar-eas except for the one at Yarmouth, Maine were conducted as simple ‘observational’ studies. At Yarmouth, the rest area, which is a visitor center, is combined for northbound and southbound traffic and it is located on the northbound side of the highway with entry to the rest area from a public highway going perpendicular to the Interstate. This made it impossible to ‘directly’ observe if vehicles exiting the highway were headed to the rest area. Instead, two observers performed license plate number observations and matches between the exit ramp from the Interstate and the entry to the rest area were used as the ‘stopping’ criteria.
The Kennebunk rest area is on the Maine Turnpike but was included for comparison purposes since it has a very different service offering than the other areas, away from the toll systems of each state.
The result of the counts of traffic passing by and entering respectively as well as per-centage of all traffic entering is shown in Table 10. Table 11 shows the number of vehi-cles stopped at the rest area at a given time—typically that observed when arriving to the rest area.
Table 10 - Proportion of Vehicles Stopping at Rest Areas, Columbus Day 2001 Name State Direc- Mainline volume (vph) Rest area volume (vph)9 Percent using
tion Cars RVs Trucks Buses Cars RVs Trucks Buses rest area, totalHampden ME SB 580 28 64 8 28 8 2 2 5.6% Pittsfield ME SB 912 24 132 6 93 6 15 3 9.8% Augusta ME SB 1074 30 90 3 81 3 0 0 6.6%
Yarmouth ME SB 2760 85 140 20 48 1 0 0 1.6% Kennebunk ME SB 2864 108 162 6 582 12 18 0 16.3% Seabrook NH NB10 2880 36 186 3 168 0 24 0 5.8%
Maria Miles11 MA SB 5442 180 171 12 366 12 18 0 6.4%
9 Sum of entering and exiting volume divided by two 10 There is no southbound rest area along I-95 through New Hampshire 11 This is the Maria Miles Welcome Center in Salisbury, Massachusetts, right at the border to New Hamp-
shire
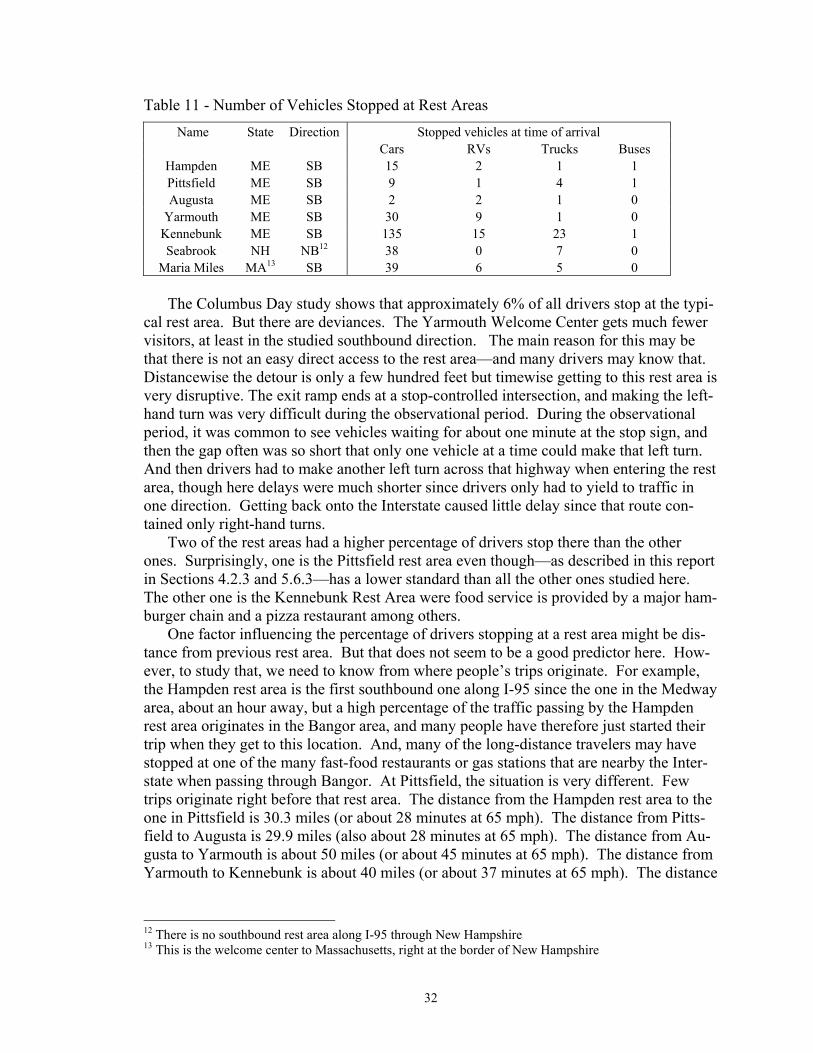
32
Table 11 - Number of Vehicles Stopped at Rest Areas Name State Direction Stopped vehicles at time of arrival
Cars RVs Trucks Buses Hampden ME SB 15 2 1 1 Pittsfield ME SB 9 1 4 1 Augusta ME SB 2 2 1 0
Yarmouth ME SB 30 9 1 0 Kennebunk ME SB 135 15 23 1 Seabrook NH NB12 38 0 7 0
Maria Miles MA13 SB 39 6 5 0 The Columbus Day study shows that approximately 6% of all drivers stop at the typi-
cal rest area. But there are deviances. The Yarmouth Welcome Center gets much fewer visitors, at least in the studied southbound direction. The main reason for this may be that there is not an easy direct access to the rest area—and many drivers may know that. Distancewise the detour is only a few hundred feet but timewise getting to this rest area is very disruptive. The exit ramp ends at a stop-controlled intersection, and making the left-hand turn was very difficult during the observational period. During the observational period, it was common to see vehicles waiting for about one minute at the stop sign, and then the gap often was so short that only one vehicle at a time could make that left turn. And then drivers had to make another left turn across that highway when entering the rest area, though here delays were much shorter since drivers only had to yield to traffic in one direction. Getting back onto the Interstate caused little delay since that route con-tained only right-hand turns.
Two of the rest areas had a higher percentage of drivers stop there than the other ones. Surprisingly, one is the Pittsfield rest area even though—as described in this report in Sections 4.2.3 and 5.6.3—has a lower standard than all the other ones studied here. The other one is the Kennebunk Rest Area were food service is provided by a major ham-burger chain and a pizza restaurant among others.
One factor influencing the percentage of drivers stopping at a rest area might be dis-tance from previous rest area. But that does not seem to be a good predictor here. How-ever, to study that, we need to know from where people’s trips originate. For example, the Hampden rest area is the first southbound one along I-95 since the one in the Medway area, about an hour away, but a high percentage of the traffic passing by the Hampden rest area originates in the Bangor area, and many people have therefore just started their trip when they get to this location. And, many of the long-distance travelers may have stopped at one of the many fast-food restaurants or gas stations that are nearby the Inter-state when passing through Bangor. At Pittsfield, the situation is very different. Few trips originate right before that rest area. The distance from the Hampden rest area to the one in Pittsfield is 30.3 miles (or about 28 minutes at 65 mph). The distance from Pitts-field to Augusta is 29.9 miles (also about 28 minutes at 65 mph). The distance from Au-gusta to Yarmouth is about 50 miles (or about 45 minutes at 65 mph). The distance from Yarmouth to Kennebunk is about 40 miles (or about 37 minutes at 65 mph). The distance
12 There is no southbound rest area along I-95 through New Hampshire 13 This is the welcome center to Massachusetts, right at the border of New Hampshire

33
from Kennebunk to the Massachusetts Welcome Center is 41.4 miles (or about 38 min-utes at 65 mph).
This study looked at the usage of different rest areas during the same afternoon. It is difficult to explain the exact reasons why some areas are used by a higher percentage of travelers than other ones. The distance between them and the service provided should be major variables determining the use, but alternative ‘rest areas’ such as gas stations and fast-food restaurants at interchanges may also explain the reason why the Pittsfield area was used more than distance and service would motivate. The comparison of the use of the rest areas here indicates that a much higher percentage stops at rest areas that have food and gas services (Kennebunk) than at regular ones. This is not surprising since peo-ple do need to buy gas and eat during long drives. The ‘new’ policy of the rest area here, to have fairly competitive gas prices, may contribute to the high use.
The total use is of limited interest except for when determining the minimum number of parking spaces needed. Rather, it is how people use the rest area that determines which services should be provided there. That is covered in the following sections. Also, all rest areas covered here were used by a substantial percentage of all travelers. Even if that percentage was much lower, the rest area should not be eliminated completely since a sleepy driver will need a place to pull off and take a nap within 30 minutes or so from where the person start experiencing tiredness. The rest areas used for napping may not need the same types of services as those used for other reasons. Safety, and possibly a restroom, is the major need requested by sleepy drivers.
To get back to calculating parking demand, it is not only entry volume which is of in-terest but also average time spent in the facility. That can be calculated from combining the findings of Table 10 and Table 11. This can be easily understood since if, e.g., 50 vph arrive (and leave), and they stay there for an average of 30 minutes, then the average number of vehicles stopped there should be 25 (50 * ½ = 25). In total, we have 1490 vph entering the seven rest areas. And, in total, there are 348 vehicles stopped there. This gives an average time spent at the rest area of 0.234 hours or 14 minutes. If we look at passenger cars only, that average time becomes 268/1366 hours or 12 minutes. The aver-age time spent at the rest area by medium and heavy trucks becomes 42/77 hours or 33 minutes. For RVs that time becomes 35/42 hours or 50 minutes. There are so few buses that an average time cannot be figured out with any good accuracy. However, the ob-served average time for buses is 36 minutes. It should be noted that these times are after-noon stopping times. Late evening and night stops are probably, on average, longer. Still, overall parking demand probably reaches its maximum during the daytime (after-noon) when these observations were made.
If we look at average time spent per rest area, using passenger cars only, we can see that the rest areas at Hampden, Pittsfield and Augusta—all regular rest areas with rest-rooms, telephones, maps, vending machines, trash cans, etc—have an average stop time of 26/202 hours or 8 minutes. In other words, people stop, stretch their legs, go to the restrooms and are off again immediately. The average passenger car stop at Seabrook is 38/168 = 14 minutes and at the Massachusetts Welcome Center 39/366 = 11 minutes. The Massachusetts and New Hampshire rest areas have, on average, a bit longer walking distances than the ones in Maine since there are more people using these facilities, and everybody cannot park right at the restroom. The Massachusetts facility may also have had slight lines to the restroom facilities (that are water-free compost facilities with water
34
only for hand washing). The New Hampshire facilities longer time than the others may also be explained by it having different users—all the other ones had a majority of users from the more densely populated areas returning home from Maine, whereas the New Hampshire facilities had a majority of users being people from Maine returning home. Maybe people from Maine—on average—have less strained time budgets or are less stressed in general and therefore make slightly longer stops. Finally, the Kennebunk rest area, on average, had a stopping time for passenger cars of 135/582 hours or 14 minutes. Obviously, this is a mix of people stopping briefly—to buy gas or visit the restrooms—and people stopping longer, e.g., to eat.
Thanksgiving Weekend 2001 A second long-weekend study was carried out during the Thanksgiving weekend of
2001. The aim was twofold; to see if there was a great variation compared to the Colum-bus Day study, and to include more sites from Massachusetts and Connecticut. Primarily, southbound traffic from Maine to Connecticut was studied on Wednesday, November 21, and northbound traffic on Sunday, November 25. The results are summarized in Table 12 and Table 13. There were so few trucks, buses and RV’s that weekend that usage could only be calculated for all types of vehicles combined. The text below gives some additional information.
The most northern observations were carried out in the southbound direction of the Pittsfield, Maine rest area along I-95. This location was chosen since it had a deviating percentage of travelers stop there in the Columbus Day study (higher than typical, with 9.8%). On November 21, the percentage stopping there in the mid-morning was much lower or about 3.5%, with just over 600 cars per hour passing by and 22 stopping. The high percentage on Columbus Day may have been an abnormality or a statistical fluke rather than represent a consistently high use of this facility during ‘busy’ weekends. There were three trucks and four cars stopped at the rest area when arriving, which also confirms that the use of this rest area was much lower at Thanksgiving. Possibly, the rea-son is that the weather had cooled down since early October, but winter had still not ar-rived to Maine by Thanksgiving 2001.
At the Augusta rest area, southbound direction, 32 vehicles per hour stopped out of a total of 1150 approaching the rest area. That is about 2.8% and significantly lower than the percentage observed on Columbus Day which was 6.6%. Possibly there is a pattern here. Besides the weather, it could also be that a higher percentage of travelers returning home from a visit to Maine stops at rest areas than people who have just started out on a trip (who live in Maine). There were two trucks and eight cars parked at this rest area when it was entered, which is higher than the observed number on Columbus Day. This is probably just a normal fluctuation.
A short observation of the Kennebunk (turnpike) facility showed that it was used by an even higher percentage than the 16.3% observed on Columbus Day. In the late morn-ing of this Wednesday before Thanksgiving Day, about 18% of the vehicles went in there during the observed time period. The parking lots were close to full and there were lines to the gas station (but not as long lines as observed later along the Mass Pike where the rest area between Worcester and Sturbridge had lines to the gas station extending onto the highway exit ramp making it almost impossible to bypass these lines to get into the re-maining part of the rest area).

35
Table 12 - Proportion of Vehicles Stopping at Rest Areas, Thanksgiving Weekend 2001
Name State DirectionMainline vol-
ume (vph) Rest area vol-ume (vph)14
Percent using rest area
Pittsfield, I-95 ME SB 610 22 3.5% Augusta, I-95 ME SB 1,118 32 2.8%
Kennebunk, I-95 ME SB 2,900 630 17.8% Maria Miles, I-95 MA SB 3,200 248 7.2% Salisbury, I-495 MA SB 1,900 38 2.0% Westford, I-495 MA SB 3,020 90 2.9% Sturbridge, I-84 MA WB 1,740 16 0.9% Willington, I-84 CT WB 2,850 360 11.2%
Darien, I-95 CT NB 4,180 330 7.3% Bridgeport, I-95 CT NB 4,600 195 4.1%
Milford, I-95 CT NB 5,400 270 4.8% Wallingford, I-91 CT NB 3,500 260 6.9% Willington, I-84 CT EB 4,020 480 10.7% Sturbridge, I-84 MA EB 3,930 38 1.0% Lowell, I-495 MA NB 3,360 198 5.6%
Haverhill, I-495 MA NB 2,880 30 1.0% Maria Miles, I-95 MA SB 3,120 220 6.6%
Seabrook NH NB 3,150 156 4.7%
Table 13 - Number of Vehicles Stopped at Rest Areas Name State Direction Stopped vehicles at time of arrival
Cars RVs Trucks Buses Pittsfield, I-95 ME SB 4 0 3 0 Augusta, I-95 ME SB 8 0 2 0
Kennebunk, I-95 ME SB -- -- -- -- Maria Miles, I-95 MA SB 22 1 4 0 Salisbury, I-495 MA SB 5 2 8 0 Westford, I-495 MA SB 15 2 14 0 Sturbridge, I-84 MA WB 3 0 2 0
Willington CT WB 57 1 5 0 Darien, I-95 CT NB 111 2 2 0
Bridgeport, I-95 CT NB 80 0 5 1 Milford, I-95 CT NB 69 0 4 0
Wallingford, I-91 CT NB 40 0 7 0 Willington, I-84 CT EB 104 1 1 0 Sturbridge, I-84 MA EB 2 0 2 0 Lowell, I-495 MA NB 28 0 0 0
Haverhill, I-495 MA NB 4 0 1 0 Maria Miles, I-95 MA SB 18 1 2 0
Seabrook NH NB 29 0 1 0 At the Massachusetts Welcome Center (Maria Miles in Salisbury) on the New Hamp-
shire border, around noon on November 21, there were just over half as many vehicles 14 Sum of entering and exiting volume divided by two during the observation period
36
parked as on Columbus Day (22 cars, 1 RV and 4 trucks). The southbound traffic vol-ume on the highway was also substantially less than on Columbus Day, with 3,200 com-pared to 5,400 vehicles per hour. On Columbus Day, 6.4% of vehicles entered the rest area. At Thanksgiving, the percentage was almost identical, 7.2%. The Columbus Day studies did not cover rest areas south of this. The Thanksgiving weekend studies contin-ued further south into the more populated areas of New England.
The next observation was done at a ‘simple’ parking area on I-495 just a few miles southwest of the origin at I-95, in Salisbury. There were 5 cars, 8 trucks and 2 RVs at this location. These parking areas have no restrooms, and there are a few types of visitors to them. The first type consists of those that do not stop at all, they went in there by mis-take thinking there would be toilets there. The second group stops briefly, to make a phone call or change drivers or check a map. The third group stops for slightly longer, to stretch their legs or take a dog out for a short walk. Finally, there is a fourth category that uses these parking lots for taking a nap or sleep all night. Truck drivers often belong to this category.
There is a Visitor Center along I-495 at Exit 49. Observations were not taken here partly because a lot of traffic exiting at Exit 49 is not heading for the rest area, and matching of license plates would be required. That was done for the Yarmouth rest area in Maine for the Columbus Day study and obviously doable, but the next observation was instead taken at the rest area near Westford, in between Exits 32 and 33, 19 miles west of Exit 49.
The following observation was done in the mid–afternoon of November 21, about 57 miles east of the one near Westford. In between these two, there is a rest area on I-90, the Mass Pike. The observed parking area is in between Exits 2 and 1 on the Massachusetts section of I-84 in Sturbridge. There are no services, such as restrooms at this parking area, and very few people stop here. That may be partly due to the fact that there is a new, ‘nice,’ Welcome Center just 18 miles further south, about 10 miles into Connecti-cut.
The (Willington) Connecticut Welcome Center is near Exits 71 and 70 on I-84, which both have major supplies of gas stations and fast food restaurants. In spite of this, about 11% of all vehicles used this rest area during the observed time period. With 360 vehi-cles per hour entering (and leaving) the area and 63 vehicles at the rest area, the average stop becomes 0.175 hours or 10.5 minutes. That is very close to the 11 minutes observed at the Massachusetts Welcome Center on Columbus Day.
Observations of northbound rest area use were done on the Sunday following Thanksgiving Day 2001, that is November 25. The temperature was unseasonably warm with temperatures in the mid 60’s in southern New England and in the low50’s still around 6 pm at Pittsfield, Maine. It was overcast but there was no precipitation.
The first study was done around noon, at the Mobil/McDonald’s rest area on I-95 near Darien, Connecticut. With 115 vehicles parked at the rest area (including 8 at the gas station) and a flow of 330 vehicles in and out of the rest area, the average stop be-comes 21 minutes. This can be compared to the 14 minutes observed at the Kennebunk rest area which also has fast food service as well as gasoline.
The next observation was done 12 miles east of the Darien rest area, near the Round Hill Road, not far from Bridgeport. It is an almost identical rest area to the one near Darien, also having a McDonald’s and a Mobile gas station. The percentage stopping

37
here is lower than at Darien. The reason for that may be that people who want to stop have done so at the previous rest area, and few ‘new’ people have gotten the desire to stop in between the two since the travel time is only about ten minutes. With 86 vehicles parked at the rest area (including 12 at the gas station) and a flow of 195 vehicles in and out of the rest area, the average stop becomes 26 minutes, slightly longer than at the facil-ity near Darien.
There is a third, almost identical, rest area another 16 miles east (northbound on I-95) near Milford, Connecticut. This is the March Hill Road service area just west of Exit 66 and where I-91 begins. This service area has a drive-through McDonald’s restaurant and a Mobile gas station. With 73 vehicles parked at the rest area (including 3 at the gas station) and a flow of 270 vehicles per hour in and out of the rest area, the average stop becomes 16 minutes.
Heading north along I-91, 16 miles from the March Hill Road service area, brings us to a rest area in the Wallingford area with restrooms but no commercial facilities. The percentage using this rest area is somewhat higher than that observed for the commercial service areas along I-95 (former Connecticut Turnpike). But the number of vehicles parked here is lower, showing that the average stop is shorter.
Going north and east on I-91 and I-84 after Hartford brings us back to the Wil-lington area. The distance to this rest area is about 38 miles from the one near Walling-ford. The eastbound rest area at Willington is located about 0.5 miles north/east of Exit 69. On this day, Sunday November 25, 2001, there was a big sign prior to the rest area announcing free coffee (as a fundraising for scouting, it turns out when getting there). The temperature was 60F during the observations. The coffee and the warm weather may have contributed to the high turn-off to this rest area, 10.7%. The parking lot was overflowing, with people stopping in the aisles and along the driveways. The total number of vehicles here was 106, indicating that the average stopping time would be around 13 minutes.
Continuing northeast along I-84, into Massachusetts at Sturbridge, 13 miles from the Willington rest area, one gets to a picnic area, which lacks restroom facilities. As seen in Table 12 and Table 13, the use of this facility was very low, just below 1% of the mainline traffic.
On I-495, northbound, just before Lowell between Exits 33 and 34, about 60 miles from the Sturbridge rest area, there is a picnic area with restroom facilities. This has—probably at least partially because of the fact that there are toilets here—a much higher use. The study here was done shortly after 3 p.m. and the temperature was 63 degrees Fahrenheit. There is at least one rest area between these two on I-90, the Mass Pike, and potentially other picnic areas dependent on which routes are used for traveling through or around the Worcester area. The usage was 5.6%.
Continuing 23 miles north along I-495 takes a traveler to a picnic area near East Meadow River, Haverhill and Exit 52 (Route 110). This rest area is 16 miles south (or west) of the terminus point of I-495. There is a sign at the rest area stating, “Facilities at next exit.” Even though this picnic area has no restrooms, it does have maps, telephones and areas for walking pets. The usage was 1.0%.
Before leaving the State of Massachusetts, observations were made of southbound traffic leaving New Hampshire coming into Massachusetts and stopping at the Maria Miles Welcome Center. The percentage stopping on this Sunday after Thanksgiving Day
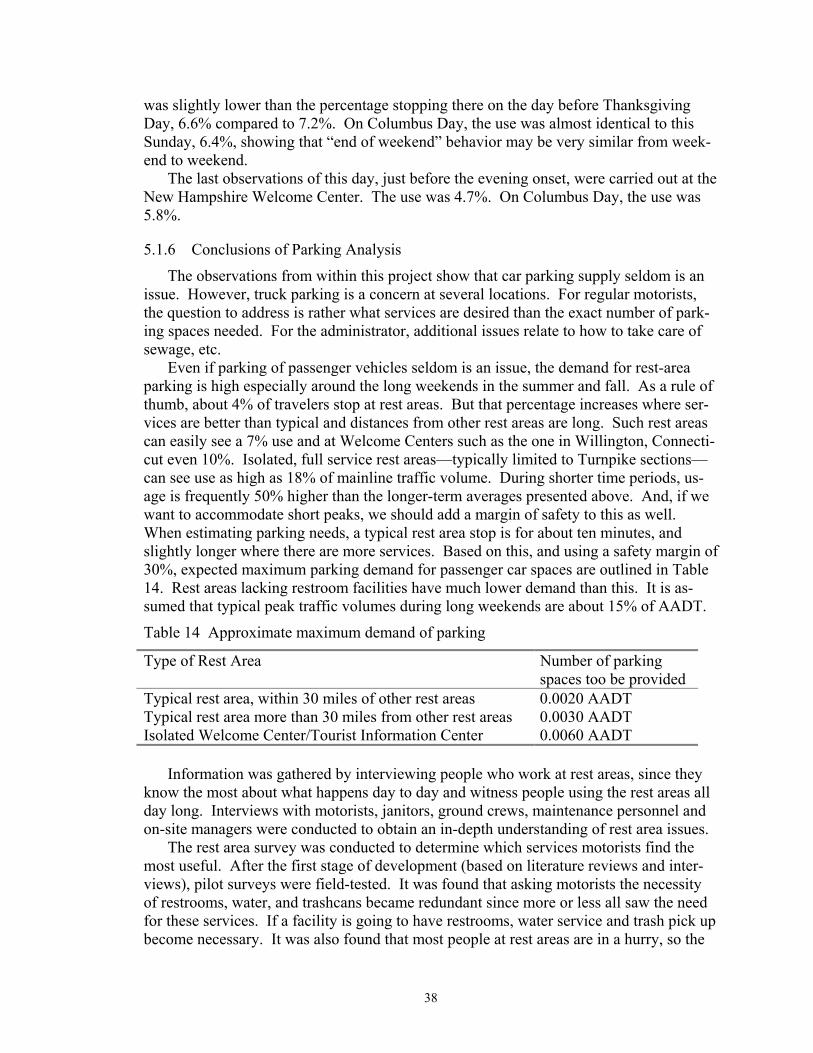
38
was slightly lower than the percentage stopping there on the day before Thanksgiving Day, 6.6% compared to 7.2%. On Columbus Day, the use was almost identical to this Sunday, 6.4%, showing that “end of weekend” behavior may be very similar from week-end to weekend.
The last observations of this day, just before the evening onset, were carried out at the New Hampshire Welcome Center. The use was 4.7%. On Columbus Day, the use was 5.8%.
5.1.6 Conclusions of Parking Analysis
The observations from within this project show that car parking supply seldom is an issue. However, truck parking is a concern at several locations. For regular motorists, the question to address is rather what services are desired than the exact number of park-ing spaces needed. For the administrator, additional issues relate to how to take care of sewage, etc.
Even if parking of passenger vehicles seldom is an issue, the demand for rest-area parking is high especially around the long weekends in the summer and fall. As a rule of thumb, about 4% of travelers stop at rest areas. But that percentage increases where ser-vices are better than typical and distances from other rest areas are long. Such rest areas can easily see a 7% use and at Welcome Centers such as the one in Willington, Connecti-cut even 10%. Isolated, full service rest areas—typically limited to Turnpike sections—can see use as high as 18% of mainline traffic volume. During shorter time periods, us-age is frequently 50% higher than the longer-term averages presented above. And, if we want to accommodate short peaks, we should add a margin of safety to this as well. When estimating parking needs, a typical rest area stop is for about ten minutes, and slightly longer where there are more services. Based on this, and using a safety margin of 30%, expected maximum parking demand for passenger car spaces are outlined in Table 14. Rest areas lacking restroom facilities have much lower demand than this. It is as-sumed that typical peak traffic volumes during long weekends are about 15% of AADT.
Table 14 Approximate maximum demand of parking
Type of Rest Area Number of parking spaces too be provided
Typical rest area, within 30 miles of other rest areas 0.0020 AADT Typical rest area more than 30 miles from other rest areas 0.0030 AADT Isolated Welcome Center/Tourist Information Center 0.0060 AADT
Information was gathered by interviewing people who work at rest areas, since they
know the most about what happens day to day and witness people using the rest areas all day long. Interviews with motorists, janitors, ground crews, maintenance personnel and on-site managers were conducted to obtain an in-depth understanding of rest area issues.
The rest area survey was conducted to determine which services motorists find the most useful. After the first stage of development (based on literature reviews and inter-views), pilot surveys were field-tested. It was found that asking motorists the necessity of restrooms, water, and trashcans became redundant since more or less all saw the need for these services. If a facility is going to have restrooms, water service and trash pick up become necessary. It was also found that most people at rest areas are in a hurry, so the

39
survey needed to be short, to the point, and clear. The survey was administered following University of Maine Human Subjects policies, which are meant to protect the public from unnecessary harm.
5.2 Preference Study User Groups User groups are here defined as categories of people who identify types of travelers
using the rest areas. To find out the reason why people stop at rest areas, it is helpful to ask the following questions:
1. Length of trip. 2. Familiarity with the route. 3. Type of vehicle used. 4. Number of people traveling in the vehicle. 5. General age ranges of occupant(s). 6. Any pets in the vehicle. 7. Whether they drive as an occupation (commercial vehicles). 8. Number of elderly or handicapped occupants. 9. Reason for trip.
From this information, it is then reasonably easy to categorize users as tourists, busi-ness, commuters, commercial drivers, etc. People traveling with pets, children or elderly probably have to stop more often for breaks. Commercial drivers make stops to rest from long drives or to check loads. User groups can be used to create adequate surveys that allow categorization of users and at the same time make it easier for them to express their needs. After the surveys are compiled, the results can be classified according to user groups. It will probably be easier to generalize results based on user groups than by loca-tion or time.
5.2.1 Commercial Drivers
From the literature review and from interviews with rest area personnel it was found that truck drivers (who together with bus drivers make up the category Commercial Driv-ers) have a special interest in rest area issues. Also, in Massachusetts, regular motorists are reasonably well taken care of by existing rest areas whereas truck drivers often cannot find a place to stay overnight (telephone information from Mr. Mark Berger, Mass High-way Department, 23 March 2001). Truck drivers typically travel alone, drive tractor-trailers, drive hundreds of miles daily, have tight schedules and usually are male. They use rest areas routinely and frequently because it is typically easier and faster to park trucks there than at alternate locations. Commercial Drivers could be said to live on the Interstate, and in consequence were made into a special user group with a survey form created to gauge their particular needs.
Bus drivers form a subgroup of the commercial driver group. Bus drivers are in charge of transporting groups of people (usually 10 to 40). Although larger buses often have a restroom in the vehicle, bus drivers prefer that passengers not use them because of the potential odor. They usually stop at welcome centers or other larger rest areas so that people can use the restrooms and also examine tourist information. Obviously, bus trav-elers need rest areas with plenty of restrooms.
40
5.2.2 Motorists on Vacation / Recreational Trips
Motorists on vacation and recreational trips comprise another user group, since they are usually traveling great distances from home. This user group use rest areas to seek out tourist destinations, examine directions, and sometimes to picnic. Tourists are some-times driving large vehicles that take up truck parking space, since a popular mode of transportation is an RV with a car in tow. These vehicles contain chemical toilets but their owners may like to use the public restrooms to avoid building up sewage. Alterna-tively, they also find RV dumpsites useful. RV dumpsites are those (rare) rest areas that allow chemical toilets to be drained into their sewage system (usually when connected to municipal treatment stations).
5.2.3 Commuters
The group that is the most difficult to survey is the one made up of people commuting to work. This group, to some extent recognizable by their business suits and being in single-occupancy vehicles, usually stop at rest areas in the early morning and would often be in a great hurry. They make quick stops to purchase a cup of coffee or newspaper or make a phone call on their mobile phones.
5.2.4 General Motorists
The rest of the traveling public could then be categorized as individuals driving ‘smaller’ vehicles for personal reasons. This group, referred to as Motorists, was sur-veyed as a whole.
A personal trip might be classified as a family visit, running an errand, attending a function, etc. Since this user sub-group contains so many possibilities, it was useful to subdivide it by length of trip, type of vehicle and the number and types of occupants in the vehicle.
Surveys were distributed to attain input from all possible combinations of user groups to reflect as many types of opinions as possible.
5.3 Survey Method Every effort was made to collect unbiased data from all user groups. The surveys
were designed to incorporate aspects of rest areas that were found to be important such as safety, cleanliness, and overall level of service. The surveys, each consisting of a page, are included below. The survey format was condensed into a single page to not over-whelm people when they were asked to fill it out. Setting up a variety of clipboards with the three different surveys allowed many people to complete them simultaneously. It was not only time efficient but it was also easier to attract people when they could see others doing it.
The surveys were given to all different age groups (older than 18). Also included were people walking dogs, riding motorcycles or in RV’s, people with disabilities, and even people who couldn’t speak English. Overall, the widest possible array of users were included.
The surveys are meant to reflect all occupants of the vehicles (not just the drivers). For example, the age of the driver was not directly asked, but instead a composition of all

41
occupants of the vehicle was requested. The surveys were conducted at the rest areas with permission from on-site staff as well as Department officials.
5.4 Survey Forms Commercial drivers were surveyed using the Commercial Driver Survey shown in
Figure 9. All other motorists using the interstate with non-commercial vehicles were sur-veyed using the Motorists form shown in Figure 10. Both commercial drivers and motor-ists were also surveyed using the Preferences form shown in Figure 11
The first two surveys were meant for specific user groups, while the Preferences sur-vey was applicable to all user groups. This general user survey was usually given to pas-sengers who were waiting for the driver to fill out their form. Since the preference form is very simple to explain and fill out, it was also used for people in a big hurry (it took about 15 seconds to fill it out). The Motorist and the Commercial Driver survey both took less than a minute to fill out. Some people use rest areas like pit stops, trying to get in and out quickly, and they appreciated the brief surveys. If people were willing to talk, additional questions were asked and their thoughts carefully noted.
Qualitative information was gathered by using open-ended questions. These ques-tions helped motorist express thoughts on issues that were perhaps left out of the survey. One concern that motorists expressed was the lack of information in other languages (usually Spanish and sometimes French) at the rest areas. A particular complaint by commercial drivers was the usage of truck parking spaces by regular vehicles. Although these comments are fragmented, they help to attain a more complete picture of rest areas.
Overall, the survey forms were simple to produce in large quantities, handy to pass out on clipboards, quick to fill out and conveniently converted into a digital database format. The only part that proved unusable was the origin/destination question. Some answers were too specific while others too vague, so it was inconvenient in summarizing length of trips.

42
Figure 9 - Commercial Driver Survey
Commercial Driver Survey
Type of Cargo:
Start of trip (city)? Destination (city)
Approximate number of hours since last stop
How important are Rest Areas to you? Low 1 2 3 4 5 High
What is the primary reason for this current stop?
How long is your average stay at a rest area?
How long is your average stay at a truck stop?
How safe do you consider this Rest Area? Low 1 2 3 4 5 High
How clean are the facilities ? Low 1 2 3 4 5 High
How comfortable is the bathroom? Low 1 2 3 4 5 High
How far apart should rest areas be spaced?
Where in New England are more Rest Areas needed?
What time of day is it most difficult to find a parking spot?
What do you do if can’t find one?
Comments On Rest Area Locations or Facilities:

43
Motorist Survey
Purpose of Trip: 0 Business 0 Personal 0 Family Visit
0 Commute 0 Recreation / Vacation
Type of Vehicle: Car Pick up Mini Van SUV RV Bus
Number of Adults Traveling: Male______ Female_______
Other travelers: Elderly/ Disabled _____ Children _____ Pets _____
Where did your trip start (city)? ____________ Destination (city)_______
Approximate number of hours since last stop _______________
How important are Rest Areas to you? Low 1 2 3 4 5 High
What is the primary reason for this current stop?_____________________
How safe do you consider this Rest Area? Low 1 2 3 4 5High
How clean are the facilities ? Low 1 2 3 4 5High
How comfortable is the bathroom? Low 1 2 3 4 5High
How far apart should rest areas be spaced? ________________________
Comments On Rest Area Locations or Facilities: Figure 10 - Motorist Survey
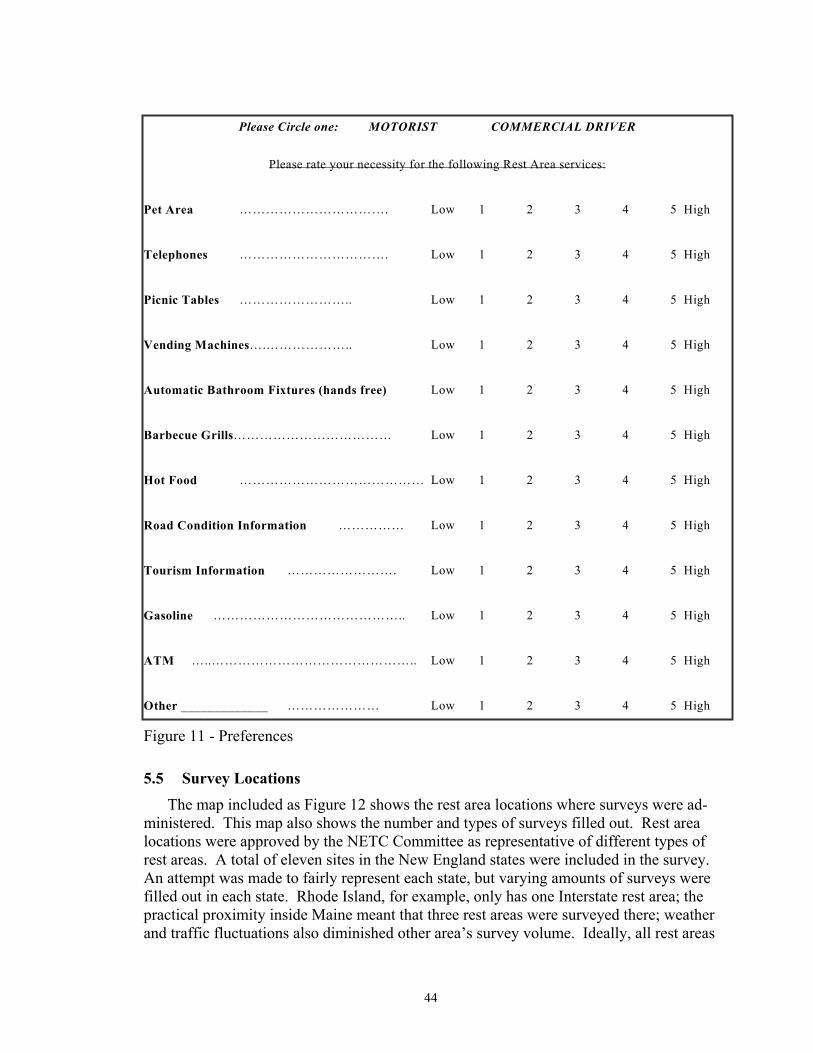
44
Figure 11 - Preferences
5.5 Survey Locations The map included as Figure 12 shows the rest area locations where surveys were ad-
ministered. This map also shows the number and types of surveys filled out. Rest area locations were approved by the NETC Committee as representative of different types of rest areas. A total of eleven sites in the New England states were included in the survey. An attempt was made to fairly represent each state, but varying amounts of surveys were filled out in each state. Rhode Island, for example, only has one Interstate rest area; the practical proximity inside Maine meant that three rest areas were surveyed there; weather and traffic fluctuations also diminished other area’s survey volume. Ideally, all rest areas
Please Circle one: MOTORIST COMMERCIAL DRIVER
Please rate your necessity for the following Rest Area services:
Pet Area ……………………………. Low 1 2 3 4 5 High
Telephones ……………………………. Low 1 2 3 4 5 High
Picnic Tables …………………….. Low 1 2 3 4 5 High
Vending Machines….……………….. Low 1 2 3 4 5 High
Automatic Bathroom Fixtures (hands free) Low 1 2 3 4 5 High
Barbecue Grills……………………………… Low 1 2 3 4 5 High
Hot Food …………………………………… Low 1 2 3 4 5 High
Road Condition Information …………… Low 1 2 3 4 5 High
Tourism Information ……………………. Low 1 2 3 4 5 High
Gasoline …………………………………….. Low 1 2 3 4 5 High
ATM …..……………………………………….. Low 1 2 3 4 5 High
Other _____________ ………………… Low 1 2 3 4 5 High

45
should have been studied, but, e.g., in Vermont alone there are 18 sites on major high-ways, and about ten of them are on Interstates (personal information from Ms. Karen Songhurst, March 19, 2001). To include every rest area would have been very costly even if the sample size at each site were kept very small. The chosen rest areas were not selected in a strictly random or scientific way, but rather in such a way that they would be representative of the major types of rest areas in the New England region.
The sites include locations in rural areas of low population density as well as sites close to large metropolitan areas in Connecticut and Massachusetts. Rest areas of various types were chosen. It is clear from the study that some locations are more receptive to surveying than others. For example, parking areas were visited, but since there are no facilities, people rarely get out of their vehicles and people are scared to be approached there. In contrast, when being allowed to conduct surveys inside the facilities people rec-ognized that it was state-sponsored and were more likely to participate.
A facility’s design was another factor influencing the success of the surveys. For ex-ample, if a facility only has one common entry/exit, where all pedestrian traffic flows through, it was much easier to approach people. Another aspect is the type of travel. That is, during tourist season tourists are more likely to take time out to talk to you than commuters during rush hour.
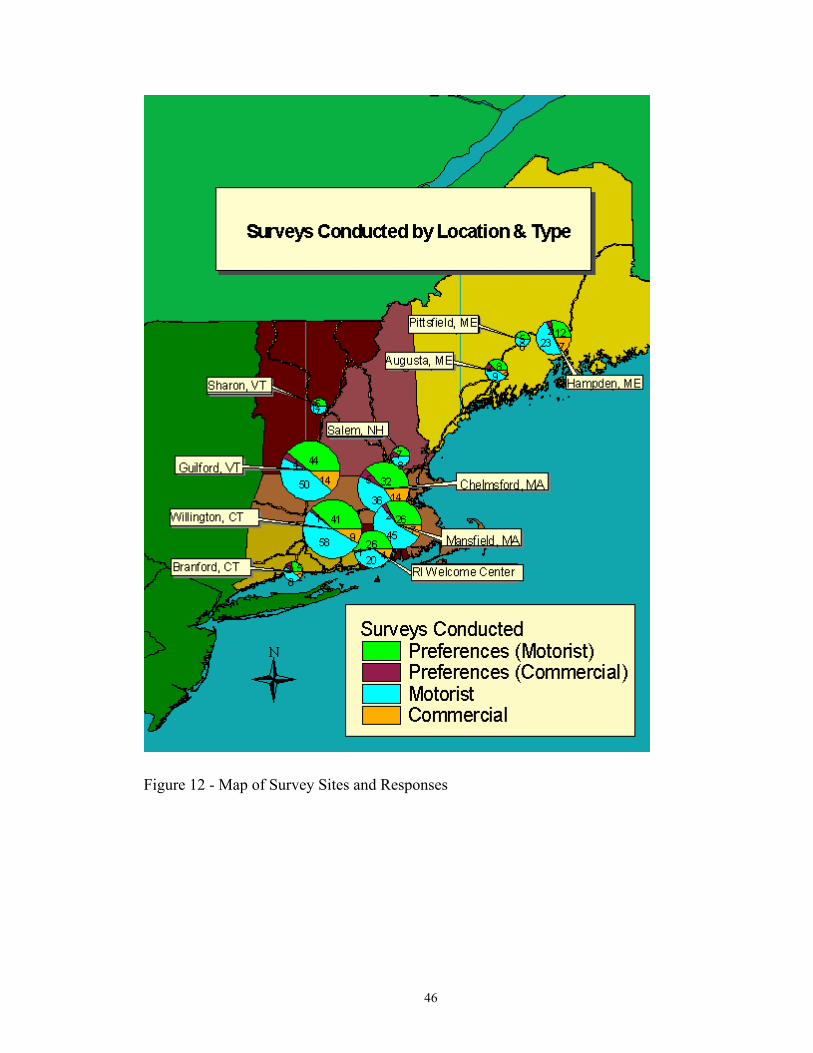
46
Figure 12 - Map of Survey Sites and Responses
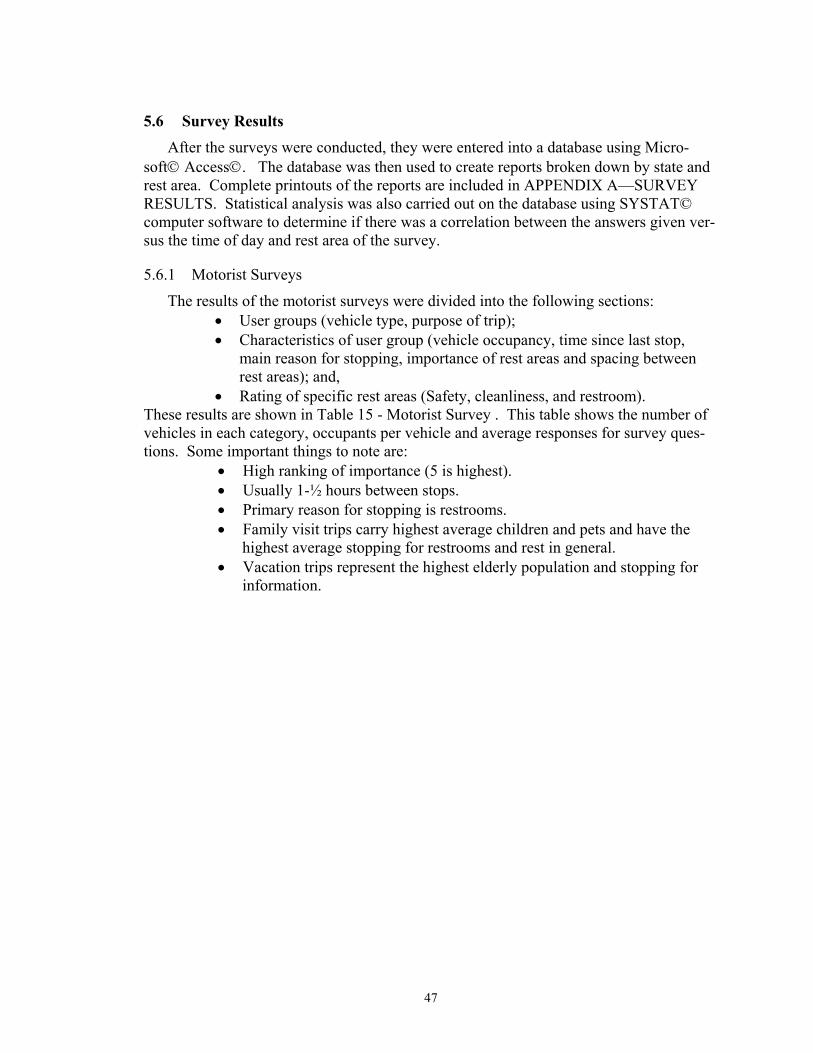
47
5.6 Survey Results After the surveys were conducted, they were entered into a database using Micro-
soft Access. The database was then used to create reports broken down by state and rest area. Complete printouts of the reports are included in APPENDIX A—SURVEY RESULTS. Statistical analysis was also carried out on the database using SYSTAT© computer software to determine if there was a correlation between the answers given ver-sus the time of day and rest area of the survey.
5.6.1 Motorist Surveys
The results of the motorist surveys were divided into the following sections: • User groups (vehicle type, purpose of trip); • Characteristics of user group (vehicle occupancy, time since last stop,
main reason for stopping, importance of rest areas and spacing between rest areas); and,
• Rating of specific rest areas (Safety, cleanliness, and restroom). These results are shown in Table 15 - Motorist Survey . This table shows the number of vehicles in each category, occupants per vehicle and average responses for survey ques-tions. Some important things to note are:
• High ranking of importance (5 is highest). • Usually 1-½ hours between stops. • Primary reason for stopping is restrooms. • Family visit trips carry highest average children and pets and have the
highest average stopping for restrooms and rest in general. • Vacation trips represent the highest elderly population and stopping for
information.

48
Table 15 - Motorist Survey Business Commute Family
Visit Personal Recreation /
vacation Records 54 6 42 65 103
Car 36 5 30 47 61 Minivan 1 0 5 11 11
Pickup 7 1 2 4 7 RV 2 0 0 0 5
SUV 8 0 5 1 15 Bus 0 0 0 1 1
Motorcycle 0 0 0 1 3 Avg. # of occu-pants in vehicle
1.33 1.34 2.14 1.97 2.89
% males 71% 87% 44% 52% 49% % females 29% 13% 56% 48% 51% % elderly/disabled 4% 0% 3% 3% 5% % children 2% 0% 21% 13% 12% Avg # of pets 0.06 0.0 0.17 0.05 0.07 Avg. time from last stop (hours)
1.31 2.00 1.74 1.72 1.63
Importance (1-5)
4.46 4.33 4.48 4.35 4.47
Main reason for stopping
Restroom 51.9 % 50.0 % 61.9 % 55.4 % 58.3 % Rest 18.5 % 16.6 % 23.8 % 20.0 % 22.3 %
Drink/eat 3.7 % 3.3 % 4.8 % 7.7 % 4.9 % Info 0.0 % 0.0 % 7.1 % 9.2 % 14.6 %
Desired spacing of rest areas (miles)
39.98 45.83 65.60 44.49 51.61
5.6.2 Commercial Driver Surveys
The commercial driver survey was analyzed in the same manner as the motorist sur-vey. Results were categorized by “time since last stop” to analyze the change in drivers’ needs during their trips. The results are shown in Table 16. In most cases the primary reason why truck drivers stop is either to rest or go to the restroom. Although they might perform other functions like eating or checking directions and time schedules, they usu-ally don’t stop just for those reasons.
Commercial drivers rated the importance of rest areas high (average of 4.1 on a scale where 5 is the highest). They recommended an average of 55 miles between rest areas, which is just less than an hour's drive. The majority also thought that the parking short-age is worst at night. Nighttime usually refers to the period from about 7:00 p.m. until 4:00 a.m. However, half of all truckers in each category thought that there was no park-ing problem. They attributed this to using privately owned truck stops or, in other areas, having only short route deliveries and therefore being home every night.

49
Table 16 - Commercial Driver Survey Results
Time since last stop (hours) 59 total rec. 0-1 1-2 2-3 3-4 4-5 5-6 6-7
Records 7 13 19 8 10 1 1 Importance (1-5) 4.43 4.00 4.58 4.63 4.80 5.00 5.00 Main reason for stopping (%)
Restroom 28.57 30.77 47.37 37.5 40.0 * Rest 42.86 7.69 10.53 50.0 40.0 *
Drink/eat 14.29 30.77 15.79 0.0 0.0 Info 0.00 7.69 5.26 0.0 0.0
Phones 14.29 23.08 21.05 0.0 20.0 Avg. Stay at Rest Area (hrs)
0.41 1.51 1.68 1.52 2.25 0.81 0.23
Avg. Stay at Truck Stop (hrs)
1.29 0.77 3.63 2.75 3.60 2.00 1.00
Desired spacing of rest areas (miles)
59 60 63 36 50 20 45
What time of day is it most difficult to find a space
Night 57.1 % 69.2 % 73.6 % 75.0 % 80.0 % * Noon 28.5 % 7.6 % 10.5 % 12.5% 20.0 % * *
No problem ever 0.0 % 7.7 % 10.5 % 12.5 % 0.0 % What do you do if you can’t find one
Keep Driving 42.9 % 53.9 % 47.3 % 37.5 % 40.0 % * * Park Illegally 14.3 % 23.1 % 47.3 % 37.5 % 40.0 %
5.6.3 Preferences Survey
The preference surveys were divided into the two categories: Motorist or Commer-cial. The average rating for each rest area service was averaged out to find out the overall necessity for each service. A five-point scale (1=low necessity to 5=high necessity) was used to find users’ opinions. Restrooms were not included in the survey because the pilot survey showed that it is a fundamental part of rest areas that more or less all travelers see a need for. The results are shown in Table 17.

50
Table 17 - Preferences Results
Service (aver-age ratings)
Motorists (211 sur-veys)
Motorist Ranking
Commer-cial Rank-ing
Commercial (22 surveys)
Pet Areas 2.44 10 8 2.64 Telephones 3.63 4 1 4.32 Picnic Area 2.85 7 9 2.55 Vending Ma-chines
3.50 5 3 3.73
Automatic Restroom Fix-tures
3.84 1 4 3.64
Barbecue Grills
1.94 11 11 2.00
Hot Food 2.67 9 7 2.82 Road Informa-tion
3.72 3 2 4.18
Tourist Infor-mation
3.73 2 5 3.23
Gasoline 3.35 6 10 2.36 ATM 2.82 8 6 2.86
The results show that motorists and commercial drivers on average ranked the ser-
vices much the same. Commercial drivers rated telephones highest while motorist rated automatic restroom fixtures first. It is important to note that fuel ranked next to last for truck drivers and sixth for motorist. Hot food also ranked low, which means most people want rest areas, not service areas. Pet areas, barbecues, and picnic tables ranked very low. From these survey results, it is possible to formulate a list of priorities in which to invest. The desire to have access to showers was not covered by this survey. It is possi-ble that truck drivers in particular would like shower facilities at rest areas where they stop and sleep.
The final analysis shows the ratings that all motorists gave individual rest areas. These results are shown in the following table (Table 18). It should be noted that the cleanness, safety, and comfortable scores in combination could be a good measure of overall satisfaction with a rest area. Pittsfield ranked lowest in all three areas, while Sa-lem ranked highest in all three. These two were also the least surveyed of all rest areas.
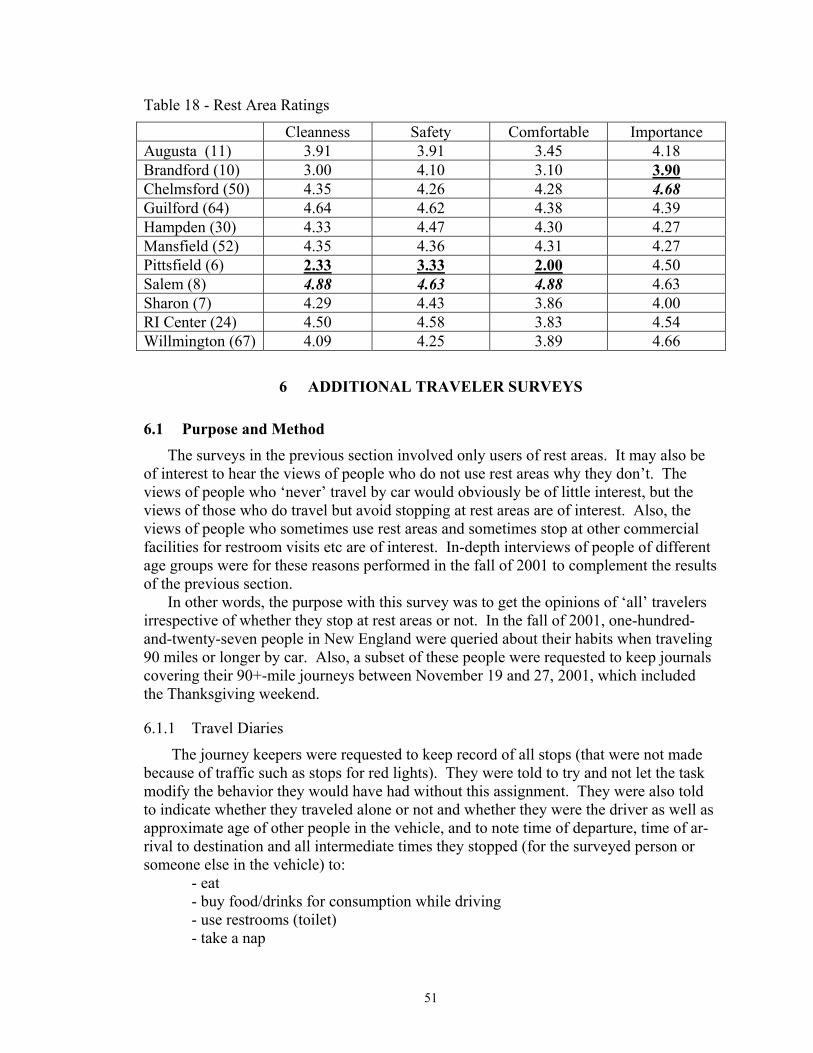
51
Table 18 - Rest Area Ratings
Cleanness Safety Comfortable Importance Augusta (11) 3.91 3.91 3.45 4.18 Brandford (10) 3.00 4.10 3.10 3.90 Chelmsford (50) 4.35 4.26 4.28 4.68 Guilford (64) 4.64 4.62 4.38 4.39 Hampden (30) 4.33 4.47 4.30 4.27 Mansfield (52) 4.35 4.36 4.31 4.27 Pittsfield (6) 2.33 3.33 2.00 4.50 Salem (8) 4.88 4.63 4.88 4.63 Sharon (7) 4.29 4.43 3.86 4.00 RI Center (24) 4.50 4.58 3.83 4.54 Willmington (67) 4.09 4.25 3.89 4.66
6 ADDITIONAL TRAVELER SURVEYS
6.1 Purpose and Method The surveys in the previous section involved only users of rest areas. It may also be
of interest to hear the views of people who do not use rest areas why they don’t. The views of people who ‘never’ travel by car would obviously be of little interest, but the views of those who do travel but avoid stopping at rest areas are of interest. Also, the views of people who sometimes use rest areas and sometimes stop at other commercial facilities for restroom visits etc are of interest. In-depth interviews of people of different age groups were for these reasons performed in the fall of 2001 to complement the results of the previous section.
In other words, the purpose with this survey was to get the opinions of ‘all’ travelers irrespective of whether they stop at rest areas or not. In the fall of 2001, one-hundred-and-twenty-seven people in New England were queried about their habits when traveling 90 miles or longer by car. Also, a subset of these people were requested to keep journals covering their 90+-mile journeys between November 19 and 27, 2001, which included the Thanksgiving weekend.
6.1.1 Travel Diaries
The journey keepers were requested to keep record of all stops (that were not made because of traffic such as stops for red lights). They were told to try and not let the task modify the behavior they would have had without this assignment. They were also told to indicate whether they traveled alone or not and whether they were the driver as well as approximate age of other people in the vehicle, and to note time of departure, time of ar-rival to destination and all intermediate times they stopped (for the surveyed person or someone else in the vehicle) to:
- eat - buy food/drinks for consumption while driving - use restrooms (toilet) - take a nap

52
- other purposes (state purpose: …………………...) Specifically, they were told to note whether they stopped at a rest area (specify where
it is located), a commercial restaurant, a gas station, or what. They were also told to note whether the facility was clean (very, satisfactory) or not, and to note other observations of interest, such as whether it was hard (or easy) to find parking.
6.1.2 In-depth Interviews
When it came to the in-depth surveys of people’s habits, people of all ages above 18 were included. The goal was to include roughly the same number of women and men, and to make sure that there were a fair number of people in every possible age group. There was not a fixed survey form used for this but rather face-to-face in-depth discus-sions were held with the subjects. One question always asked was, “If you were driving along an Interstate and feel tired, where would you stop to nap (at a rest area or where)?” And where would they stop to use restrooms? Also, they were asked about services they would like to see added to rest areas, and if any services could be eliminated, in their opinion. Furthermore, they were asked about the standard of rest areas in general, for example whether they are clean enough? Their opinion with respect to other mainte-nance issues was also covered (e.g. pavement standard, trash cans, ash trays, dog litter, etc.) What could be improved? What about personal safety (e.g., risk of assault)? What about traffic safety (e.g., when walking from car to restroom)? What would they like to see changed? And, what about the distance between rest areas (is it, typically, too long or unnecessarily short)? Maybe they feel like rest areas should be gotten rid off all together. The money could be better spent on…. Also, people were asked to comment on whether the typical design of parking lots, entry ramps, etc at rest areas give a high level of safety or if different deign polices should be implemented.
6.2 Results and Conclusions
6.2.1 Travel Diaries
Only a small percentage of people interviewed submitted travel diaries. In total, 15 were collected. Few people made trips long enough to warrant many stops. Restroom stops were most often combined with purchase of gasoline or food. A few people left the highway and stopped at the side of the road. Others did use rest areas. A couple of peo-ple pointed out that they used a rest area on the toll sections of the highway to avoid the hassle of having to pay to exit and reenter the turnpike. Rather than present numbers based on the actual behavior of these people, their stops for restroom visits and naps have been incorporated into the tables of the next sections covering all 127 subjects queried. The interviews were conducted by undergraduate students attending the University of Maine. The students come from Connecticut, Maine, Massachusetts, New Hampshire, Rhode Island, and Vermont and they interviewed people from their home towns, making all the New England states represented in this preference survey.
6.2.2 Restrooms Stops
The results of the surveys of where people would stop to use toilets can be summa-rized by Table 19. Only one answer per person has been recorded. If hesitating, people
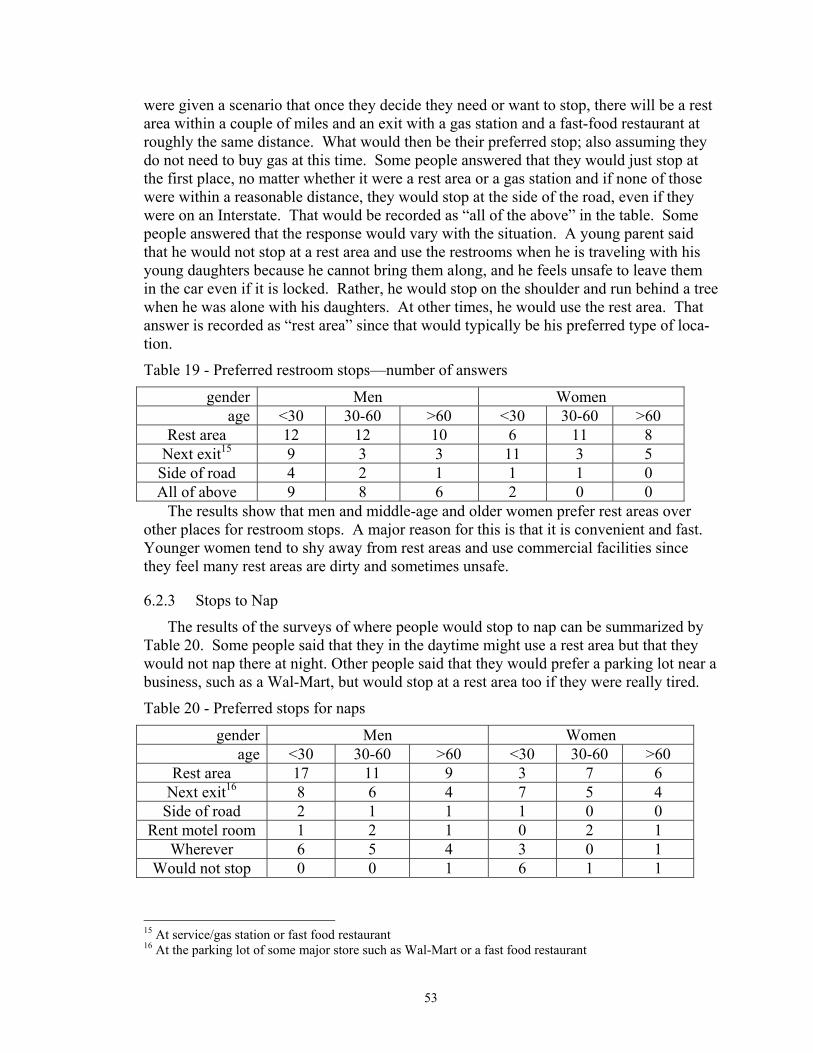
53
were given a scenario that once they decide they need or want to stop, there will be a rest area within a couple of miles and an exit with a gas station and a fast-food restaurant at roughly the same distance. What would then be their preferred stop; also assuming they do not need to buy gas at this time. Some people answered that they would just stop at the first place, no matter whether it were a rest area or a gas station and if none of those were within a reasonable distance, they would stop at the side of the road, even if they were on an Interstate. That would be recorded as “all of the above” in the table. Some people answered that the response would vary with the situation. A young parent said that he would not stop at a rest area and use the restrooms when he is traveling with his young daughters because he cannot bring them along, and he feels unsafe to leave them in the car even if it is locked. Rather, he would stop on the shoulder and run behind a tree when he was alone with his daughters. At other times, he would use the rest area. That answer is recorded as “rest area” since that would typically be his preferred type of loca-tion.
Table 19 - Preferred restroom stops—number of answers
gender Men Women age <30 30-60 >60 <30 30-60 >60
Rest area 12 12 10 6 11 8 Next exit15 9 3 3 11 3 5
Side of road 4 2 1 1 1 0 All of above 9 8 6 2 0 0
The results show that men and middle-age and older women prefer rest areas over other places for restroom stops. A major reason for this is that it is convenient and fast. Younger women tend to shy away from rest areas and use commercial facilities since they feel many rest areas are dirty and sometimes unsafe.
6.2.3 Stops to Nap
The results of the surveys of where people would stop to nap can be summarized by Table 20. Some people said that they in the daytime might use a rest area but that they would not nap there at night. Other people said that they would prefer a parking lot near a business, such as a Wal-Mart, but would stop at a rest area too if they were really tired.
Table 20 - Preferred stops for naps
gender Men Women age <30 30-60 >60 <30 30-60 >60
Rest area 17 11 9 3 7 6 Next exit16 8 6 4 7 5 4
Side of road 2 1 1 1 0 0 Rent motel room 1 2 1 0 2 1
Wherever 6 5 4 3 0 1 Would not stop 0 0 1 6 1 1
15 At service/gas station or fast food restaurant 16 At the parking lot of some major store such as Wal-Mart or a fast food restaurant
54
The results are similar as those for restroom stops. Younger women avoid rest areas; other travelers prefer them over all alternative locations.
A young man exemplifies the need for rest areas for sleepy drivers with the following account of driving through Maine late one night, “I assumed I would be able to stop at a rest area and take a nap. But the distances between the rest areas were so long that I had to practically slap myself in the face to stay awake before I could make it another rest area. If I remember properly, I think there are only two rest areas between Augusta and Orono, and I didn’t think that was adequate. I think there should be a sign somewhere on the Interstate ahead of the first rest area telling people the distance to the next one so people can be more prepared.”
6.2.4 Personal and Traffic Safety
Traffic safety was not an issue among any of the people interviewed here. A couple of people did mention that it is important that parking is arranged in such a way that two-way traffic does not occur (angled so that people start up heading towards the exit rather than the entry ramp). A few people also talked about separating trucks from cars. Sur-prisingly, no one in this sample talked about entry speeds or separation between the rest area and the highway as safety issues. One person did point out that he had no safety concerns in the New England area, as if he might have it somewhere else.
It was found that several people, especially women—ranging from young to middle age—specifically mentioned that they (when traveling alone) do not feel comfortable to walk to the restrooms of rest areas, especially not if there is a man talking at a payphone right at the entry to the rest-room facility. Obviously this is less of a concern in the day-time when there are lots of people around than after dark and at times when there are few other visitors around. At such times, many women do worry about their personal safety. Several people also mentioned that they lock their doors when they stop at rest areas. A couple of people mentioned that they stay in their cars until there is more than one other car at the rest area.
It was suggested that call boxes be provided at all rest areas so that one easily gets in contact with a police dispatcher in an emergency situation. Also, that video surveillance was added and that the lighting was improved. Lighting was mentioned by more people than any other measure. Several people also suggested that the distance between the parking area and the restrooms should be minimized. Today, the restrooms are some-times more than a hundred feet away from the closest parking spot.
A few people suggested that security guards be hired to work at the rest area, prefera-bly 24 hours a day. Such people could also serve as janitors, give information, etc. to travelers. Other people suggest that State Troopers stop by at rest areas more frequently. If police were seen there more frequently, drifters and other ‘undesirable’ people may choose other locations than rest areas.
It was also found that some women do not like to use the restrooms at rest areas under any conditions. Some feel that it is not only unsafe but also unpleasant. Many people think that they can find safer, cleaner and nicer facilities at commercial establishments along the highway.

55
6.2.5 Maintenance and Operations
Cleanliness is the only maintenance issue brought up by a majority of subjects. And a majority of people is at least somewhat unhappy with the cleanliness of many facilities though many also say that there has been tremendous improvements over the last several years. Among younger people there is a clear majority who are very unhappy with the cleanliness. Older people are clearly more accepting of the cleanliness of, especially, the restrooms, though many elderly also mention it as an issue it typically does not stop them from using rest areas. Several people do point out that there are exceptions; that some facilities are kept quite clean and pleasant. But many others say that typical rest areas smell bad, have dirty toilets, have wet floors with liquid of sometimes-questionable ori-gin, etc. The cleanliness of the restrooms is the major concern. Outdoor cleanliness typi-cally deals with smoking and cigarette butts lying around, but some subjects also point out that there is trash lying around at some locations. One specific issue is paper towels from the restrooms. People do like to have access to such, but some point out that some people bring towels outside and throw them on the ground especially if there aren’t con-venient trash baskets along the path to the car. (Some people refuse to touch trashcan lids—on the other hand, trashcans without lids may have the contents spread by birds and animals.) A solution to the cleanliness problem could be to employ full-time personnel that work with maintenance and have the same people ensure security by acting as secu-rity guards. If cleanliness were the only issue, then the suggestion from one person, to have people serving jail time or doing community service in lieu of jail time being jani-tors could work well. But many travelers would obviously not feel good about napping when they were ‘guarded’ by inmates, possibly serving time for assault or even rape….
With respect to lighting, several people suggest brighter lights. It is obviously impor-tant that broken bulbs be replaced swiftly, but that is not an issue mentioned by more than one person.
Pavement quality is not an issue among any of the interviewed subjects.
6.2.6 Smoking
Several people suggested that smoking be banned from the area close to the restrooms and along the paths between the restrooms and the parking. In other words, that a sepa-rate smoking area be provided similarly to pet areas away from where most users walk.
6.2.7 Services to be Added
Many people suggested that—if we want to attract more users to rest areas—it would be a good idea to offer more services at rest areas. But the major change that would have to be done would be to improve cleanliness. The primary ‘service’ most people would like to see is better security but there were many other suggestions made. It should be remembered that federal law prohibits several of the suggested offerings. Also, most people think there is no need for more services than today—just better execution of some of those services, i.e. better cleanliness and security.
Frequently suggested services—besides call boxes for emergencies and better cleanliness—were bath–room attendants, seat covers for the toilets, ‘better’ running water (it often just trickles out if faucets according to one person), maps of the state or area (at

56
all rest areas), free coffee, nutritious food and drinks at reasonable price, and nice, clean pet areas.
Less frequent suggestions included the possibility to purchase maps, and a wider se-lection of items at vending machines, the sale of gasoline, accessibility to air compres-sors, charcoal for grills, vending machines with hot dogs for grilling, tennis courts, basket ball courts, play areas for children, water faucets for getting water to pets, entertainment centers (video game arcades). Other, more detailed, suggestions include providing alco-hol gel ‘soaps’ at rest areas so that people can ‘wash’ their hands without using water (and without touching taps) and save on paper towels and/or hand-drying electricity.
6.2.8 Services Potentially to be Eliminated
What does not need to be provided quite to the extent it is today include picnic tables according to a couple of people. A few people said that everything besides clean bath-rooms (and I assume parking facilities, etc) could and/or should be eliminated. Other people agreeing with that statement would like to keep drinking water available.
6.2.9 Physical Layout
There are two diametrically opposed suggestions by several subjects. One is to move the rest area parking lot further away from the highway to provide a quieter area for ‘rest-ing.’ And to plant trees and brush so that travelers aren’t reminded of the fact that they are close to the highway they may need a break from. But other people have the opposite view, that trees should be removed and parking spaces be so close to the highway that people feel safe and not as secluded as today “being in the middle of the woods.” A compromise could obviously be to provide two parking areas, one close to the highway and another one removed further back. That is already the case at some rest areas.
The importance of separation of trucks from cars is brought up by a few people. It was by a couple of people suggested that rest areas could be located in the middle
of the Interstate, where the median is wide enough, so that services could be utilized by traffic in both directions. The traffic safety of on and off-ramps on the left could be an issue, but if a separate lane is added over a longer distance, rather than short on/off-ramps, the safety could probably be acceptable. An added benefit of having drivers in both directions reach a rest area is that the site could be combined with ride-share lots, and that people when picking up their cars to return home do not have to drive in the wrong direction to the next interchange. In reality, the median would seldom be wide enough to provide such a layout on existing highways. An alternative solution to obtain some of the same benefits would then be to provide ramps over the median, using bridges or tunnels, so that ‘northbound’ travelers could use the ‘southbound’ rest area. A possi-bility would also be to just provide a walking bridge/tunnel to the full services while rest-rooms and trash cans etc. are located on both sides.
6.2.10 Distance between Rest Areas
Roughly half the subjects feel that the typical distance between rest areas is fine. But several subjects indicated that distances between rest areas today are too long. An exam-ple of this is on I-95 through Maine where there is no rest area between Hamden south of Bangor and Medway near Millinocket. That is a distance of 64 miles. A couple of sub-jects in Rhode Island also were of the opinion that rest areas should be located closer to-

57
gether. On the other hand, a few people thought the rest areas were unnecessarily close to one another. A couple of subjects pointed out that they would like to see about half the rest areas eliminated; and the remaining half get all the resources so that they could be kept immaculately clean and safe.
6.2.11 Summary
People can be divided into two categories, those that feel that rest areas of today typi-cally are fine, and those who think that significant improvements are needed. The first group can be represented by the following statement made by a man (and father of two) in his mid twenties, “I personally think the rest areas are adequate for people’s needs. They could be cleaned up a little more to be more inviting but otherwise they are fine. I think they are spaced evenly too. I feel there isn’t any real need to change anything. There really isn’t any need to have restaurants, gas stations, or vending machines because generally there are gas stations and restaurants right at the off ramps or exits. If there isn’t [such an] exit for several hundred miles then maybe … vending machines and gas stations [would be motivated] at rest areas.” The second opinion can be exemplified by the statement made by a woman in her mid twenties, “ In my experience, rest areas are not the place to go. I absolutely avoid them if I have to go to the bathroom. I would rather go to the side of the road. Usually when I am traveling, I time it so when I am hungry I also use the bathroom at the restaurant…. This summer I ended up having to stop at a rest area in Maine with my mother, the place was so dirty. People were smoking right out front of the doors, and when you went in the bathroom the whole floor was wet and there were also puddles in certain areas of ‘questionable’ fluid and it wasn’t raining outside. It was disgusting, I had to roll up my pant legs and tuck in my shoelaces….” A possible third group would be one that stated that rest areas of today are much too fancy, that savings could be made by eliminating expensive services, pull back maintenance re-sources, etc. No one among those surveyed expressed such thoughts.
7 REST AREA TECHNOLOGY SERVICES To facilitate in the management of rest areas, a good inventory is needed. To illus-
trate this, an electronic catalog was created using Geographic Information System (GIS) software. This software allows for the integration of databases with maps. In our par-ticular application, the database information consisted of rest area location, facilities available, as well as services available close to highway interchanges.
GIS maps are versatile and can be used for traveler information system. It is possible to set up a display unit at a rest area that receives GIS generated images through the Internet and show the road and weather conditions, roadwork, traffic updates, potential hotels and restaurants at destination points, etc.
Rest areas could further increase safety by encouraging motorists to get out of their cars to eat, talk on the phone, and consult navigation devices rather than use in-vehicle devices. The need may include weather information, road traffic conditions, Internet and e-mail availability. Many other services may be safer to access here than having people use them while driving. It may be possible to pre-empt the eventual evolution of on-board travel technology by encouraging motorists to use rest area services as the dissemi-nation point for information services.

58
7.1 Catalog Map A map of the Interstate system in New England was created and is shown in Error!
Reference source not found.. The map contains all the Interstates and services available to the traveler within New England. The facilities shown are locations where a traveler can access services on the interstate (rest areas, tourist centers, weight stations, scenic views, etc.) or close to the Interstate (any business or public facility). The resulting map, or a similar creation, can be used for many purposes.
In management, this computer map can be used to model parking availability along corridors. Traffic volumes (AADTs), number of lanes and time of day can be used as impedance values on the road network to designate how difficult it is to travel through a congested section of highway. It is then possible to perform a system analysis by enter-ing an origination point, time of departure, and destination. Based on the impedance val-ues, the program would give the estimated time a vehicle would reach a certain point. Having all the rest areas and exit services as part of the network also allows a planner to evaluate the needs for additional truck parking spaces based on freight flows.
This map could also be helpful to travelers who are looking for certain services. If available at rest areas at a computer terminal, it could aid a tourist in finding routes to destinations. However, such a system may require staff for supervision and aid.
The Massachusetts Highway Department provided a GIS map of all their rest areas, and paper copies of lists of services. There are commercial products like DeLorme’s software which provides exit services, but this software has a major downside to travel-ers: it’s not available for free.
The GIS map does have limitations. Development at highway exits is constant and rapid, meaning that the information attained within the map is vulnerable to obsoles-cence. However, it is predicted that development will occur in groups. For example, if an exit has a restaurant and a gas station, another gas station would still provide the same services, just at a higher level of service.
The map made within this project does not have high precision; the locations of the services on the highway are not pinpointed accurately. The mile marker used to deter-mine its locations are rounded to the nearest whole number. There are some services where the mile markers are close to each other, so they are shown to have the same loca-tion. For this illustration purpose, the accuracy in location is sufficient. For more de-tailed information on the design of the GIS map, refer to APPENDIX C—GIS MAP-PING PROGRAM. Copies of this map are accessible through a CD-ROM and through the Internet available at http://www.umeciv.maine.edu/transportation/netc.htm
Rest area locations and amenities were compiled with a combination of observational and published sources. Since the University of Maine has students who travel home throughout New England, several of them were hired to stop during their trips home and report on rest area locations and conditions as well as amenities. Massachusetts has a web page at http://www.state.ma.us/mhd/resta/location.htm, as well a GIS map with all locations and amenities. Rhode Island only has one visitor center, so this was easy to gain. Connecticut and Maine have published reports on rest areas. Vermont and NH in-formation was gathered from field notes and phone interviews.

59
Figure 13 - Interstate Service Map
7.2 GIS Information Kiosks Information kiosks are interactive computers, set up at rest areas, which provide in-
formation on command. They are useful in providing road, traffic, tourism and weather information. Georgia, Indiana and Arizona are some of the states that currently use ki-osks.

60
The information gathering is achieved through many devices such as cameras, radar,
road counters, weather stations, and direct observations. This information is then relayed to traffic engineers and/or directly to the driving public. Relaying the information is the difficult part. Getting the information to drivers can be achieved through radio advisories (in the U.S., usually AM but in, e.g., Europe there is an FM informational service with road information that overrides any station and even interrupts CDs and tapes in car ra-dios supplied during the last 25 years or so). Alternatives to radio advisories can be vari-able messaging along the roadway as well as on board devices.
In this aspect, rest areas are and could continue to be useful in disseminating informa-tion. Many rest areas offer weather information and general directions. At manned rest areas, knowledgeable attendants can be helpful in suggesting alternate routes and detours.
7.2.1 Financing Kiosks
There are several methods for making kiosks financially feasible. One way is to use in-house personnel to create and administer the GIS database. The components for creat-ing a kiosk are readily available off-the-shelf and the computer components continually decrease in price. Advertising space may be sold on the kiosk itself if the agency directly responsible for the rest area as well as the Federal Highway Administration allow this. For example local computer companies or an Internet provider could trade services for advertising on the kiosk.
The kiosk consists of five main parts:
1. Hardware (touch-screen monitor, keyboard, CPU, etc.); 2. Software (user interface, GIS mapping and/or communications); 3. Coin activated printer (if available); 4. Telephone and electric utilities; and 5. Service personnel to operate data systems.
According to a David M. Dornbusch study (1996), the software costs would be $60-$150,000 while hardware would cost less than $10,000. Since the time of the report, hardware costs have decreased dramatically and most components for a kiosk are avail-able off the shelves. Software development and information compilation could be done by DOT personnel using current software packages and maps. In short, the overall cost of the kiosk system would be low. As the price decreases, it should become possible to make the kiosk financially feasible through advertisement generation.
In financing kiosks, the primary source could be advertisement. Business partner-ships could help differentiate the capital costs or the Internet costs, but would perhaps imply a government approval of a particular enterprise. Onscreen advertisement could be used if the same information is available over the Internet. A 4’x 3’ poster can bring in $400 per month at rest areas (Dornbusch, 1996). Advertisement revenues would be lower after considering the management costs for the accounts. Overall, kiosks could be devel-oped using federal ITS funds, advertisement revenues and cooperation from local MPOs and chambers of commerce who would benefit from these systems.
Georgia has conducted a “User Acceptance Test Report” for the evaluation of their Advanced-Traveler-Information-System Kiosk system named TraveLink. It was found that people who lived in the area served by the Kiosk valued the system more than tour-

61
ists, but tourist found it interesting none the less. The average user stayed at the kiosk station for six minutes. More than half of respondents to a survey said they would be unwilling to pay for its use, but 85% would be willing to pay 25 cents for a print copy. The survey groups preferred traffic, weather, travel and tourism, and Metro route plan-ning features the most. After viewing the kiosk information, some travelers changed their route plans. (Thornton, 1997)
7.2.1 Current Uses
The Mississippi Department of Transportation (MSDOT) has started to install traveler information kiosks at rest areas. These kiosks are installed and maintained by a private contractor but MSDOT is in control of the information displayed and has access to them via the Internet. The kiosks provide Interstate motorists with information concerning construction along the highways as well as exit services available. In case of a natural or national emergency, the kiosks information can be updated using the Internet connection to show relevant information on road closure, evacuation routes, laws etc.
The reason why MSDOT adopted the kiosks was to keep the public informed about work zone locations and also to give them public service information. Although the sys-tem provides service information about the highway system, the primary benefit from these kiosks are said to be the improved safety. Currently, Mississippi has installed ki-osks only at rest areas that provide 24-hour security, which are about a dozen rest areas throughout the state.
Arizona has used federal ITS funds to implement a kiosk system. This system uses a series of linked pictures to provide Interstate information. It is served online at www.azfms.com and it appears the same way at the kiosk (see Figure 14).

62
Figure 14 - Arizona DOT Kiosk Screen Shot
In Nebraska, as of 1998, eight information kiosks have been installed at Interstate rest areas. These kiosks provide information about weather, pavement conditions and road closures. The information is also available from the Internet to travelers before they leave their homes.
Dade County in Florida uses traveler information stations for a variety of uses. The goal is to achieve a balanced transportation system where people can make informed de-cisions. Kiosks present available transportation alternatives (transit) and alternate routes relevant to the user’s needs and location.
The Miami Metropolitan Planning Organization (MPO) also uses the kiosk to involve the public by providing information on proposed projects. Feedback can also be sent through the kiosk system back to the MPO. The estimated cost for five kiosks is under $100,000 in capital costs and $144,000 for 3.5 years of maintenance. The advertising sales are estimated to bring in $200,000 for a total net cost of $44,000 (Burris & Pietrzyk, 1997).
7.3 ITS Intelligent transportation systems (ITS) may include video cameras, sensors, radar,
and global positioning systems (GPS). These systems can help to monitor and control traffic. ITS infrastructure will be designed according to a defined architecture. The cur-rent problem has been how to deliver gathered information to the end user. It is our be-

63
lief that rest areas can perform at least some of this function of information dissipation to travelers.
Rest areas are widely used because they provide convenient access to free services such as restrooms, a place to stretch, phones and information. ITS generally consists of obtaining information on the traffic conditions and alleviating congestion or danger through communication with drivers. As the concentration moves from building to man-agement of the transportation infrastructure, ITS is becoming very important. ITS im-plemented would reach large numbers of tourist and commercial drivers. ITS Commer-cial Vehicle Information System and Network (CVISN) Program could provide funding.
An ITS architecture is: “a framework that defines a complex system, in terms of a set of smaller, more manageable systems which are fully defined in terms of their individual bounda-ries, functions, physical components, and interfaces. They illustrate how each of the systems interrelate and contribute to the overall ITS objectives and require-ments”(Lockheed & SRF Consulting, 1996).
ITS should be embraced by the rest areas as complementary tools in serving the pub-lic. Automated maps and information systems could be displayed to the travelers and controlled from a central dispatch (could be located at a rest area to help with costs). This system could provide valuable information to the traveler about conditions ahead.
However, it can be argued that rest areas are too far apart and that travelers will not want to take time off during their trips to stop at rest areas, especially not commuters and busy business travelers. Everybody may need roadway and traffic condition reports. Thus, in-vehicle units are probably the optimum for delivering some of this information. But more long-term planning, such as booking hotel rooms, buying tickets to events, etc., may be more suited to rest areas. We do not want motorists do deal with such complex issues while driving. There are also intermediate alternatives to in-vehicle versus rest area ITS-systems. An agreement was signed at the end of 2000 between the CUE Corpo-ration and some gas stations that enables drivers to interactively access near-real-time news, sport, weather and traffic alerts through the Ten Square service (ITS International, January/February 2001, p. 8). That information is already available for free on Internet at address http://www.cuetraffic.com/. Traffic and weather reports as well as driving direc-tions can be found at this site for all major urbanized areas in the United States.
Variable messaging could be used to help relieve parking capacity issues. This could work by having signs on the side of the road display information about where parking is available. Variable Message Signs (VMS) are large signs that display information typi-cally with the use of light emitting diodes. These signs can be programmed to display real time messages concerning traffic conditions or locations of accidents or parking spaces.
A study conducted by Peeta, Ramos and Pasupathy has helped to develop some guidelines regarding successful message characteristics. Some of the issues concerning messaging are the ability of the traveler to understand and act upon the information dis-played. It is necessary to have brief messages. This study also found that truck drivers have a lower tendency to obey VMS messaging, due in part to their unfamiliarity with many routes. In rest area parking issues though, the messages would be short (e.g., PARKING AVAILABLE AT REST AREA). Since the issue is intended to directly help truck drivers find parking spaces, then they would probably use the information. VMS should

64
also include parking capacity at private rest stops, so that the system includes all alterna-tive stopping places. Having a calling center where all facilities relay information about their remaining parking capacity periodically could, at least in theory, easily do this. Though the actual number of free spaces would have to be monitored on an ongoing basis unless automatic detection is provided. At the center, the information could then be processed and sent to the displays. When parking is not an issue, i.e., during the day, VMS could be used to display traffic situations and route information. The cost of this system and who is to be responsible for its upkeep and operations remain to be deter-mined.
Rest areas could be combined with VMS processing centers to provide more funding for rest areas and to help maintain a presence of staff and thereby some sense of security.
8 DESIGN The fact that rest areas are built on the Interstate’s right of way represents many prob-
lems concerning design. For remote locations, ample free space to build is countered by difficulty in acquiring municipal utilities such as electric, sewage and water. Rest area sites located near urbanized areas have limited space to build upon and face heavy traffic volumes. Difficulty in water supply and waste management is a major problem. Solu-tions can be found by adequate designs but the cost can at times become prohibitively high. The physical landscape should be designed for safety, pleasure and functionality. The largest limitation to building or expanding rest areas is of course limited funding.
There are many and varying design criteria from state to state that need to be obeyed, as well as all environmental laws. Land availability may be limited by citizen opposition as well as to existing rights of way in developed areas. As mentioned on page 17, AASHTO has recently prepared a guideline entitled “A Guide for Development of Rest Areas on Major Arterials and Freeways,” which endorses rest-area development and planning on a statewide basis and provides in-depth guidelines with the aim that the sys-tem should provide safety value, tourism benefits, and motorist services. Certain de-signs have been recognized as more successful than others. For example, in 1998, the Federal Highway Administrator Kenneth R. Wykle announced the winning entries in the FHWA’s Excellence in Highway Design Competition. In the highway-related projects area, a Merit Award was given to Cuerno Verde Rest Area, in Colorado. That rest area, nestled at the foot of the Rocky Mountains, is said to meet all expectations related to building layout and function, site circulation for vehicles, stunning views, architectural tie to the local area, nature, vegetation, and features that highlight the history of the area (http://www.fhwa.dot.gov/eihd/cuerno.htm). Rest area design ideas can also include looking at what the State of New York has done.
8.1 Safety The most important aspect of any facility is the safety of its users. When an incident
occurs at a rest area, the public might associate it with all rest areas and particularly with the state in which it occurred.
Safety concerns at rest areas can be solved through the three E’s concept of Engineer-ing, Education and Enforcement. Personal safety is an issue that to a large part has en-forcement and education solutions and only minimal can be remedied with engineering
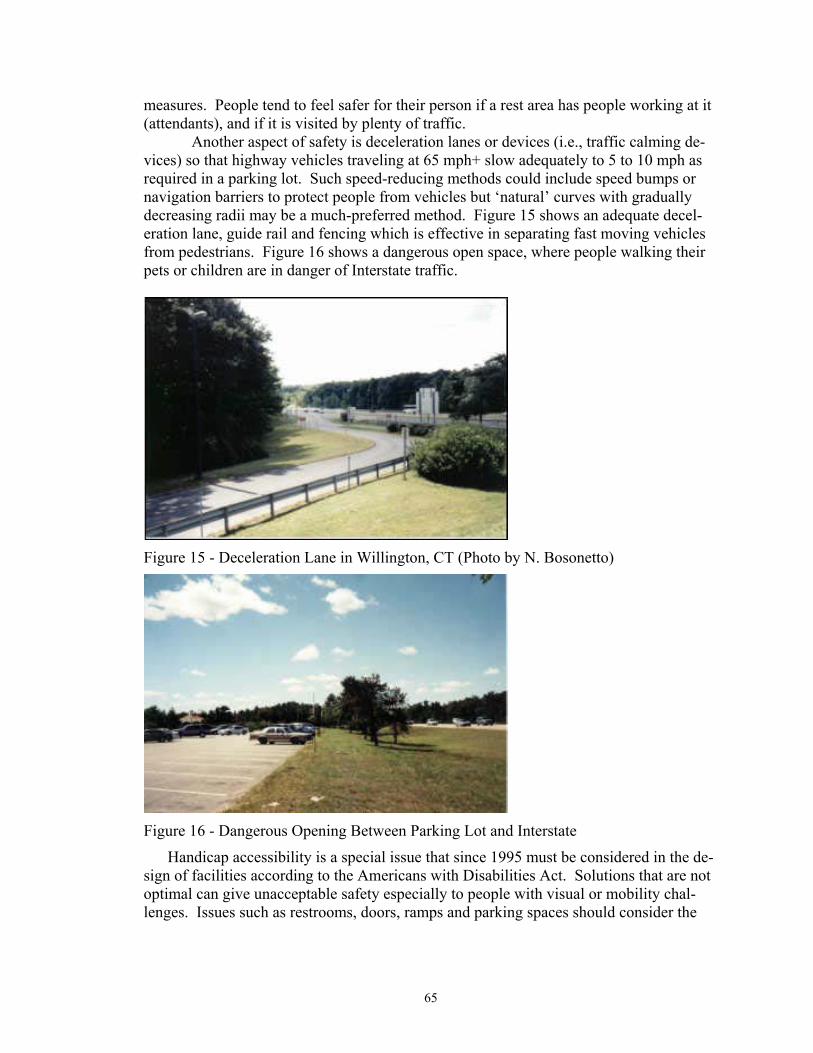
65
measures. People tend to feel safer for their person if a rest area has people working at it (attendants), and if it is visited by plenty of traffic.
Another aspect of safety is deceleration lanes or devices (i.e., traffic calming de-vices) so that highway vehicles traveling at 65 mph+ slow adequately to 5 to 10 mph as required in a parking lot. Such speed-reducing methods could include speed bumps or navigation barriers to protect people from vehicles but ‘natural’ curves with gradually decreasing radii may be a much-preferred method. Figure 15 shows an adequate decel-eration lane, guide rail and fencing which is effective in separating fast moving vehicles from pedestrians. Figure 16 shows a dangerous open space, where people walking their pets or children are in danger of Interstate traffic.
Figure 15 - Deceleration Lane in Willington, CT (Photo by N. Bosonetto)
Figure 16 - Dangerous Opening Between Parking Lot and Interstate
Handicap accessibility is a special issue that since 1995 must be considered in the de-sign of facilities according to the Americans with Disabilities Act. Solutions that are not optimal can give unacceptable safety especially to people with visual or mobility chal-lenges. Issues such as restrooms, doors, ramps and parking spaces should consider the

66
necessity of elderly and disabled travelers. The facilities should also be safe for children even though one can assume that younger children have adult supervision at all times.
Traffic safety generally concerns vehicles pulling out of parking spaces and hitting each other or, sometimes, pedestrians. Adequate visibility and the installation of better vehicle mirrors could reduce this problem. Truck parking spaces should be pull through diagonal so that trucks do not have to make difficult maneuvers. This should decrease the likelihood of collisions.
8.2 Scenic Design
Figure 17 - Scenic-Design Illustration
“Preservation of existing land forms and vegetation was a critical factor in the development of this site. The rest area building, picnic shelters, storage building, and scenic overlook are partially earth-sheltered and terraced into the rolling ter-rain providing a comfortable prairie image. In addition, a 1.3 ha (3.3 acre) wet-land was created on-site as a visual element providing an opportunity to view wildlife and providing a buffer between the rest area activities and surrounding agricultural fields. “ (http://www.fhwa.dot.gov/eihd/hayward.htm)
It is important to incorporate the natural space, especially since people have been looking at the Interstate for some time. People may want to get out of their vehicles and enjoy a little bit of nature. Sometimes people prefer parking areas that have parks and plenty of trees. Visibility should be of high concern in these areas. Historic landmarks can also be integrated into the design to provide an interesting attraction.
A special mention of landscaping is warranted. Many people stop at rest areas and smoke. During the summer season mulching and shrubbery can dry up and become a hazardous fire problem. Ashtrays should be provided (separate from trashcans) and the grounds should at times be watered to downgrade the fire hazard. The need for such measures is smaller in New England than in most other regions, but may still be a con-cern on dry summers.

67
8.3 Wastewater Management & Water Conservation Wastewater management is an important facet of rest area design, maintenance and
operations. As shown by the survey results, 56.7% of rest-area visitors stop primarily to use the restroom. During peak hours of operation, over a thousand flushes per hour and presumably over a thousand washings of hands can occur. For toilets using 1 gal/flush, the volume of water is 1000 gal/peak hour. A rest area’s wastewater management system must, therefore, be designed to be able to handle this heavy use and at the same time be efficient in water consumption.
Wastewater design falls into two areas: onsite or offsite management. Offsite man-agement refers to rest areas that are connected to municipal water and sewer service. On-site management refers to any facility that retains and processes wastewater using a sep-tic, composting, or biological methods.
A rest area’s wastewater design is sometimes a financial decision but for rural areas there is typically no access to municipal facilities. However, rest areas that are close to urban or suburban areas can access municipal sewer with construction costs consisting of pipes to the water and sewage mains. A pump might also be necessary if the connection requires it (is upgrade from the site). The operational costs consist of paying the bill for water and sewage. Maintenance costs are associated primarily to plumbing. Onsite wastewater management is financially a better alternative for remote sites where no sew-age exists within a couple of miles or at sites where the local treatment plant does not have excess capacity. Costs associated with onsite systems include the purchasing and installation of equipment, any electric utility bill associated with its operation, purchasing of additive components or chemicals, wages for personnel needed for its operation and the cost to have the system pumped out if needed.
These various systems have advantages and disadvantages when considering costs and water use, but it is also important to consider the public’s acceptance of each system. People might be confused easily by restroom facilities that have automated or confusing controls. Some people might also object to or prefer ecological alternatives to the tradi-tional restroom systems. Since restrooms are the most used service at rest areas, it is therefore imperative to choose the right system. The following discussion highlights sev-eral alternatives and their New England experiences.
8.3.1 Compressed Air Toilets
In Hampden, Maine, there are welcome centers (called Visitor Information Centers) in both the northbound and southbound lanes of I-95. The southbound center’s water supply was contaminated by salt (from road maintenance) and a second well was drilled. The contaminated water is still used to flush toilets, with the fresh water from the new well used as the potable supply. On the northbound side, the necessity for extra water soon arose due to the large number of tourists headed for Acadia National Park and other Maine destinations. Instead of drilling an extra well, air compressors operating at 60 psi where installed to aid in the flushing of the toilets.
Maintenance records where obtained from these welcome centers for the months of March and August of 2000. The maintenance records keep track of the amount of water and electric power used by the facilities as well as the number of visitors stopping at each facility. Water use is reported in gallons and in the case of the southbound side, the two well readings where added up for the total water used. Electric use is reported in kilo-

68
watt-hours and is used for the lighting, the northbound compressors, as well as displays and computers. Both facilities use automatic door counters that are triggered every time someone moves through them. These counts are then divided by 2 (entry and exit) but do not account for personnel entering and leaving. The electric meter, water meter and peo-ple counts are for this site taken continuously with readings twice a day at 6 a.m. and 6 p.m.
From the following charts, a comparison can be made between the two sides, one us-ing only water and the other using compressed air, which shows the trade off between electric power and water use. Please note that the dates correspond to different months, so the peaks seen correspond to weekends which fall on different dates for each month.
Figure 18 shows that August is a much busier time of the year than March. The wel-
come centers see about twice the number of weekday visitors in August compared to March, and almost thrice the weekend volume. All numbers are from the 2000 season.

69
Figure 18 - Hampden, ME visitors
Next, the total amount of water used by these facilities was examined.
Figure 19 shows the total daily water used by the facilities in gallons. It is seen that
the southbound side uses an average of 3339 gallons of water a day during the summer month and 1133 gallons per day during March. In comparison, the northbound side uses 1419 gal/day in August and 512 in March. It is apparent that the use of compressors is more than halving (1/2) water use.

70
Figure 19 - Hampden, ME Total Water Use
Another method of examining water consumption is to study the ratio of water use per visitor using the facility, shown in Figure 20. People using the compressed air rest-rooms use 1.12 to 1.36 gallons per visit, with the higher water use during the colder pe-riod. In comparison, people using the regular toilets during the same time use 2.92 to 3.01 gallons per visit. The savings quickly add up when tens of thousands of people visit these sites yearly.
Of course, the economic savings from reduced water consumption (by using com-pressors) is to some extent canceled out by a higher cost of electricity. Figure 21 shows the electric power used by the facilities. Here it is seen that the northbound site uses more power. On average, the northbound uses 68 more kW-hours in March and 52 more kW-hours per day in August. If a gallon of water is valued at only one cent, then an av-erage (annual) saving of 1000 gallons per day would equate $10 per day. The additional electric consumption would cancel out this savings at a price of around 20 cents per kWh. The household-consumer cost of electricity in the Hampden area may soon be approach-ing that. However, it may be far from possible to produce water (including sewer treat-ment) at the price assumed above, and if water is not available but electricity is, then the cost of water vs. electricity is irrelevant.
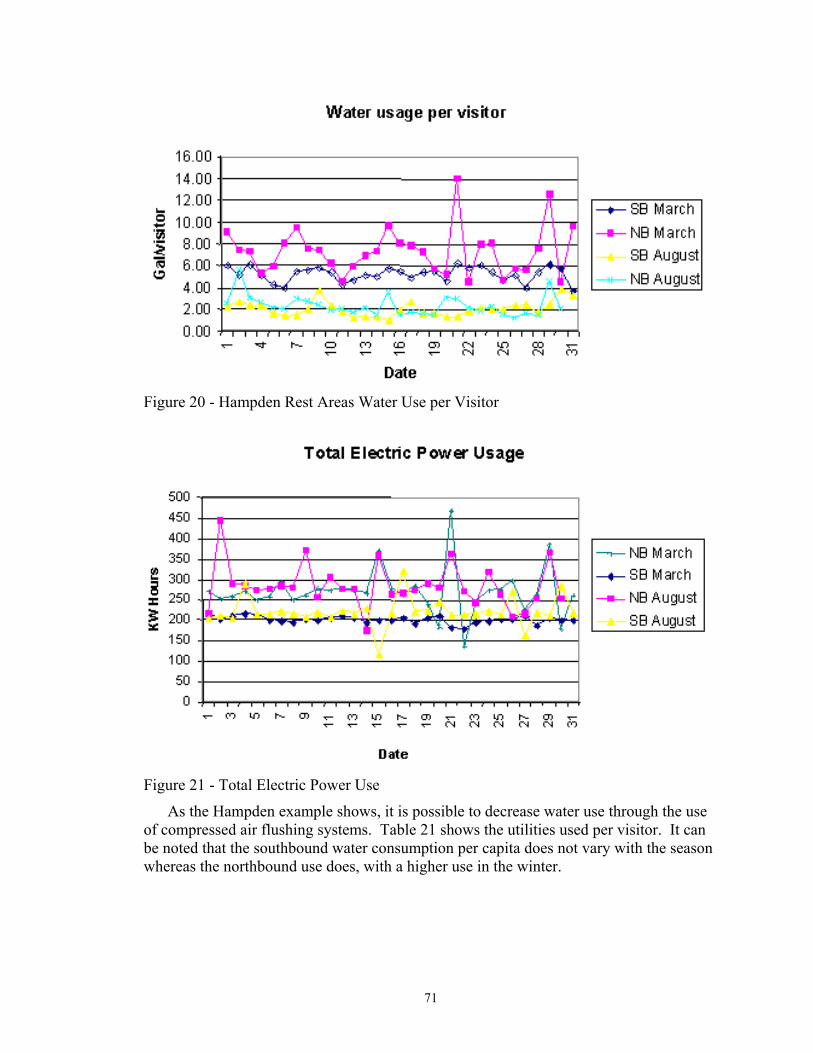
71
Figure 20 - Hampden Rest Areas Water Use per Visitor
Figure 21 - Total Electric Power Use
As the Hampden example shows, it is possible to decrease water use through the use of compressed air flushing systems. Table 21 shows the utilities used per visitor. It can be noted that the southbound water consumption per capita does not vary with the season whereas the northbound use does, with a higher use in the winter.

72
Table 21 - Compressed Air Flushing System
Summer (August)
Info
rmat
ion
kW /d
ay
Info
rmat
ion
kW /v
isito
r
Serv
ice
kW /V
isito
r
Serv
ice
Avg
. kW
/day
Gal
lons
/v
isito
r
Avg
Gal
/Day
NB Compressed Air System
111 0.09 0.13 163 1.13 1419
SB Water Only System
79 0.07 0.12 142 2.87 3339
Winter (March) NB Compressed
Air System 96 0.25 0.45 173 1.34 513
SB Water Only System
68 0.17 0.34 133 2.88 1133
The complete onsite waste management system consists of 90 concrete aerobic tanks
and a dispersion or effluent leach field. In this system, the solids must be removed even-tually and disposed at an EPA-approved slug dumping facility.
8.3.2 Effluent and Gray-Water Recycling
A living system is another innovative way of conserving water at rest areas, while at the same time helping to reduce wastewater generated. This method reduces toilet flush-ing water consumption by recycling effluent (from concrete tank in septic system) or gray water (water from wash basins). The water is cleaned to a hygienic state by using a vari-ety of filters, plants, animals and microbes. This “Living System” generates water that is clean enough to flush toilets or be irrigated (dispersed into the ground) but not clean enough to drink or wash hands in.
Effluent consists of water, urine and particulates of solid waste while gray water re-sults from people washing their hands or objects in a sink. Effluent requires a much more complicated process with both anaerobic and aerobic reactions as well as chlorine. Gray water is simple to clean since it is mostly water, dirt and soap. Gray water only needs a small filter and aerobic chamber. Recycling wastewater for use in flushing reduces the amount of freshwater used and reduces the strain on septic systems.
A living system (see Figure 22) was installed in the now abandoned welcome center in Guilford, Vermont. The living system pictured here is currently in storage. Living Technologies manufactured the system©.

73
Figure 22 - Biological Wastewater System (Farrell, Van der Hoven & Olsen 2000)
This system was installed because the welcome center’s leach field had failed due to overuse and age. The Vermont Agency of Transportation decided to install the Living System because it was the least expensive alternative, it could easily be moved to other sites, it was quick to install, and it provided an innovative solution.
The system shown was designed to treat wastewater from up to 4,300 visitors per day. It consisted of several reactors containing plants, insects, fish, worms, snails and other biological members. The reactors where made of polyethylene tanks housed in a 168 me-ter2 (1,800 ft2) greenhouse. There are a total of six reactors (or ecologies) that form the system. The actual use averaged 23,000 liters (6,000 gals) per day and peaks of 3,785 liters (1,000 gal) per hour. The system, designed specifically for the rest area use, cost $250,000; it would have cost $1,000,000 to connect to a municipal treatment facility (Farrell, Vand der Hoven & Olsen 2000).
This particular greenhouse wastewater treatment plant has won several environmental and design awards and was designed by Dr. John Todd. The process seeks to use natural processes to speed up the natural ecological way of cleaning water. A typical Living Ma-chine® treats wastewater to advanced or tertiary standards as listed in Table 22 (http://www.livingtechnologies.com/htm/machine.htm).
Table 22 - Living System Wastewater Standards
17 BOD: Biochemical oxygen demand - measure of how much organic matter there is. 18 TSS: Total suspended solid - measure of the turbidity of water.
Average BOD17 <10 mg/L
Average TSS18 <10 mg/L
Total Nitrogen <5 mg/L
Oil and Grease <1 mg/L

74
Maintenance costs include an operator who can keep the plants alive and monitor the process frequently to ensure acceptable levels. The training is not too complicated and one person can maintain more than one site. However, it took some ‘tweaking’ until the system in Guilford worked ‘perfectly’ at its design level. This system was installed as a special arrangement between the Agency of Natural Resources and the Department of Buildings and General Services which has oversight of the Welcome & Visitor Center facilities. The system that was used in Guilford, VT may be reinstalled in Sharon, VT at a rest area along I-89 that currently has a septic system with a leach field that is pushed above capacity. It would be ‘exhibited’ under its own greenhouse dome so that travelers can see it in operation. Also, high school and college classes are expected to visit the site to learn about such systems. Another system will be installed about 20 miles away from Sharon. The installation cost of this second system is estimated at $300,000. Connecting the rest area to the sewer system would have been a multi-million dollar investment and the Living System made economical sense. In other words, the ‘green’ choice would not be a political consideration. It also makes environmental sense. The ‘output’ is 90% less than from a traditional septic tank system. The maintenance costs are probably a bit higher than for alternative systems, but the difference is not great. There is an ‘external’ inspection cost of $6,000 per year per site for monitoring by Department of Environ-mental Protection personnel.19
One negative with the system is that all the water used at the facility is non-potable. There were/will be signs posted on mirrors over sinks warning folks not to put any of the water in their mouths. This is “not exactly great public relations or perception for a state trying to sell itself as a wholesome, healthy and pristine place to visit!”20
8.3.3 Composting System
The ultimate way to conserve water when flushing toilets is not to use any water at all. This is possible when using a composting system. A composting system consists of a chamber where solid waste and urine are combined with a bulking agent and allowed to compost. If used in extremely cold weather, the compost pile also needs a heater to keep it warm. Many rest areas throughout the world and New England use composting sys-tems. One example in New England is the Chelmsford, Massachusetts, rest area that had a composting system to deal with its sewage needs until it was recently connected to the municipal system. The reason they abandoned the system was that they built another rest area on the other side of the highway, and when they put sewer lines to that facility, they decided to extend the sewer to the old rest area as well. Also, the old rest area was built with only about 10 truck parking spaces and about 50 car parking spaces and was only to be open between 8:00 a.m. and 5:00 p.m. It was supposed to be a small rest area with limited operations; but it quickly became a very busy spot and hours of operations were extended, more staff hired, etc. The visitor volume was not expected to be as high as it
19 Information provided by Mr. Dick Foster, Director of Welcome and Information Centers at (802) 828-
3648 by telephone on June 21, 2001, (email: [email protected].) Mr. Foster reports not to the Highway Agency but to two commissioners: one is head of Dept. of Buildings and General Services and the other is head of the Department of Tourism and Marketing.
20 E-mail information from Karen Soghurst, June 4, 2001 (e-mail [email protected]).

75
became and the system can only compost a certain amount. The reason this site had loop counters was that the Massachusetts Highway Department kept a count of cars and, on that basis, sent out a truck to collect the gray water. The maintenance issues became a concern with the higher volume. However, the manager of the rest area (Cheril Malone) liked the old system and was very proud of it; she also says that the new construction to install the pipe has caused major disruptions in service. The rest area users (based on surveys and comment books) were very divided over it; they either liked it very much or hated it.
The Chelmsford composting system shown in Figure 23 quite simply uses wood chips as the bulking agent and gray water is taken away from the facility to be dispersed else-where. Dispersion cannot be done on site due to the lack of space.
In Massachusetts, there are similar composting facilities as the one in Chelmsford still in user at the Maria Miles rest are at Salisbury and at Lancaster where the facility has been in operation since 1997 with solid removals only once a year.
According to CLIVUS, the system saves 10,000 gallons of water on peak days. The gray water pictured above comes directly from the washing of hands in the restroom and a service sink in the storage room. This water is relatively clean, consisting of water, dirt and soap. In Chelmsford, a tanker truck picked up the water and released it off site, al-though a simple living system could have cleaned the water and disposed it through the ground. Although trucking the gray water adds to the overall costs, it is very cheap to maintain.
8.3.4 Chemical Toilets
Chemical toilets (commonly known as portable toilets) are sometimes installed at rest areas to meet excess demand, facilitate cleaning, or provide restrooms where there are no permanent facilities. From observations and interviews few people like using portable restrooms. In this project, a line of ten women were observed waiting for a restroom to be cleaned, with a sign suggesting the use of the portable restroom, but not one of them would do that. Among many comments given was heard, “I would rather wait.”

76
Figure 23 - Composting System (Photos by N. Bosonetto)
• The urinals do not have any water pipes or fixtures because no water is used.
• All human waste falls directly into the composting facility that uses wood chips.
• A small amount of water is used to clean the pipes (one bucket of hot water daily).
• Water from the other uses such as fau-cets and sinks is collected in gray-water tanks.
• The system was built by Clivus, who have also used these systems at other rest areas including some in Sweden.
• The composters convert the human waste into compost, water vapor and CO2. The wood chips are mixed with bacteria to help out the composting process. Special toilet paper is also used.
• A fan is used to pull air down into the composter through the toilets
• Liquid waste is pumped in 1000-gallon septic tanks. Solid compost products are solidified for a minimum of two years in parallel tanks, with removal of solids roughly twice per year. The whole sys-tem uses about 2 dollars per month of electricity.

77
8.3.5 Automated Restroom Fixtures
Flushing devices consist of the hardware (piping, valves, etc.) that allow the restroom user to flush the toilet. The traditional manner allows the user to activate the flush using a manual handle. More and more Americans consider hygiene to be important and the restroom industry has moved towards automatic fixtures. Also, some people do not turn taps back off wasting water if there is no automatic shut off. The automatic fixtures typi-cally use infrared to detect movement and automatically flush when a person moves away from the sensor. The same devices are used in faucets to activate when hands are close by. This system is also used in hand dryers.
Although these systems are widespread, they are by no means perfect. In fact, the Willington, Connecticut, rest area switched back to the traditional fixtures. Some of the problems with the automatic sensors are that they:
• Have high maintenance costs. • Easily can be destroyed by vandalism. • Do not function during power failures. • Can cause a messy situation if they fail. • Are not triggered by people in dark clothing. • Start flushing when people are still seated on the toilet.
A simple method to provide hands-free restroom fixtures without the expense and uncertainty of infrared devices is to use foot pedals.
8.3.6 Wastewater Conclusions
Providing rest areas with water and sewage facilities can be a challenge. Although electric power is usually available, sewage and water lines connected to municipal dis-tricts are not always possible due to costs and/or distances. Various methods are avail-able to reduce water consumption and wastewater. Although many solutions have been proposed, costs must also include maintenance costs for machinery, capital costs and the added labor and attendance required by these systems.
Since most people stop at rest areas to use the restroom facilities, it is important to conserve water resources by minimizing water per flush and reusing as much of this water as possible.
It must be noted that, especially in rural areas, power has a tendency to be cut during winter storms, so backup generators should be installed in areas where there is high use at such times, e.g., along routes serving ski areas.
8.4 Building Design The building should have the restrooms easily accessible to the public at all times,
and the facility ought to be open 24 hours a day. This includes allowing access even when the main building is closed. Some rest areas have included three restrooms to aid in the cleaning rotation and to handle extra capacity (buses). Another solution is to hire male and female custodians, who can enter restrooms and clean them without having to shut them down. Still, it may be difficult to clean a restroom that is open at the time, so the three-restroom concept is certainly preferable. Another idea can of course be to have

78
gender-neutral restrooms, which is common in Scandinavia. People then enter a private space with sink and everything directly from a corridor.
Building design should help reflect the character and traditions of the area, which help tourism. Wide windows providing panoramic views and a wide-open space can help the feeling of security and cleanliness.
9 MANAGEMENT ACCOUNTABILITY PROCESS (MAP) The Management Accountability Process (MAP) uses outcome based performance
measures for evaluating the effectiveness of maintenance programs. The Washington State Department of Transportation initiated MAP in 1996 as a tool in budget requests. This performance based budgeting makes the state agency accountable to increase effi-ciency and the effectiveness of their programs (MAP Manual, 1999).
9.1 Washington State’s MAP The MAP process, once implemented, allows the state transportation agency to
communicate with the public and the bureaucracy about how policy and budget decisions will affect program service delivery. First, a benchmark system is put in place, where Level of Service (A-F) are established as shown in Figure 24 (MAP Manual, 1999).
Then, using random sampling, the program is analyzed by comparing the amount of work done (or money put into it) against the level of service accomplished. Over time, once various levels of input and output have been collected, a statistical analysis will de-termine a Service Level Investment Choices Model. This model should be able to predict the investment threshold for achieving A through F service level scenarios.
The Maintenance Accountability Process itself is made up of 7 key steps. 1. Identify the customer’s expectations (surveys or comment cards). 2. Identify & prioritize activities needed to reach expectations. 3. Establish a desired service level. 4. Budget for desired service level. 5. Implement program to deliver desired service level. 6. Evaluate effectiveness of program. 7. Identify opportunities for improvements (and then start at step 1 again).
By following this process, it is possible to incrementally obtain and maintain a certain level of service for rest areas. Many states are now moving towards accountability proc-esses comparable to Washington’s Department of Transportation MAP. In Maine, for example, there are now guidelines that require goals to be set for maintenance projects. Once the goals are set, a system of measuring their successes are implemented and then evaluated. This system is very useful for rest areas, since they sometimes are said to give rise to consumer-satisfaction problems. The whole level of service and measurement guidelines can then be developed around the number of visitors served versus the amount of money spent. Due to the high visitor turnover rate at rest areas and the high volumes of traffic, the cost per visitor served at rest areas would be low.

79
Figure 24 - MAP Service Levels
9.2 Rest Area Maintenance and Service Levels When applied to rest areas, the level of service can be adopted from the satisfaction rat-ings of the survey. Here, each rest area is given a level of service based on their ratings of safety, cleanliness and comfort levels. A graphical representation is shown in Figure 25.

80
Level A Users rank Welcome Cen-ters such as this one very high. It provides large open spaces indoors, clean restrooms, and even a fire-place. It is staffed by friendly people. The facili-ties are brand new.
Level D These rest areas are like level C except they are not staffed. They sometimes do not have drinking water available.
Level B Users rank Visitor Centers such as this one next to highest. These facilities are less clean since they have rotating janitorial staff. The buildings are well maintained but show wear and tear.
Level E This area is rated very low by most customers. The parking lot is small, and the small facilities are heavily used. It is very close to I-95 and contains a gas station and a fast-food restaurant.
Level C Rest areas such as this one were originally built during the 60’s. There is some lit-ter and graffiti. The sewage system is aging. They have small lots, and the rest-rooms are dark and moist. They are well staffed.
Level F These facilities are falling apart. They are very dirty, have lots of graffiti, vandal-ism and loitering and are considered unsafe. They are unattended and have chemical toilets.
Figure 25 – Rest Area Service Levels

81
9.3 Suggested Management Accountability Process for New England States
9.3.1 Spacing of Rest Areas
Our study of truck drivers as well as motorists concluded that 55 miles between rest areas is a reasonable distance. This is in line with the results of a recent study from Mon-tana where most motorists reported that they would like to see rest areas every 50 miles (Blomquist, D. and Carson J.L. 2002). However, the University of Maine research of fatigue-related crashes (see Gårder and Alexander, 1995) shows that a one-hour drive for someone close to falling asleep is much too long. A rest area or other easily accessible location for a safe nap should always be reachable within half an hour’s drive, i.e., such an area should ideally be provided every 30 miles. The interview with drivers of passen-ger vehicles show that people on average think that distances are rather too long than too short between rest areas. More than half of those interviewed are of the opinion that if money needs to be saved at rest areas, it should not come from eliminating existing ones. However, many younger travelers feel that a number of rest areas could be eliminated and the savings by doing that be put into the remaining ones. It may partially be biologi-cal differences that explain why younger people see less of an issue with having to wait an hour rather than half that time between potential restroom stops.
9.3.2 Coordination Between States
A regional approach should be taken. Travelers in New England can go from Massa-chusetts through New Hampshire to Vermont or Maine in a matter of minutes. Obvi-ously, spacing and services need coordination. One of the obvious problems of rest areas is the lack of coordination at any level higher than the State transportation agency dis-tricts. Most of the uniting forces in rest-area development have been due to truck parking issues and by the tourist departments. A comprehensive plan, which includes account-ability procedures, should be drawn up for the rest-area system. Coordination is neces-sary to provide plenty of parking spaces and requested services. It is especially important to recognize where there are ‘holes’ in the system, e.g., with no rest area in reasonable distance. For economic reasons, it is equally important to identify ‘unnecessary’ rest ar-eas.
9.3.3 General Recommendations
It is important to develop a system to maintain current infrastructure and to keep it running at a level which the travelers value. That standard may vary between different types of rest areas. For example, travelers expect tourist information, hotel reservation systems, etc., at Gateway rest areas but, typically, not in the middle of the state.
Locating police, State transportation maintenance facilities, etc., in connection with rest areas make travelers perceive them as safer. To keep track of users’ perception of safety is important. A rest area not used for resting is a fiscal irresponsible investment.
It is imperative that travelers are allowed to sleep at rest areas. Fatigue-related crashes cost our society huge amounts in pain and suffering since these crashes are more serious than any other crash causation. Today, especially truck drivers have difficulty finding areas where they legally can sleep. Currently (Fall 2000) there are time limits—and prohibition or strong discouragement of overnight parking—at rest areas in twelve

82
states. None of the New England states prohibit longer stops at rest areas but officers are instructed to “check up” on drivers to see if they have a medical reason for not being awake, or are just asleep. There should be areas within the parking lot where drivers are not woken up when stopped.
Design is also an important part of the rest area concept. This includes concerns re-garding drinking water and sewage systems. But transportation issues are obviously also central to a good design. Vehicle speeds should be maintained low in areas were there is pedestrian activity even if there is no enforcement. Parking spaces should be clearly marked. That typically requires yearly restriping. A good pavement quality is an issue which typically is not directly related to traffic safety—rather inversely related when it comes to travel lanes—but keeping a good pavement standard contributes to the feeling that the rest area is well looked after and therefore safe. Also, uneven pavements can lead to pedestrians tripping and falling down.
To keep a facility operating efficiently, it is important to keep track of its use. A maintenance program should include the collection of utility use, parking occupancy, visitor counts, traffic counts and overall customer satisfaction and comments. This is probably the most important part of a Management Accountability Process.
9.3.4 Maintenance Concerns
As stated above, in-depth interviews with travelers revealed that they do not think it is a good idea to space rest areas further away than today. They also feel that rest areas to-day sometimes are dirty and not well maintained. And people are of the opinion that rest area restrooms should be open 24 hours a day. And that new services should be added rather than existing services eliminated. On the other hand, people do not want to pay higher fuel taxes to support rest areas. There are few ways of accomplishing this. One way would be by financing the services with outside revenue, e.g., through commerciali-zation. People would then think they got the services for free. However, such commer-cialization would be feasible only in the more populated parts of the states. And, current federal legislation prohibits commercialization. Another alternative would be to offer today’s services at a lower cost. This could be accomplished either by making people work more efficiently within the current system or by letting private companies—paying lower wages than the state—take over maintenance. Substantial savings may not be likely through such reforms. Rather, prioritizing between current and future services must be considered. The in-depth interviews with travelers show that people value cleaner restrooms more than anything else. And maybe societal economic savings could be found in that area at the same time as the quality of cleanliness is improved. In Wis-consin, people with disabilities who may otherwise have limited employment opportuni-ties provide day-to-day maintenance of rest areas through Local Community Rehabilita-tion Programs. Such a policy could be brought to New England.
9.3.5 Suggested Priorities
It is important to make travelers feel comfortable with the rest areas where they travel. Foremost, it is a safety issue. A sleepy driver needs to feel like he can stop and nap almost immediately. It is therefore imperative that rest areas are open 24 hours a day, and that restroom facilities are open the entire time. But it is not only a safety issue, well maintained rest areas make the state/region look good. That is important not least

83
for tourism, which is an essential economic industry in several of the New England states. To keep rest areas safe and attractive, the priorities of maintenance should be:
- hourly cleaning of restrooms in the daytime, every 2-4 hours at night (preferably, there are at least three restrooms, so that both men and women always have facili-ties available to them)
- snow removal/sanding as needed to keep parking lot and paths safe - 2-3 times per day, cleaning up of other indoor facilities and the grounds near trash
cans, picnic areas, parking lot, and around restrooms - daily emptying and cleaning of trash receptacles, or more frequently if needed - daily cleaning of pet areas - daily, check indoor and outdoor lights, telephones and sign - daily, collect comment cards and make sure cards are available - weekly, thorough cleanup of entire grounds, mowing of grass - monthly, landscaping during season, trimming and planting as needed - sweeping of parking lots and paths as needed, - annual striping of parking lot - annual survey of users to assess maintenance quality - as needed, building maintenance/painting to keep facility in excellent condition - paving according to need, to keep facility in excellent condition. Welcome Centers and Tourist Information Centers may have even higher mainte-
nance needs than regular rest areas. Whether rest area maintenance is done by the State itself or by private entrepreneurs
is obviously less important than how it is done. However, quality control is a necessity no matter by which entity the work is done.
10 CONCLUSIONS AND RECOMMENDATIONS The objective of this research has been to determine rest area users’ opinions on ser-
vices and the spacing needed between facilities. The focus of this research has been to clarify which services are essential, highly appreciated, somewhat appreciated and which, if any, can be done away with. The primary tool used was a survey conducted at sites along New England Interstates and data collected from previously published works.
10.1 Conclusions The number one rated amenity among motorists were clean restrooms. Also, motor-
ists ranked hands-free restroom fixtures high, perhaps because they help in hygiene. However, it is also possible that motorists checked that box as an indication that they wanted access to restrooms with running water rather than hands-free fixtures since a not-hands-free alternative was not given on the survey form. One advantage with hands-free fixtures is that they switch off automatically, as long as they function properly. Foot con-trolled faucets and flushing systems may be more reliable than hand-free systems that use remote sensing, but such devices may not be possible to use because of difficulties using them by people with certain handicaps.
Truck drivers rated public telephones as the most essential feature of rest areas. Survey results show that tourist information and road information where the second
highest rated services by motorists and commercial drivers respectively. New technolo-

84
gies can help provide such information to rest areas, thereby increasing the service level offered.
From the surveys, it was concluded that rest-area users value picnic areas, pet areas and barbecue grills the least. Commercial services such as ATMs, fuel and hot food also ranked towards the bottom and middle of the list of preferences.
The studied service plazas ranked near the bottom of the list when it came to cleanli-ness and comfort. However, commercial services could obviously have higher comfort and cleanliness levels than some of the facilities studied here. Still, the results from this study indicates that commercialization of this type may not be desired by most people. Commercial services are available at many exits, so such services are typically available if they are desired. Though there are exceptions to this, especially in remote parts of the northern New England states. In conclusion, it appears as if rest areas and exit services are not substitutes for each other, but instead should complement each other in providing services for the Interstate traveler.
Without commercial services, rest area funding probably cannot come entirely from private enterprises. Quasi-public businesses like tourist departments and chambers of commerce are currently leasing many rest areas. They are willing to float some of the costs for rest-area operation and maintenance in exchange for the opportunity to reach the traveling public. Matching funds for rest areas can also come from the federal govern-ment. A separate, although smaller pot of money, is offered for ITS applications. Such recourses should be utilized since travelers rank tourist information and road information highly.
Users state that they often like rest areas to be a place to relax, stretch and use a clean restroom.
These conclusions seem comparative to those found by other researchers in published material.
10.2 Recommendations From the surveys, it was concluded that rest-area users value picnic areas, pet areas
and barbecue grills the least. However, since these services are inexpensive to provide, they could be kept on being offered. A grassy open space may also be important to mo-torists, even if only some people use it and therefore the overall demand isn’t high. Still, many more may appreciate the aesthetics of a well-kept green space.
Truck drivers rated public telephones as the most essential feature of rest areas. However, improvements in mobile phone technology and falling prices will probably mean that most people soon will have their own phones and that areas along all highways will be covered.
There is a limit to the amount of driving a person can accomplish without stopping. The monotony of the Interstate makes it necessary for people to stop to relax and rest. The confines of the vehicle also make it necessary for motorists to get out and stretch or walk. The limits of the human body make it necessary to stop for sleep, water, and rest-room breaks. And limits of the mind may make it a good idea to stop for information. Rest areas provide convenient places for people to do all these things. To provide for the mental relaxation and opportunities to stretch and walk, they should resemble parks. They should not look like gas stations and fast-food restaurants. During a long drive, motorists see exits, often commercialized by what we can refer to as car-culture busi-
85
nesses. To balance this, rest areas should provide a glimpse of the area’s scenery and its original local flavor. However, in more remote areas, people may be looking for fast-food restaurants and vehicle-oriented services. Also, urban dwellers are often not willing to pull off Interstates at exits unless they are well lit and developed right at the exit. That is typically not the case in the northern part of New England. Especially in Vermont, there is very little development allowed at exits. Many motorists feel unsafe to leave the Interstate at such exits. And if there is commercial development it is usually not open all night. And even when it is open, the number of fast-food restaurants and gas stations is so limited that people have to wait up to 25 minutes to get service. And many communi-ties do not allow more development close to the Interstate for aesthetic or environmental reasons (personal information from Ms. Karen Songhurst, March 19, 2001). All rest ar-eas should therefore not be formed from the same mold. Still, there are certain character-istics that should be met by all rest areas. To better serve the public, all rest areas should have the following:
• Sufficient parking for cars and trucks. • Employed staff. • Clean, ample restroom facilities. A higher level of service can be achieved through joint development. Attractions or
amenities that will let communities adopt rest areas may help in the fight of crime and lead to higher acceptance. Integration of other state facilities like tourism, Department of Transportation facilities and police may help solve funding, staffing, and security issues. Joint development means that it will not only seem but also be safer due to increased ac-tivity.
Perhaps one of the most obvious problems of rest areas is the lack of coordination at any level higher than the Department of Transportation districts. Most of the uniting forces in rest-area development have been due to truck parking issues and by the tourist departments. A comprehensive plan, which includes accountability procedures, should be drawn up for the rest-area system. Coordination is necessary to provide plenty of parking and places to pull over.
Design is also an important part of the rest area procedure. Using a good wastewater system that uses low amounts of water and produces low amounts of waste can decrease costs. However, to make a facility efficient, it is important to keep track of its use. A maintenance program should include the collection of utility use, parking occupancy, visitor counts, traffic counts and overall customer satisfaction and comments.
Irrespective of anything else done to make rest areas popular, the two overriding is-sues among the traveling public are safety and cleanliness. To keep rest areas safe and attractive, it is here proposed that the priorities of maintenance be:
- hourly cleaning of restrooms in the daytime, every 2-4 hours at night (preferably, there are at least three restrooms, so that both men and women always have facili-ties available to them)
- snow removal/sanding as needed to keep parking lot and paths safe - 2-3 times per day, cleaning up of other indoor facilities and the grounds near trash
cans, picnic areas, parking lot, and around restrooms - daily emptying and cleaning of trash receptacles, or more frequently if needed - daily cleaning of pet areas - daily, check indoor and outdoor lights, telephones and signs

86
- daily, collect comment cards and make sure cards are available - weekly, thorough cleanup of entire grounds, mowing of grass - monthly, landscaping during season, trimming and planting as needed - sweeping of parking lots and paths as needed, - annual striping of parking lot - annual survey of users to assess maintenance quality - as needed, building maintenance/painting to keep facility in excellent condition - paving according to need, to keep facility in excellent condition. Welcome Centers and Tourist Information Centers may have even higher mainte-
nance requirements than regular rest areas. Such areas only exist at the entry to a state or a region. But other well-maintained rest areas should be reached every 30 minutes or so along the Interstates throughout New England. The goal should be that the New England rest areas belong to the cleanest and safest in the nation. This is to be confirmed through surveys semi-annually or more frequently for at least a subset of all rest areas in each state.

87
11 REFERENCES AASHTO (1999). A Guide for Development of Rest Areas on Major Arterials and
Freeways—Draft. American Association of State Highway and Transportation Officials, Washington D.C.
Arizona Department of Transportation (2000). Freeway Management System
www.azfms.com: Web Based Traveler Information System. Belz, Darryl P.E. (1999). A Summary of Maine’s Rest Area Facilities. Maine Depart-
ment of Transportation Bureau of Planning, Research & Community Services, Augusta, ME.
Blomquist, D. and Carson J.L. (1999). “An Investigation of the Needs and Expectations
of Rest Area Users in Montana.” Transportation Research Board 79th Annual Meeting Preprint CD-ROM, National Research Council, Washington D.C.
Blomquist, D. and Carson J.L. (2002). “Investigatingf the Needs and Expectations of
Rest Area Users: A Critical Step in Long-Range Rest Area Planning,” the ITE Journal, July 2002, pp 44-48
Burris, Mark W. and Pietrzyk, Michael C. (1997). “Interactive Transportation Informa-
tion Stations.” Federal Highway Administration Website: http://www.itsdocs.fhwa.dot.gov/jpodocs/edlbrow/7801!.pdf
Byrne, Bernard F. (1991). “Usage of Three Rest Areas in Vermont.” Transportation Re-
search Record 1326, pp 6-10.Transportation Research Board, National Research Council, Washington D.C.
Connecticut DOT (2000). Truck Stop and Rest Area Parking Study Interim Report
Number 2 Draft. Goods Movement Planning Office of Intermodal Project Plan-ning, State of Connecticut Department of Transportation.
Davis, Robert E.L. (1997). “Commercial driver rest and Parking Requirements – Making
Space for Safety,” Transportation Research Record 1595, Transportation Re-search Board, National Research Council, Washington D.C.
Dornbusch, David M. (1996). “Feasibility of Financing public Information in Rest Area
Interactive kiosks through Private Advertising,” FHWA Website: http://www.itsdocs.fhwa.dot.gov/jpodocs/repts_te/2xs01!.pdf
FHWA (1996). Commercial Driver Rest & Parking Requirements: Making Space for
Safety Final Report. Federal Highway Administration, Washington D.C. FHWA (1999). Rest Area Forum: Summary of Proceedings Federal Highway Admini-
stration, Washington D.C.
88
FHWA (2000). “Meeting the Customer's Needs for Mobility and Safety During
Construction and Maintenance Operations,” Federal Highway Administration Website: http://www.its.fhwa.dot.gov/quality/HP-MS7.htm
Gårder, Per and Alexander, John. “Fatigue Related Accidents and Continuous Rumble
Strips.” Presented at the 74th Annual Meeting of TRB in January 1995. TRB Pre-print Number 950132, Washington, D.C.
Gårder, Per (1999). “Quantifying Roadside Rest Area Usage,” Proposal to NETC. Uni-
versity of Maine, Orono, ME. Gray-Fisher (1998). “One Extraordinary Barn,” Public Roads Vol. 62, No. 2, Septem-
ber/October 1998. Harper, Jeff. Connecticut DOT. Interview with the author. New Haven, CT, August
2000. ITS International (2001) “Drivers get travel information at pumps,” Volume 7, Issue 1,
page 8, January/February 2001 Krammes, Raymond A. FHWA Office of Safety Research and Development. Interview
with the author. Washington, D.C., March 1999. Kress, Edward N. and Dornbusch, David M. (1991). “Commercialization of Rest Areas
in California” Transportation Research Record 1326, pp 1-5, Transportation Re-search Board, National Research Council, Washington D.C.
Levy, John M. (2000). Contemporary Urban Planning, 5th Edition. Upper Saddle River,
NJ, Prentice Hall. MassHighway, (2000). Identification of Massachusetts’s Freight Issues and Priorities.
http://www.state.ma.us/mhd/publications/downloads/Freight.pdf. Minnesota DOT (1998). Commercial Truck Usage Nighttime Parking Demand Analysis.
Minnesota Safety Rest Area Programs Market Research: St. Paul, Mn. National Highway Traffic Safety Administration (1999). Traffic Safety Facts 1998: A
Compilation of Motor Vehicle Crash Data from the Fatality Analysis Reporting System and the General Estimates System. National Center for Statistics and Analysis, Washington D.C.
Peeta, S., Ramos, J. and Pasupathy, R. (1999). “Content of Variable Message Signs and
On-Line Driver Behavior.” Transportation Research Board 79th Annual Meeting Preprint CD-ROM. National Research Council, Washington D.C.

89
Stedman, Dick. Maine DOT Maintenance. Interview with the author. Augusta, ME: September 2000.
Taylor, William C and Sung, Nakmoon (1998). “A Study of Highway Rest Areas and
Fatigue Related Truck Crashes.” Transportation Research Board 79th Annual Meeting Preprint CD-ROM, National Research Council, Washington D.C.
Thornton, Coleen (1997). “User Acceptance Test Report—From the Independent Evalua-
tion of Georgia’s ATIS Kiosk System (TraveLink),” Federal Highway Admini-stration Website: http://www.itsdocs.fhwa.dot.gov/jpodocs/repts_te/78601!.pdf
Tyrrell, Timothy J. (1999). Rhode Island Travel and Tourism Research Report v.16, #1.
Office of Travel, Tourism and Recreation, Department of Resource Economics, University of Rhode Island.
Council, F., Dignes, D., Freund, D., Garder, P., Griffin, L., Griffith, M., Hickey, J.,
McCartt, A., Rogers, W., Viner, J., Watson, J., Willis, J., Woodle, C. (1997). “Use of Continuous Shoulder Rumble Strips” A Consensus Report by the Na-tional Sleep Foundation, Washington D.C.
Washington State Department of Transportation (1999). Maintenance Accountability
Process Manual. Field Operations Support Service Center Maintenance Office. Available at website: www.wsdot.wa.gov/fossc/maint/mgmi/mapmanual

90
11.1 LIST OF TABLES Table 1 - Traffic Safety Facts 1998.................................................................................................................9 Table 2 - Truck Parking Shortages................................................................................................................11 Table 3 - FHWA Recommended Options .....................................................................................................12 Table 4 – Massachusetts Freight Flow by Truck...........................................................................................19 Table 5 – New Hampshire Rest Area Use, Welcome Centers, etc. ...............................................................24 Table 6 – New Hampshire Rest Area Use, ‘All’ Locations...........................................................................24 Table 7 - Use of the Guilford Welcome Center.............................................................................................26 Table 8 - Rest Area Use, southbound Augusta, Maine..................................................................................27 Table 9 - Rest Area Use, northbound Augusta, Maine..................................................................................28 Table 10 - Proportion of Vehicles Stopping at Rest Areas, Columbus Day 2001.........................................31 Table 11 - Number of Vehicles Stopped at Rest Areas .................................................................................32 Table 12 - Proportion of Vehicles Stopping at Rest Areas, Thanksgiving Weekend 2001 ...........................35 Table 13 - Number of Vehicles Stopped at Rest Areas .................................................................................35 Table 14 Approximate maximum demand of parking..................................................................................38 Table 15 - Motorist Survey ...........................................................................................................................48 Table 16 - Commercial Driver Survey Results..............................................................................................49 Table 17 - Preferences Results ......................................................................................................................50 Table 18 - Rest Area Ratings ........................................................................................................................51 Table 19 - Preferred restroom stops—number of answers ............................................................................53 Table 20 - Preferred stops for naps................................................................................................................53 Table 21 - Compressed Air Flushing System................................................................................................71 Table 22 - Living System Wastewater Standards..........................................................................................72
11.2 LIST OF FIGURES Figure 1 Rest Area Types................................................................................................................................6 Figure 2 – More Rest Area Types ...................................................................................................................7 Figure 3 - Hazard Model of Rest Area Spacing for Nocturnal Truck Accidents (Taylor & Sung) ...............10 Figure 4 - Branford Rest Area (Photo by N. Bosonetto) ...............................................................................15 Figure 5 - Massachusetts I-91 Gift Shop Rest Area (photo by N. Bosonetto)...............................................17 Figure 6 - Percentage of Massachusetts Freight by Truck.............................................................................20 Figure 7 - Percentage of Maine Freight by Truck .........................................................................................20 Figure 8 - Percentage stopping at the Augusta, Maine rest area....................................................................30 Figure 9 - Commercial Driver Survey...........................................................................................................42 Figure 10 - Motorist Survey ..........................................................................................................................43 Figure 11 - Preferences..................................................................................................................................44Figure 12 - Map of Survey Sites and Responses .............................................Figure 13 - Interstate Service Map ............................................................................................................. ...466 6 6
..............................................46
Figure 14 - Arizona DOT Kiosk Screen Shot................................................................................................62 Figure 15 - Deceleration Lane in Willington, CT (Photo by N. Bosonetto)..................................................65 Figure 16 - Dangerous Opening Between Parking Lot and Interstate ...........................................................65 Figure 17 - Scenic-Design Illustration ..........................................................................................................66 Figure 18 - Hampden, ME visitors ................................................................................................................68 Figure 19 - Hampden, ME Total Water Use .................................................................................................69 Figure 20 - Hampden Rest Areas Water Use per Visitor ..............................................................................70 Figure 21 - Total Electric Power Use ............................................................................................................70 Figure 22 - Biological Wastewater System (Farrell, Van der Hoven & Olsen 2000) .................................72 Figure 23 - Composting System (Photos by N. Bosonetto)...........................................................................75 Figure 24 - MAP Service Levels ...................................................................................................................78 Figure 25 – Rest Area Service Levels ...........................................................................................................79

91
12 APPENDIX A—SURVEY RESULTS All the completed surveys were manually entered into a database using Microsoft™ Ac-cess© software. The database program then could easily create reports to show the in-formation in an ordered manner. The following information is given in the following ta-bles.
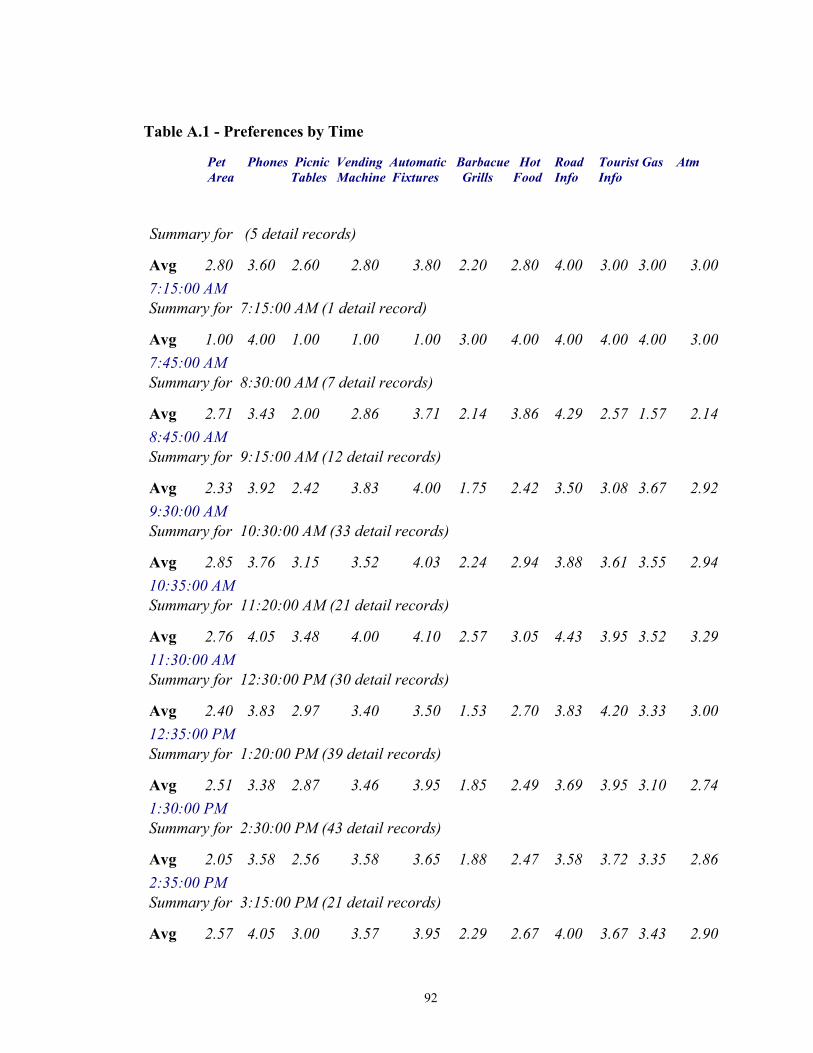
92
Table A.1 - Preferences by Time
Pet Phones Picnic Vending Automatic Barbacue Hot Road Tourist Gas Atm Area Tables Machine Fixtures Grills Food Info Info
Summary for (5 detail records)
Avg 2.80 3.60 2.60 2.80 3.80 2.20 2.80 4.00 3.00 3.00 3.00 7:15:00 AM Summary for 7:15:00 AM (1 detail record)
Avg 1.00 4.00 1.00 1.00 1.00 3.00 4.00 4.00 4.00 4.00 3.00 7:45:00 AM Summary for 8:30:00 AM (7 detail records)
Avg 2.71 3.43 2.00 2.86 3.71 2.14 3.86 4.29 2.57 1.57 2.14 8:45:00 AM Summary for 9:15:00 AM (12 detail records)
Avg 2.33 3.92 2.42 3.83 4.00 1.75 2.42 3.50 3.08 3.67 2.92 9:30:00 AM Summary for 10:30:00 AM (33 detail records)
Avg 2.85 3.76 3.15 3.52 4.03 2.24 2.94 3.88 3.61 3.55 2.94 10:35:00 AM Summary for 11:20:00 AM (21 detail records)
Avg 2.76 4.05 3.48 4.00 4.10 2.57 3.05 4.43 3.95 3.52 3.29 11:30:00 AM Summary for 12:30:00 PM (30 detail records)
Avg 2.40 3.83 2.97 3.40 3.50 1.53 2.70 3.83 4.20 3.33 3.00 12:35:00 PM Summary for 1:20:00 PM (39 detail records)
Avg 2.51 3.38 2.87 3.46 3.95 1.85 2.49 3.69 3.95 3.10 2.74 1:30:00 PM Summary for 2:30:00 PM (43 detail records)
Avg 2.05 3.58 2.56 3.58 3.65 1.88 2.47 3.58 3.72 3.35 2.86 2:35:00 PM Summary for 3:15:00 PM (21 detail records)
Avg 2.57 4.05 3.00 3.57 3.95 2.29 2.67 4.00 3.67 3.43 2.90

93
Table A.1. Preferences by Time (cont.) Pet Phones Picnic Vending Automatic Barbacue Hot Road Tourist Gas Atm Area Tables Machine Fixtures Grills Food Info Info
3:30:00 PM Summary for 4:30:00 PM (16 detail records)
Avg 2.38 3.25 2.31 3.63 4.13 1.31 2.75 3.13 3.31 2.88 2.19 4:37:00 PM Summary for 5:15:00 PM (5 detail records)
Avg 1.60 4.00 2.60 3.20 2.60 1.40 1.40 2.60 2.60 2.20 1.80

95
Table A.2 - Motorist Survey by User Group
Purpose of Trip
Number Number Elderly/ Children Pets Hours Importance Spacing Males Females disabled from last stop
Business Car Summary for Car (36 detail records) Avg 0.83 0.39 0.00 0.00 0.06 1.33 4.39 40.53 Min 0.00 0.00 0.00 0.00 0.00 0.00 2.00 0.00 Max 1.00 3.00 0.00 0.00 1.00 4.00 5.00 180.00 Mini Van Summary for Mini Van (1 detail record) Avg 2.00 0.00 1.00 0.00 0.00 0.00 5.00 0.00 Min 2.00 0.00 1.00 0.00 0.00 0.00 5.00 0.00 Max 2.00 0.00 1.00 0.00 0.00 0.00 5.00 0.00 Pick up Summary for Pick up (7 detail records) Avg 1.14 0.14 0.00 0.00 0.00 1.43 4.43 43.57 Min 0.00 0.00 0.00 0.00 0.00 0.00 3.00 0.00 Max 2.00 1.00 0.00 0.00 0.00 4.00 5.00 120.00 RV Summary for RV (2 detail records) Avg 0.50 1.00 0.00 0.00 0.50 0.50 5.00 47.50 Min 0.00 1.00 0.00 0.00 0.00 0.00 5.00 35.00 Max 1.00 1.00 0.00 0.00 1.00 1.00 5.00 60.00
SUV Summary for SUV (8 detail records) Avg 1.25 0.50 0.25 0.13 0.00 1.50 4.63 37.50 Min 1.00 0.00 0.00 0.00 0.00 1.00 2.00 0.00 Max 2.00 2.00 2.00 1.00 0.00 2.00 5.00 120.0 Summary for Business (54 detail records) Avg 0.94 0.39 0.06 0.02 0.06 1.31 4.46 39.98 Min 0.00 0.00 0.00 0.00 0.00 0.00 2.00 0.00 Max 2.00 3.00 2.00 1.00 1.00 4.00 5.00 180.00

96
Table A.2. Motorist Survey by User Group (cont.)
Purpose of Trip
Number Number Elderly/ Children Pets Hours Importance Spacing Males Females disabled from last stop Commute Car Summary for Car (5 detail records) Avg 1.20 0.20 0.00 0.00 0.00 2.40 4.40 55.00 Min 1.00 0.00 0.00 0.00 0.00 2.00 3.00 30.00 Max 2.00 1.00 0.00 0.00 0.00 3.00 5.00 75.00 Pick up Summary for Pick up (1 detail record) Avg 1.00 0.00 0.00 0.00 0.00 0.00 4.00 0.00 Min 1.00 0.00 0.00 0.00 0.00 0.00 4.00 0.00 Max 1.00 0.00 0.00 0.00 0.00 0.00 4.00 0.00 Summary for Commute (6 detail records) Avg 1.17 0.17 0.00 0.00 0.00 2.00 4.33 45.83 Min 1.00 0.00 0.00 0.00 0.00 0.00 3.00 0.00 Max 2.00 1.00 0.00 0.00 0.00 3.00 5.00 75.00 Family Visit Car Summary for Car (30 detail records) Avg 0.97 1.03 0.10 0.43 0.17 1.73 4.50 66.67 Min 0.00 0.00 0.00 0.00 0.00 0.00 3.00 0.00 Max 3.00 3.00 1.00 6.00 2.00 4.00 5.00 200.00 Mini Van Summary for Mini Van (5 detail records) Avg 1.00 2.60 0.00 0.40 0.40 2.20 4.20 102.00 Min 1.00 1.00 0.00 0.00 0.00 1.00 3.00 0.00 Max 1.00 6.00 0.00 2.00 2.00 3.00 5.00 240.00 Pick up Summary for Pick up (2 detail records) Avg 1.00 0.50 0.00 0.00 0.00 2.00 5.00 2.50 Min 1.00 0.00 0.00 0.00 0.00 0.00 5.00 0.00 Max 1.00 1.00 0.00 0.00 0.00 4.00 5.00 5.00
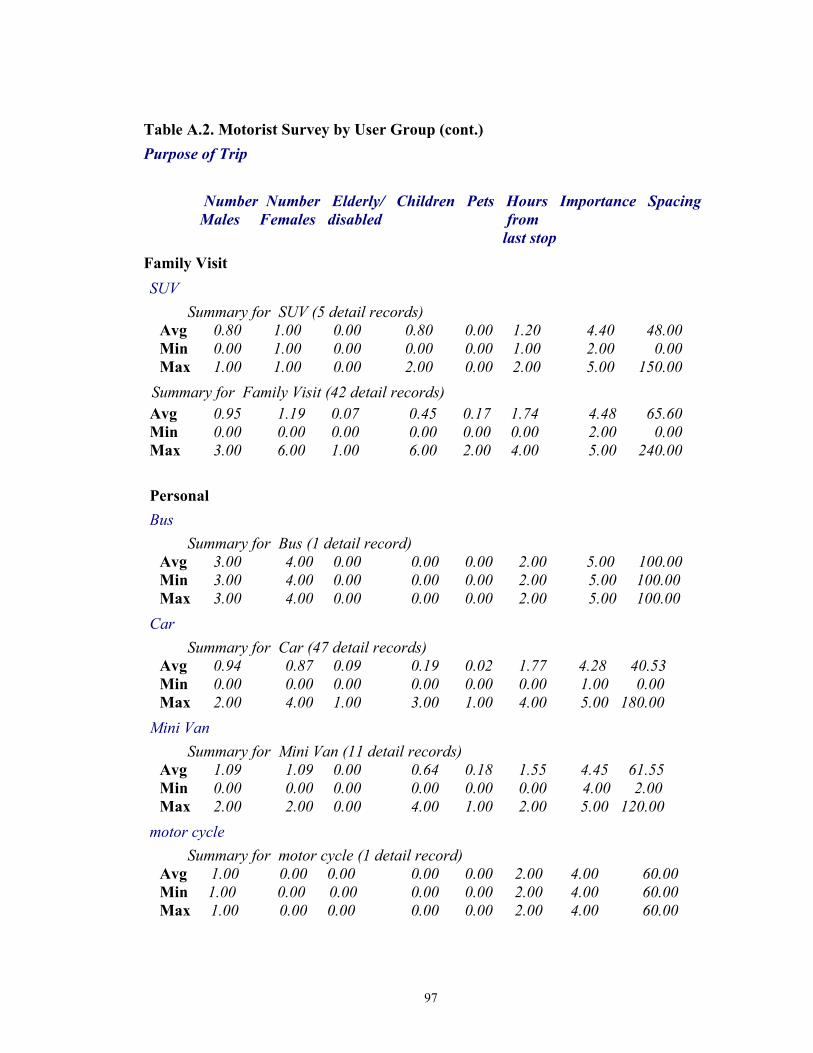
97
Table A.2. Motorist Survey by User Group (cont.) Purpose of Trip
Number Number Elderly/ Children Pets Hours Importance Spacing Males Females disabled from last stop Family Visit SUV Summary for SUV (5 detail records) Avg 0.80 1.00 0.00 0.80 0.00 1.20 4.40 48.00 Min 0.00 1.00 0.00 0.00 0.00 1.00 2.00 0.00 Max 1.00 1.00 0.00 2.00 0.00 2.00 5.00 150.00 Summary for Family Visit (42 detail records) Avg 0.95 1.19 0.07 0.45 0.17 1.74 4.48 65.60 Min 0.00 0.00 0.00 0.00 0.00 0.00 2.00 0.00 Max 3.00 6.00 1.00 6.00 2.00 4.00 5.00 240.00
Personal Bus Summary for Bus (1 detail record) Avg 3.00 4.00 0.00 0.00 0.00 2.00 5.00 100.00 Min 3.00 4.00 0.00 0.00 0.00 2.00 5.00 100.00 Max 3.00 4.00 0.00 0.00 0.00 2.00 5.00 100.00 Car Summary for Car (47 detail records) Avg 0.94 0.87 0.09 0.19 0.02 1.77 4.28 40.53 Min 0.00 0.00 0.00 0.00 0.00 0.00 1.00 0.00 Max 2.00 4.00 1.00 3.00 1.00 4.00 5.00 180.00 Mini Van Summary for Mini Van (11 detail records) Avg 1.09 1.09 0.00 0.64 0.18 1.55 4.45 61.55 Min 0.00 0.00 0.00 0.00 0.00 0.00 4.00 2.00 Max 2.00 2.00 0.00 4.00 1.00 2.00 5.00 120.00 motor cycle Summary for motor cycle (1 detail record) Avg 1.00 0.00 0.00 0.00 0.00 2.00 4.00 60.00 Min 1.00 0.00 0.00 0.00 0.00 2.00 4.00 60.00 Max 1.00 0.00 0.00 0.00 0.00 2.00 4.00 60.00

98
Table A.2. Motorist Survey by User Group (cont.) Purpose of Trip
Number Number Elderly/ Children Pets Hours Importance Spacing Males Females disabled from last stop
Personal Pick up
Summary for Pick up (4 detail records) Avg 1.50 0.75 0.00 0.25 0.00 1.75 4.75 36.25 Min 1.00 0.00 0.00 0.00 0.00 1.00 4.00 0.00 Max 2.00 2.00 0.00 1.00 0.00 2.00 5.00 100.00 SUV Summary for SUV (1 detail record) Avg 1.00 1.00 0.00 0.00 0.00 1.00 5.00 5.00 Min 1.00 1.00 0.00 0.00 0.00 1.00 5.00 5.00 Max 1.00 1.00 0.00 0.00 0.00 1.00 5.00 5.00 Summary for Personal (65 detail records) Avg 1.03 0.94 0.06 0.26 0.05 1.72 4.35 44.49 Min 0.00 0.00 0.00 0.00 0.00 0.00 1.00 0.00 Max 3.00 4.00 1.00 4.00 1.00 4.00 5.00 180.00 Recreation/Vacation Bus Summary for Bus (1 detail record) Avg 20.00 40.00 0.00 0.00 0.00 4.00 5.00 180.00 Min 20.00 40.00 0.00 0.00 0.00 4.00 5.00 180.00 Max 20.00 40.00 0.00 0.00 0.00 4.00 5.00 180.00 Car Summary for Car (61 detail records) Avg 1.10 1.02 0.08 0.23 0.02 1.66 4.34 53.43 Min 0.00 0.00 0.00 0.00 0.00 0.00 0.00 0.00 Max 5.00 3.00 2.00 2.00 1.00 4.00 5.00 150.00 Mini Van
Summary for Mini Van (11 detail records) Avg 1.55 1.27 0.09 1.18 0.18 1.82 4.73 50.09 Min 1.00 0.00 0.00 0.00 0.00 0.00 3.00 0.00 Max 3.00 3.00 1.00 4.00 1.00 6.00 5.00 100.00

99
Table A.2. Motorist Survey by User Group (cont.) Purpose of Trip
Number Number Elderly/ Children Pets Hours Importance Spacing Males Females disabled from last stop Recreation/Vacation motor cycle Summary for motor cycle (3 detail records) Avg 3.00 0.33 0.00 0.00 0.00 1.67 4.33 41.67 Min 1.00 0.00 0.00 0.00 0.00 1.00 4.00 0.00 Max 6.00 1.00 0.00 0.00 0.00 2.00 5.00 85.00 Pick up Summary for Pick up (7 detail records) Avg 1.14 0.86 0.00 0.00 0.29 1.29 4.86 39.29 Min 0.00 0.00 0.00 0.00 0.00 0.00 4.00 0.00 Max 3.00 1.00 0.00 0.00 1.00 2.00 5.00 80.00 RV Summary for RV (5 detail records) Avg 1.20 1.20 0.00 0.00 0.00 1.40 4.80 44.00 Min 1.00 1.00 0.00 0.00 0.00 0.00 4.00 25.00 Max 2.00 2.00 0.00 0.00 0.00 2.00 5.00 80.00 SUV Summary for SUV (15 detail records) Avg 1.33 1.40 0.47 0.67 0.13 1.47 4.47 47.07 Min 0.00 0.00 0.00 0.00 0.00 0.00 3.00 11.00 Max 4.00 6.00 5.00 3.00 1.00 3.00 5.00 80.00 areas
Summary for Recreation/Vacation (103 detail records) Avg 1.43 1.46 0.13 0.36 0.07 1.63 4.47 51.61 Min 0.00 0.00 0.00 0.00 0.00 0.00 0.00 0.00 Max 20.00 40.00 5.00 4.00 1.00 6.00 5.00 180.00

100
13 APPENDIX B – STATISTICAL ANALYSIS Vehicular traffic consists of large amounts of operators (people) coexisting and inter-
acting in a very limited environment (the roadway). The constant decisions a driver must make not only makes prediction of behavior difficult, but also tires the driver out. Traf-fic, being based on human limitations, can therefore be analyzed.
This project seeks to find a method of predicting the amounts of vehicles using rest areas located on Interstate highways. People who use rest areas usually do so when they need to separate themselves from the vehicle for physical reasons (stretch, restroom, eat, etc.) and not for mechanical reasons (there are no gasoline pumps at rest areas).
The ANOVA (ANalysis Of VAriance) model is used to study the relationship be-tween a response variable and one or more predictor variables. In this particular project, an observational study of vehicular traffic will be performed. Particularly, the ability of predictor variables to predict (with accuracy and precision) traffic behavior will be stud-ied.
Previously, a regression analysis was attempted on the same problem. This method (regression) was unable to provide information because certain temporal predictors (day, time, season) are qualitative, not quantitative. A regression model with indicator vari-ables for each factor level could also be used. With ANOVA, this problem is solved by allowing temporal predictors to be entered using the following factor levels. Time: Dawn (2AM-6AM) ......1 Morning (6AM-10AM) ...…2 Noon (10AM-2PM) ......3 Afternoon (2PM-6PM) .......4 Dusk (6PM-10PM) ......5 Night (10PM-2AM) ......6 Day: Monday - Sunday ......1 - 7
These factors are important in analyzing the traffic because they may help explain the type of traffic (day and time) and the conditions faced by the operators (time and traffic volume).
The before-mentioned predictor factors will describe the conditions for each number of automobile (and trucks) using the rest areas. Please see the attached data sheet. #vehicles using rest area = avg. # entering in time period (1-6)
Period 6 (over midnight) counts as being on the previous day; a convention that will also be used when applying results.
Traffic volume will not be included in the analysis since it is itself a function of time. By using it as a factor among the time classifiers will introduce error into the variables.
The data is entered for the first week of September 1999. The data has two factors with equal sample sizes and 42 treatments. This is a com-
plete factorial study, because all combinations of factorial levels are included. Some basic statistics of the data:

101
Means: USINGRA
N of cases 42 Minimum 5.000 Maximum 57.750
Mean 21.220 Standard Dev 13.349
The grand average mean is 21.22. From now on, Factor A denotes time, and Factor B denotes day.
The means A1 (u1*) = 17.07 A2 (u2*) = 26.44 A3 (u3*) = 35.82 A4 (u4*) = 21.03 A5 (u5*) = 14.93 A6 (u6*) = 11.68 B1 (U*1)= 10.71 B2 (U*2)= 28.58 B3 (U*3)= 31.8 B4 (U*4)= 28.00 B5 (U*5)= 27.5 B6 (U*6)= 15.42 B7 (U*7)= 8.96
From looking at these averages, one can tell that the peak days are in the middle of the week, and the peak hour is level 3 or the noontime. By subtracting from these factor level means the overall mean (u**), factor effects can be found. Factor effects for variable A (time by levels) Time: Dawn (2AM-6AM) ......1 ..........-4.15 Morning (6AM-10AM) .....2 ..........5.22 Noon (10AM-2PM) ......3 ...........14.6 Afternoon (2PM-6PM) .......4 ...........-0.19 Dusk (6PM-10PM) ......5 ..........-6.29 Night (10PM-2AM) ......6 .........-9.54 Check by addition (=0).......-0.35
The error is believed to come from rounding the means to two digits. Factor effects for variable B (day)

102
Monday 1 ........-10.51 2 ..........7.36 3 ..........10.61 4 ........... 6.78 5 ............6.28 6 ...........-5.80 Sunday 7 .......... -12.26 Check by addition (=0) ......2.46
Here, the error is larger, but so are the factor level means, meaning about same size error for both. It can conclusively be stated that there are both Factor A & B effects (both time and day matter). Since both factors vary from the grand mean by 10 to -10 points, it can be seen that the main effects are significant.
Next, it was checked how the two factors interact. If they do interact, it means that the two factors act in accordance to each other.
To find out if the factors interact, it was checked to see if the difference in two factor levels of A stay constant across all B factor levels, which would mean that the treatment mean curves will not be parallel.
Figure B.1 – Rest Area Use
0 1 2 3 4 5 6 7TIME
0
10
20
30
40
50
60
USI
NG
RA
7654321
DAY
Here, it can be seen that the factors do interact. There are no two parallel lines in the
whole plot, meaning that both time and day are important in determining the number of users of Rest Areas. It can also be seen from the plot that there are two groups of lines, one with low slope and one group with steep slope. The low slope corresponds to Mon-day, Saturday and Sunday, meaning that here the interactions between time and day are not as important as the main effect due to day. The second group corresponds to the

103
weekdays, Tuesday through Friday, with steep slope, which indicates that there is high interaction between day and time (they both matter in predicting use).
The Tukey test for additivity must be used here, since there is only one case per treatment combination.

104
14 APPENDIX C—GIS MAPPING PROGRAM The purpose of this project is to create a digital model of New England’s Interstate
Highway System. This model will serve as a catalogue of available services to the trav-eler, as well as a tool for network analysis.
The ARCVIEW GIS platform is ideal for this project for the following reasons: 1. It is widely available throughout state transportation agencies, and,
therefore, it is easily accessible. 2. This project will be able to be freely and legally distributed (as op-
posed to commercially available software). 3. A GIS is a convenient way of storing large amounts of different infor-
mation related to the highway system in a geographic interface. The map consists of three main components or themes. In GIS terms a map can be looked at with different information displayed on it (dif-
ferent VIEWS). Each View is made up of geographic features called THEMES. The Rest Area Catalog Map is made up of three (3) themes: Background map, interstate sys-tem, and services. Each theme has the 2 parts to it: the geographic representation and the data corresponding to it.
The Background Theme is simply a color political boundary map showing the New England states, Canada, and the ocean. The information contained in this theme is lim-ited to names. This theme was constructed using widely available political maps (ESRI) and a blue rectangle representing the ocean.
The Interstate System Theme consists of all the Interstates in New England. This theme was constructed using links. The links of the highway are the stretch of road from exit to exit. The data associated with this theme include the length of roadway section, speed limit, lanes, tolls, classifications (based on use and pavement), and the time it would take to travel the section at the posted speed limit. The data was acquired from the Federal Government’s Department of Transportation. The data and maps was acquired
14.1 Data Setup The information used came from four (4) main sources. The background consists of a geopolitical map of New England, bordering US states
and Canada. These coverages came from the standard ESRI samples (NAD83, decimal degrees). All other states and non-relevant countries were deleted from the themes using the editing tools in the attribute tables. The remaining New England states where color-coded using the Legend Editor. The Ocean theme is simply a blue polygon.
Massachusetts is the only New England state that has a GIS theme with rest areas lo-cations. An employee of the Planning Department of the MassHighway (DOT) for-warded the file to me. It contains every roadside rest area in Massachusetts located on roads ranging from interstates to rural routes. All MassGIS files (http://www.state.ma.us/mgis/massgis.htm) are in NAD83 meters, and have to then be converted (see Data Conversion section).
The line coverage that is the road network came from the US Department of Trans-portation. The USDOT’s Bureau of Transportation Statistics releases a National Trans-portation Atlas Database (NTAD), which contains every major road in the United States. It was acquired through their website (http://206.4.84.245/btsproducts/). This database

105
contains many point, polygon and line themes. They are all viewable using the included BTS Data Viewer, and can be translated into ARCVIEW shape files. (see www.bts.gov/gis/ntatlas/viewer.html). The particular line coverage used was NHPNV22 (NAD83, decimal degrees). This theme contained every single major route in the US. It had to be cleaned out using many queries/delete steps in the attribute table, until only the current 37 routes contained in Interstates.shp remained. Interstates theme contains a lot of information including #lanes, road classification, length and location for every road section. This theme was the basis for the route network created (see Creating Routes).
Information used to locate and describe exits and rest areas were compiled from many sources. A reference book entitled EXIT GUIDE (2000 edition, Interstate America). This book is found at large truck stops and is intended as a truck driver’s manual on where to find services. It lists all Interstates services available by mileage marker, it is not entirely comprehensive. Some exits were catalogued from road atlases found in most vehicles, they helped determine the number of exits and sometimes the distance between them. Rest area information from DOTs helped determine rest area locations and ser-vices. Internet sites that provide information and by other published exit guides available as advertisements with coupons supplemented all this. All the information was then en-tered into a spreadsheet, which became the route event themes (see Creating Route Events section).
14.2 Creating Routes The computer program had to be told that the line themes representing the highway
system were made up of many different routes. This was done by using ArcInfo to ma-nipulate the file information that all themes contain.
One method to produce bulk routes out of a network system is ARCROUTE. AR-CROUTE uses information in the AAT (arc attribute table) to group sections of a single network into many different routes. Since the AAT generally does not contain route in-formation, the cover’s RAT (route attribute table) file must be integrated with the AAT. Using JOINITEM command, the RAT and AAT are combined into a new AAT file, which now contains information giving each arc section a specific route number as well as a “miles” measurement unit. ARCROUTE uses these section measurements to cumu-latively add up a route’s length.
After ARCROUTE has created the new routes, they can be checked by using ROUT-ESTATS. Listing MEASURELENGTH as an option and then listing the ROUTESTATS file, one can determine if the route has been added up correctly.
14.3 Creating Route Events Once the highway system was made into a route, than all facilities along the highway
could be entered as events. First, the events table was created using a spreadsheet and saved in dbf format. A
spreadsheet is used since it is very easy to cut and paste all the information that is repeti-tive for rest areas and exits. States, route number and type are all repetitive.
After the network has been established, it is possible to insert the exit guide and the rest area database automatically. First of all, it should be noted that the route numbering system is stored as a string variable in the GIS map. This is important to note because the

106
route numbering in the databases must also be stored as string variables or else they won’t recognize each other. To insert the database into the GIS, follow these steps.
1. Add the database (.dbf format) into ArcView. 2. Return to the view window and select the Highway Network Theme. 3. Under the View menu choose Add Event Theme. 4. Click on the ruler icon, since the Mile Marker data will be used to insert
the exits and rest areas based on the distance along the routes. 5. The Route Theme refers to the Highway Network Theme, and the route
numbers corresponding to each route are stored in the Route field. 6. Select Points so that the exits and rest areas appear as points on the net-
work. 7. Under Table, choose the name of the table (database) imported. 8. The Event Field corresponds where the route numbers are stored. 9. The Location Field corresponds to where the mile marker data is stored. 10. After choosing all the appropriate information, click on OK and the new
theme containing all the highway services will appear.
Figure C.1 – Inserting Theme
Once the new theme is entered, its legend can be edited to show separate symbols for different types of services offered. To show more information, simple make the theme active and use the information tool (bottom tool row, far left) to click on the map. It is also possible to display pictures, movies, or any other digital information using the Hot-links function.
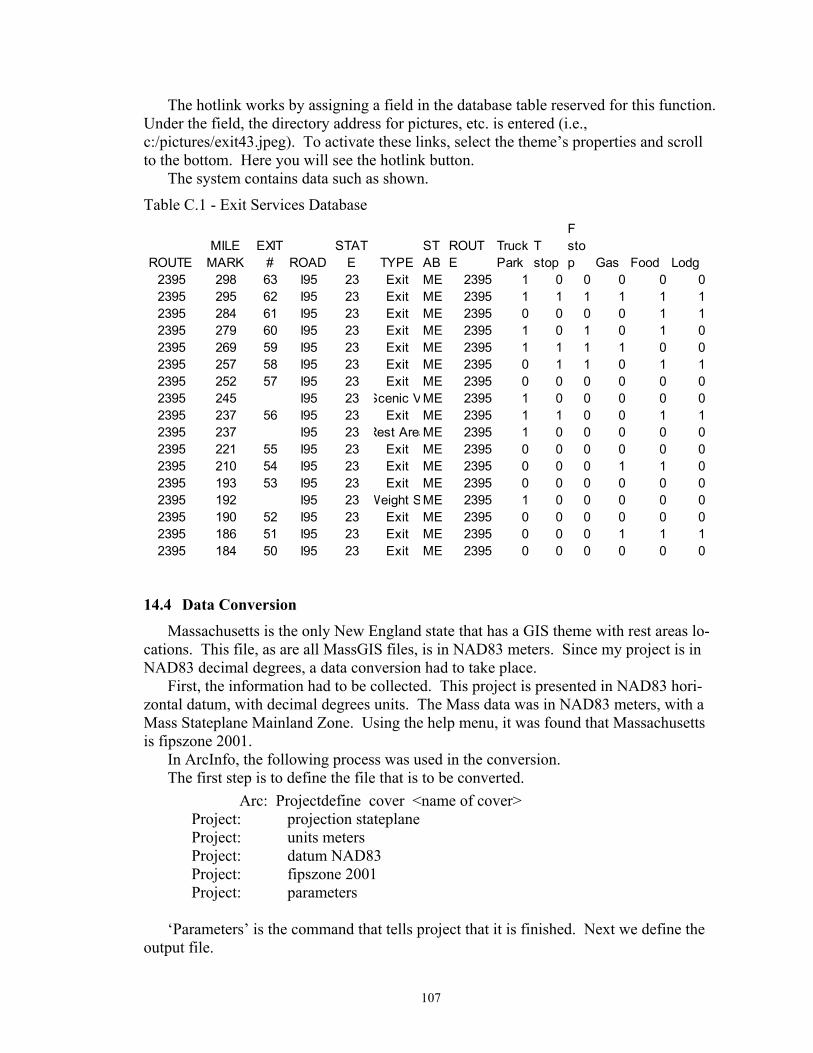
107
The hotlink works by assigning a field in the database table reserved for this function. Under the field, the directory address for pictures, etc. is entered (i.e., c:/pictures/exit43.jpeg). To activate these links, select the theme’s properties and scroll to the bottom. Here you will see the hotlink button.
The system contains data such as shown.
Table C.1 - Exit Services Database
ROUTEMILE
MARKEXIT
# ROADSTAT
E TYPESTAB
ROUTE
Truck Park
T stop
F stop Gas Food Lodg
2395 298 63 I95 23 Exit ME 2395 1 0 0 0 0 02395 295 62 I95 23 Exit ME 2395 1 1 1 1 1 12395 284 61 I95 23 Exit ME 2395 0 0 0 0 1 12395 279 60 I95 23 Exit ME 2395 1 0 1 0 1 02395 269 59 I95 23 Exit ME 2395 1 1 1 1 0 02395 257 58 I95 23 Exit ME 2395 0 1 1 0 1 12395 252 57 I95 23 Exit ME 2395 0 0 0 0 0 02395 245 I95 23 Scenic VME 2395 1 0 0 0 0 02395 237 56 I95 23 Exit ME 2395 1 1 0 0 1 12395 237 I95 23 Rest AreaME 2395 1 0 0 0 0 02395 221 55 I95 23 Exit ME 2395 0 0 0 0 0 02395 210 54 I95 23 Exit ME 2395 0 0 0 1 1 02395 193 53 I95 23 Exit ME 2395 0 0 0 0 0 02395 192 I95 23 Weight SME 2395 1 0 0 0 0 02395 190 52 I95 23 Exit ME 2395 0 0 0 0 0 02395 186 51 I95 23 Exit ME 2395 0 0 0 1 1 12395 184 50 I95 23 Exit ME 2395 0 0 0 0 0 0
14.4 Data Conversion Massachusetts is the only New England state that has a GIS theme with rest areas lo-
cations. This file, as are all MassGIS files, is in NAD83 meters. Since my project is in NAD83 decimal degrees, a data conversion had to take place.
First, the information had to be collected. This project is presented in NAD83 hori-zontal datum, with decimal degrees units. The Mass data was in NAD83 meters, with a Mass Stateplane Mainland Zone. Using the help menu, it was found that Massachusetts is fipszone 2001.
In ArcInfo, the following process was used in the conversion. The first step is to define the file that is to be converted.
Arc: Projectdefine cover <name of cover> Project: projection stateplane Project: units meters Project: datum NAD83 Project: fipszone 2001 Project: parameters
‘Parameters’ is the command that tells project that it is finished. Next we define the output file.

108
Project: cover <name old file> <name new file> Project: output Project: geographic Project: units dd Project: datum nad83 Project: parameters Project: end
The file has now been converted and the shapefile with <new file name> can be opened.
Overall, the GIS map is very simple to produce and update. It has good analysis op-tions and the results can be displayed graphically. These pictures can then be served via the Internet. The Internet also allows very simple linking capabilities, so that a series of maps, each with specific information can be linked to all other pictures using Icons and web links. All state transportation agencies have personnel that are professionals at this device.