quantifying the air quality impacts of energy efficiency policies
TRANSCRIPT
Quantifying the Air Quality Impacts of
Energy Efficiency Policies and Programs
Author
John Shenot
August 2013

Electronic copies of this paper and other RAP publications can be found on our website at www.raponline.org.
To be added to our distribution list, please send relevant contact information to
Acknowledgements
The author is grateful to the United States Environmental Protection Agency, which provided funding for an earlier, shorter paper that formed the foundation of this document.
The author would also like to thank several individuals for the time and effort they put into reviewing and commenting on this paper: Allison Guerette and Leah Weiss (NESCAUM); Amy Royden-Bloom (NACAA); Chris Neme (EFG); Jeremy Fisher (Synapse); Nikolaas Dietsch, Robyn DeYoung, and Denise Mulholland (US EPA); and Ken Colburn and Chris James (RAP). Their insights and suggestions greatly improved the final product. Any errors or deficiencies that remain are the sole responsibility of the author.

1
Quantifying the Air Quality Impacts of Energy Efficiency Policies and Programs
Executive Summary . . . . . . . . . . . . . . . . . . . . . . . . . . . . 3
1. Introduction . . . . . . . . . . . . . . . . . . . . . . . . . . . . . . . . 7
1.1. Benefits and Advantages of EE Policies and Programs . . . . . . . . . . . . . . . . . . . . . . . . . . . . . . 8
1.2. EE’s Role in Air Quality Improvement Plans . . . . . 8
1.3. Structure of this Report . . . . . . . . . . . . . . . . . . . . . 9
2. Brief Overview of Energy and EE Data . . . . . . . . 10
2.1. Types of Data Sources . . . . . . . . . . . . . . . . . . . . . 10
2.2. Level of Expertise Required of the Air Regulator . . 11
3. Data on Energy Consumption and EE Impacts . . . 12
3.1. Data Sources for Forecasts, Plans, and Potential Studies . . . . . . . . . . . . . . . . . . . . . . . 12
3.1.1. The Annual Energy Outlook . . . . . . . . . . . 12
3.1.2. ISO Forecasts . . . . . . . . . . . . . . . . . . . . . . 14
3.1.3. Utility Plans and Forecasts . . . . . . . . . . . . 16
3.1.3.1. EE Program Plans . . . . . . . . . . . . . . . 16
3.1.3.2. Integrated Resource Plans . . . . . . . . . 19
3.1.4. Other State PUC Reports, Dockets, and Filings . . . . . . . . . . . . . . . . . . . . . . . . . . . 21
3.1.5. EE Market Potential Studies . . . . . . . . . . . 23
3.2. Energy Savings Reports . . . . . . . . . . . . . . . . . . . . 24
4. Methods and Tools for Assessing Emissions Reductions Attributable to EE . . . . . . . . . . . . . . . . 26
4.1. Methods . . . . . . . . . . . . . . . . . . . . . . . . . . . . . . . 26
4.1.1. Average Emissions Method . . . . . . . . . . . . 26
4.1.1.1 Subregions Spanning More than One State . . . . . . . . . . . . . . . . . 29
4.1.1.2 States Spanning More than One Subregion . . . . . . . . . . . . . . . . . . . . . 29
4.1.2. Marginal Emissions Methods . . . . . . . . . . . 30
Table Of Contents
4.1.2.1 Capacity Factor Marginal Emissions Method . . . . . . . . . . . . . . . . . . . 30
4.1.2.2 Statistical/Hourly Marginal Emissions Method . . . . . . . . . . . . . . . . . . . 31
4.1.3. Dispatch Modeling Method . . . . . . . . . . . . 32
4.2. Strengths and Limitations of Each Method . . . . . 33
4.3. Other Related Quantification Tools . . . . . . . . . . . 33
4.4. Other Considerations . . . . . . . . . . . . . . . . . . . . . 33
5. Importance of Collaboration to Improve Data Quality . . . . . . . . . . . . . . . . . . . . . . . . . . . . . . 36
5.1. Opportunities to Obtain Better Data From the Energy Sector and Energy Regulators to Improve Air Quality Policy Development . . . . . . 36
5.2. Opportunities to Provide Better Data to the Energy Sector and Energy Regulators to Improve Energy Policy Development . . . . . . . . . 36
5.3. National Venues for Collaboration . . . . . . . . . . . . 37
5.3.1. State and Local Energy Efficiency Action Network . . . . . . . . . . . . . . . . . . . . . . . 37
5.3.2. Uniform Methods Project . . . . . . . . . . . . . 37
5.3.3. EPA EM&V Webinars . . . . . . . . . . . . . . . . 37
5.4. Regional Venues for Collaboration . . . . . . . . . . . . 38
5.4.1. Northeast Energy Efficiency Partnerships EM&V Forum . . . . . . . . . . . . . . . 38
5.4.2. ISO New England Environmental Advisory Group . . . . . . . . . . . . . . . . . . . . . . . 38
5.5. State-Specific Venues for Collaboration . . . . . . . . 38
5.5.1. EE Planning and Program Evaluation Dockets . . . . . . . . . . . . . . . . . . . . . 38
5.5.2. IRP Dockets . . . . . . . . . . . . . . . . . . . . . . . 39
6. Conclusion . . . . . . . . . . . . . . . . . . . . . . . . . . . . . . . . 40

2
Quantifying the Air Quality Impacts of Energy Efficiency Policies and Programs
List of FiguresFigure 1. Electric Power Sector’s Share of National Emissions . . . . . . . . . . . . . . . . . . . . . . . . . . . . . . . . . . . . . . . . 7
Figure 2. Electric Transmission Independent System Operators of North America . . . . . . . . . . . . . . . . . . . . . . . . 14
Figure 3. EE Delivery Structure for Electricity Programs (as of 2009) . . . . . . . . . . . . . . . . . . . . . . . . . . . . . . . . . 17
Figure 4. State IRP Rules and Filing Requirements . . . . . . . . . . . . . . . . . . . . . . . . . . . . . . . . . . . . . . . . . . . . . . . 19
Figure 5. State Renewable Portfolio Standard Requirements . . . . . . . . . . . . . . . . . . . . . . . . . . . . . . . . . . . . . . . . 22
Figure 6. Schematic Showing Different Meanings of EE “Potential” . . . . . . . . . . . . . . . . . . . . . . . . . . . . . . . . . . . 23
Figure 7. eGRID Subregions . . . . . . . . . . . . . . . . . . . . . . . . . . . . . . . . . . . . . . . . . . . . . . . . . . . . . . . . . . . . . . . . 27
Figure 8. Curve Relating Displacement Potential to Capacity Factor . . . . . . . . . . . . . . . . . . . . . . . . . . . . . . . . . . 30
Figure 9. Sample Output of AVERT Model . . . . . . . . . . . . . . . . . . . . . . . . . . . . . . . . . . . . . . . . . . . . . . . . . . . . . 32
List of TablesTable 1. Year 2009 eGRID Subregion Output Emission Rates – Criteria Pollutants . . . . . . . . . . . . . . . . . . . . . . . 28
Table 2. Hypothetical Power Plants with Assumed Historical Output and Capacity Factors . . . . . . . . . . . . . . . . . 30
ACEEE American Council for an Energy-Efficient Economy
AEO Annual Energy Outlook
DOE (U.S.) Department of Energy
EE Energy Efficiency
eGRID Emissions & Generation Resource Integrated Database
EIA (U.S.) Energy Information Administration
EMM Electricity Market Module
EM&V (data) Evaluation, Measurement, and Verification
EPA (U.S.) Environmental Protection Agency
GW Gigawatt
IOU Investor-Owned Utilities
Acronyms
IRP Integrated Resource Plan
ISOs Independent System Operators
MW Megawatts
NEEP Northeast Energy Efficiency Partnerships
PUCs Public Utility Commissions
RPS Renewable Portfolio Standard
SEE Action Network State and Local Energy Efficiency Action Network
SIPs State Implementation Plans
TIPs Tribal Implementation Plans
TRMs Technical Reference Manual
3
Quantifying the Air Quality Impacts of Energy Efficiency Policies and Programs
This report provides an introduction for air quality regulators to data sources and methods for quantifying the air quality impacts of energy efficiency (EE) policies and programs. In recent
years EE has increasingly been viewed by more and more regulators as a viable air quality improvement strategy. No regulator should expect to solve all air quality challenges through one strategy alone; however, efficiency does have some distinct advantages over pollution control methods, and a fundamental premise of this report is that it makes great sense to employ energy efficiency as a first step toward air quality improvement rather than as a last resort.
Benefits and Advantages of EE Policies and Programs
From an economic perspective, arguably the most important (yet often overlooked) advantage of EE relative to pollution control equipment is that EE is an investment in the power sector, while pollution controls are an expense. EE lowers the total system-wide costs of serving all customers’ energy needs, while pollution controls add to the system costs. From an environmental perspective, EE has the advantage of addressing multiple air pollutants simultaneously with a single strategy, whereas most pollution control devices are designed to address one pollutant. And finally, by reducing aggregate customer demand for energy, EE also ensures that existing infrastructure can serve demand more reliably. Pollution control devices, on the other hand, typically require energy to operate and thus increase the strain on existing infrastructure.
EE’s Role in Air Quality Improvement Plans
In recognition of the advantages noted above, the United States Environmental Protection Agency (EPA) is supporting increased use of EE as an air quality
Executive Summary
improvement strategy. One of the biggest challenges that regulators face in using EE as an air quality improvement strategy is the need to quantify the impacts of specific policies or programs, and to do so with a level of rigor that is suitable for a State Implementation Plan (SIP) or other regulatory purposes. This report helps air regulators face these challenges by identifying suitable data sources and methods for quantifying the amount and location of EE program impacts.
Overview of Energy and EE Data
In order to quantify future energy savings and future avoided emissions, one must compare two different hypothetical futures – one in which an EE policy or program is implemented, and one in which it is not. The types of available data sources that are most useful include:
• Forecasts of future energy use or energy savings resulting from EE. Estimates of air emissions (or avoided emissions resulting from EE) are sometimes included.
• Utility plans for the deployment of EE and utility long range integrated resource plans. In some cases, these plans include estimates of avoided emissions.
• EE market potential studies that assess how much energy could be saved through cost-effective EE programs. Some of these studies also assess the extent to which those same EE programs could reduce air emissions.
• Energy savings reports that detail the results of EE programs that have already been implemented. The data in these reports are often referred to as “EM&V” data – for evaluation, measurement, and verification.
Air regulators do not themselves need to make energy forecasts or conduct EE program evaluations. What is necessary is that air regulators have a basic understanding of what types of data are useful and available, where to find these data, and how to interpret the data.
4
Quantifying the Air Quality Impacts of Energy Efficiency Policies and Programs
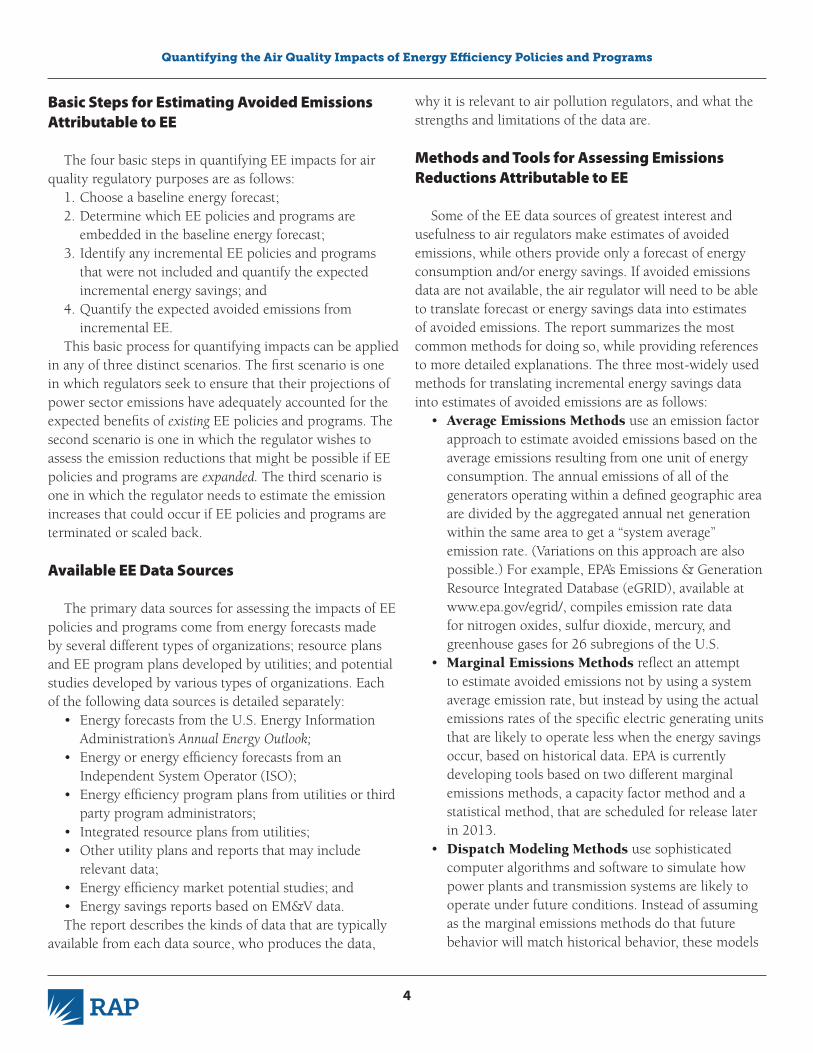
Basic Steps for Estimating Avoided Emissions Attributable to EE
The four basic steps in quantifying EE impacts for air quality regulatory purposes are as follows:
1. Choose a baseline energy forecast;2. Determine which EE policies and programs are
embedded in the baseline energy forecast;3. Identify any incremental EE policies and programs
that were not included and quantify the expected incremental energy savings; and
4. Quantify the expected avoided emissions from incremental EE.
This basic process for quantifying impacts can be applied in any of three distinct scenarios. The first scenario is one in which regulators seek to ensure that their projections of power sector emissions have adequately accounted for the expected benefits of existing EE policies and programs. The second scenario is one in which the regulator wishes to assess the emission reductions that might be possible if EE policies and programs are expanded. The third scenario is one in which the regulator needs to estimate the emission increases that could occur if EE policies and programs are terminated or scaled back.
Available EE Data Sources
The primary data sources for assessing the impacts of EE policies and programs come from energy forecasts made by several different types of organizations; resource plans and EE program plans developed by utilities; and potential studies developed by various types of organizations. Each of the following data sources is detailed separately:
• Energy forecasts from the U.S. Energy Information Administration’s Annual Energy Outlook;
• Energy or energy efficiency forecasts from an Independent System Operator (ISO);
• Energy efficiency program plans from utilities or third party program administrators;
• Integrated resource plans from utilities;• Other utility plans and reports that may include
relevant data;• Energy efficiency market potential studies; and• Energy savings reports based on EM&V data.The report describes the kinds of data that are typically
available from each data source, who produces the data,
why it is relevant to air pollution regulators, and what the strengths and limitations of the data are.
Methods and Tools for Assessing Emissions Reductions Attributable to EE
Some of the EE data sources of greatest interest and usefulness to air regulators make estimates of avoided emissions, while others provide only a forecast of energy consumption and/or energy savings. If avoided emissions data are not available, the air regulator will need to be able to translate forecast or energy savings data into estimates of avoided emissions. The report summarizes the most common methods for doing so, while providing references to more detailed explanations. The three most-widely used methods for translating incremental energy savings data into estimates of avoided emissions are as follows:
• Average Emissions Methods use an emission factor approach to estimate avoided emissions based on the average emissions resulting from one unit of energy consumption. The annual emissions of all of the generators operating within a defined geographic area are divided by the aggregated annual net generation within the same area to get a “system average” emission rate. (Variations on this approach are also possible.) For example, EPA’s Emissions & Generation Resource Integrated Database (eGRID), available at www.epa.gov/egrid/, compiles emission rate data for nitrogen oxides, sulfur dioxide, mercury, and greenhouse gases for 26 subregions of the U.S.
• Marginal Emissions Methods reflect an attempt to estimate avoided emissions not by using a system average emission rate, but instead by using the actual emissions rates of the specific electric generating units that are likely to operate less when the energy savings occur, based on historical data. EPA is currently developing tools based on two different marginal emissions methods, a capacity factor method and a statistical method, that are scheduled for release later in 2013.
• Dispatch Modeling Methods use sophisticated computer algorithms and software to simulate how power plants and transmission systems are likely to operate under future conditions. Instead of assuming as the marginal emissions methods do that future behavior will match historical behavior, these models

5
Quantifying the Air Quality Impacts of Energy Efficiency Policies and Programs
are driven by the input assumptions about future fuel prices, unit operating costs, energy demand, etc. Because these models can forecast the output of each generator on the system, and each generator’s emission rates are known, they can also be used to project emissions. By modeling two scenarios – one including the impacts of EE policies and programs, and one without those impacts – the analyst can develop values for avoided emissions.
The report summarizes some of the most significant strengths and limitations of each method.
Importance of Collaboration to Improve Data Quality
Energy consumption and air quality are linked in ways that challenge traditional thinking about the missions, authorities, and responsibilities of regulatory agencies. The need for air regulators to collaborate directly and frequently with utility regulators, state energy offices, and other energy-sector entities is greater than ever before, and all parties should benefit from better communications and more coordinated efforts.
In many states, as EE program evaluation practices have improved through years of practice, more and more attention has been paid to quantifying avoided emissions. But the people paying attention to this issue do not always understand the true data needs of air quality regulators. Air quality regulators should communicate their data needs to EE program evaluators and regulators.
EE measures and EE programs are screened to determine if they are cost-effective. Most states now include environmental costs and benefits in their cost-effectiveness calculations, with particular emphasis placed on air quality impacts. Air regulators should seek to ensure that costs and benefits associated with air pollution are properly included in cost-effectiveness tests. Air quality regulators should also provide the best available data on the costs of utility compliance with air quality regulations, the societal costs of air pollution, and the costs that can be avoided through EE.
The report details a number of venues at the federal, regional and state levels where air regulators can collaborate with energy professionals to promote better and more consistent methods for EM&V of EE program impacts, including in some cases air pollution impacts. These venues
include:• The State and Local Energy Efficiency Action Network
(SEE Action Network), a state-led, multi-stakeholder effort facilitated by the United States Department of Energy (DOE) and EPA.
• The Uniform Methods Project, another initiative supported by DOE to strengthen the credibility of EE programs by developing standard protocols that can increase the consistency and transparency of how energy savings are determined.
• For more than three years, EPA’s State and Local Climate and Energy Program has been hosting a series of EM&V webinars for state environmental regulators, staff from PUCs and state energy offices, and staff from non-profits.
• Northeast Energy Efficiency Partnerships (NEEP) launched an EM&V Forum to provide a regional resource for developing and supporting implementation of consistent protocols for EM&V and reporting of energy and capacity savings in eleven Northeast and mid-Atlantic states plus the District of Columbia.
• ISO New England has an Environmental Advisory Group that focuses on assessing the local power system impact of national environmental developments and the implications for internal planning processes. In recent years the group completed groundbreaking studies of marginal emission rates and NOx emissions on peak energy demand days in the ISO New England system.
• Air regulators may be able to collaborate with state PUCs on EE program planning and evaluation procedures, or utility integrated resource planning procedures, either by intervening in a docket or through less formal communication between dockets.
Conclusion
As energy efficiency policies and programs proliferate and expand across the country, environmental regulators are increasingly interested in quantifying the impact of those policies and programs on air emissions. Air regulators may not have the expertise to develop their own estimates of energy consumption or the energy savings that result from EE policies and programs, but they will find that

6
Quantifying the Air Quality Impacts of Energy Efficiency Policies and Programs
a wide variety of external data sources exist. U.S. EPA is developing several methods and tools to help regulators translate energy savings data into avoided emissions estimates. Air regulators need an understanding of the basics of these methods and tools if they wish to include EE impacts in their plans. Quantifying the environmental impacts of EE is still a relatively new undertaking, and the methods and tools are still evolving. However, EPA is increasingly willing to recognize estimates of energy savings and avoided emissions as being sufficiently sophisticated to be used for air quality regulatory purposes. By collaborating with energy sector professionals and regulators, air quality regulators can contribute to the development of even better methods and improved data.
Scope and Purpose of This Report
This report provides an introduction for air quality regulators to data sources and methods for quantifying the air quality impacts of energy efficiency (EE) policies and programs. The scope of this discussion is primarily limited to policies and programs targeting the efficient use of electricity. Many of the concepts, data sources, and methods
described in this report could apply equally to policies and programs that address the efficient use of natural gas for space heating, water heating, and process steam. However, this report emphasizes electric EE programs because the methods for quantifying air quality impacts of electric EE programs are more complicated in that the measure and the associated emissions reductions most often occur in different locations.
The report is intended to serve multiple purposes, most notably to:
• Explain the rationale and opportunities for using EE as an air quality improvement strategy;
• Document the key things that air regulators need to know about EE data and forecasts;
• Identify useful sources of data about energy use and EE policy and program impacts;
• Provide explanations and examples that illustrate how energy savings data can be translated into avoided emissions estimates; and
• Explain opportunities to work with energy agencies to communicate air regulators’ EE data priorities, including ways to improve the data.

7
Quantifying the Air Quality Impacts of Energy Efficiency Policies and Programs
1 Figure 1 is reproduced from Reducing Pollution from Power Plants, presentation by Joe Bryson (EPA) at the National Association of State Utility Consumer Advocates Annual Meeting, Atlanta GA, November 2010. The two data sources for this figure are the National Emissions Inventory
(http://www.epa.gov/ttn/chief/net/2008inventory.html) and the Inventory of U.S. Greenhouse Gas Emissions and Sinks: 1990-2010 (http://www.epa.gov/climatechange/ghgemissions/usinventoryreport.html).
Air quality regulators have long recognized that our society’s use of energy has a fundamental impact on air quality. Data collected by the United States Environmental Protection Agency
(EPA), shown in Figure 1, indicate that the electric power sector is a major contributor to the air quality challenges
1. Introduction
that most concern air regulators. Electric power sector emissions can be reduced by
deploying pollution control equipment on electric generating units, by displacing generation from units that emit air pollution with generation from units that emit less or don’t emit at all, or by reducing the need for generation
Figure 1
Electric Power Sector’s Share of National Emissions1
Sulfer Dioxide (SO2), 20099.5 million tons
Particulate Matter (PM10), 200514.8 million tons
Nitrogen Oxides (NOx), 200915.3 million tons
Mercury (Hg), 2005114 tons
Carbon Dioxide (CO2), 20086.5 billion tons
Other Sectors
Electric Power Electric
Power
Electric Power
Electric Power
Electric Power
3.8 million tons40%
13.3 million tons87%
3.9 billion tons60%
14.3 million tons96%
62 tons54%
5.7 million tons60%
2.0 million tons13%
2.6 billion tons40%
0.5 million tons4%
52 tons46%
Other Sectors
Other Sectors
Other Sectors
Other Sectors
Coal-fired power plants: vast majority of power sector air emissions
Coal97%
Coal85%
Coal83%
Coal> 99%
Coal95%
8
Quantifying the Air Quality Impacts of Energy Efficiency Policies and Programs
through energy efficiency (EE).2 Traditionally, state and federal regulators have relied almost exclusively on pollution control strategies to improve air quality. However, in recent years EE has increasingly been viewed by more and more regulators as a viable air quality improvement strategy. All three types of strategies can contribute to environmental quality and improved public health, and no regulator should expect to solve all air quality challenges through one strategy alone. However, efficiency does have some distinct advantages over pollution control methods, and a fundamental premise of this report is that it makes great sense to employ EE as a first step toward air quality improvement rather than to use it as a last resort.
1.1. Benefits and Advantages of EE Policies and Programs
The benefits and advantages of EE policies and programs have been thoroughly documented in numerous publications produced by many different parties.3 For the purposes of this report, it is not necessary to repeat or summarize all of those benefits, but we will briefly highlight some of the benefits that are most relevant to air quality regulation.
From an economic perspective, arguably the most important (yet often overlooked) advantage of EE relative to pollution control equipment is that EE is an investment in the power sector, whereas pollution controls are an expense. EE lowers the total system-wide costs of serving all customers’ energy needs, while pollution controls add to the system costs.4 In fact, a number of studies have concluded that EE programs deliver economic benefits of
2 In this report, when we refer to “energy efficiency” we are referring solely to efforts to provide the same level of energy service or performance, or better, with less energy input. Energy conservation actions that sacrifice comfort or performance in order to reduce energy are not EE as we will use that term. Furthermore, EE policies and programs in the United States are generally limited in scope to cost-effective actions (i.e., those for which the benefits of the action exceed the cost). Although the requirement for EE programs to be cost-effective is essentially universal, jurisdictions vary widely in how they define and calculate benefits and costs. This subject is beyond the scope of this report, but interested readers can find more information at http://www.epa.gov/cleanenergy/documents/suca/cost-effectiveness.pdf.
$2 to $4 (or more) for each $1 invested, on average.5 From an environmental perspective, EE has the
advantage of addressing multiple air pollutants simultaneously with a single strategy, whereas most pollution control devices are designed to address one pollutant. Using energy more efficiently can also provide co-benefits, like reduced water consumption and land discharges, in contrast to pollution controls that often create challenges for cross-media pollution or waste management. Furthermore, EE programs can generally be deployed much more quickly than either new energy supply resources or pollution control equipment on existing supply resources.
And finally, by reducing aggregate customer demand for energy, EE also ensures that existing infrastructure can serve demand more reliably. Pollution control devices, on the other hand, typically require energy to operate and thus increase the strain on existing infrastructure.
1.2. EE’s Role in Air Quality Improvement Plans
In recognition of the advantages noted previously, the EPA is supporting increased use of EE as an air quality improvement strategy. In July 2012, the Office of Air and Radiation published a new Roadmap for Incorporating Energy Efficiency/Renewable Energy Policies and Programs into State and Tribal Implementation Plans.6 In that document, the EPA actively encourages state, tribal, and local agencies to consider incorporating EE policies and programs in State and Tribal Implementation Plans (SIPs/TIPs) for non-attainment areas. The EPA also features EE in its
3 See, for example, Assessing the Multiple Benefits of Clean Energy: A Resource for States, U.S. EPA 2010. Available at: http://www.epa.gov/statelocalclimate/documents/pdf/epa_assessing_benefits.pdf
4 This does not imply that the costs of pollution control equipment exceed the benefits, but those benefits come primarily in the form of improved public health rather than reduced energy costs.
5 See, for example, Friedrich et al, Saving Energy Cost Effectively: A National Review of the Cost of Energy Saved through Utility-Sector Energy Efficiency Programs, ACEEE 2009.
6 Available at: http://epa.gov/airquality/eere/manual.html

9
Quantifying the Air Quality Impacts of Energy Efficiency Policies and Programs
“Advance Program” as a strategy for areas that currently meet air quality standards to avoid future non-attainment designations.7 In both cases, the EPA cites the potential for EE to provide significant air quality benefits in a cost-effective manner.
One of the biggest challenges that regulators face in using EE as an air quality improvement strategy is the need to quantify the impacts of specific policies or programs, and to do so with a level of rigor that is suitable for regulatory purposes. And identifying the location of the impacts can be equally challenging, because EE implemented in one state may result in avoided emissions at multiple power plants in multiple states. This report helps air regulators face these challenges by identifying suitable data sources and methods for quantifying the amount and location of EE program impacts.
Air regulators are accustomed to using different methodologies for assessing the expected impact of control measures applied to point, area, and mobile sources. The methodologies for quantifying the impacts of EE policies and programs are in some ways a hybrid of those approaches, recognizing that the EE “control measures” are numerous and dispersed (like area or mobile sources) but they indirectly affect emissions at large stationary point sources (electric generating units).
7 Refer to http://www.epa.gov/ozoneadvance/index.html for more information on the Advance Program.
1.3. Structure of this Report
The main body of this report is divided into four substantive sections, followed by a conclusion. Section 2 provides an overview of available sources of data on energy consumption and EE policy and program impacts. Section 3, representing the bulk of this report, offers details about each type of available data source and explain its relevance from an air quality regulator’s perspective. Section 4 refers readers to several available methods and tools that can translate an estimate of energy savings into an estimate of avoided emissions. Section 5 explains the importance—and the opportunities—for air quality regulators to collaborate with energy regulators and other parties to improve the quality and usefulness of EE data for air quality regulatory purposes.

10
Quantifying the Air Quality Impacts of Energy Efficiency Policies and Programs
8 In some parts of North America, electric utilities and other owners of transmission lines have voluntarily supported the creation of an ISO that administers the transmission grid on a regional basis, ensures system reliability and open access to transmission for all generators, operates competitive wholesale electricity markets, and controls the dispatch of power plants.
Air regulators need credible, quality-assured data about the impacts of EE policies and programs in order to have confidence that those impacts can be adequately quantified for inclusion in a SIP as
an emissions reduction strategy.Measuring the impact of EE is not like downloading
continuous emissions monitor data or reading an electric or gas meter. In most cases, one can’t directly read the amount of energy saved with a meter because it is difficult to measure something that didn’t happen. Instead, the professionals that evaluate EE programs use industry standard calculation techniques and methods as the basis for making thorough, consistent estimates of how much energy was (or will be) saved. These techniques and methods are the only way to document the real, beneficial effects of EE in a way that regulators can use.
2.1. Types of Data Sources
In order to quantify future energy savings and future avoided emissions, one must compare two different hypothetical futures—one in which an EE policy or program is implemented, and one in which it is not. A wealth of data already exists to help make this kind of comparison.
The types of data sources that are useful and available fall into four categories:
• Forecasts;• Utility plans;• Market potential studies; and • Energy savings reports. Each will be discussed in detail later in this report but
are summarized briefly here. Forecasts of future energy use (and in some cases, the
associated air emissions) may be developed by federal or state energy agencies, utilities, state public utility commissions (PUCs), or electric transmission independent system operators (ISOs).8 Forecasts of energy savings
2. Brief Overview of Energy and EE Data
resulting from EE may also be developed by any of the above, or by non-utility (third-party) EE program administrators or efficiency advocates. Estimates of avoided emissions resulting from EE are sometimes a part of those forecasts as well.
In many parts of the country, utilities develop detailed plans for the deployment of EE, including projections of energy savings and, in some cases, avoided emissions. They may also have long-range plans for how they will meet future customer energy demands through a combination of energy supply resources and EE. Both types of plans may be publicly available and contain data helpful to air regulators.
EE market potential studies provide a prospective assessment of how much energy could be saved through cost-effective EE programs. Some of these studies also assess the extent to which those same EE programs could reduce air emissions. EE market potential studies are typically completed by a specialist contractor working for a utility, PUC, or advocacy organization. These studies should not be confused with an actual plan for the implementation of EE programs.
Energy savings reports detail the results of EE programs that have already been implemented. The data in these reports are often referred to as “EM&V” data, for evaluation, measurement, and verification. These reports are typically produced on an annual basis by a contractor working for a utility or a PUC, with the dual purpose of documenting program impacts and identifying possible program improvements.

11
Quantifying the Air Quality Impacts of Energy Efficiency Policies and Programs
2.2. Level of Expertise Required of the Air Regulator
Air regulators do not themselves need to make energy forecasts or conduct EE program evaluations. They do not need to become experts in EM&V in order to make use of EE data. In fact, it is not practical in most cases for air pollution experts to develop a comprehensive understanding of energy forecasting or energy savings estimation methods. What is important and necessary, however, is that air regulators have a basic understanding of what types of data are useful and available, where to
find these data, and how to interpret the data (or avoid misinterpreting it). Fundamentally, air regulators will rely on the fact that energy and energy savings data are generally developed by experienced professionals, using industry standard practices, frequently in a transparent, public, and possibly even adjudicated forum. In time and with experience, air regulators will come to realize that these data sources are at least as accurate and precise as some of the other data sources that air regulators routinely use in SIPs and for other regulatory purposes, particularly with respect to area and mobile sources.
12
Quantifying the Air Quality Impacts of Energy Efficiency Policies and Programs
3. Data on Energy Consumption and EE Impacts
In many cases, air quality regulators develop baseline projections of power sector emissions for modeling and SIP purposes. The impacts of potential pollution control strategies can then be applied to the
generating units in the model to determine their net air quality impacts. Where needed, a SIP will be developed using a combination of required elements and those additional pollution control strategies that are most feasible and/or effective.
Any baseline projection of power sector emissions is inherently derived from or grounded in a baseline forecast of future energy consumption. And the objective of any EE policy or program is to reduce future energy consumption relative to that baseline. Putting these pieces together, we can develop an outline for quantifying EE impacts for air quality regulatory purposes, as follows:
Step 1: Choose a baseline energy forecast.Step 2: Determine which national, state, and local EE
policies and programs are already embedded in the selected baseline energy forecast.
Step 3: Identify any incremental EE policies and programs (i.e., those that were not included in the assumptions used to develop the baseline forecast) and quantify the expected incremental energy savings.
Step 4: Quantify the expected avoided emissions from incremental EE.
This basic process for quantifying impacts can be applied in any of three distinct scenarios. The first scenario is one in which regulators seek to ensure that their projections of power sector emissions have adequately accounted for the expected benefits of existing EE policies and programs. The second scenario is one in which the regulator wishes to assess the emissions reductions that might be possible if EE policies and programs are expanded. The third scenario is one in which the regulator needs to estimate the emission increases that could occur if EE policies and programs are terminated or scaled back.
In Section 3.1, we examine in detail each of the most widely available and useful data sources for working
through the first three steps in quantifying avoided emissions. Then, in Section 3.2 we will take a step back and look at energy savings reports, which don’t necessarily help one get through the steps but instead help provide confidence in the other data sources. Section 4 of the report provides additional tools and methods for working through Step 4.
3.1. Data Sources for Forecasts, Plans, and Potential Studies
The primary data sources for assessing the impacts of EE policies and programs come from energy forecasts made by several different types of organizations; resource plans and EE program plans developed by utilities; and potential studies developed by various types of organizations. Each of the most widespread and significant data sources is detailed separately below.
3.1.1. The Annual Energy Outlook
Description and Relevance to Air RegulatorsThe U.S. Energy Information Administration (EIA)
produces an Annual Energy Outlook (AEO) each year that provides long-term projections of energy supply, demand, and prices, based on data it collects from industry sources and modeling results.9 The foundation of each AEO is a Reference Case projection that is based on business-as-usual trends and assumptions concerning technology, demographics, economics, and regulation. Alternative cases are also developed by the EIA to test what happens if key model inputs such as macroeconomic growth rates or fuel prices vary from the Reference Case assumptions. The AEO
9 The EIA also produces a Short Term Energy Outlook which is updated monthly and looks out just one year into the future. The Short Term Energy Outlook is generally less useful to air quality regulators because of the short time horizon.

13
Quantifying the Air Quality Impacts of Energy Efficiency Policies and Programs
2013 makes projections out to the year 2040.10
The AEO can be a very useful document for air quality regulators, and its associated data sets are publicly available from an interactive, online table viewer. They contain year-by-year projections of several types of data of particular interest to air quality regulators:
• Electricity sales/consumption;• Natural gas sales/consumption for uses other than
electric generation;• Net electric generating capacity, capacity additions,
and capacity retirements by fuel type (e.g., coal, natural gas, wind, and so on);
• Electric generation by fuel type;• Electric power sector emissions of sulfur dioxide,
nitrogen oxides, and mercury; and • Energy-related carbon dioxide emissions by sector
and source.In addition to presenting aggregate or average national
level data, for electricity data EIA also divides the nation into 22 Electricity Market Module (EMM) regions based on the functionality of electricity markets and presents electricity sector data specific to each EMM region.
Strengths and LimitationsThe AEO has some distinct advantages as a source of
data for air regulatory purposes:• EIA work products are viewed by most stakeholders
as authoritative, independent, impartial, and transparent.
• The EPA uses electric load forecasts from the AEO as one of the inputs to the Integrated Planning Model it uses to analyze the impact of air quality regulations on the U.S. electric power sector.
• AEO forecasts generally account for the long-term impacts of all enacted federal energy and efficiency policies, as well as some (but not all) state policies. This means that state regulators can focus more of their attention on the impacts of state and local policies.
• In recent versions of the AEO, the EIA has also placed a lot of attention on reflecting the impacts of environmental regulations in the Reference Case and testing the impacts of potential new regulations in alternative cases.
The AEO does, however, have at least three significant limitations:
• AEO forecasts generally do not reflect the impacts of all of the policies and programs that affect energy consumption. Specifically, the forecasts do not consider: • Newly adopted state policies; • Policies and programs mandated by local
governments; • Utility programs that are supplemental to
mandated minimum requirements; or• Voluntary utility programs.
• Disaggregating national or regional AEO data to the state level can be challenging and inexact. Most EMM regions span multiple states, and many states span more than one EMM region. Intra-regional differences may be significant but are not discernible from the data as reported, and this can complicate state-level projections.
• Forecast data in the AEO are presented as annual totals only; any seasonal variations that may be significant for air quality impacts (e.g., ozone season emissions) are not reported.
Despite these limitations, air quality regulators should be able to use AEO data as the starting point for developing emissions projections. In 2011, EPA staff conducted an assessment using the 2010 AEO for this purpose. They found that the 2010 AEO reflected the future impacts of federal energy policies like weatherization programs and appliance standard. It also reflected the future impacts of mandatory state Renewable Portfolio Standard (RPS) laws, but it did not reflect the future impacts of state and local EE policies and programs. EPA staff then developed a preliminary assessment of the incremental energy savings from certain types of EE policies and sought comment from state regulators on the results.11 State regulators could make a similar kind of preliminary assessment to determine whether the incremental impacts of their state and local EE policies or
10 The AEO 2013 is available at http://www.eia.gov/forecasts/aeo/pdf/0383(2013).pdf.
11 Refer to http://www.epa.gov/statelocalclimate/state/statepolicies.html. The same types of policies were included and excluded from the assumptions used to develop the 2013 AEO, but these assumptions could of course change in future editions of the AEO.
14
Quantifying the Air Quality Impacts of Energy Efficiency Policies and Programs
programs might be enough to warrant further investigation.12 Some analytical tools that are available for this kind of preliminary assessment are described in Section 4.
SummaryThe AEO provides useful information for Steps 1 and 2
in the process of quantifying avoided emissions. It provides a baseline energy forecast and a clear description of which EE policies and programs are embedded in the forecast.
3.1.2. ISO Forecasts
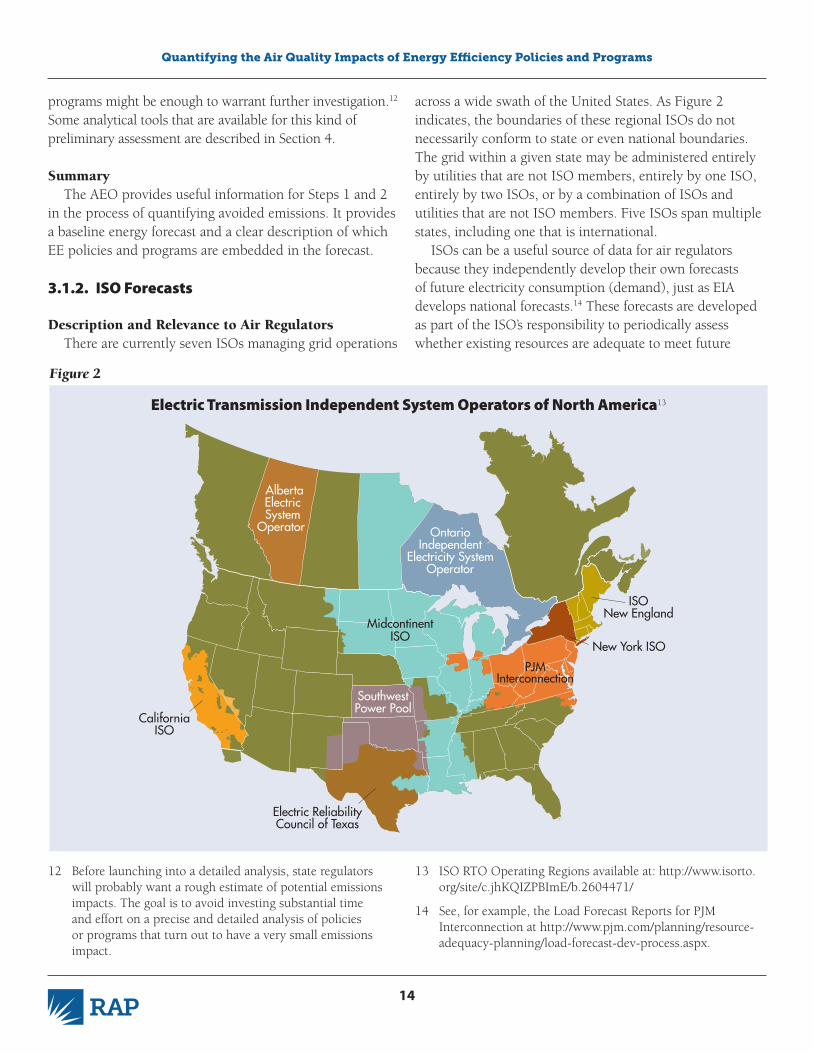
Description and Relevance to Air RegulatorsThere are currently seven ISOs managing grid operations
across a wide swath of the United States. As Figure 2 indicates, the boundaries of these regional ISOs do not necessarily conform to state or even national boundaries. The grid within a given state may be administered entirely by utilities that are not ISO members, entirely by one ISO, entirely by two ISOs, or by a combination of ISOs and utilities that are not ISO members. Five ISOs span multiple states, including one that is international.
ISOs can be a useful source of data for air regulators because they independently develop their own forecasts of future electricity consumption (demand), just as EIA develops national forecasts.14 These forecasts are developed as part of the ISO’s responsibility to periodically assess whether existing resources are adequate to meet future
Figure 2
Electric Transmission Independent System Operators of North America13
Alberta Electric System
Operator
CaliforniaISO
Electric ReliabilityCouncil of Texas
PJMInterconnection
ISONew England
New York ISO
MidcontinentISO
SouthwestPower Pool
OntarioIndependent
Electricity SystemOperator
12 Before launching into a detailed analysis, state regulators will probably want a rough estimate of potential emissions impacts. The goal is to avoid investing substantial time and effort on a precise and detailed analysis of policies or programs that turn out to have a very small emissions impact.
13 ISO RTO Operating Regions available at: http://www.isorto.org/site/c.jhKQIZPBImE/b.2604471/
14 See, for example, the Load Forecast Reports for PJM Interconnection at http://www.pjm.com/planning/resource-adequacy-planning/load-forecast-dev-process.aspx.
15
Quantifying the Air Quality Impacts of Energy Efficiency Policies and Programs
demand. Demand savings from established EE policies and programs are generally taken into consideration. Air regulators in states that have one or more operating ISOs should contact the ISO(s) to obtain a copy of the most recent load forecast if they cannot locate a forecast on the ISO’s website.15 Air regulators may need some assistance from ISO staff experts to interpret this data, especially in terms of understanding the extent to which state EE policies and programs are already embedded in the forecast.16
Strengths and LimitationsISO forecasts may have some of their own advantages for
air regulatory usage:• Because the ISOs have legal responsibilities related to
electric reliability, they work very closely with utilities on a daily basis. Their forecasts should be viewed with at least as much credibility as those of the EIA.
• ISO forecasts typically present a more granular picture of geographic variations in load growth than the EMM forecasts developed by the EIA.
• Some ISO forecasts present monthly data that will be more useful to air regulators than the annual data in the AEO.
There are also some limitations to the usefulness of ISO forecasts:
• ISOs are not governmental entities, and they may not always operate with quite the same level of transparency and openness as a government agency like the EIA.17 Even where the ISO provides all of the necessary data and documents on its website, air regulators should anticipate the need for at least
some level of interaction and consultation with ISO staff experts in order to understand how the data and documentation were compiled and what assumptions were used.
• Each ISO will have its own methods, its own terminology, its own timetables, and its own website layout. All of this complicates the efforts of air regulators to obtain the data they need, especially if their state is served by more than one ISO.
• Because ISOs tend to focus on the adequacy of system resources to meet peak demand, their forecasts tend to focus primarily on peak demand (measured in megawatts [MW] or gigawatts) rather than energy consumption (measured in MWh or gigawatt-hours [GWh]). Air regulators may find that they have to dig a little deeper to find the energy consumption data that are ultimately more relevant for assessing air quality impacts.18
• ISO forecasts will have some of the same limitations as AEO forecasts. For example, they may not reflect the impacts of all the state and local EE policies and programs within their region, and seasonal variations that may be significant for air quality impacts generally won’t be available.19
SummaryAir quality regulators should be able to use ISO forecast
data as an alternative, or even the primary, starting point for Step 1 (developing a baseline energy forecast). Although ISOs strive to account for the impacts of federal, state, and local EE policies and programs, their methods and
15 Links to all of the ISO websites can be found at http://www.isorto.org/site/c.jhKQIZPBImE/b.2604455/k.C323/Members.htm.
16 ISO New England and PJM Interconnection have also instituted mandatory, long-term capacity markets to ensure the adequacy of future electrical capacity. EE is allowed to compete on an equal footing with generation capacity in these markets, and the results of capacity market auctions provide another data source on EE demand savings. These data, however, are much more challenging for air regulators to use because it is difficult to translate demand savings (e.g., in MW) to energy savings (in MWh), which is necessary for estimating avoided emissions. It is also difficult to determine whether any of the EE demand savings in the capacity market results are incremental to what was already included in the ISO’s load forecast.
17 For example, some ISOs maintain detailed information on the availability and use of backup diesel generators for responding to emergency or economic conditions in the wholesale electricity market, but cannot release this proprietary information to outside parties.
18 Once again using PJM as an example, the 2012 Load Forecast Report does not present any data on energy consumption (in gigawatt-hours) until page 74 of an 83-page report.
19 Each ISO has its own forecasting methods, and they vary in the degree to which they document their input assumptions. Air regulators will have to review the available documentation and may also have to consult with ISO forecasters to determine which state and local EE policies are embedded in the forecast.
16
Quantifying the Air Quality Impacts of Energy Efficiency Policies and Programs
level of documentation vary from one ISO to the next. Air regulators may need to work with the ISO to finish Step 2 in the quantification process (determining which EE policies and programs are already embedded in the forecast). Finally, at least one ISO (ISO New England) has developed a forecast of incremental energy savings from state and local EE policies and programs (Step 3) that is separate from its standard load forecast.
3.1.3. Utility Plans and Forecasts
In the United States, customers are served by three kinds of utilities: investor-owned utilities (IOUs) that seek to make profits, publicly-owned utilities (e.g., municipal electric utilities), and member-owned utilities (e.g., rural electric cooperatives). All utilities develop plans and forecasts that may contain useful information for air quality regulators. However, because utility regulation is primarily a state rather than federal function, there is variation from state to state in terms of how utilities are regulated, what kinds of plans and forecasts they are required to develop, and whether those plans and forecasts are publicly available.20
In general, IOUs are closely regulated by state PUCs to ensure that the public interest is served, and they are the focal point of most mandatory state requirements in the utility sector. The state PUC will usually have a wealth of information about the IOUs it regulates, and much of this
information will be publicly available. Publicly-owned utilities are typically not comparably regulated by the PUC, but as governmental entities their forecasts and planning data will also be publicly accessible in most cases. Member-owned utilities are generally assumed to operate in their members’ interest; in most states they are not regulated by the PUC in the same way IOUs are regulated and their plans and forecasts may not be publicly available.
Air regulators in most states will find at least one of two common venues for obtaining utility forecast and plan-ning data from their state PUC. The first common venue is an EE program planning proceeding, as described in Section 3.1.3.1. The second venue is an integrated resource planning proceeding, as described in Section 3.1.3.2. Although it is beyond the scope of this report to discuss every variation in every state, each type of proceeding is discussed in detail below, with an emphasis on the methods applicable in a majority of states. In addition, Section 5 explains the importance of collaboration between air quality regulators and PUCs on these matters and offers several suggestions for productive interaction.
3.1.3.1. EE Program Plans
Description and Relevance to Air RegulatorsIn most states, electric utility ratepayer funds are
invested in EE using a delivery structure that has been established by state statute, state regulation, or PUC order (see Figure 3). Where these requirements exist, they normally apply to IOUs and sometimes apply to publicly owned or member-owned utilities.
In the states that require utilities to invest ratepayer money in EE, the PUC typically approves multiyear EE budgets, savings goals, and program plans within the context of one or more EE program planning dockets.21 In states where utilities administer the EE programs, each
Example: ISO New EnglandIn December 2012, ISO New England published
its first long-term EE forecast, which supplements its more traditional load forecast. A presentation on the ISO’s Final Energy-Efficiency Forecast: 2015–2021 is available at http://www.iso-ne.com/committees/comm_wkgrps/othr/enrgy_effncy_frcst/frcst/iso_ne_ee_forecast_2015_2021.pdf.
This forecast was created by assessing the incremental impacts of the utility EE budgets that have been approved by the PUC in each New England state. The data and the methods were vetted by stakeholders and refined based on public comments. For each year from 2015 through 2021, the forecast provides an estimate of incremental EE savings for each state and for the region as a whole, as shown below. The ISO intends to update the forecast annually.
20 Air quality regulators may be able to obtain confidential information through their normal authorities, but that always introduces complications as compared to publicly available data.
21 PUCs operate as quasi-judicial bodies. The PUC will typically “open a docket” for each contested case that comes before it for a decision. The docket serves as the repository for all testimony, exhibits, hearing transcripts, and the like, related to the case. The PUC ultimately makes a decision in each case based on the evidence in the docket.

17
Quantifying the Air Quality Impacts of Energy Efficiency Policies and Programs
affected utility will propose a budget and plan to the PUC. Other parties (including, potentially, air quality regulators) may introduce testimony and evidence regarding the utility’s proposal, and ultimately the PUC will issue an order approving some final budget and final plan for EE programs. In states that have EE programs administered by state government or a third party, a single budget and a single plan will be similarly developed and approved for the entire state. The PUC may establish EE program evaluation (EM&V) methodologies within the context of an EE program planning docket, or it may do so in a separate docket focused solely on evaluation issues.
The data in an EE program plan can be extremely useful for air quality regulatory purposes. Most important, these plans will include projections of annual energy savings (and peak demand savings) for multiple future years. Some
plans will also indicate the forecasted energy sales with and without EE program implementation, which can be useful for comparing to other forecasts of future load such as those mentioned previously. In some states EE program plans will also project avoided emissions. If the methods are documented and suitably rigorous, this may provide the air regulator with a shortcut to the data of greatest interest.
There is no central repository for EE program plans. Air regulators will have to search their PUC’s website for this information, or contact PUC staff. Links to all of
Figure 3
EE Delivery Structure for Electricity Programs (as of 2009)22
AL
AZ
AR
CA CO
CT
DE
FL
GA
ID
IL IN
IA
KSKY
LA
ME
MD
MA
MI
MN
MS
MO
MT
NENV
NH
NJ
NM
NY
NC
ND
OH
OK
OR
PA
RI
SC
SD
TN
TX
UT
VT
VA DC
WA
WV
WIWY
HI
AK
Utility Administration
Third-Party Administration
No De�ned Delivery Structure or No Active ProgramsState Government
Federal Government (in states where at least 1/3 of the land area is served by the federal government)
22 Regulatory Assistance Project. (2011). Who Should Deliver Ratepayer-Funded Energy Efficiency? A 2011 Update. Available at: http://www.raponline.org/document/download/id/4707). Some states also require gas utilities to invest in EE (not shown).

18
Quantifying the Air Quality Impacts of Energy Efficiency Policies and Programs
the PUC websites are conveniently available from the National Association of Regulatory Utility Commissioners at http://www.naruc.org/Commissions/.
Strengths and LimitationsThe greatest advantages of using EE program plans for
air regulation purposes are:• The data are specific to well-defined geographic
territories (a utility’s service territory or an entire state).• The projections are backed up by approved budgets
and funding sources, and all of the estimates are vetted by utilities, energy regulators, and other stakeholders. These are not mere projections or forecasts of hoped-for energy savings—they are plans for how to make it happen, and the PUC is ordering some party to implement the plan.
• Because these plans spell out the specific EE measures that will be implemented, air regulators may be able to find helpful information on the time of day and seasonality of energy savings. For example, we know that air conditioner programs will save energy mostly on hot summer days, whereas a refrigerator program will save energy every hour of the year. It is increasingly common, thanks to improved methods and software, for EE program plans to include detailed estimates of seasonal or even hourly energy savings.
• EE planning and evaluation dockets may present opportunities, as detailed in Section 5 of this report, for air regulators to contribute to and benefit from better data and outcomes.
There are also some challenges and limitations to using EE program plans, as with all of the other data sources described in this report:
• In many states, some, but not all, utilities are required to implement EE programs and publicly disclose their plans. For an air quality regulator tasked with developing statewide plans, this means that EE program plans may or may not paint a complete picture of statewide activity.
• On the other hand, while some states only have one utility developing EE program plans, in other states the air quality regulator might face the time-consuming task of aggregating data from multiple utility plans. For example, in Florida there are five IOUs and two municipal electric utilities that separately file EE program plans.
• There can also be issues with timing, because the future years covered in EE program plans may vary from one utility to the next, depending on when the most recent plan was approved.
• Another issue with EE program plans that may prove challenging for air quality regulators is the variety of ways in which energy savings can be estimated, and the accompanying jargon. Air regulators may need to understand the differences between “gross” energy savings and “net” energy savings, for example, and read EE program plans very carefully to understand exactly what kinds of values are being reported.23 The state PUC will in most cases ensure that consistent methods are used across the utilities within its jurisdiction, but air regulators may at times find that there are discrepancies that make aggregation of the results from more than one plan difficult, especially if looking at plans from utilities not regulated by the PUC.
SummaryEE program plans are helpful for Steps 2 and 3 in the
quantification process (determining which EE policies and programs are already embedded in the forecast, and then identifying any incremental energy savings). The air regulator would need to compare the documented assumptions in the baseline energy forecast they have selected with the EE program plan(s) to determine if the expected impacts of the plan(s) are already embedded in the forecast.24 This can be particularly tricky, because load forecasts are often based on historic sales growth rates and
23 In simple terms, “gross” energy savings represents the total amount of energy saved by participants in an EE program through actions targeted by the program. “Net” energy savings is an adjustment to the gross amount, to reflect the fact that some participants might have saved some amount of energy through similar actions even if the EE program were not offered, or they might have been inspired by the EE program to save energy in other ways that had nothing to do with the targeted actions.
24 For example, if the state has a policy requiring utilities to achieve a specified level of energy savings each year, the impacts of an EE program plan (if it is designed to meet that requirement) may not be incremental to what’s already in the forecast. On the other hand, the energy savings from an EE program in a state that doesn’t have EE requirements built into the forecast would be incremental.

19
Quantifying the Air Quality Impacts of Energy Efficiency Policies and Programs
those rates were affected by historic EE program results. In other words, if a load forecast for a state predicts slow growth because the state has historically had effective EE programs, then some of the results of future EE programs are essentially built into the forecast already. One possible approach to this dilemma is to compare the utility’s forecast of electricity sales growth after EE programs are implemented to the growth rate assumed in the air regulator’s power sector baseline projection to see if there are incremental energy savings. Finally, some EE program plans will forecast not just energy savings but also avoided emissions (Step 4). Although the same caveats apply about determining how much of the impact is incremental,
this can be incredibly useful to the air regulator if the quantification methods are sound and well documented.
3.1.3.2. IntEgratEd rEsourcE Plans
Description and Relevance to Air RegulatorsIn more than half of all states, electric utilities are
required to periodically file an integrated resource plan (IRP) with the PUC (see Figure 4).25 As defined in the federal Energy Policy Act of 1992, integrated resource planning means:
“...a planning and selection process for new energy resources that evaluates the full range of alternatives,
Alabama
ArizonaArkansas
Colorado
Delaware
Georgia
Idaho
Illinois Indiana
Iowa
Kansas
Kentucky
Louisiana
Maine
Maryland
Minnesota
Mississippi
Missouri
Montana
NebraskaNevada
NH
MA
New Jersey
New Mexico
New York
North Carolina
NorthDakota
Oklahoma
Oregon
Rhode Island
SouthCarolina
SouthDakota
Tennessee
Utah
VT
CT
Virginia
Washington
WestVirginia
Wyoming
Alaska
Hawaii
California
Florida
Michigan
Ohio
Pennsylvania
Texas
Wisconsin
State has an IRP rule and filing requirement
State is developing or revising an IRP rule and filing requirement
State has a filing requirement for long-term plans
State does not have filing requirements for long-term plans
Figure 4
State IRP Rules and Filing Requirements26
25 As Figure 4 indicates, some states do not require utilities to file an IRP but do have some alternative long-term planning requirements. These alternatives do not always require consid-eration of EE as a resource. The discussion in the remainder of this section is meant to summarize typical IRP processes only.
26 Wilson, R. and Biewald, B. Best Practices in Electric Utility Integrated Resource Planning. Synapse Energy Economics, prepared for the Regulatory Assistance Project, June 2013. Available at: http://www.raponline.org/document/download/id/6608.

20
Quantifying the Air Quality Impacts of Energy Efficiency Policies and Programs
including new generating capacity, power purchases, energy conservation and efficiency, cogeneration and district heating and cooling applications, and renewable energy resources, in order to provide adequate and reliable service to its electric customers at the lowest system cost. The process shall take into account necessary features for system operation, such as diversity, reliability, dispatchability, and other factors of risk; shall take into account the ability to verify energy savings achieved through energy conservation and efficiency and the projected durability of such savings measured over time; and shall treat demand and supply resources on a consistent and integrated basis.”27
Utilities in these states are generally required to develop plans that look 10 to 20 years into the future and are required to file updated plans every two to three years. In some states, these plans are filed by the utility and may or may not even be reviewed by the PUC. In other states, an IRP docket is opened, other parties are provided an opportunity to review and comment on the plan, and
the PUC may request or order modifications to the plan. Numerous examples of utility IRPs can be found on state PUC websites.
A well-crafted IRP can sometimes provide all of the EE data that an air quality regulator needs in one document. Because the IRP is a resource plan designed to identify the best way to meet future demand, it begins with a baseline load forecast that generally does not include any embedded utility-funded EE program impacts. (The impacts of some federal and state EE measures, such as national appliance efficiency standards, normally are included in this forecast.) Through a potential study (discussed in Section 3.1.5) or other means, the planners then identify technically feasible EE measures, how much energy they could save, and at what cost. Ideally, these EE measures are then allowed to “compete” with existing and new electric generators, with sophisticated models used to determine the optimal mix of resources for serving customers while meeting all regulatory requirements—including environmental requirements.28 At the end of the process, a well-crafted plan will identify how much EE (in the form of energy savings) is in the resource portfolio for each future year, and what the adjusted load forecast is. Some plans may also quantify the avoided emissions attributable to EE.
Strengths and LimitationsIRPs have some of the same advantages of EE program
plans, and a few other advantages worth mentioning: • The data are specific to well-defined geographic
territories (e.g., a utility’s service territory).• In many cases the forecasts of demand and energy
savings are vetted by energy regulators and other stakeholders.
• In some states, statutory requirements for EE are treated as a starting point for analysis, but not the ending point. Although those states require utilities to achieve a certain level of energy savings, the IRP will include that level of savings in the resource portfolio
27 Energy Policy Act of 1992, §111(d)(19). Text available at: http://www.ferc.gov/legal/maj-ord-reg/epa.pdf
28 This ideal is usually not realized in current practices. Most IRPs simply assume an EE trajectory, or range of trajectories, that the utility believes can be achieved or attained. The IRPs that allow efficiency to compete as a resource on par with new generation are currently an exception to the rule.
An Exception to the Rule: Multi-State IRPsAlthough resource planning is generally done at
the utility level, there are also noteworthy examples of regional IRPs. The first such example is a result of the federal Pacific Northwest Electric Power Planning and Conservation Act of 1980, which requires a regional planning organization called the Northwest Power and Conservation Council to develop IRPs for the Bonneville Power Administration. These plans have a profound effect on the operations of the Bonneville Power Administration in Washington, Oregon, Idaho, and Montana, and by extension affect the operation of utilities in those states.
The second notable example comes from the Tennessee Valley Authority, a federally owned corporation that sells wholesale and retail electricity in seven states. The IRPs developed by the Tennessee Valley Authority directly affect energy consumption and air emissions in those seven states, and indirectly affect the operation of other utilities.
The most recent IRPs from the Northwest Power and Conservation Council and the Tennessee Valley Authority are available at http://www.nwcouncil.org/energy/powerplan/6/default.htm and http://www.tva.gov/environment/reports/irp/, respectively.
21
Quantifying the Air Quality Impacts of Energy Efficiency Policies and Programs
at a minimum. But the analysis may also consider whether additional energy savings through EE should be part of the portfolio.
• Compared to other data sources, an IRP may provide a more explicit “before and after EE” picture of energy consumption.
• The modeling that supports the IRP will typically consider a wide variety of factors that could impact the results, sometimes including different scenarios for future environmental regulations. So, for example, one might find that modeling runs looked at how the optimal resource mix would change if more stringent air pollution standards were promulgated. Such a modeling run might provide useful information to air regulators, especially if comparable regulations were adopted after the IRP was finalized.
• Most IRPs allow for some form of stakeholder input before the plan is finalized. Section 5 of this report details some of the opportunities for air regulators to contribute to and benefit from better IRP data and outcomes.
Air quality regulators should be aware of the most significant limitation of IRPs, as well:
• IRPs are not binding on the utility. States require IRPs to ensure that utilities will look and plan far into the future, but they stop short of requiring the utility to actually do what is in the plan. Other proceedings—such as the EE program planning dockets described previously, dockets related to building or acquiring new generation assets, and dockets related to modifying existing generation assets—are where actual resource decisions get reviewed by the PUC, approved, and implemented.
• IRPs tend to be massively complicated, detailed, and data-driven exercises. For the air quality regulator, this means that a wealth of useful data may be available, but it also means that accessing the data could require a substantial investment of time and learning.
• The modeling inputs and the models themselves will not always be transparent, and may even include confidential information.
• In most states, IRPs are updated only every other year or every third year—less frequently than the AEO or ISO load forecasts.
SummaryAn IRP may provide the answers to all four steps in the
quantification process, but that is the exception rather than the rule. Typically only the first three steps are well covered. The quantification steps can be blurred, however, because some IRPs include all of the planned EE programs in the baseline energy forecast, whereas others treat EE programs as incremental to the baseline forecast.
3.1.4. Other State PUC Reports, Dockets, and Filings
In addition to receiving EE program plans and IRPs, state PUCs adjudicate other types of cases and produce reports that may provide data that would be of interest to the air regulator, particularly with respect to load forecasts. Some of these have been alluded to previously, whereas others have not. The most likely and significant of these other possibilities are worth a brief mention, but the details vary from state to state and are beyond the scope of this report:
• As mentioned previously, some states require utilities to file long-term plans that fall short of what might be called an IRP. These plans will include forecasts of expected future load, but are less likely than an IRP to include forecasts of energy savings or analysis of different environmental regulatory scenarios.
• When utilities want to increase the rates they charge customers, they file a rate case with the PUC. The documentation supporting a rate case may provide another source (or in some cases the only source) for utility-specific forecasts of future load and emissions.
• Utilities also introduce load and emissions forecasts as evidence in some proceedings related to the acquisition of new resources, particularly new generation or transmission assets, or proceedings related to the modification of existing resources (such as permission to build pollution controls in response to environmental regulations).
• More than half of all states have enacted mandatory RPS requirements. In these states, some or all electric utilities are required to serve a percentage of customers’ needs with renewable energy (see Figure 5). Because these requirements are almost always based on customer load, PUC proceedings related to renewable energy requirements will frequently include long-term load projections. In addition, some of these

22
Quantifying the Air Quality Impacts of Energy Efficiency Policies and Programs
Arizona: 15% by 2025
California: 33% by 2020
Colorado: 30% by 2020 (IOUs), 10% by 2020 (co-ops and large munis)*
Connecticut: 27% by 2020
Delaware: 25% by 2026*
Hawaii: 40% by 2030
Illinois: 25% by 2025
Indiana: 10% by 2025†
Iowa: 105 MW
Kansas: 20% by 2020
Maine: 30% by 2000. New RE: 10% by 2017
Maryland: 20% by 2022
Massachusetts: 22.1% by 2020. New RE: 15% by 2020 (plus 1% annually thereafter)
Michigan: 10% and 1,100 MW by 2015*
Minnesota: 25% by 2025 (Xcel: 30% by 2020)
Missouri: 15% by 2021
Montana: 15% by 2015
Nevada: 25% by 2025*
New Hampshire: 24.8% by 2025
New Jersey: 20.38% RE by 2021 plus 4.1% solar by 2028
New Mexico: 20% by 2020 (IOUs), 10% by 2020 (co-ops)
New York: 29% by 2015
North Carolina: 12.5% by 2021 (IOUs), 10% by 2018 (co-ops and munis)
North Dakota: 10% by 2015
Ohio: 12.5% by 2024
Oklahoma: 15% by 2015
states allow energy savings from EE programs to count toward compliance with the RPS requirement. In this subset of states, one may find that projections of future energy savings are also included in RPS-related filings and reports.29 Renewable energy also avoids
some or all air pollutant emissions.In conclusion, each PUC will almost certainly have
at least one load forecast for all the utilities it regulates, and may have multiple forecasts developed at different times for different purposes. Air regulators are advised to
Figure 5
State Renewable Portfolio Standard Requirements30
29 states, Washington DC, and two U.S. Territories have renewable portfolio standards. Eight states and two territories have renewable portfolio goals.
Alabama
ArizonaArkansas
Colorado
Delaware
Georgia
Idaho
Illinois Indiana
Iowa
Kansas
Kentucky
Louisiana
Maine
Maryland
Minnesota
Mississippi
Missouri
Montana
NebraskaNevada
NH
MA
New Jersey
Washington DC
New Mexico
New York
North Carolina
NorthDakota
Oklahoma
Oregon
Rhode Island
SouthCarolina
SouthDakota
Tennessee
Utah
VT
CT
Virginia
Washington
WestVirginia
Wyoming
Alaska
Hawaii
California
Florida
Michigan
OhioPennsylvania
Texas
Wisconsin
Oregon: 25% by 2025 (large utilities)* 5% - 10% by 2025 (smaller utilities)
Pennsylvania: ~18% by 2021†
Rhode Island: 16% by 2020
South Dakota: 10% by 2015
Texas: 5,880 MW by 2015*
Utah: 20% by 2025*
Vermont: 1.) RE meets any increase in retail sales by 2012; 2.) 20% RE and CHP by 2017
Virginia: 15% by 2025*
Washington: 15% by 2020*
Washington DC: 20% by 2020
West Virginia: 25% by 2025*†
Wisconsin: varies by utility; ~10% by 2015 statewide
U.S. Territories:Northern Mariana Islands:
80% by 2015
Puerto Rico: 20% by 2035
Guam: 25% by 2035 (goal)
US Virgin Islands: 30% by 2025 (goal)
Renewable portfolio standardRenewable portfolio goalSolar water heating eligible
Minimum solar or customer-sited requirementExtra credit for solar or customer-sited renewablesIncludes non-renewable alternative resources
*†
29 Although it is beyond the scope of this report, it bears mentioning here that renewable generation policies and programs can also contribute to reduced future emissions from fossil fuel generators. Most of the methods and tools for estimating avoided emissions that are described in Section 4
of this report apply equally to EE or renewable energy.
30 Map based upon information from the Database of State Incentives for Renewables & Efficiency. Available at: http://www.dsireusa.org/documents/summarymaps/RPS_map.pdf

23
Quantifying the Air Quality Impacts of Energy Efficiency Policies and Programs
contact PUC staff to identify all of the available forecasts and discuss which are most current and appropriate for air regulatory purposes.
3.1.5. EE Market Potential Studies
Description and Relevance to Air RegulatorsA market potential study is a prospective, quantitative
assessment of the market potential for deploying EE. These studies are most often conducted by third-party EE technical experts under contract to a utility, PUC, or state energy office. They are occasionally produced independently by EE advocacy organizations.
Potential studies will frequently report separate estimates of technical potential, economic potential, and achievable potential. Technical potential indicates the energy savings that would occur if all customers adopted the most efficient measures and actions possible, regardless of cost. Economic potential is a subset of technical potential, reflecting the energy savings that would result if all customers adopted all cost-effective measures and actions. Finally, achievable potential is a subset of economic potential that takes into consideration practical and realistic limitations to full deployment of cost-effective EE, such as market barriers, customer preferences, and program budget constraints.31 These three types of potential are depicted graphically in Figure 6.32
Potential studies are generally not the right data source for quantifying the expected impacts of EE programs, because they describe what is possible rather than what is expected as a result of existing policies and programs. Air
quality regulators will usually find these studies to be of limited or no use, but there may be two exceptions to this general rule.
First and most important, air regulators may at times be interested in potential emissions reductions from EE, not just expected reductions, to facilitate comparisons with other pollution control strategies. The development of control strategies for a SIP frequently requires the regulator to consider new state regulations, or even statutory changes. In other words, policy changes are often called for, and the air regulator may want to compare the costs and benefits that might be achieved from a change in state EE policy to the costs and benefits of, for example, changes to mobile source control policies.
A second use for potential study data could arise in the small number of states that have adopted a binding policy requiring utilities to acquire “all cost-effective energy efficiency.” In these states, a potential study may in fact be the tool for determining what this requirement means in practice, as the study should reveal how much energy can be saved cost-effectively. However, final decisions about EE program budgets and savings targets in these states will generally be made by the PUC, with the potential study forming part of the decision-making record but not being the only factor considered. For this reason, air regulators in these states may find only limited value in potential studies, for example during the interval between when a potential study is published and when the PUC approves EE program budgets and savings goals.
Because potential studies may be developed by a variety of entities for a variety of clients, there is no single
31 Estimates of achievable potential are even more subjective than estimates of technical or economic potential. Stakeholders can and often do disagree on the “practical and realistic” limitations to full deployment of cost-effective EE. Many potential studies have concluded that it would not be “practical and realistic” to achieve savings at levels that are already being achieved in practice in leading states.
32 For more on potential studies, refer to Guide for Conducting Energy Efficiency Potential Studies, National Action Plan for Energy Efficiency. (2007). Available at: http://www.epa.gov/cleanenergy/documents/suca/potential_guide.pdf
33 Guide to Resource Planning with Energy Efficiency, National Action for Energy Efficiency. (2007) Figure 2-1, page 2-2. Available at: http://www.epa.gov/cleanenergy/documents/suca/resource_planning.pdf
Not technically feasible
Not technically feasible
Not costeffective
Not costeffective
Limitations to full deployment
Not technically feasible
Technical Potential
Economic Potential
Achievable Potential
Figure 6
Schematic Showing Different Meanings of EE “Potential” 33

24
Quantifying the Air Quality Impacts of Energy Efficiency Policies and Programs
place where an air regulator can be sure to find such studies. The state PUC or state energy office will generally know if a recent study has been completed, and where to obtain a copy if the results are publicly available. Utilities may have potential studies that are not publicly available, but air regulators should be able to obtain this information if it is necessary for regulatory purposes. Finally, any potential studies developed by or on behalf of an advocacy organization will generally be available from the organization’s website. The American Council for an Energy-Efficient Economy (ACEEE) would be one place to look (http://aceee.org/), as would local and regional EE alliances (e.g., the Northeast Energy Efficiency Partnerships at http://neep.org/).
Strengths and LimitationsAside from their limited usefulness for air regulatory
purposes, potential studies have a couple of notable strengths and limitations.
• One advantage potential studies have over some other data sources is that they sometimes offer insights or even detailed information about the time-varying or seasonal nature of EE measure impacts that could be useful for air modeling or regulatory purposes.
• Potential studies that look at statewide savings potential or potential across a multistate region may obscure geographic differences in energy savings potential, especially for studies covering more than one climatic zone or more than one “airshed.”
SummaryEE market potential studies provide information that is
useful for Step 3 of the quantification process (identifying the potential for incremental energy savings). Some of these studies also estimate potential avoided emissions (Step 4). However, it can be somewhat tricky to determine if all of the potential energy savings and avoided emissions would truly be incremental to the baseline energy forecast. This is because potential studies vary in terms of whether and how they include the potential energy savings from existing EE policies and programs that might already be embedded in the air regulator’s baseline energy forecast and emissions projection.
3.2. Energy Savings Reports
Description and Relevance to Air RegulatorsAir regulators understand that it isn’t enough to predict
the impact of policies and programs on future emissions; it is equally important after the fact to verify that the expected results occurred and to modify policies and programs as necessary based on the results. In the EE world, that kind of analysis is called EM&V. EM&V refers to a retrospective analysis of the impacts of EE programs that have already been implemented. The analysis typically estimates energy savings and peak demand reductions, as well as economic costs and benefits. Some evaluations also estimate avoided emissions. EE program evaluations are most often done by a third-party contractor working for a utility, PUC, or state energy office.
Estimates of energy savings can be made based on actual on-site measurements, by formulas, or by statistical methods. Where formulas are used, results may be verified through on-site visits or audits. Technical reference manuals (TRMs) are a common tool used to promote high-quality EM&V. A TRM provides documentation of the standard values or formulas that are used to estimate energy savings attributable to specific EE measures and programs. For example, the TRM might provide a value or formula for estimating the energy savings from a program that promotes efficient clothes washers. Many (but not all) states with EE policies have formally adopted a TRM to bring consistency and predictability to the EM&V process. Air quality regulators might think of these manuals as analogous to the EPA’s AP-42 Emission Factor manuals. They provide a way to make consistent, credible estimates of energy savings without having to measure every single efficiency action taken by every individual. There is also a continual improvement aspect to these methods. As part of the larger EM&V process, data are adjusted in the TRM after audits are completed and methods become more accurate over time.
In most states, utilities (and/or other entities that administer EE programs) are required to aggregate the evaluation results from all of the EE programs they offer into annual energy savings reports. Many states require that these reports be scrutinized and verified by an independent evaluator and even, in some cases, by other parties in a docketed proceeding. These energy savings reports will normally be far more useful to the air regulator than

25
Quantifying the Air Quality Impacts of Energy Efficiency Policies and Programs
individual program evaluations.Because air regulators already have data on past energy
consumption and past actual emissions, data on past avoided emissions may seem unnecessary, and the value of energy savings reports may seem dubious. However, EM&V data are of value to an air regulator for at least two reasons. First, if a state has previously included EE policies and programs in a SIP, the energy savings reports will provide evidence that the expected energy savings and emissions reductions actually happened. Second, the retrospective EM&V data lead to insights and improved methods for doing potential studies, for prospectively estimating the future impacts of EE policies and programs, and for implementing more effective programs. In other words, the biggest value of EM&V data to an air regulator may not be found in the energy savings results, but rather in the fact that the EM&V process brings legitimacy, accountability, and continual improvement to the estimation methods.
Because energy savings reports are typically prepared in response to a policy requirement, the state PUC or state energy office will generally know if any such reports are available, and where to obtain a copy. TRMs will also generally be available from these sources, wherever such a manual has been created. Some examples of energy savings reports, evaluation reports, and TRMs can be found at the following websites:
• California Measurement Advisory Council (http://www.calmac.org/search.asp);
• Consortium for Energy Efficiency’s Market Assessment and Program Evaluation Clearinghouse (http://www.cee1.org/eval/clearinghouse.php3);
• Northeast Energy Efficiency Partnerships EM&V Forum (http://neep.org/emv-forum/emv-library/research-evaluation-studies); and
• Northwest Power & Conservation Council Regional Technical Forum (http://www.nwcouncil.org/energy/rtf/measures/).
Strengths and LimitationsEE program evaluation can be extremely complex, and it
is generally undertaken by one of a relatively small number of companies and experts that specialize in this subject. Many states require evaluations to be done by a third-party EM&V contractor who answers directly to a state agency, not a utility, in order to ensure that the results are viewed as unbiased and legitimate. Any oversight of the process will normally fall to
the PUC or state energy office, not the air regulator.Although air regulators may not consider EM&V data to
be as accurate or reliable as continuous emissions monitoring data, the estimates presented in evaluation reports and energy savings reports are not mere guesswork or wishful thinking. Program evaluations have been conducted for several decades and in nearly every state and municipality that has made a significant public investment in EE. In its 2011 survey of EE program administrators, the Consortium for Energy Efficiency found that 3.6 percent of total EE budgets (on average) were allocated to EM&V activities. This amounted to over $180 million budgeted for EM&V among the program administrators that responded to the survey.34
In general, air regulators may wish to become familiar with EM&V methods, but should not expect—and don’t need—to become experts on this subject. What is more important is that the air regulator knows in a general way how evaluation is conducted35 and where to find the energy savings reports. With time, the air regulator will hopefully gain an appreciation for the analytical rigor that underlies EM&V, and with that appreciation gain confidence in the estimates of energy savings and avoided emissions. The estimation methods truly are rigorous, they are improving with practice, and they are becoming more consistent over time.
SummaryEnergy savings reports look retrospectively at the results
of implemented programs. Their primary use to energy regulators is that they can verify, after the fact, whether the expected impacts of EE policies and programs (including avoided emissions) were achieved. These reports also inform the development and refinement of the methods that are used in EE program plans, IRPs, and EE market potential studies to assess the future impacts of EE efforts.
34 Consortium for Energy Efficiency 2012. (2011). State of the efficiency program industry: budgets, expenditures, and impacts. p 27. Available at: http://www.cee1.org/files/2011%20CEE%20Annual%20Industry%20Report.pdf
35 For details on evaluation methods, including a 17-page chapter on methods for estimating avoided emissions, refer to Energy Efficiency Program Impact Evaluation Guide, State and Local Energy Efficiency Action Network. (2012). Available at: http://www1.eere.energy.gov/seeaction/pdfs/emv_ee_program_impact_guide.pdf

26
Quantifying the Air Quality Impacts of Energy Efficiency Policies and Programs
36 Although this report focuses on emissions avoided through renewable energy deployment, the calculation methods are similar to some of the methods applicable to EE.
4. Methods and Tools for Assessing Emissions Reductions Attributable to EE
As we have seen, some of the EE data sources of greatest interest and usefulness to air regulators make estimates of avoided emissions, whereas others provide only a forecast of energy
consumption and/or energy savings. If avoided emissions data are available, air quality regulators will want to know how the estimates were made in order to assess their legitimacy. But if such data are not available, the air regulator will need to be able to translate forecast or energy savings data into estimates of avoided emissions. In this section, we will briefly summarize the most common methods for doing so, make note of some available databases and quantification tools for applying those methods, and provide a few examples. But this summary is not intended to stand alone as a guide to assessing avoided emissions attributable to EE. For a more complete and detailed look at this topic, readers should consult the following excellent reference documents:
• Energy Efficiency Program Impact Evaluation Guide. State and Local Energy Efficiency Action Network (2012). (http://www1.eere.energy.gov/seeaction/pdfs/emv_ee_program_impact_guide.pdf);
• Roadmap for Incorporating Energy Efficiency/Renewable Energy Policies and Programs into State and Tribal Implementation Plans – Appendix I: Methods for Quantifying Energy Efficiency and Renewable Energy Emission Reductions. U.S. EPA. (2012). (http://www.epa.gov/airquality/eere/pdfs/appendixI.pdf);
• Assessing the Multiple Benefits of Clean Energy: A Resource for States. U.S. EPA. (2010). (http://www.epa.gov/statelocalclimate/documents/pdf/epa_assessing_benefits.pdf);
• Analysis of Indirect Emissions Benefits of Wind, Landfill Gas, and Municipal Solid Waste Generation. U.S. EPA. (2008). (http://cfpub.epa.gov/si/si_public_record_Report.cfm?dirEntryId=196528);36 and
• Methods for Estimating Emissions Avoided by Renewable
Energy and Energy Efficiency. Synapse Energy Economics. (2005). (http://www.synapse-energy.com/Downloads/SynapseReport.2005-07.PQA-EPA.Displaced-Emissions-Renewables-and-Efficiency-EPA.04-55.pdf).
4.1. Methods
In this section, we assume that the reader has developed estimates of incremental energy savings (i.e., completed the first three steps noted in the introduction to Section 3) using one or more of the available data sources, and now wishes to identify a method for estimating avoided emissions (or understand how a third party estimated avoided emissions). The three most widely used methods are presented in Sections 4.1.1 through 4.1.3 in order of increasing sophistication. The most significant strengths and limitations of each method are then summarized in Section 4.2.
4.1.1. Average Emissions Method
The first method for estimating avoided emissions is to use an emission factor approach based on the average emissions resulting from one unit of energy consumption. This method is simple and ideal for screening purposes (i.e., to quickly determine whether a more detailed analysis of EE impacts would be worth the air regulator’s time and effort).
For EE programs targeting natural gas consumption, the average emissions method is equivalent to the use of AP-42 emission factors, a familiar and widely accepted practice among air regulators. Considering the specific types of

27
Quantifying the Air Quality Impacts of Energy Efficiency Policies and Programs
equipment targeted by the EE program (e.g., residential gas furnaces), the air regulator can multiply the forecasted energy savings times an appropriate emission factor to estimate avoided emissions. This is the only method one is likely to use to estimate avoided emissions from direct (i.e., end-use) natural gas combustion EE measures.
For EE programs targeting electricity use, the concept is equally simple, but the use of an average emissions factor is inherently less accurate and the answers vary more geographically. This is because there are many different types of electric generating units connected to each grid, they vary widely in terms of the emissions produced from the generation of one unit of electricity, and it is difficult to determine which unit(s) will be displaced by efficiency. For this simple method, the annual emissions of all of the generators operating within a defined geographic area are divided by the aggregated annual net generation within the same area to get “system average” emissions rates. The use of an average emissions rate essentially assumes
for simplicity’s sake that when customers reduce their electricity use, say by 1 percent, the system operator will reduce the output of all generators by 1 percent. Variations on this approach are also possible. For example, one could use the average emissions rate of non-baseload generating units in lieu of the average of all generating units. This approach would be equivalent to assuming that all baseload generators are unaffected by EE, but all non-baseload generators will reduce their output by an equal percentage. This non-baseload approach is in fact preferred, because it is more representative of how the electric grid is actually managed.
Anyone planning to use the average emissions method should become familiar with the EPA’s Emissions & Generation Resource Integrated Database (eGRID), available at www.epa.gov/egrid/. For every power plant in the United States, eGRID compiles emission rate data (in pounds per MWh) for nitrogen oxides, sulfur dioxide, mercury, and greenhouse gases. Power-plant level data are aggregated
Figure 7
eGRID Subregions
This is a representational map; many of the boundaries shown are approximate because they are based on companies, not on strictly geographical boundaries. USEPA eGRID2010

28
Quantifying the Air Quality Impacts of Energy Efficiency Policies and Programs
to develop average emission rates for 26 subregions of the United States that are based on (but do not precisely match) the EIA’s EMM regions.37 The subregions used by eGRID are mapped in Figure 7. Table 1 is a reproduction of one of the eGRID summary tables.
As mentioned in Section 3.1.1, the EPA developed and published a preliminary assessment in 2011 of the incremental energy savings (relative to the AEO 2010 forecast) that are expected as a result of certain types of state EE policies. To illustrate how the average emissions
37 Aggregated data are also available for each state, but only in the form of input emission rates (lb/mmBTU) rather than output emission rates (lb/MWh). Because our goal is
to estimate the emissions avoided by a specified amount of energy savings (MWh), this state-level data is less useful than the EMM data.
Table 1
Year 2009 eGRID Subregion Output Emission Rates – Criteria Pollutants
AKGD ASCC Alaska Grid 2.5780 2.6289 0.9245 2.8168 2.8859 1.0102 2.4931 2.4833 1.0174
AKMS ASCC Miscellaneous 7.0928 6.4902 2.0701 19.9084 19.6707 5.8103 19.9536 19.7361 5.7536
AZNM WECC Southwest 1.5242 1.4210 0.6195 2.0424 1.8634 0.8243 0.8308 0.7754 0.3913
CAMX WECC California 0.4192 0.3530 0.1822 0.6186 0.5538 0.2703 0.3211 0.2138 0.0315
ERCT ERCOT All 0.7205 0.7131 2.2423 0.8783 0.8402 2.7335 0.6069 0.6647 0.7011
FRCC FRCC All 0.9820 0.9295 1.8936 1.0747 0.9992 1.9495 1.0765 1.0703 1.7372
HIMS HICC Miscellaneous 5.8374 6.3126 5.6020 7.4037 7.9379 7.1485 8.5263 9.0216 5.0550
HIOA HICC Oahu 2.3577 2.4240 4.6708 2.1547 2.2010 4.6777 2.7853 2.8779 4.0602
MROE MRO East 1.4831 1.4502 5.1268 1.8438 1.8212 6.5778 2.0351 2.0709 5.7008
MROW MRO West 2.3173 2.1287 4.1754 3.1566 2.9620 5.7842 3.2356 2.8892 5.7685
NEWE NPCC New England 0.5242 0.3851 1.4175 0.4724 0.3652 2.1776 0.6539 0.4892 2.1336
NWPP WECC Northwest 1.0421 0.9679 1.0465 2.2506 2.1974 2.2627 1.5014 1.5262 1.1596
NYCW NPCC NYC/Westchester 0.2792 0.2905 0.1030 0.3947 0.3981 0.0832 0.6110 0.6275 0.1427
NYLI NPCC Long Island 1.1310 0.9693 1.0030 1.0073 0.8631 0.9377 1.1701 1.0261 1.1133
NYUP NPCC Upstate NY 0.3954 0.4009 0.9849 1.0478 1.0882 2.7612 1.0146 1.0079 2.8584
RFCE RFC East 0.8130 0.7444 4.6048 1.3964 1.2574 8.3936 1.4034 1.3682 8.3013
RFCM RFC Michigan 1.7817 1.6643 6.1414 2.1062 2.0205 7.4002 1.9392 1.8064 6.6348
RFCW RFC West 1.3125 1.2124 5.9040 1.7621 1.6417 7.9461 2.0350 1.9049 9.3974
RMPA WECC Rockies 2.5904 2.6826 1.9264 2.8651 2.9579 2.1306 2.5876 2.7716 1.8331
SPNO SPP North 2.0516 1.9784 3.0467 2.5029 2.4021 3.7169 2.4208 2.3573 3.7787
SPSO SPP South 1.8969 1.8725 3.1267 2.1026 2.0393 3.4623 1.8995 1.8433 2.0357
SRMV SERC Mississippi Valley 1.0499 1.0890 1.5728 1.4621 1.4685 2.0981 1.2885 1.3880 0.9409
SRMW SERC Midwest 1.0075 0.9510 5.4733 1.2447 1.1849 6.7618 1.4657 1.3518 7.1515
SRSO SERC South 1.0616 1.0540 4.8534 1.3593 1.3101 6.3857 1.6058 1.5045 7.1426
SRTV SERC Tennessee Valley 1.0204 0.9608 3.2201 1.4811 1.3587 4.6941 1.5943 1.5495 5.7162
SRVC SERC Virginia/Carolina 0.6805 0.6545 2.1194 1.1616 1.1005 3.7710 1.3047 1.1950 5.0473
U.S. 1.1216 1.0557 3.0811 1.5708 1.4664 4.3841 1.4394 1.3908 4.1847
eGRID SubregionAcronym
Ozoneseason NOx
(lb/MWh)
Ozoneseason NOx
(lb/MWh)
Ozoneseason NOx
(lb/MWh)eGRID
Subregion NameNOx
(lb/MWh)NOx
(lb/MWh)NOx
(lb/MWh)SO2
(lb/MWh)SO2
(lb/MWh)SO2
(lb/MWh)
Total Output Emission RatesFossil Fuel Output
Emission RatesNon-Baseload Output
Emission Rates

29
Quantifying the Air Quality Impacts of Energy Efficiency Policies and Programs
method works, we can develop examples based on the non-baseload output emission rates in Table 1 and the EPA’s assessments of incremental energy savings in the year 2015, keeping in mind that those data are preliminary and are used here purely for illustrative purposes.38 These examples serve to underscore the fact that the impacts of EE vary geographically.
Example: IndianaThe EPA found that Indiana’s Energy Efficiency Resource
Standard will generate energy savings that are incremental to what is assumed in the AEO 2010 Forecast. Electricity sales in 2015 are expected to be 4,060 GWh (4,060,000 MWh) lower due to the policy. Indiana falls entirely within the “RFCW” subregion as shown in Figure 7.
Avoided NOx = 2.0350 lb/MWh * 4,060,000 MWh * (1 ton/2000 lb) = 4,131 tons
Avoided SO2 = 9.3974 lb/MWh * 4,060,000 MWh * (1 ton/2000 lb) = 19,080 tons
Example: WashingtonThe EPA similarly found that Washington’s Energy
Efficiency Resource Standard will generate 3,695 GWh (3,695,000 MWh) of incremental energy savings in 2015. Washington is in the “NWPP” subregion.
Avoided NOx = 1.5014 lb/MWh * 3,695,000 MWh * (1 ton/2000 lb) = 2,774 tons
Avoided SO2 = 1.1596 lb/MWh * 3,695,000 MWh * (1 ton/2000 lb) = 2,142 tons
4.1.1.1 subrEgIons sPannIng morE than onE statE
When a subregion spans multiple states, which is more often than not the case, the state air regulator must consider where the emissions will be avoided. In the example above, we found that Washington’s EE policy will avoid 2,774 tons of NOx emissions based on the non-baseload average emission rate. However, Washington is in a subregion that spans all or part of ten states, and it may be that some of the avoided emissions will occur at power plants in other states. Conversely, the EE policies of other states in the subregion might lead to avoided emissions at power plants in Washington. So how many tons of emissions will be avoided in Washington as a result of EE? The average emissions method is not well suited to answer this question. That is one of the method’s most significant limitations and one reason it is most appropriately used as an initial screening tool, rather than as part of a formal air quality planning analysis.
4.1.1.2 statEs sPannIng morE than onE subrEgIon
Another common scenario that complicates the use of an average emissions method can occur where a state spans more than one subregion. In that scenario, one needs to think about where within the state the EE policy or program applies. If all of the energy savings will be achieved in a part of the state that is entirely within one subregion, perhaps because only one utility is affected, then the emission factors for that subregion would be used in a manner identical to the examples above. Alternatively, if one has separate forecasts of energy savings for each utility, then the appropriate eGRID emission factors for each utility’s subregion can be applied based on the location of the utility’s service territory within the state. Finally, if one only has an estimate of statewide savings, one can choose to (1) apply the lowest emission factor from any subregion in the state to develop a conservative estimate of avoided emissions; or (2) apportion the total energy savings to subregions based on the portion of total statewide load that is in each subregion. We offer one example of this last option for illustrative purposes.
Example: HawaiiThe EPA found that Hawaii’s Energy Efficiency Resource
Standard will generate 980 GWh (980,000 MWh) of incremental energy savings in 2015. The island of Oahu is in the “HIOA” subregion, whereas the rest of the state is in the “HIMS” subregion. Approximately 75 percent of Hawaii’s electricity sales occur on Oahu, so we might assume that 75 percent of the Energy Efficiency Resource Standard savings will occur in the HIOA subregion.39
Avoided NOx (HIOA) = 2.7853 lb/MWh * 980,000 MWh * (1 ton/2000 lb) = 1,365 tons
Avoided NOx (HIMS) = 8.5263 lb/MWh * 980,000 MWh * (1 ton/2000 lb) = 4,178 tons
Avoided NOx (State Total) = 1,365 tons + 4,178 tons = 5,543 tons
38 As shown in Table 1, eGRID also provides ozone season non-baseload emission rates for NOx. To assess avoided NOx emissions during the ozone season, air regulators could estimate the portion of total annual energy savings that occurs during the ozone season and apply these emission rates.
39 This assumption is based on 2011 utility sales data from EIA. For an actual screening analysis in Hawaii or any other state, savings could be apportioned using EIA data, state PUC data, utility EE plans, and so on.
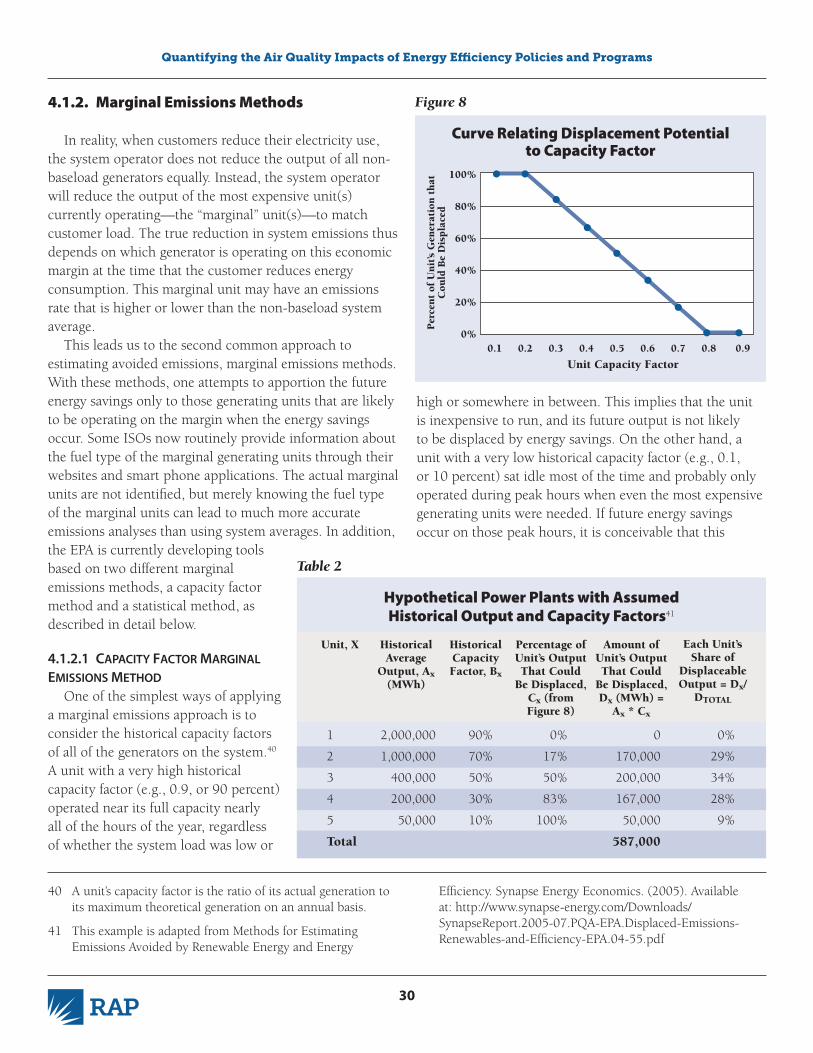
30
Quantifying the Air Quality Impacts of Energy Efficiency Policies and Programs
4.1.2. Marginal Emissions Methods
In reality, when customers reduce their electricity use, the system operator does not reduce the output of all non-baseload generators equally. Instead, the system operator will reduce the output of the most expensive unit(s) currently operating—the “marginal” unit(s)—to match customer load. The true reduction in system emissions thus depends on which generator is operating on this economic margin at the time that the customer reduces energy consumption. This marginal unit may have an emissions rate that is higher or lower than the non-baseload system average.
This leads us to the second common approach to estimating avoided emissions, marginal emissions methods. With these methods, one attempts to apportion the future energy savings only to those generating units that are likely to be operating on the margin when the energy savings occur. Some ISOs now routinely provide information about the fuel type of the marginal generating units through their websites and smart phone applications. The actual marginal units are not identified, but merely knowing the fuel type of the marginal units can lead to much more accurate emissions analyses than using system averages. In addition, the EPA is currently developing tools based on two different marginal emissions methods, a capacity factor method and a statistical method, as described in detail below.
4.1.2.1 caPacIty Factor margInal EmIssIons mEthod
One of the simplest ways of applying a marginal emissions approach is to consider the historical capacity factors of all of the generators on the system.40 A unit with a very high historical capacity factor (e.g., 0.9, or 90 percent) operated near its full capacity nearly all of the hours of the year, regardless of whether the system load was low or
40 A unit’s capacity factor is the ratio of its actual generation to its maximum theoretical generation on an annual basis.
41 This example is adapted from Methods for Estimating Emissions Avoided by Renewable Energy and Energy
100%
80%
60%
40%
20%
0% 0.1 0.2 0.3 0.4 0.5 0.6 0.7 0.8 0.9
Unit Capacity Factor
Per
cen
t of
Un
it’s
Gen
erat
ion
th
at
Cou
ld B
e D
isp
lace
d
Figure 8
Curve Relating Displacement Potential to Capacity Factor
high or somewhere in between. This implies that the unit is inexpensive to run, and its future output is not likely to be displaced by energy savings. On the other hand, a unit with a very low historical capacity factor (e.g., 0.1, or 10 percent) sat idle most of the time and probably only operated during peak hours when even the most expensive generating units were needed. If future energy savings occur on those peak hours, it is conceivable that this
Efficiency. Synapse Energy Economics. (2005). Available at: http://www.synapse-energy.com/Downloads/SynapseReport.2005-07.PQA-EPA.Displaced-Emissions-Renewables-and-Efficiency-EPA.04-55.pdf
Table 2
Hypothetical Power Plants with Assumed Historical Output and Capacity Factors41
1 2,000,000 90% 0% 0 0%
2 1,000,000 70% 17% 170,000 29%
3 400,000 50% 50% 200,000 34%
4 200,000 30% 83% 167,000 28%
5 50,000 10% 100% 50,000 9%
Total 587,000
Unit, X Historical Average
Output, Ax (MWh)
Historical Capacity Factor, Bx
Percentage of Unit’s Output That Could
Be Displaced, Cx (from Figure 8)
Amount of Unit’s Output That Could
Be Displaced, Dx (MWh) =
Ax * Cx
Each Unit’s Share of
Displaceable Output = Dx/
DTOTAL

31
Quantifying the Air Quality Impacts of Energy Efficiency Policies and Programs
42 Even without the EPA tool, it is possible to find capacity factor and emissions data from other sources noted in this report, and apply the capacity factor method. The tool will merely automate and simplify the data processing.
43 A presentation on the most recent marginal emissions analysis is available at http://www.iso-ne.com/committees/comm_wkgrps/prtcpnts_comm/eag/mtrls/2013/jul192013/meapp_071913_eag.pdf.
44 AVERT treats nuclear and renewable resources as if they are never on the economic margin, which for reasons beyond
unit will not operate at all. All of its generation could be displaced by energy savings.
Continuing with this kind of reasoning, the EPA developed a rule of thumb for estimating how much of the future output of a generating unit could potentially be displaced by energy savings. The amount depends on the historical capacity factor of the unit, as shown in Figure 8.
To illustrate how the capacity factor method works, we’ll use a simplified hypothetical case involving just five generating units, as depicted in Table 2.
Using the hypothetical set of power plants in Table 2, we would apportion 29 percent of the expected energy savings from an efficiency policy to Unit 2, 34 percent of the savings to Unit 3, 28 percent to Unit 4, and 9 percent to Unit 5. The actual emission factors for each unit would then be used to calculate avoided emissions. This method is obviously a little more complicated than the average emissions method, but it is also likely to be more accurate. And it is worth reiterating that the results can be significantly different, if the emission factors for the marginal units are significantly different from the average non-baseload emission factors for the same subregion.
The EPA has recently been working on a Power Plant Emissions Calculator, which was still in draft form as of the release of this report. This calculator will use data for each individual power plant in the United States to estimate avoided emissions using the capacity factor method. All of the necessary analysis of capacity factors will be built into the tool. All the user must do is enter annual energy savings data by eGRID subregion, and the tool will estimate and display the resulting avoided emissions at each affected individual power plant in the subregion.42 This is an improvement over the average emissions method, not just in the accuracy of the avoided emissions estimates but also because the geographic location of the avoided emissions is estimated.
4.1.2.2 statIstIcal/hourly margInal EmIssIons mEthod
Another way of applying a marginal emissions approach is to evaluate avoided emissions based on the historic hour-by-hour behavior of individual generating units in a region. Instead of using annual capacity factor data, this method uses historic hourly output of each generator and hourly demand for the entire system to derive the probability that each generator will be operating on the margin for any given level of system demand. These probabilities are then paired with historic hourly emissions data for each unit to estimate the emissions that will be avoided when future demand is reduced through EE. ISO-New England and the states served by that ISO have been leaders in developing marginal emissions methods. Their most recent marginal emissions analysis was completed in July 2013 and includes results for 2009 through 2011.43 Other states and ISOs may benefit from reviewing the ISO-New England studies and revising or replicating the analysis using local data.
In addition to the groundbreaking work being done by ISO-New England, the EPA is developing a new Avoided Generation and Emissions Tool (dubbed AVERT) that is based on a marginal emissions methodology and scheduled for public release in 2013. AVERT will be built upon a national database of historic hourly generation and emissions data for all fossil fuel-burning generators that have a rated capacity of 25 MW or greater.44 More specifically, the database will record all instances of when a unit was online and how much power it produced when online in a base year. AVERT will compare that information to the total regional fossil-fuel load, hour by hour, to predict which units will generate electricity and emit pollution at various regional load levels, and therefore which units will reduce emissions at different levels of load and load reduction.45
The purpose of AVERT is to make the statistical/hourly marginal emissions method simple. To estimate the avoided
the scope of this paper is generally an accurate assumption. Because the EPA does not collect emissions data for generators smaller than 25 MW, they are not included in this model.
45 A similar methodology is described in depth in Reducing Emissions in Connecticut on High Electric Demand Days (HEDD). Synapse Energy Economics. (2008). Available at: http://www.ct.gov/deep/lib/deep/air/energy/ct_hedd_report_06-12-08_12noon.pdf

32
Quantifying the Air Quality Impacts of Energy Efficiency Policies and Programs
emissions attributable to an EE policy or program, one will simply enter the expected energy savings for each hour of the year into AVERT. If hourly energy savings data are not available, one will be able to instead enter the expected annual energy savings and choose from a number of ways to apportion the annual savings to each hour of the year. AVERT will then seamlessly complete the complex statistical calculations described previously and present estimates of avoided emissions at the unit, county, state, and regional levels. Figure 9 illustrates one output of the AVERT model, graphically depicting where displaced NOx emissions are likely to occur from a hypothetical 2-percent load reduction in the service territory of the PJM Interconnection ISO.
4.1.3. Dispatch Modeling Method
The capacity factor and marginal emissions methods are inherently based on assumptions or predictions about which generating units will operate on the margin in the
Figure 9
Sample Output of AVERT ModelAnnual Change in NOx (lbs.) Great Lakes/Mid-Atlantic
future, based on what has happened in the past. Experience has shown that fuel commodity prices and other variables can greatly affect which units are marginal. Thus, if we know that natural gas prices are currently cheaper than they were historically and are expected to remain so over the next few years, we would expect this to have an impact on which generating units are economically marginal in the future. New regulations affecting coal-fired units may also affect which units are marginal.
Analysts in the electric power sector use sophisticated economic dispatch models to predict how the system will react to different scenarios—that is, which generating units will be dispatched by the system operator to meet any given future load.46 Instead of assuming that future
46 Power sector analysts also use capacity expansion models to forecast what future resources will be added to the system to meet load that exceeds existing capacity. These models include dispatch features as well. Without getting into the details of how these models differ, this report generically refers to either kind of model as a dispatch model.
AL
AZ
AR
CA CO
CT
DE
FL
GA
ID
IL IN
IA
KSKY
LA
ME
MD
MA
MI
MN
MS
MO
MT
NENV
NH
NJ
NM
NY
NC
ND
OH
OK
OR
PA
RI
SC
SD
TN
TX
UT
VT
VA
WA
WV
WI
WY
500,000 lbs.Note: The diameter of each circle indicates the magnitude of a unit’s change in generation emissions. Circles are semi-transparent, darker areas occur in regions with overlapping units. Negative changes are indicated with blue circles; positive changes are indicated with black-bordered white circles.
Graphic provided courtesy of Jeremy Fisher, Synapse Energy Economics

33
Quantifying the Air Quality Impacts of Energy Efficiency Policies and Programs
behavior will match past behavior, these models are driven by the input data, in particular price and operating cost assumptions. Because these models can forecast the output of each generator on the system, and each generator’s emission rates are known, they can also be used to project emissions. By modeling two scenarios—one including the impacts of EE policies and programs, and one without those impacts—the analyst can develop values for avoided emissions.
Most of the dispatch models that might be useful for estimating avoided emissions are proprietary software products that must be purchased from a private sector vendor. Some notable examples of chronologic dispatch models include PROSYM, PROMOD, and PLEXOS.47 Other models that approximate dispatch decisions but also evaluate the energy system more broadly include the National Energy Modeling System (used by the EIA for the AEO), the Integrated Planning Model (used by the EPA for various regulatory purposes), ENERGY 2020 (used by California Air Resources Board for modeling impacts of greenhouse gas regulations), and MARKAL (used by several Northeast states for assessing avoided emissions).
Most air quality regulators at the state level will not have licenses for dispatch model software or the training on how to use the models. However, they may be able to work in partnership with utilities, consultants, or PUC staff to use these models. Because of the investment needed to use dispatch models, air regulators would be advised to first use one of the simpler methods for estimating avoided emissions to determine if the magnitude of the impact and the need for accuracy is sufficient to justify dispatch modeling.
4.2. Strengths and Limitations of Each Method
Table 3 summarizes some of the most significant strengths and limitations of each method described previously.
4.3. Other Related Quantification Tools
In February 2013, ACEEE made public a new Energy Efficiency and Pollution Control Calculator.48 This tool allows one to compare the costs and avoided emissions associated with certain specific EE policies to the costs and avoided
emissions associated with installing certain types of air pollution control equipment on a 500-MW coal-fired power plant. Results are tailored to the state selected by the user for analysis. Air regulators and other stakeholders may find this to be a useful tool for understanding how EE compares to traditional air quality control measures, or for assessing the scale of emission reductions that might be achieved through a select set of generic EE policies and programs. But it is not designed or intended to be used as a tool for assessing the specific local impacts of state EE policies and programs.
4.4. Other Considerations
A few final points need to be made that will be important to the air regulator regardless of which method is used to estimate avoided emissions.
Most of the preceding discussion has suggested that air regulators will find one value for energy savings that can be used to determine avoided emissions. In fact, most reports of EE program impacts (past or projected) will provide data for a number of variations on the concept of energy savings. The most common and noteworthy variation that air regulators will see is between “gross” energy savings and “net” energy savings. Another potentially important variation is between “first year” and “cumulative” energy savings. The precise definitions of these and other related terms vary from one jurisdiction to the next. Although a full explanation of these concepts is beyond the scope of this report, guidance can be found in reference documents produced by several of the organizations mentioned herein.49
47 Chronologic dispatch models are designed to figure out exactly which units will operate in each hour based on their operational capabilities, costs, and constraints. These specific models also take into account transmission constraints and system reliability requirements.
48 Available with documentation at http://aceee.org/123-solutions.
49 See, for example, the aforementioned Energy Efficiency Program Impact Evaluation Guide or a Glossary of Terms published by Northeast Energy Efficiency Partnerships at http://neep.org/Assets/uploads/files/emv/emv-products/EMV_Glossary_Version_2.1.pdf.
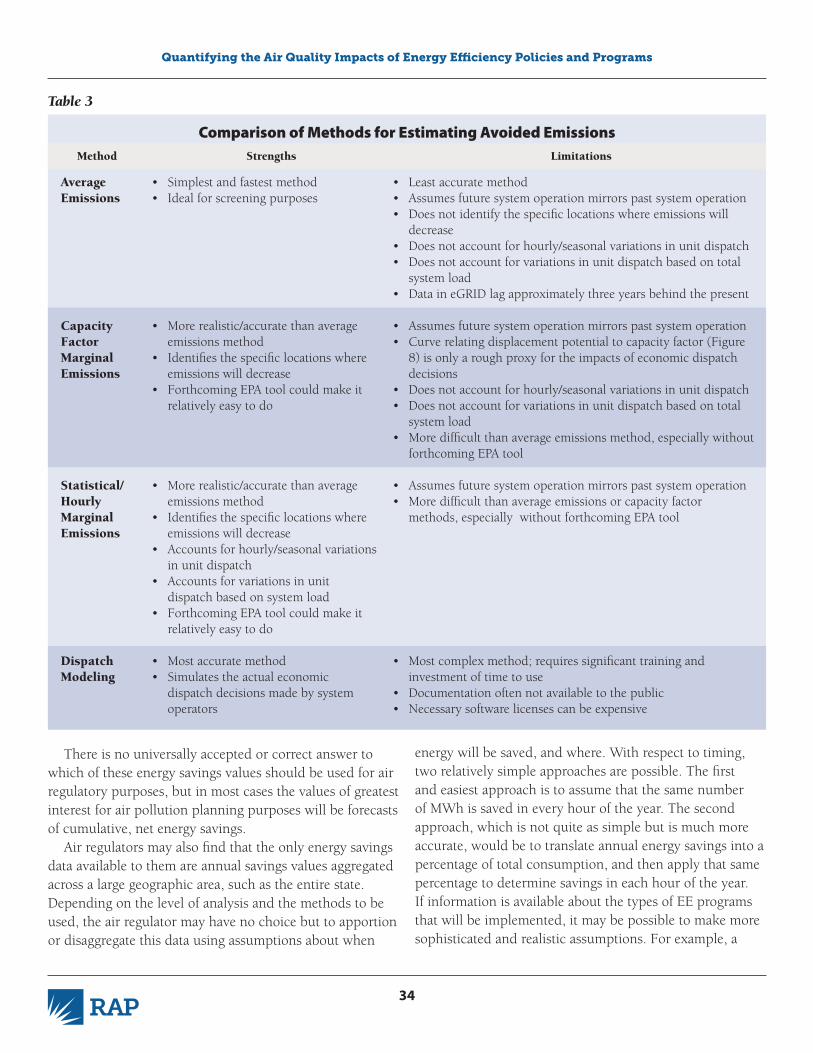
34
Quantifying the Air Quality Impacts of Energy Efficiency Policies and Programs
Method Strengths Limitations
Table 3
Comparison of Methods for Estimating Avoided Emissions
Average Emissions
Capacity Factor Marginal Emissions
Statistical/Hourly Marginal Emissions
Dispatch Modeling
• Simplest and fastest method• Ideal for screening purposes
• More realistic/accurate than average emissions method
• Identifies the specific locations where emissions will decrease
• Forthcoming EPA tool could make it relatively easy to do
• More realistic/accurate than average emissions method
• Identifies the specific locations where emissions will decrease
• Accounts for hourly/seasonal variations in unit dispatch
• Accounts for variations in unit dispatch based on system load
• Forthcoming EPA tool could make it relatively easy to do
• Most accurate method• Simulates the actual economic
dispatch decisions made by system operators
• Least accurate method• Assumes future system operation mirrors past system operation • Does not identify the specific locations where emissions will
decrease• Does not account for hourly/seasonal variations in unit dispatch• Does not account for variations in unit dispatch based on total
system load• Data in eGRID lag approximately three years behind the present
• Assumes future system operation mirrors past system operation • Curve relating displacement potential to capacity factor (Figure
8) is only a rough proxy for the impacts of economic dispatch decisions
• Does not account for hourly/seasonal variations in unit dispatch• Does not account for variations in unit dispatch based on total
system load• More difficult than average emissions method, especially without
forthcoming EPA tool
• Assumes future system operation mirrors past system operation • More difficult than average emissions or capacity factor
methods, especially without forthcoming EPA tool
• Most complex method; requires significant training and investment of time to use
• Documentation often not available to the public• Necessary software licenses can be expensive
There is no universally accepted or correct answer to which of these energy savings values should be used for air regulatory purposes, but in most cases the values of greatest interest for air pollution planning purposes will be forecasts of cumulative, net energy savings.
Air regulators may also find that the only energy savings data available to them are annual savings values aggregated across a large geographic area, such as the entire state. Depending on the level of analysis and the methods to be used, the air regulator may have no choice but to apportion or disaggregate this data using assumptions about when
energy will be saved, and where. With respect to timing, two relatively simple approaches are possible. The first and easiest approach is to assume that the same number of MWh is saved in every hour of the year. The second approach, which is not quite as simple but is much more accurate, would be to translate annual energy savings into a percentage of total consumption, and then apply that same percentage to determine savings in each hour of the year. If information is available about the types of EE programs that will be implemented, it may be possible to make more sophisticated and realistic assumptions. For example, a

35
Quantifying the Air Quality Impacts of Energy Efficiency Policies and Programs
residential lighting program will have more of an impact in evening hours than mid-day, whereas a refrigeration program will save a relatively constant amount of energy throughout each hour of the year. Geographically, if one only has a projection of total energy savings for a large state that has multiple areas of interest for air quality regulation, the regulator might consider disaggregating the energy savings to different areas based on the proportion of total state load in each area.
Gross Savings: The change in energy consumption and/or demand that results directly from program-related actions taken by participants in an efficiency program, regardless of why they participated and unadjusted by any factors.
Net Savings: An adjustment to gross savings, accounting for the total change in load that is attributable to an EE program rather than other factors. For example, if data suggest that 10 percent of the gross savings would have occurred even in the absence of the EE program (for whatever reasons), the net savings will be 10 percent less than the gross savings.
First Year Savings: The gross or net savings achieved by an EE measure (or program) in the first year the measure (or program) is implemented.
Cumulative Savings: The total gross or net savings achieved in a given year that are associated with all
previously installed EE measures (or programs) that are still saving energy in that given year.
Illustrative Example An EE program helps customers install LED
streetlights. In 2013, participating customers save 100 MWh of electricity. However, evaluation data suggest some of these customers would have implemented LED streetlights even if the EE program had not existed, and saved 10 MWh. Because the EE program is successful, it is repeated in 2014 with the same results.
Gross First-Year Savings = 100 MWh in 2013 and 100 MWh in 2014
Net First-Year Savings = 90 MWh in 2013 and 90 MWh in 2014
Gross Cumulative Savings = 100 MWh in 2013 and 200 MWh in 2014
Net Cumulative Savings = 90 MWh in 2013 and 180 MWh in 2014
Sample Definitions for Different Values of “Energy Savings”
Finally, the impacts of EE within an area where an emissions cap and trading program is in effect should be carefully considered. Within the constraints of a cap, if EE policies and programs reduce power sector emissions, they may simply alleviate the need for other emissions reductions and thus have no net impact. In this kind of scenario, the air regulator will need to consider whether the emissions avoided through EE are happening “under the cap” or are supplemental to the cap.

36
Quantifying the Air Quality Impacts of Energy Efficiency Policies and Programs
Energy consumption and air quality are linked in ways that challenge traditional thinking about the missions, authorities, and responsibilities of regu-latory agencies. It is not enough for air regulators
to understand where to find data on energy consumption and EE program impacts. They must also appreciate that air quality impacts are an increasingly important consider-ation in decisions made by energy regulators. Air regulators should not be mere witnesses or bystanders in the develop-ment of EE policies and programs or the measurement of EE impacts. The need for air regulators to collaborate directly and frequently with utility regulators, state energy offices, and other energy-sector entities is greater than ever before, and all parties should benefit from better communications and more coordinated efforts.
In this section, we will briefly describe some opportuni-ties for this kind of collaboration. These opportunities fall into two broad categories. First, there are opportunities for air regulators to obtain better data from their energy sector counterparts in order to improve the development and implementation of air quality policies and programs. Second, there are opportunities for air regulators to provide better data to their energy sector counterparts in order to improve the development and implementation of energy policies and programs.
5.1. Opportunities to Obtain Better Data From the Energy Sector and Energy Regulators to Improve Air Quality Policy Development
The vast majority of professionals in state PUCs, state energy offices, and EE program evaluation organizations have no experience regulating air pollution. In virtually all cases, these people understand generally that EE programs have air quality impacts, and they understand that those impacts can be important. But most of them have never
5. Importance of Collaboration to Improve Data Quality
drafted a permit, developed a SIP, or enforced an emissions limitation of any kind.
In many states, as EE program evaluation practices have improved through years of practice, more and more attention has been paid to quantifying avoided emissions. But the people paying attention to this issue do not always understand the true data needs of air quality regulators. This is understandable, and they should not be faulted for any misunderstandings or shortcomings. Rather, air quality regulators should communicate their data needs to EE program evaluators and regulators. The EE professionals probably won’t be able or willing to accommodate every data request, but they may not even be aware of any shortcomings in the data they already provide. They may be quite amenable to helping air regulators get the data needed for air quality regulation, if they know what it is. But if air regulators never communicate their information needs to EE program evaluators and policy makers, they may never get what they need.
5.2. Opportunities to Provide Better Data to the Energy Sector and Energy Regulators to Improve Energy Policy Development
EE measures and EE programs are screened (before implementation and in potential studies) and evaluated (after implementation) primarily to determine if they are or were cost-effective. Most states now include environmental costs and benefits in their cost-effectiveness calculations, with particular emphasis placed on air quality impacts. The “non-energy impacts” of EE can often tip the scales in terms of whether a measure or program is considered cost-effective, which in turn decides whether or not the measure or program is actually implemented. Thus, the data that go into these cost-effectiveness calculations have very real impacts on EE and ultimately on energy sector air emissions.

37
Quantifying the Air Quality Impacts of Energy Efficiency Policies and Programs
There are good reasons for air regulators to engage in decisions about how EE program costs and benefits will be calculated. First and most important, they should seek to ensure that costs and benefits associated with air pollution are included in cost-effectiveness tests. Because EE programs virtually always have at least some positive air quality benefit, including this consideration may mean that more EE measures get implemented, and more emissions are avoided. Second, air quality regulators should then provide the best available data on the costs of utility compliance with air quality regulations, the societal costs of air pollution, and the costs that can be avoided through EE. No party to an EE policy or program decision will have better data on this topic than the air regulator.
5.3. National Venues for Collaboration
There are several ongoing national efforts to promote better and more consistent methods for EM&V of EE program impacts. These efforts are focused primarily, in fact almost exclusively, on improving the methods for estimating energy savings from EE. However, better estimates of energy savings will inevitably result in better estimates of avoided air emissions, thus these efforts may be of interest to the air regulator. Three national efforts that are likely to be of greatest interest to air quality regulators are described below.
5.3.1. State and Local Energy Efficiency Action Network
The State and Local Energy Efficiency Action Network (SEE Action Network) is a state-led, multi-stakeholder effort facilitated by the U.S. Department of Energy (DOE) and the EPA. Stakeholders come from utilities and electric cooperatives, utility commissions, state energy offices, energy and efficiency service providers, and advocacy groups. The SEE Action Network’s goal is to achieve all cost-effective EE by 2020 throughout the United States. To make that happen, the Network provides information resources and technical assistance to state and local decision-makers on a wide variety of EE topics. The Network has an active EM&V Working Group, and that group has recently published the aforementioned Energy Efficiency Program Impact Evaluation Guide (http://www1.eere.energy.gov/seeaction/pdfs/emv_ee_program_impact_
guide.pdf), which includes a thorough treatment of the subject of avoided emissions. Air regulators can visit http://www1.eere.energy.gov/seeaction/ to find out more about the Network’s EM&V working group and opportunities for participation.
5.3.2. Uniform Methods Project
The Uniform Methods Project (http://www1.eere.energy.gov/office_eere/de_ump.html) is another initiative supported by the DOE. The Project Steering Committee includes representatives of utilities, other EE program administrators, PUC and air regulators, and EE program evaluators. The primary goal of the project is to strengthen the credibility of EE programs by developing standard protocols that can increase the consistency and transparency of how energy savings are determined. A secondary goal is to reduce EM&V costs through standardization. The protocols will resemble a national TRM for a limited set of common EE measures. The DOE has indicated that it intends to accept comments on draft protocols, which might provide air regulators with an opportunity to weigh in on whether the protocols will produce the data that air regulators need to assess avoided emissions.
5.3.3. EPA EM&V Webinars
For more than three years, the EPA’s State and Local Climate and Energy Program has been hosting a series of EM&V webinars with content presented by EE industry leaders. The webinars are intended primarily for state environmental regulators, staff from PUCs and state energy offices, and staff from non-profits that are getting started with EM&V or seeking to expand and improve their methods. All of the webinars have been archived and are available at http://www.emvwebinar.org/. Air regulators may wish to participate in future webinars so they can engage on these topics with other professionals in similar roles.
5.4. Regional Venues for CollaborationIn some parts of the country, various stakeholders
have come together on a regional basis to promote better data and methods for estimating energy savings and/or avoided emissions. Some of the more noteworthy efforts are summarized below.

38
Quantifying the Air Quality Impacts of Energy Efficiency Policies and Programs
5.4.1. Northeast Energy Efficiency Partnerships EM&V Forum
Northeast Energy Efficiency Partnerships (NEEP) is an organization created in 1996 to advance EE in 11 northeast and mid-Atlantic states plus the District of Columbia. NEEP fosters regional partnerships that leverage expertise and funding to increase the impacts of individual state efforts. In 2008 NEEP launched an EM&V Forum (http://neep.org/emv-forum) to provide a regional resource for developing and supporting implementation of consistent protocols for EM&V and reporting of energy and capacity savings. The NEEP EM&V Forum may provide an excellent opportunity for air regulators from that part of the country to collaborate with EE professionals. Environmental regulators from some states have played a leading role in the Forum, and there is room for additional air regulators to participate.50
5.4.2. ISO New England Environmental Advisory Group
ISO New England has an Environmental Advisory Group that provides another interesting opportunity for regional collaboration in the New England states (http://www.iso-ne.com/committees/comm_wkgrps/prtcpnts_comm/eag/index.html). This advisory group focuses on assessing the local power system impact of national environmental developments and the implications for internal planning processes. In recent years the group has completed groundbreaking studies of marginal emission rates and NOx emissions on peak energy demand days in the ISO New England system. These results can provide critically important pieces of information for assessing the avoided emissions that result from EE policies and programs. For air regulators in New England states, this group has provided a valuable venue for collaborating with energy sector planners and the group welcomes additional participation.
5.5. State-Specific Venues for Collaboration
Previously in this report we described two common sources of utility-specific or state-specific EE data: EE program planning (or program evaluation) dockets, and IRP dockets. Both of these proceedings, which are routine
in most states, provide opportunities for air regulators to pursue data and methodology improvements.
5.5.1. EE Planning and Program Evaluation Dockets
Air regulators should talk to their PUC counterparts to determine how they could best support and be served by EE program planning and program evaluation decisions. They may find that they are able to collaborate with the PUC and its staff during periods when there is not an open docket in order to clarify data needs, identify the best data sources, and implement the best practices for quantifying the air quality impacts of EE going forward. However, at times when the PUC has an open docket, it may be that the only way to provide helpful information or influence decisions is to intervene in the case.51 This is a more formal and rigid undertaking, with less likelihood of true collaboration, but air regulators shouldn’t refrain from taking this step, especially if the PUC is not likely to meet the air agency’s data needs or get good information on air quality impacts from other parties.
In the context of EE planning and program evaluation, air regulators can:
• Advocate for the use of cost-benefit tests that properly monetize air quality benefits, including avoided utility compliance costs, at a minimum, but also avoided public health costs and avoided costs associated with nonattainment where applicable;
50 In addition, Northeast States for Coordinated Air Use Management (NESCAUM, an association of air regulators from eight northeast states) and the Ozone Transport Commission formed an Energy Efficiency/Air Quality Planning Workgroup in part to independently discuss air quality-related issues arising from the NEEP EM&V Forum.
51 Parties that feel they have a vested interest in a PUC case, or feel that they can contribute information that will lead to a better decision by the PUC, can “request to intervene” in the case. Interveners are allowed to introduce evidence and question the evidence presented by utilities or other interveners. Because the PUC is expected to make its decision based solely on the evidence in the docket, intervening is the only way to influence its decision. Furthermore, the PUC must refrain from “ex parte communications,” which means the Commissioners will avoid discussing matters related to a case unless all of the parties to the case are present.
39
Quantifying the Air Quality Impacts of Energy Efficiency Policies and Programs
52 Data on avoided costs related to water and solid waste, which may be available from the air regulator’s environmental agency peers, could also be helpful.
• Provide data on avoided environmental costs for use in those tests (e.g., the current and expected future values of NOx allowances, modeling of public health benefits, and so on);52 and
• Ask program evaluators to estimate EE savings with the additional detail needed to assess avoided emissions, particularly with respect to the timing/seasonality and geographic location of energy savings.
5.5.2. IRP Dockets
As with program planning dockets, air regulators should talk to their PUC counterparts to determine how they could best support and be served by IRP proceedings. Once again, the best opportunities for true collaboration may come in between actual cases; air regulators will be more constrained in what they can do if a docket is already open and intervening as a party to the case is necessary.
In the context of IRP, air regulators can:• Advocate for integrated, fair treatment of EE as a
resource;• Provide or verify data on environmental compliance
options and costs for generators;• Ensure that modeling inputs and outputs
are consistent with all current environmental requirements;
• Provide information about likely future environmental requirements and the impact on generators, and request alternative modeling scenarios or sensitivity analyses based on those possibilities (e.g., request modeling of scenarios where a new area may be designated as nonattainment or an existing nonattainment designation might be reclassified); and
• Provide data on costs associated with environmental externalities such as the public health impacts of air pollution and economic impacts of nonattainment.

40
Quantifying the Air Quality Impacts of Energy Efficiency Policies and Programs
6. Conclusion
Efficiency measures are widely recognized as a cost-effective means to meet consumer demand for energy, while simultaneously reducing power sector environmental impacts. As EE policies
and programs proliferate and expand across the country, environmental regulators are increasingly interested in quantifying the impact of those policies and programs on air emissions. Generally speaking, this means first quantifying the energy savings that result from efficiency measures, and then translating energy savings into avoided emissions in the power sector.
Air regulators may not have the expertise to develop their own estimates of energy consumption or the energy savings that result from EE policies and programs, but they will find that a wide variety of external data sources exist. Because most of these sources were developed primarily for purposes other than quantifying avoided emissions, it is unlikely in the near term that any one data source will suffice to meet all of the air regulator’s needs. Regulators will benefit from developing a familiarity with all of the available data sources, and a combination of energy and EE data from various national, regional, and state sources may
provide the most complete and accurate basis for estimating avoided emissions.
The EPA is developing several methods and tools to help regulators translate energy savings data into avoided emissions estimates. State and regional efforts aimed at the same goal are also underway in some places. Air regulators need an understanding of the basics of these methods and tools if they wish to include EE impacts in their plans. In some states, regulators may find that other parties (such as EE program evaluators) are already using these methods and tools properly and developing credible estimates of avoided emissions. Where that is not the case, regulators will want to develop the ability to use the tools themselves.
Quantifying the environmental impacts of EE is still a relatively new undertaking, and the methods and tools are still evolving. However, EM&V is a big business, and the EPA is increasingly willing to recognize estimates of energy savings and avoided emissions as being sufficiently sophisticated to be used for air quality regulatory purposes. By collaborating with energy sector professionals and regulators, air quality regulators can contribute to the development of even better methods and improved data.

The Regulatory Assistance Project (RAP) is a global, non-profit team of experts focused on thelong-term economic and environmental sustainability of the power and natural gas sectors. We providetechnical and policy assistance on regulatory and market policies that promote economic efficiency,environmental protection, system reliability, and the fair allocation of system benefits among consumers.We work extensively in the US, China, the European Union, and India.Visit our website at www.raponline.org to learn more about our work.

50 State Street, Suite 3Montpelier, Vermont 05602802-223-8199www.raponline.org