quantifying the origin and distribution of intracluster ...vpd/publications/mnras467_2.pdf ·...
TRANSCRIPT
MNRAS 467, 4501–4513 (2017) doi:10.1093/mnras/stx401Advance Access publication 2017 February 23
Quantifying the origin and distribution of intracluster Lightin a Fornax-Like Cluster
Kathryn A. Harris,1‹ Victor P. Debattista,2‹ Fabio Governato,3
Benjamin B. Thompson,2 Adam J. Clarke,2 Thomas Quinn,3 Beth Willman,4
Andrew Benson,5 Duncan Farrah,1 Eric W. Peng,6,7 Rachel Elliott1 and Sara Petty1
1Department of Physics, Virginia Tech, Blacksburg, VA 24061, USA2Jeremiah Horrocks Institute, University of Central Lancashire, Preston PR1 2HE, UK3Astronomy Department, University of Washington, WA 98195, USA4Haverford College, Haverford, PA 19041, USA5The Observatories of the Carnegie Institution for Science, 813 Santa Barbara St, Pasadena, CA 91101, USA6Department of Astronomy, Peking University, Beijing 100871, China7Kavli Institute for Astronomy and Astrophysics, Peking University, Beijing 100871, China
Accepted 2017 February 14. Received 2017 February 12; in original form 2015 February 5
ABSTRACTUsing a cosmological N-body simulation, we investigate the origin and distribution of starsin the intracluster light (ICL) of a Fornax-like cluster. In a dark-matter-only simulation, weidentify a halo that, at z = 0, has M200 � 4.1 × 10¹³ M� and r200 = 700 kpc, and replaceinfalling subhalos with models that include spheroid and disc components. As they fall intothe cluster, the stars in some of these galaxies are stripped from their hosts, and form the ICL.We consider the separate contributions to the ICL from stars that originate in the haloes andthe discs of the galaxies. We find that disc ICL stars are more centrally concentrated than haloICL stars. The majority of the disc ICL stars are associated with one initially disc-dominatedgalaxy that falls to the centre of the cluster and is heavily disrupted, producing part of the cDgalaxy. At radial distances greater than 200 kpc, well beyond the stellar envelope of the cDgalaxy, stars formerly from the stellar haloes of galaxies dominate the ICL. Therefore at largedistances, the ICL population is dominated by older stars.
Key words: methods: numerical – galaxies: clusters: general – galaxies: clusters: intraclustermedium – cosmology: theory.
1 IN T RO D U C T I O N
Intracluster light (ICL), discovered by Zwicky (1951), is lightfrom stars within a galaxy cluster that are not bound to a galaxy.This light, which has been observed in clusters up to z = 0.8(Guennou et al. 2012), constitutes between 2 per cent and 50 per centof a cluster’s total light (Arnaboldi 2004; Feldmeier et al. 2004a;Lin & Mohr 2004; Zibetti 2008; McGee & Balogh 2010; Toledoet al. 2011). The origin of these stars is thought to be the clustergalaxies themselves; the stars being stripped from the galaxies asthey orbit within the cluster (e.g. White 1978; Merritt 1984; Mooreet al. 1996; Calcaneo-Roldan et al. 2000; Arnaboldi 2004; Zibetti &White 2005; Conroy & Gunn 2007). Indeed the network of tidal fea-tures observed in the core of the Virgo cluster supports the view thatstripped stars are a major contributor to the ICL (Mihos et al. 2005).Nonetheless, an ICL component formed in situ out of gas has alsobeen suggested. For instance, the simulations of Puchwein et al.
� E-mail: [email protected] (KAH); [email protected](VPD)
(2010), which include active galactic nucleus feedback, find thatas much as 30 per cent of the ICL may have formed in situ. How-ever, there may be an upper limit to how much ICL light in situstar formation can produce. While gas being stripped from infallinggalaxies is sometimes seen to be forming stars (e.g. Sun et al. 2010;Zhang et al. 2011), stellar population synthesis of stacked spectraof the ICL gives an upper limit to a younger ICL population of∼1 per cent (Melnick et al. 2012).
The ICL is an important diagnostic of processes such as the en-richment of the intracluster medium (Lin & Mohr 2004; Cora 2006;Sivanandam et al. 2009) that affects cooling flows (Petersonet al. 2003), the evolution of baryonic substructures (Arnaboldi& Gerhard 2010) and the baryon budget in clusters and groups(Gonzalez, Zubludoff & Zaritsky 2005; Gonzalez, Zaritsky &Zubludoff 2007). The ICL has also been used to trace the struc-ture of dark matter (DM): Jee (2010) used the ICL and weak lens-ing to trace a ring-like DM structure near the centre of the clusterCL0024+17. Giallongo et al. (2014) compared observations of theICL to a DM model and concluded that it can be used to probe theDM distribution.
C© 2017 The AuthorsPublished by Oxford University Press on behalf of the Royal Astronomical Society
4502 K. A. Harris et al.
The ICL fraction depends on galaxy richness, increasing from<2 per cent for loose groups (e.g. Feldmeier et al. 2003, 2004a) to>20 per cent for rich clusters (e.g. Feldmeier et al. 2002; Lin &Mohr 2004). This effect is also seen in some simulations (Rudick,Mihos & McBride 2011). Other simulations, however, have founda fairly constant ICL fraction with cluster richness (e.g. Puchweinet al. 2010). The semi-analytic model of Purcell, Bullock & Zentner(2007) finds an ICL fraction rising rapidly to ∼20 per cent in haloeswith mass up to 1013 M�, but that this rise becomes much lessdramatic at higher masses, reaching only ∼30 per cent at 1015 M�.The semi-analytic model of Contini et al. (2014) instead producesno halo mass dependence.
Although the ICL can make up to half of the cluster light,it is much more diffuse than the light from the galaxies (e.g.Feldmeier et al. 2002; Guennou et al. 2012), making it difficultto detect. Instead, the ICL is often studied using discrete, brighttracers such as planetary nebulae (e.g. Arnaboldi et al. 1996;Arnaboldi 2005; Aguerri et al. 2005; Castro-Rodriguez et al. 2009;Mihos et al. 2009), red giants (e.g. Ferguson, Tanvir & von Hip-pel 1998; Durrell et al. 2002; Palladino et al. 2012), globular clusters(e.g. Williams et al. 2007; Peng et al. 2011; Durrell et al. 2014), no-vae (e.g. Neill, Shara & Oegerle 2005; Shara 2006) and supernovae(e.g. Smith 1981; Gal-Yam et al. 2003; McGee & Balogh 2010;Sand et al. 2011). These methods, however, require assumptionsabout the light from the underlying stellar population in order toconvert between the observed number of tracers and the total stellarmass in the ICL.
Numerical simulations have been used to study the ICL. Theseinclude the creation and evolution of the ICL (Rudick, Mihos &McBride 2006; Puchwein et al. 2010; Cooper et al. 2015), thekinematics of unbound stars (e.g. Murante et al. 2004; Willmanet al. 2004; Dolag, Murante & Borgani 2010), the ICL fraction(e.g. Murante et al. 2004; Willman et al. 2004; Rudick et al. 2011;Martel, Barai & Brito 2012), ICL substructures (e.g. Calcaneo-Roldan et al. 2000; Murante et al. 2004; Rudick et al. 2011) and theradial distribution of the ICL (e.g. Napolitano et al. 2003; Rudicket al. 2009; Guennou et al. 2012). A common feature of most ofthese simulations is that they focus on high-mass clusters, gen-erally >1014 M�. However, high-mass clusters are atypical, withmost galaxies residing in lower mass associations, such as loosegroups or clusters. These lower mass clusters have several poten-tially key density and kinematic differences with their high-masscousins (e.g. Forman & Jones 1990). For example, the Fornax clus-ter, though less massive than the Virgo cluster (∼1013–1014 M�,as opposed to Virgo’s ∼1015 M�; Ikebe et al. 1992; Drinkwater,Gregg & Colless 2001; Fouque et al. 2001; Nasonova, de FreitasPacheco & Karachentsev 2011; Lee, Kim & Rey 2015), has approx-imately three times the density of galaxies within its core comparedto Virgo (Davies et al. 2013), and a lower velocity dispersion ofthe giant galaxies (∼370 km s−1 compared to ∼1000 km s−1;Ftaclas, Struble & Fanelli 1984; Binggeli, Popescu & Tam-mann 1993; Drinkwater et al. 2000, 2001; Kim et al. 2014). Fornaxalso appears to be more dynamically evolved than Virgo (Churazovet al. 2008). Because of these differences, coupled with the way theICL may be formed (via tidal interactions and stripping from galax-ies), we may expect different ICL compositions and distributions inlower mass clusters.
This paper investigates the distribution and origin of ICL stars ina cluster comparable to the Fornax cluster using an N-body simula-tion. This simulated cluster is of a lower mass than has been studiedin previous ICL papers, with a total stellar mass of ∼1011 M� andDM mass of ∼1013 M�. We investigate whether ICL stars originate
primarily from the discs or the haloes of progenitor galaxies. Sepa-rating the ICL into stars that originated from the disc (younger) andhalo (older) of galaxies allows us to further investigate the idea thatthe ICL stars may be older than the stellar populations in survivinggalaxies (e.g. Murante et al. 2004). Section 2 describes the simula-tion used and the formation of part of the cD galaxy. In Section 3,methods used to image and identify the ICL are described. Theresults are presented in Section 4 including the radial distributionof the ICL and its components, the ICL luminosity and the stellarage of the ICL. Section 5 discusses these results and presents ourconclusions. In the appendix, we present the individual galaxies andtheir orbits within the cluster.
2 N- B O DY M E T H O D S
We explore the ICL via a cosmological simulation using PKDGRAV
(Stadel 2001) of 18 galaxies within a Fornax cluster-like environ-ment. We start with a DM-only simulation, evolved in a WMAP(Spergel et al. 2003) � cold dark matter cosmology with �0 = 0.3,�� = 0.7 and H0 = 70 km s−1 Mpc−1. The initial simulation hasa low resolution of 363 particles in a cube of size 70 h−1 Mpc. Wethen identify a cluster with a virial radius r200 � 700 kpc and virialmass M200 � 4.1 × 10¹³ M�. These properties make the clustersimilar to the Fornax cluster. We then use the zoom-in technique(Katz & White 1993) to resimulate at high resolution the formationof the Fornax-sized halo. The resolution of the base simulation isrefined in four nested steps by factors of 23, 23, 43 and 33 cen-tred on the cluster. At the highest resolution, this gives a total of15 492 788 DM particles. The particle masses range from 7.9 × 10⁶
to 8.7 × 10¹¹ M�, with corresponding particle softenings varyingfrom 0.13 to 6.2 kpc.
At the end of this process, we identified all haloes in the massrange of 8.6 × 10¹⁰ ≤ M200 ≤ 5.2 × 10¹² M� entering the clusterbetween redshift z = 1.65 and 0.13 (before z = 1.65 the cluster is toochaotic to allow easy replacement). Before they enter, we replace18 of these haloes with full galaxy models. We exclude only twohaloes from this replacement because they are strongly interactingas they enter the cluster. Because strong interactions eject stars tolarge radii (Hilz et al. 2012; Hilz, Naab & Ostriker 2013) wherethey are more easily stripped in a cluster environment, excludingthese haloes will lead to an underestimate of the ICL. Material thatfell into the cluster earlier than z = 1.6 would probably have endedup in the central cD galaxy (Diemand, Madau & Moore 2005).Thus the stellar content of the central object in our simulation isunderestimated. Our replacement mass cut-off for M200 > 8.6 ×10¹⁰ M� roughly corresponds to a stellar mass cut of ∼109 M�,equivalent to <0.1L∗ at z = 0. DeMaio et al. (2015) show that theICL is likely to be dominated by stripping from >0.2L∗ galaxiesrather than stripping or disruption of dwarfs or mergers with thecentral galaxy. Thus the mass limit is unlikely to have introducedsignificant biases in the ICL in our simulation.
We then rerun the simulation replacing these haloes by fullbulge+disc+DM models as they fall in. This procedure assumesthat the star formation of each field galaxy proceeded normally andwas then interrupted by ram pressure stripping of the gas upon en-tering the dense cluster environment (e.g. Peng et al. 2010; Taranuet al. 2014; Tal et al. 2014, and references therein).
Semi-analytic models are very useful for populating systemsgrowing hierarchically (e.g. Moster, Maccio & Somerville 2014).For our model galaxies to resemble observed galaxies, we selecttheir parameters guided by the semi-analytic model cataloguesof Cole et al. (2000). These semi-analytic models employed a
MNRAS 467, 4501–4513 (2017)

Intracluster light in a Fornax-like cluster 4503
Table 1. The model galaxies in the simulation.
Galaxy zai Mb
200 V c200 Md∗ Re
d B/Df Re/Rgd Rh
HL MiV
(1010 M�) (km s−1) (1010 M�) (kpc) (kpc)
G01 1.65 71.4 180 4.79 2.5 0.12 0.13 3.9 −19.4G02 1.65 12.5 106 0.74 1.1 0.27 0.17 1.5 −17.4G03 1.13 30.4 136 1.23 0.7 0.15 0.25 1.1 −18.0G04 1.00 36.0 135 1.23 0.7 0.95 0.41 0.9 −17.9G05 1.00 28.7 127 1.13 1.7 1.11 0.31 1.8 −17.8G06 0.81 48.9 144 1.82 1.1 0.18 0.12 1.6 −18.3G07 0.81 8.6 82 0.18 0.6 0.12 0.41 1.1 −15.8G08 0.81 117.0 190 5.69 2.5 6.84 0.44 2.3 −19.5G09 0.58 63.2 150 2.84 1.1 0.19 0.21 1.6 −18.8G10 0.40 28.3 112 0.57 2.3 0.13 0.17 3.6 −17.1G11 0.40 35.9 121 0.82 1.3 0.13 0.13 2.0 −17.3G12 0.40 26.1 107 0.39 1.4 0.12 0.26 2.2 −16.7G13 0.40 508.0 278 13.2 2.1 0.52 0.14 2.5 −20.5G14 0.25 21.7 95 0.27 1.9 0.17 0.26 2.9 −16.3G15 0.25 10.1 76 0.16 1.5 1.29 0.14 1.1 −15.7G16 0.13 88.2 148 2.74 2.1 0.84 1.16 3.8 −18.8G17 0.13 11.3 72 0.05 1.1 0.57 0.76 1.8 −14.4G18 0.13 24.3 96 0.26 1.1 0.15 0.54 1.9 −16.2
aRedshift at which the halo is replaced with a full model.bHalo viral mass.cViral velocity.dStellar mass.eDisc scalelength.fBulge-to-disc mass ratio.gRatio of the bulge effective radius to disc scalelength.hHalf-light radius of the galaxy when placed in the simulation.iAbsolute magnitude in the V-band.
cosmology with H0 = 69.7 km s−1 Mpc−1, �0 = 0.3, �b = 0.02and �� = 0.70. Though this semi-analytic model has a lower valueof �b than the concordance cosmology (Bennett et al. 2013), theparameters of the semi-analytic model were tuned to match theobserved galaxy properties. As such, sampling galaxy propertiesfrom this semi-analytic model is a viable way of selecting structuralparameters for galaxies that are replaced. The galaxies in the cata-logues were produced at 20 epochs, equally spaced in time betweenz = 0 and 6. Each redshift catalogue contained between ∼7100 and∼8200 galaxies.
The Cole et al. (2000) catalogues were modelled in a vol-ume of 105h3 Mpc−3 and with masses spanning 5 × 10⁹ to1 × 1015h−1 M�. The galaxy catalogues generated in this way con-tain information on the structural properties of the galaxies (masses,sizes, age and metallicity of both disc and halo components) andDM haloes (mass, virial velocity, concentration and spin param-eter). In selecting the best galaxy model for each halo, we usedthe semi-analytic catalogues, choosing the halo that best matchesthe target M200 and V200 at the infall redshift; however, we discardmatches where the bulge-to-disc mass ratio, B/D < 1/9, which wearbitrarily chose so the spheroid is well populated.
The initial model galaxies were generated using the method ofSpringel & White (1999). The models consist of exponential discs,Hernquist bulges (Hernquist 1990) and NFW DM haloes (Navarro,Frenk & White 1997). In all cases, the vertical profile of the discis sech2z/zd, with ratio of scaleheight, zd, to scalelength, Rd, setto zd/Rd = 0.1. Table 1 lists the initial conditions of the galax-ies, including the redshift at which each DM halo is replaced,the halo mass, the circular velocity at r200, the stellar mass, thedisc scalelength, the bulge-to-disc mass ratio and the ratio of thebulge effective radius to disc scalelength, Re/Rd. We set stellarparticle softening to ε = 0.03Rd, which ends up corresponding to
ε = 34–198 pc. We use a larger softening, in the range of ε = 0.57–5.1 kpc, for DM particles. In all cases, the discs consist of 300 000particles, while the number of DM particles varies between 301 719and 944 783.
The Hernquist bulges formally extend to large radii. Rather thantruncating these bulges at some finite radius, we treat the star parti-cles at large radius as the stellar halo particles. de Jong, Radburn-Smith & Sick (2009) found that bulge and stellar halo density pro-files in nearby disc galaxies join smoothly, so it is reasonable toidentify the model’s outer bulge as the stellar halo, at least fromthe density profile point of view. However, the actual ratio of stellarhalo to disc stars remains model-dependent because the assumedfunctional form of both the bulge (Hernquist bulge) and the disc(single exponential) are somewhat arbitrary at large radii and cer-tainly difficult to constrain at high redshift. Thus, the ratio of discto halo stars in the disc outskirts is poorly constrained. Because ingeneral disc density profiles tend to truncate at large radii (e.g. vander Kruit 1979, 1987; Pohlen, Dettmar & Lutticke 2000; Pohlenet al. 2002; Erwin 2005; Pohlen & Trujillo 2006), we are verylikely overrepresenting the disc contribution to the ICL. The sur-face brightness profiles for each galaxy as they enter the cluster arepresented in Appendix A.
We insert each model galaxy before it crosses the virial radiusof the cluster, in order to give the models sufficient time to relax,>100 Myr, since the initial conditions generated using the method ofSpringel & White (1999) are not in perfect equilibrium (Kazantzidiset al. 2004).
We compare our galaxies to the observational data of Williamset al. (2010) and the simulations of Laporte et al. (2013) out toredshifts of z ∼ 2. Fig. 1 shows the size–mass relation of our18 galaxies when they are first inserted into the simulation, withredshifts between 1.65 and 0.13 and at z = 0. At z = 0, we
MNRAS 467, 4501–4513 (2017)
4504 K. A. Harris et al.
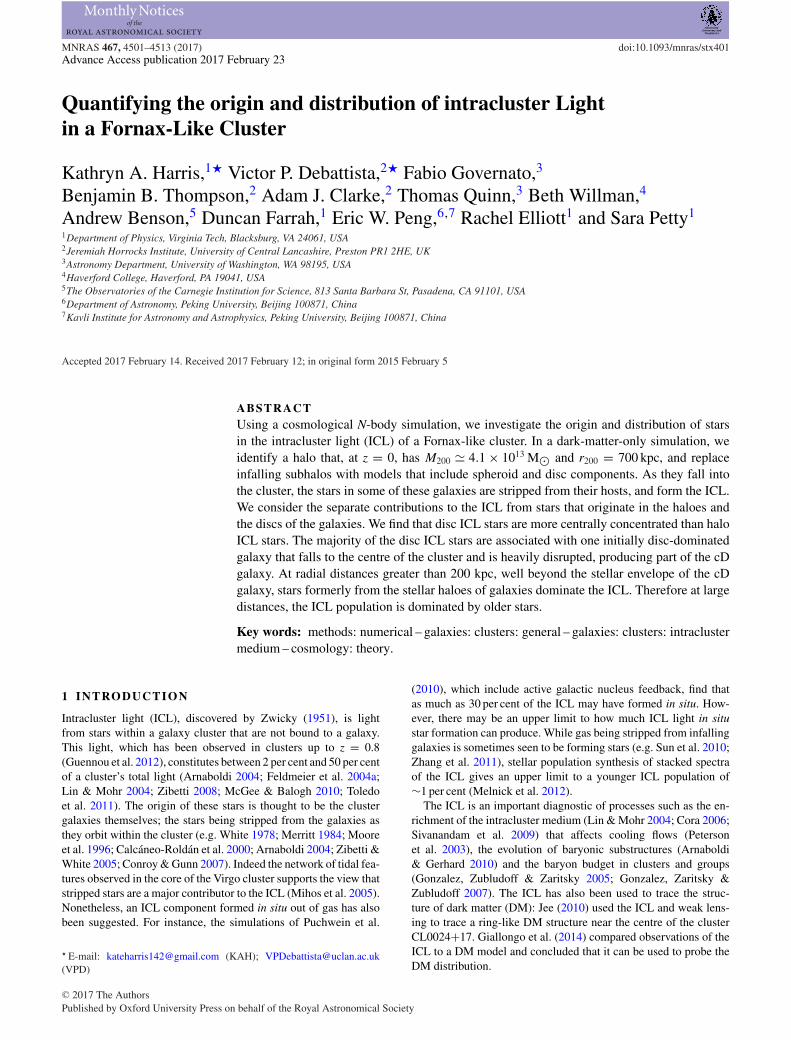
Figure 1. The size–mass relation of our galaxies when inserted into thesimulation (circles coloured for redshift) and at z = 0 (black squares). Thedashed lines show the evolution of the mass and stellar size for each galaxy.
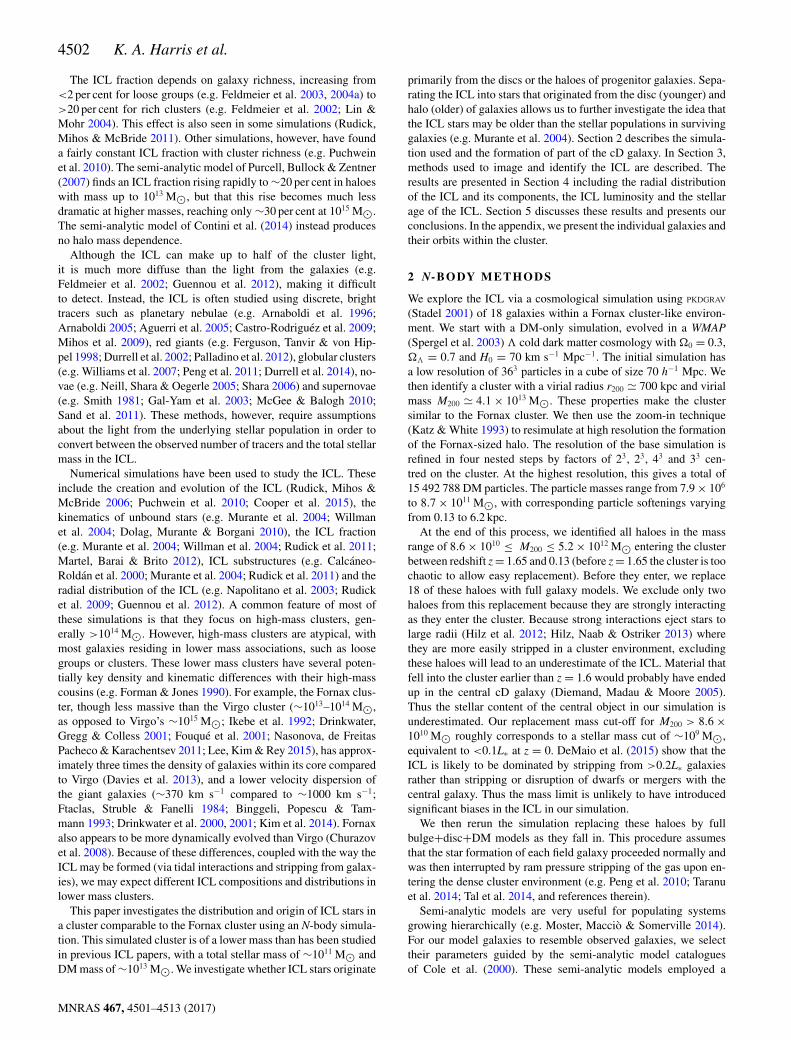
Figure 2. Stellar mass versus halo mass for each resimulated galaxy at thetime at which they are introduced (blue points). Assuming these masses donot change if the models were evolved in isolation, we compare with theabundance matching relations from different studies as indicated. The dif-ferent shaded regions correspond to the uncertainties in each of the relations.
define the half-light radius, RHL, of the galaxies using only starswithin our radial cut at 50 kpc (corresponding to the radial cutwe use to separate galaxies from ICL described in Section 3.2).Across the redshift range 0 < z < 2, our selected galaxies liewithin the region of observed galaxies from Newman et al. (2012).The galaxies are slightly less massive than those simulated byLaporte et al. (2013). At redshift slightly higher than the red-shift of our first replaced galaxy, the galaxies lie within 1σ ofthe relation of Williams et al. (2010). Therefore our selection ofgalaxy parameters is realistic. The overall trend revealed by Fig. 1is for RHL to increase. Galaxies of stellar mass M∗ > 5 × 10⁹ M�experience most of the stripping, while lower mass galaxies arenot as heavily stripped. Therefore most of the ICL comes frommassive galaxies.
As a final check of the model galaxy parameters, we plot inFig. 2 the stellar mass versus halo mass for each resimulated galaxyat the time at which we introduce it into our N-body simulation. Ifthe galaxies were evolved in isolation, rather than falling into thecluster, we do not believe either of these quantities would changesignificantly between that time and z = 0. We therefore comparethese initial conditions directly to the z = 0 abundance matchingrelations of Behroozi, Wechsler & Conroy (2013), Moster, Naab &White (2013) and Kravtsov et al. (2014). Our model galaxies are in
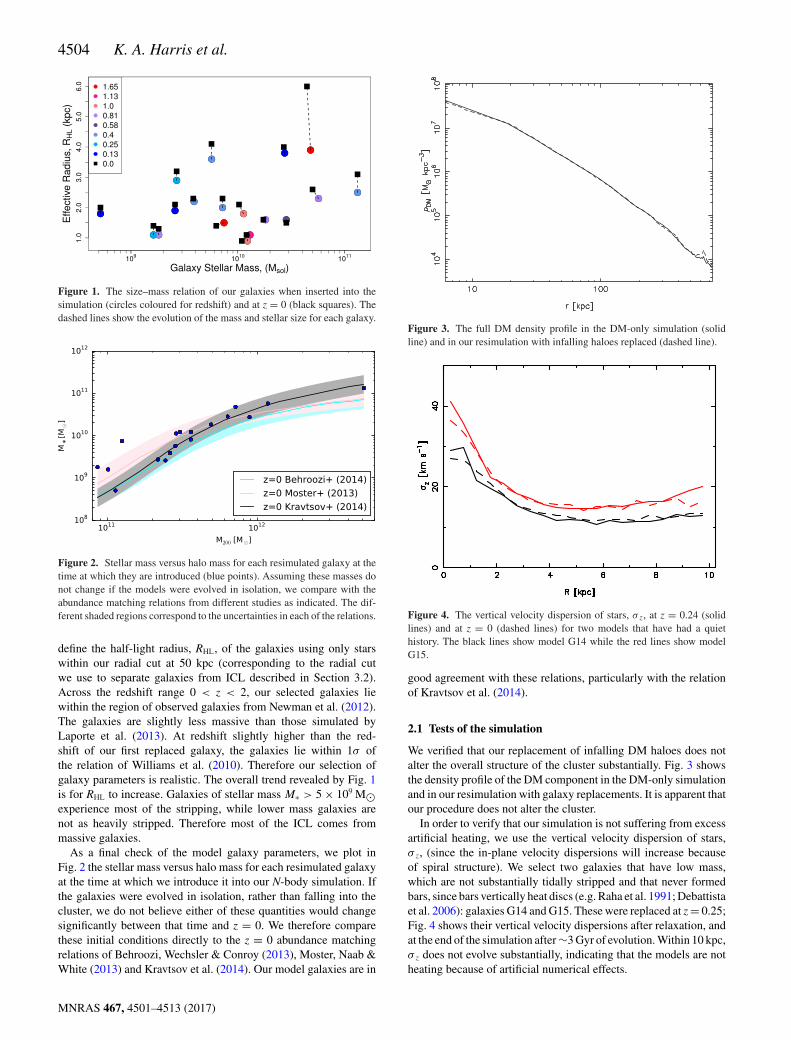
Figure 3. The full DM density profile in the DM-only simulation (solidline) and in our resimulation with infalling haloes replaced (dashed line).
Figure 4. The vertical velocity dispersion of stars, σ z, at z = 0.24 (solidlines) and at z = 0 (dashed lines) for two models that have had a quiethistory. The black lines show model G14 while the red lines show modelG15.
good agreement with these relations, particularly with the relationof Kravtsov et al. (2014).
2.1 Tests of the simulation
We verified that our replacement of infalling DM haloes does notalter the overall structure of the cluster substantially. Fig. 3 showsthe density profile of the DM component in the DM-only simulationand in our resimulation with galaxy replacements. It is apparent thatour procedure does not alter the cluster.
In order to verify that our simulation is not suffering from excessartificial heating, we use the vertical velocity dispersion of stars,σ z, (since the in-plane velocity dispersions will increase becauseof spiral structure). We select two galaxies that have low mass,which are not substantially tidally stripped and that never formedbars, since bars vertically heat discs (e.g. Raha et al. 1991; Debattistaet al. 2006): galaxies G14 and G15. These were replaced at z = 0.25;Fig. 4 shows their vertical velocity dispersions after relaxation, andat the end of the simulation after ∼3 Gyr of evolution. Within 10 kpc,σ z does not evolve substantially, indicating that the models are notheating because of artificial numerical effects.
MNRAS 467, 4501–4513 (2017)

Intracluster light in a Fornax-like cluster 4505
2.2 Formation of the cD galaxy
The stellar component of the cD galaxy in our simulation is com-prised of the stars from only a single galaxy that enters the clusterearly and settles to the centre. At z � 1.65, G01 enters the cluster andundergoes several passes through the cluster centre before finallysettling there by z � 0.6, thus forming a cD galaxy, at the clustercentre. The cD is a slowly rotating, pressure-supported, spheroidalsystem, with a very extended envelope, which are all propertiestypical of cD galaxies (Oemler 1976; Thuan & Romanishin 1981;Schombert 1986, 1988; Oegerle & Hill 1992; Bertola et al. 1995).If we had included material that falls in earlier, when the clusterwas more chaotic, then the cD galaxy would have had a largerstellar mass. However, this mass would have been more centrallyconcentrated than that from G01 (Diemand et al. 2005), and wouldtherefore contribute a smaller mass fraction to the ICL.
The Fornax cluster’s cD galaxy, NGC 1399, has a stellar massof 2 × 10¹¹ M� within 5 kpc (Saglia et al. 2000), compared withthe cD in our simulation, 4.4 × 10¹⁰ M�. The relatively low-masscD galaxy in the simulation is a result of the replacements startingfrom z = 1.65; indeed at z = 2.7, we identified an infalling halowith a mass almost twice as that of G01, which seems destined tofall on to the centre of the cluster and contribute to the cD. Besidesthis, we identified a further seven haloes falling into the clusterbetween z = 3.8 and 1.65, with masses spanning from ∼9 × 10⁹
to ∼1.3 × 10¹² M�. Thus a further five times the mass of the haloof G01 is missed in our replacements. In the rest of this paper,we loosely refer to galaxy G01 as the cD galaxy, but it should beremembered that G01 is only a fraction of the total mass that wouldhave gone into the cD galaxy of a real cluster like Fornax.
3 D E F I N I N G TH E I C L
3.1 Imaging the ICL
We analyse the results of the simulation at z = 0. To compare withthe Fornax cluster, we view the simulation at a similar distance(∼20 Mpc; Blakeslee et al. 2009) and assume a stellar mass-to-light ratio of M/L = 5 M�/L� (Rudick et al. 2006) to convert themass to a luminosity. Though this choice is a simplification, this isa characteristic value in the V band for an evolved stellar populationat z = 0, which is the population from which we expect the ICL tobe comprised. This M/L ratio is important for when we define theICL at fixed surface brightness but, as we show below, our preferreddefinition of the ICL depends on distance from individual galaxiesand is therefore independent of the assumed M/L.
We construct a series of cluster images measuring 1500 ×1500 pixels, with each pixel measuring 2 × 2 kpc. This givesa resolution of 0.023 arcsec per pixel compared with SpaceTelescope Imaging Spectrograph (STIS) imaging on the HubbleSpace Telescope, which has 0.05 arcsec per pixel. All of the imagesare centred on the cD galaxy. We use three orthogonal projectionsof the cluster along the x, y and z axes of the simulation, averagingprofiles over these three projections. We treat the largest differencebetween the average and the individual projections as our errorestimate. Fig. 5 shows the distribution of all the disc (left-handside) and halo (right-hand side) stars within the cluster (includingboth those stars bound in galaxies, and those in the ICL). Stars thatoriginated in the discs are more centrally concentrated. The discstars are also responsible for long, thin filaments due to them beingkinematically cooler populations, which remain more coherentafter they are stripped from a galaxy (Rudick et al. 2009).
3.2 Identifying the ICL
To identify the ICL, past simulation works have used a V-bandsurface brightness cut of 26.5 mag arcsec−2 (e.g. Rudick et al. 2006,which we term the isophotal method), with everything fainter thanthis limit being classified as ICL. The isophotal method is alsothe most commonly used definition of the ICL for observationalstudies. When applied to our simulation we found this methodexcluded from the ICL dense areas of tidal streams. Moreover someof the fainter, low surface brightness galaxies were included withthe ICL. Likewise Rudick et al. (2011) found that the isophotalmethod produced less ICL compared to other definitions.
Other methods for identifying the ICL have been suggested, suchas binding energy (using halo detection algorithms to find the galaxypotentials and defining the ICL as stars outside these potentials;Dolag et al. 2010) and particle density threshold, which requiresknowledge of the number of luminous particles in a given volume.(For more details on these methods, see Rudick et al. 2011.) How-ever, these methods, while useful in simulations, are difficult toapply to observations.
We therefore use a simple radial cut method to remove the galax-ies, taking 50 kpc around all the galaxies except galaxy G01 (thecD), for which we use a cut-off of 100 kpc. These cuts are likelyto remove any bound contribution (see the appendix for evidenceof this), leaving only the ICL. While the choice of cut may changethe ICL fraction by ∼50 per cent, it does not change the overalltrends. Our choice of 50 kpc is necessarily arbitrary, with the mainrequirement being that very few stars still bound to a galaxy arepresent beyond this radius. We choose twice this radius for galaxyG01 because cD galaxies usually have extended stellar envelopes(e.g. Oemler 1976; Schombert 1986; Zhao, Aragon-Salamanca &Conselice 2015), with unclear boundaries (e.g. Rudick et al. 2011).This will classify a smaller fraction of the stellar mass of the clusteras the ICL, but will be more robust to misclassification of faintgalaxies as ICL, while being easy to implement observationally.
Nonetheless, for comparison, we have also carried out our anal-ysis using a surface brightness cut-off at 26.5 mag arcsec−2. Ourradial cut method leads to roughly twice the amount of ICL as pro-duced by a surface brightness cut (∼4 per cent using a radial cutversus ∼2 per cent using a surface brightness cut) and the fractionaldifference is largest for disc stars, where fewer stars are classified asICL by the surface brightness cut (by roughly a factor of 4, whereasthe difference is a factor of 3 for bulge stars). In real observations, acut of 50 kpc would be too extreme if it was applied to every galaxy,including the dwarfs, which we have not replaced.
4 R ESULTS
4.1 ICL luminosity
4.1.1 ICL fraction
Table 2 lists the fraction of each galaxy that is stripped from thegalaxy and becomes ICL. In general, the galaxies that have con-tributed the greatest percentage of their stellar mass to the ICL arethe ones that fell in earliest. Very little mass is lost to the ICL bygalaxies that fall into the cluster after z = 0.6, regardless of stellarmass.
Of the total stellar mass included in the N-body galaxy models(3.81 × 10¹¹ M�), we classify 4.4 per cent (1.65 × 10¹⁰ M�) asICL. When calculating the fraction of the cluster in the ICL, we usethe total cluster mass (i.e. including the mass still bound to other
MNRAS 467, 4501–4513 (2017)

4506 K. A. Harris et al.
Figure 5. The surface brightness (in the V band) distribution of the disc (top panel) and halo (bottom panel) stars within the cluster. Disc stars are morecentrally concentrated, and exhibit more conspicuous narrow tidal features.
cluster members and the unbound mass) as the total mass. Thisdefinition has been used throughout this paper. Using the radial cut,51 per cent of the ICL comes from disc stars, while the rest is fromhaloes; if we exclude G01’s (the central galaxy) contribution to theICL, the disc fraction is 38 per cent of the remaining ICL. Thesehave been in the cluster longer, are more centrally concentratedwithin the cluster and therefore have been more disrupted than theyounger galaxies. It should be noted that the total stellar mass ofthe cluster as defined by an observer is likely to be greater thanthe mass described in this N-body simulation, as the simulationdoes not resimulate all the galaxies that fall into the cluster, nor alarge fraction of the stars in the cD galaxy. Since smaller galaxiesand the cD would presumably contribute more to the total massof the cluster than they would to the ICL, the ICL fraction wouldpresumably decrease if they were included.
4.1.2 Surface brightness distribution
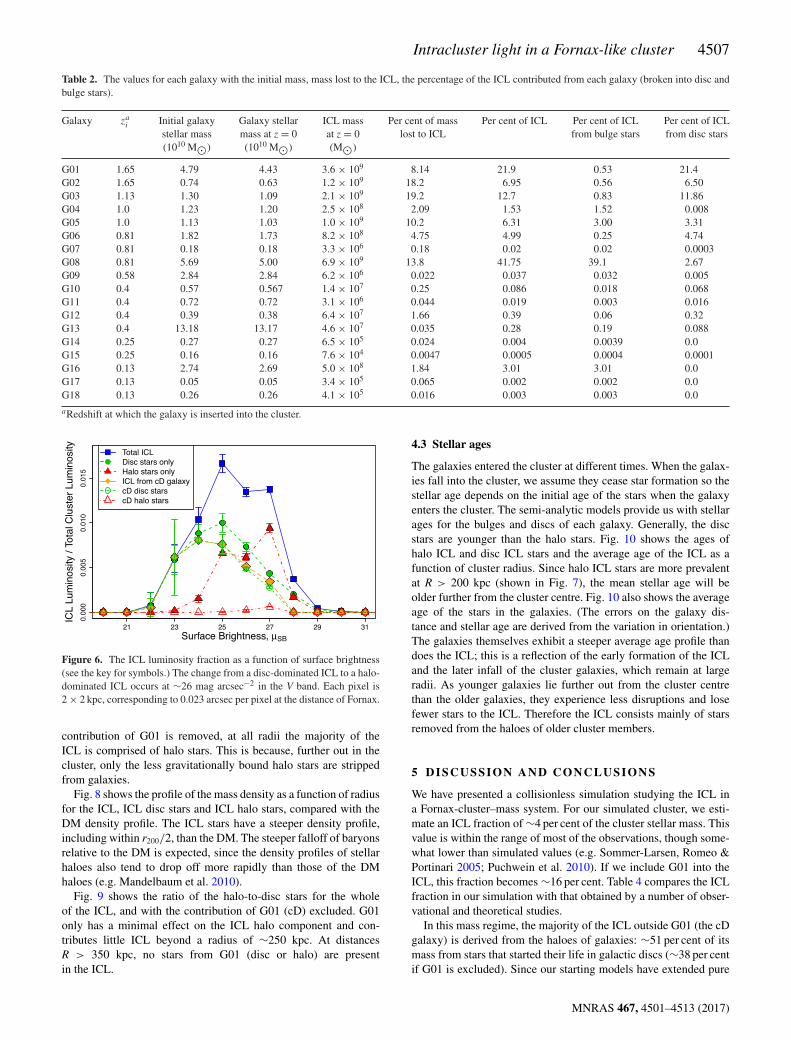
Fig. 6 shows the distribution of the surface brightnesses of the ICLand its contributions from the disc and halo stars. The stellar halodistribution peaks at a surface brightness ∼27 mag arcsec−2, whilethe disc stellar distribution peaks at a brighter surface brightnessof ∼25 mag arcsec−2. It is clear from this figure that the isophotal
cut method is too draconian, as it removes a significant number oforiginally disc stars from the ICL.
4.1.3 cD galaxy contribution
Table 3 presents the percentages that the galaxy G01 (the cD) andits components contribute to both the total cluster luminosity andto the ICL. G01 contributes ∼22 per cent of the stars in the ICL(similar to the result in Murante et al. 2007). The majority of thesestars originate from the disc of G01. Only 0.5 per cent of the ICLis made up of halo stars from G01, even though for this galaxy, theinitial bulge to disc ratio is 0.12. The contribution from G01 to theICL is shown in Fig. 6. As the orbit of G01 decays to the centre,it makes multiple passes through the cluster centre and is thereforestrongly disrupted spreading the stars from the progenitor over alarge volume.
4.2 ICL radial profile
Fig. 7 shows the radial profile of the ICL. Close to the cen-tre of the cluster, disc stars make up the greater part of theICL, dominated by those from G01 (the cD). Beyond ∼200 kpc,the halo stars become the main source of the ICL. When the
MNRAS 467, 4501–4513 (2017)
Intracluster light in a Fornax-like cluster 4507
Table 2. The values for each galaxy with the initial mass, mass lost to the ICL, the percentage of the ICL contributed from each galaxy (broken into disc andbulge stars).
Galaxy zai Initial galaxy Galaxy stellar ICL mass Per cent of mass Per cent of ICL Per cent of ICL Per cent of ICL
stellar mass mass at z = 0 at z = 0 lost to ICL from bulge stars from disc stars(1010 M�) (1010 M�) (M�)
G01 1.65 4.79 4.43 3.6 × 10⁹ 8.14 21.9 0.53 21.4G02 1.65 0.74 0.63 1.2 × 10⁹ 18.2 6.95 0.56 6.50G03 1.13 1.30 1.09 2.1 × 10⁹ 19.2 12.7 0.83 11.86G04 1.0 1.23 1.20 2.5 × 10⁸ 2.09 1.53 1.52 0.008G05 1.0 1.13 1.03 1.0 × 10⁹ 10.2 6.31 3.00 3.31G06 0.81 1.82 1.73 8.2 × 10⁸ 4.75 4.99 0.25 4.74G07 0.81 0.18 0.18 3.3 × 10⁶ 0.18 0.02 0.02 0.0003G08 0.81 5.69 5.00 6.9 × 10⁹ 13.8 41.75 39.1 2.67G09 0.58 2.84 2.84 6.2 × 10⁶ 0.022 0.037 0.032 0.005G10 0.4 0.57 0.567 1.4 × 10⁷ 0.25 0.086 0.018 0.068G11 0.4 0.72 0.72 3.1 × 10⁶ 0.044 0.019 0.003 0.016G12 0.4 0.39 0.38 6.4 × 10⁷ 1.66 0.39 0.06 0.32G13 0.4 13.18 13.17 4.6 × 10⁷ 0.035 0.28 0.19 0.088G14 0.25 0.27 0.27 6.5 × 10⁵ 0.024 0.004 0.0039 0.0G15 0.25 0.16 0.16 7.6 × 10⁴ 0.0047 0.0005 0.0004 0.0001G16 0.13 2.74 2.69 5.0 × 10⁸ 1.84 3.01 3.01 0.0G17 0.13 0.05 0.05 3.4 × 10⁵ 0.065 0.002 0.002 0.0G18 0.13 0.26 0.26 4.1 × 10⁵ 0.016 0.003 0.003 0.0
aRedshift at which the galaxy is inserted into the cluster.
Figure 6. The ICL luminosity fraction as a function of surface brightness(see the key for symbols.) The change from a disc-dominated ICL to a halo-dominated ICL occurs at ∼26 mag arcsec−2 in the V band. Each pixel is2 × 2 kpc, corresponding to 0.023 arcsec per pixel at the distance of Fornax.
contribution of G01 is removed, at all radii the majority of theICL is comprised of halo stars. This is because, further out in thecluster, only the less gravitationally bound halo stars are strippedfrom galaxies.
Fig. 8 shows the profile of the mass density as a function of radiusfor the ICL, ICL disc stars and ICL halo stars, compared with theDM density profile. The ICL stars have a steeper density profile,including within r200/2, than the DM. The steeper falloff of baryonsrelative to the DM is expected, since the density profiles of stellarhaloes also tend to drop off more rapidly than those of the DMhaloes (e.g. Mandelbaum et al. 2010).
Fig. 9 shows the ratio of the halo-to-disc stars for the wholeof the ICL, and with the contribution of G01 (cD) excluded. G01only has a minimal effect on the ICL halo component and con-tributes little ICL beyond a radius of ∼250 kpc. At distancesR > 350 kpc, no stars from G01 (disc or halo) are presentin the ICL.
4.3 Stellar ages
The galaxies entered the cluster at different times. When the galax-ies fall into the cluster, we assume they cease star formation so thestellar age depends on the initial age of the stars when the galaxyenters the cluster. The semi-analytic models provide us with stellarages for the bulges and discs of each galaxy. Generally, the discstars are younger than the halo stars. Fig. 10 shows the ages ofhalo ICL and disc ICL stars and the average age of the ICL as afunction of cluster radius. Since halo ICL stars are more prevalentat R > 200 kpc (shown in Fig. 7), the mean stellar age will beolder further from the cluster centre. Fig. 10 also shows the averageage of the stars in the galaxies. (The errors on the galaxy dis-tance and stellar age are derived from the variation in orientation.)The galaxies themselves exhibit a steeper average age profile thandoes the ICL; this is a reflection of the early formation of the ICLand the later infall of the cluster galaxies, which remain at largeradii. As younger galaxies lie further out from the cluster centrethan the older galaxies, they experience less disruptions and losefewer stars to the ICL. Therefore the ICL consists mainly of starsremoved from the haloes of older cluster members.
5 D I S C U S S I O N A N D C O N C L U S I O N S
We have presented a collisionless simulation studying the ICL ina Fornax-cluster–mass system. For our simulated cluster, we esti-mate an ICL fraction of ∼4 per cent of the cluster stellar mass. Thisvalue is within the range of most of the observations, though some-what lower than simulated values (e.g. Sommer-Larsen, Romeo &Portinari 2005; Puchwein et al. 2010). If we include G01 into theICL, this fraction becomes ∼16 per cent. Table 4 compares the ICLfraction in our simulation with that obtained by a number of obser-vational and theoretical studies.
In this mass regime, the majority of the ICL outside G01 (the cDgalaxy) is derived from the haloes of galaxies: ∼51 per cent of itsmass from stars that started their life in galactic discs (∼38 per centif G01 is excluded). Since our starting models have extended pure
MNRAS 467, 4501–4513 (2017)

4508 K. A. Harris et al.
Table 3. Percentages of the cluster luminosity contained in the ICL, and the ICL disc and halo stars from the central (cD) galaxy G01.
Method All ICL from G01 ICL disc stars from G01 ICL halo stars from G01
Contribution to total galaxy cluster 0.95 per cent ± 0.21 per cent 0.92 per cent ± 0.20 per cent 0.03 per cent ± 0.012 per centContribution to the ICL 21.9 per cent ± 6.5 per cent 21.3 per cent ± 6.3 per cent 0.54 per cent ± 0.03 per cent
Figure 7. The average ICL luminosity contribution as a function of radiusfor the different components. The change from disc- to halo-dominatedICL occurs at ∼200 kpc. The contribution from the central (cD) galaxyalso declines rapidly with radius and does not contribute any ICL beyondR ∼ 350 kpc.
Figure 8. The mass density profile as a function of cluster radius for theICL, disc ICL stars, halo ICL stars, ICL from G01 (cD) and the DM profile.
Figure 9. The ratio of the halo-to-disc stars in the ICL as a function of radiusfrom the centre of the cluster for the ICL as a whole (red circles, dashedline) and with the contribution from G01 (cD) removed (blue asterisks,dot–dashed line).
Figure 10. The average age of disc and halo ICL stars as a function ofradius. (See the key for the symbols.) The plot also shows the ages with andwithout the contribution of G01 (the cD). The disc stars are, on average,younger than the halo stars and the difference in ages increases at largerradii. The average age of the galaxies is also indicated.
exponential density profiles to large radii, whereas the majority ofreal disc galaxies are truncated, the amount of stellar mass in thesimulation’s outer discs is overestimated. This gives us confidencethat our disc ICL fraction is an upper limit. However, inside 0.25r200,the ICL is dominated by stars from the disc of G01, the galaxy thatbecomes part of the cD (see Fig. 7).
We studied the contribution to the ICL from individual galaxiesand found that the largest, oldest galaxies contribute the most tothe ICL. This agrees with Contini et al. (2014) who found that26 per cent of ICL comes from galaxies with stellar masses between1010.75 and 1011.25 M� and 68 per cent of ICL is from galaxies withM∗ > 1010.5 M�. For galaxies of mass M∗ < 4 × 10⁹ M�, theircontribution to the total ICL is negligible. We note that this is closeto our cut-off for the replaced galaxies. Thus it is reasonable tosuppose that we have not missed a significant fraction of the ICLfrom low-mass galaxies in our simulation.
The radial distribution of the ICL shows a change in compositionfrom being disc-dominated near the cluster centre to stellar halo-dominated by ∼25 per cent of r200 (Fig. 7). This change is due toG01 contributing the majority of the disc ICL stars. The distance isapproximately half the distance found by Murante et al. (2007) fora cluster of virial mass 1.6–2.9 × 10¹⁴h−1 M�.
The stellar ages are different between the galaxies and the ICLas a function of radius. The older galaxies within the cluster tendto lie near the cluster centre while the younger galaxies lie fur-ther out, which reflects the time of infall into the cluster. ICL starsare, on average, older than the average galaxy stars, particularlyat large radii, with the average age nearly constant or increasingslightly with radius. This is similar to the result found by Puchweinet al. (2010). The radially nearly constant age of the ICL stars isdue to most of them having been stripped from galaxies that fellinto the cluster at an early epoch. The younger galaxies are notas heavily stripped so do not have as large an impact on the ICL.This old ICL is different from the semi-analytic model result ofContini et al. (2014), who find a predominantly younger ICL (form-ing since z = 1).
MNRAS 467, 4501–4513 (2017)

Intracluster light in a Fornax-like cluster 4509
Table 4. Comparison of the ICL fraction in our simulation and in observed, simulated and semi-analytic model clusters.
Cluster mass ICL fraction ICL+BCG Reference ICL detection(M�) and notes
Observations 1.4 × 10¹⁵ 5.9 ± 1.8 per cent 8.2 ± 2.5 per cent Presotto et al. (2014) Source subtraction M(R < R500)>1015 >50 per cent Lin & Mohr (2004) Estimated via toy models
1013–1014 2.69 ± 1.6 McGee & Balogh (2010) Hostless SNe rates1013–1014 15.8 ± 8 Feldmeier et al. (2004a) Isophotal cut-off (non-cD clusters)
∼1014 1–4 per cent Burke et al. (2012) Isophotal cut-off (at z ∼ 1)7–15 per cent Feldmeier et al. (2004b) Planetary nebulae (Virgo cluster)
Simulations 1013–1015 ∼45 per cent Puchwein et al. (2010) Unbound particles+4 differentand SAMs Methods for separating ICL from BCG
1014 9–36 per cent Rudick et al. (2011) Binding energy/double-GaussianKinematic fit/density cut-off
1013–1014 21–34 per cent Sommer-Larsen et al. (2005) Stars outside the tidalRadii of all galaxies
>1013–1015 20–40 per cent Contini et al. (2014) SAM assuming stripped stars1014–1015 20–30 per cent Purcell et al. (2007) SAM assuming stripped stars4.1 × 1013 4.3 per cent 16 per cent This work
Our simulation does not include gas; nonetheless we pro-duce an ICL fraction comparable to that observed (e.g. Feld-meier et al. 2004b; Burke et al. 2012). Hydrodynamical simu-lations instead have produced much higher ICL fractions (e.g.Sommer-Larsen et al. 2005; Puchwein et al. 2010; Cui, Borgani &Murante 2014), some of it from stars forming directly out of clustergas (Puchwein et al. 2010). On the other hand, the ages of galaxiesin our simulation are similar to those of Puchwein et al. (2010).The main assumption upon which the ages of our galaxies rest, thatstar formation is quenched upon the galaxies entering the cluster, isborne out by the fully cosmological simulations.
In our simulation, the ICL density profile falls off more rapidlythan that of the DM. That the baryons are more centrally concen-trated than the DM is not surprising since they lose energy in settlingto the centre of haloes (White & Rees 1978).
AC K N OW L E D G E M E N T S
KAH would like to thank the University of Central Lancashirefor the grant to start this work, and Virginia Tech for allowing itscompletion, also John Feldmeier for his discussion. VPD is sup-ported by STFC Consolidated grant #ST/J001341/1. VPD, AJCand BBT would like to acknowledge the Undergraduate ResearchInternship Scheme (2011) for the funding to support early anal-ysis of this simulation, and also the Nuffield Foundation (2011)undergraduate bursary scheme and the Royal Astronomical Society(2012) for the support that contributed to the initial analysis in thispaper. EWP acknowledges support from the National Natural Sci-ence Foundation of China under Grant No. 11173003, and from theStrategic Priority Research Programme, ‘The Emergence of Cos-mological Structures’, of the Chinese Academy of Sciences, GrantNo. XDB09000105. The authors acknowledge the Texas AdvancedComputing Center (TACC)1 at The University of Texas at Austinfor providing HPC resources that have contributed to the researchresults reported within this paper. We thank Sam Earp for preparingFig. 2 for us.
R E F E R E N C E S
Aguerri J. A. L., Gerhard O. E., Arnaboldi M., Napolitano N. R., Castro-Rodriguez N., Freeman K. C., 2005, AJ, 129, 2585
1 http://www.tacc.utexas.edu
Arnaboldi M., 2004, in Duc P.-A., Braine J., Brinks E., eds, Proc. IAU Symp.217, Intracluster Stellar Population. Kluwer, Dordrecht, p. 54
Arnaboldi M., 2005, in Szczerba R., Stasinska G., Gorny S. K., eds, AIPConf. Proc. Vol., Intracluster Planetary Nebulae as Dynamical Probes ofthe Diffuse Light in Galaxy Clusters. Am. Inst. Phys., New York, p. 301
Arnaboldi M., Gerhard O., 2010, Highlights Astron., 15, 97Arnaboldi M. et al., 1996, ApJ, 472, 145Behroozi P. S., Wechsler R. H., Conroy C., 2013, ApJ, 770, 57Bennett C.L et al., 2013, ApJS, 208, 20Bertola F., Cinzano P., Corsini E. M., Rix H.-W., Zeilinger W. W., 1995,
ApJ, 448, 13Binggeli B., Popescu C. C., Tammann G. A., 1993, A&AS, 98, 275Blakeslee J. P. et al., 2009, ApJ, 694, 556Burke C., Collins C. A., Scott J. P., Hilton H., 2012, MNRAS, 425, 2058Calcaneo-Roldan C., Moore B., Bland-Hawthorn J., Malin D., Sadler E. M.,
2000, MNRAS, 314, 324Castro-Rodriguez N., Arnaboldi M., Aguerri J. A. L., Gerhard O., Okamura
S., Yasuda N., Freeman K. C., 2009, A&A, 507, 621Churazov E., Forman W., Vikhlinin A., Tremaine S., Gerhard O., Jones C.,
2008, MNRAS, 388, 1062Cole S., Lacey C. G., Baugh C. M., Frenk C. S., 2000, MNRAS, 319, 168Conroy C., Gunn J. E., 2007, ApJ, 712, 833Contini E., De Lucia G., Villalobos A., Borgani S., 2014, MNRAS 437,
3787Cooper A. P., Gao L., Quo Q., Frenk C. S., Jerkins A., Springel V., White
S. D. M., 2015, MNRAS, 451, 2703Cora S. S., 2006, MNRAS, 368, 1540Cui W., Borgani S., Murante G., 2014, MNRAS, 441, 1769Davies J. I. et al., 2013, MNRAS, 428, 834de Jong R. S., Radburn-Smith D. J., Sick J. N., 2009, in Andersen J., Bland-
Hawthorn J., Nordstrom B., eds, Proc. IAU Symp. 254, The Galaxy Diskin Cosmological Context. Cambridge Univ. Press, Cambridge, p. 19
Debattista V. P., Mayer L., Carollo C. M., Moore B., Wadsley J., Quinn T.,2006, ApJ, 645, 209
DeMaio T., Gonzalez A. H., Zabludoff A., Zaritsky D., Bradac M., 2015,MNRAS, 448, 1162
Diemand J., Madau P., Moore B., 2005, MNRAS, 364, 367Dolag K., Murante G., Borgani S., 2010, MNRAS, 405, 1544Drinkwater M. J. et al., 2000, A&A, 355, 900Drinkwater M. J., Gregg M. D., Colless M., 2001, ApJ, 548, 139Durrell P. R., Ciardullo R., Feldmeier J. J., Jacoby G. H., Sigurdsson S.,
2002, ApJ, 570, 119Durrell P. R. et al., 2014, ApJ, 794, 103Erwin P., 2005, MNRAS, 364, 283Feldmeier J. J., Mihos J. C., Morrison H. L., Rodney S. A., Harding P., 2002,
ApJ, 575, 779
MNRAS 467, 4501–4513 (2017)
4510 K. A. Harris et al.
Feldmeier J. J., Ciardullo R., Jacoby G. H., Durrell P. R., 2003, ApJS, 145,65
Feldmeier J. J., Mihos J. C., Morrison H. L., Harding P., Kaib N., DubinskiJ., 2004a, ApJ, 609, 617
Feldmeier J. J., Ciardullo R., Jacony G. H., Durrell P. R., Mihos J. C., 2004b,ApJ, 615, 196
Ferguson C., Tanvir N. R., von Hippel T., 1998, Nature, 391, 461Forman W., Jones C., 1990, in Oegerle W. R., Fitchett J., Danly L., eds,
Clusters of Galaxies. Cambridge Univ. Press, Cambridge, p. 257Fouque P., Solanes J. M., Sanchis T., Balkowski C., 2001, A&A, 375,
770Ftaclas C., Struble M. F., Fanelli M. N., 1984, ApJ, 282, 19Gal-Yam A., Maoz D., Guhathakurta P., Filippenko A. V., 2003, AJ, 125,
1087Giallongo E. et al., 2014, ApJ, 781, 24Gonzalez A. H., Zabludoff A. I., Zaritsky D., 2005, ApJ 618, 195Gonzalez A. H., Zaritsky D., Zabludoff A. I., 2007, ApJ 666, 147Guennou L. et al., 2012, A&A, 537, 64Hernquist L., 1990, ApJ, 356, 359Hilz M., Naab T., Ostriker J. P., Thomas J., Burkert A., Jesseit R., 2012,
MNRAS, 425, 3119Hilz M., Naab T., Ostriker J. P., 2013, MNRAS, 429, 2924Ikebe Y. et al., 1992, ApJ, 384, 5Jee M. J., 2010, ApJ, 717, 420Katz N., White S. D. M., 1993, ApJ, 412, 455Kazantzidis S., Kravtsov A. V., Zentner A. R., Allgood B., Nagai D., Moore
B., 2004, ApJ, 611, L73Kim S. et al., 2014, ApJS, 215, 22Kravtsov V., Alcaıno G., Marconi G., Alvarado F., 2014, ApJ, 783, 56Laporte C. F. P., White S. D. M., Naab T., Gao L., 2013, MNRAS, 435,
901Lee J., Kim S., Rey S. C., 2015, ApJ, 807, 122Lin Y. T., Mohr J. J., 2004, ApJ, 617, 879McGee S. L., Balogh M. L., 2010, MNRAS, 403, 79Mandelbaum R., Seljak U., Baldauf T., Smith R. E., 2010, MNRAS, 405,
2078Martel H., Barai P., Brito W., 2012, ApJ, 757, 48Melnick J., Giraud E., Toledo I., Selman F., Quintana H., 2012, MNRAS,
427, 850Merritt D., 1984, ApJ, 276, 26Mihos J. C., Harding P., Feldmeier J., Morrison H., 2005, ApJ, 631, 41Mihos J. C., Janowiecki S., Feldmeier J. J., Harding P., Morrison H., 2009,
ApJ, 698, 1879Moore B., Katz N., Lake G., Dressler A., Oemler A., 1996, Nature, 379,
613Moster B. P., Naab T., White S. D. M., 2013, MNRAS, 428, 312Moster B. P., Maccio A. V., Somerville R. S., 2014, MNARS, 437, 1027Murante G. et al., 2004, ApJ, 607, 83Murante G., Giovalli M., Gerhard O., Arnaboldi M., Borgani S., Dolag K.,
2007, MNRAS, 377, 2Napolitano N. R. et al., 2003, ApJ, 594, 172Nasonova O. G., de Freitas Pacheco J. A., Karachentsev I. D., 2011, A&A,
532, 104Navarro J. F., Frenk C. S., White S. D. M., 1997, ApJ, 490, 493Neill J. D., Shara M. M., Oegerle W. R., 2005, ApJ, 618, 692Newman A. B., Ellis R. S., Bundy K., Treu T., 2012, ApJ, 746, 162Oegerle W. R., Hill J. M., 1992, AJ, 104, 2078Oemler A., Jr, 1976, ApJ, 209, 693Palladino L. E. et al., 2012, AJ, 143, 128Penarrubia J., Ma Y.-Z., Walker M. G., McConnachie A., 2014, MNRAS,
443, 2204Peng Y.-j. et al., 2010, ApJ, 721, 193Peng E. W. et al., 2011, ApJ, 730, 23Peterson J. R., Kahn S. M., Paerels F. B. S., Kaastra J. S., Tamura T., Bleeker
J. A. M., Ferrigno C., Jernigan J. G., 2003, ApJ, 590, 207Pohlen M., Trujillo I., 2005, A&A, 454, 759Pohlen M., Dettmar R.-J., Lutticke R., 2000, A&A 357, 1
Pohlen M., Dettmar R.-J., Lutticke R., Aronica G., 2002, A&A 392, 807Presotto V. et al., 2014, A&A, 565, A126Puchwein E., Springel V., Sijacki D., Dolag K., 2010, MNRAS, 406,
936Purcell C. W., Bullock J. S., Zentner A. R., 2007, ApJ, 666, 20Raha N., Sellwood J. A., James R. A., Kahn F. D., 1991, Nature, 352,
411Rudick C. S., Mihos J. C., McBride C. K., 2006, ApJ, 648, 936Rudick C. S., Mihos J. C., Frey L. H., McBride C. K., 2009, ApJ, 699,
1518Rudick C. S., Mihos J. C., McBride C. K., 2011, ApJ, 732, 48Saglia R. P., Kronawitter A., Gerhard O., Bender R., 2000, ApJ, 119, 153Sand D. J. et al., 2011, ApJ, 729, 142Schombert J. M., 1986, ApJS, 60, 603Schombert J. M., 1988, ApJ, 328, 475Shara M. M., 2006, AJ, 131, 2980Sivanandam S., Zabludoff A. I., Zaritsky D., Gonzalez A. H., Kelson D. D.,
2009, ApJ, 691, 1787Smith H. A., 1981, AJ, 86, 998Sommer-Larsen J., Romeo A. D., Portinari L., 2005, MNRAS, 357, 478Spergel D. N. et al., 2003, ApJS, 148, 175Springel V., White S. D. M., 1999, MNRAS, 307, 162Stadel J. G., 2001, PhD thesis, Univ. WashingtonSun M., Donahue M., Roediger E., Nulsen P. E. J., Voit G. M., Sarazin C.,
Forman W., Jones C., 2010, ApJ, 708, 946Tal T. et al., 2014 ApJ, 789, 164Taranu D. S., Hudson M. J., Balogh M. L., Smith R. J., Power C., Oman K.
A., Krane B., 2014, MNRAS, 440, 1934Thuan T. X., Romanishin W., 1981, ApJ, 248, 439Toledo I., Melnick J., Selman F., Quintana H., Giraud E., Zelaya P., 2011,
MNRAS, 414, 602van der Kruit P. C., 1979, A&A, 38, 15van der Kruit P. C., 1987, A&A, 173, 59White S. D. M., 1976, MNRAS, 174, 19White S. D. M., 1978, MNRAS, 184, 185White S. D. M., Rees M. J., 1978, MNRAS, 183, 341Williams B. F. et al., 2007, ApJ, 654, 835Williams R. J., Quadri R. F., Franx M., van Dokkum P., Toft S., Kriek M.,
Labbe I., 2010, ApJ, 713, 738Willman B., Governato F., Wadsley J., Quinn T., 2004, MNRAS, 355, 159Zhang Y.-Y, Lagana T. F., Pierini D., Puchwein E., Schneider P., Reiprich
T. H., 2011, A&A, 535, 78Zhao D., Aragon-Salamanca A., Conselice C. J., 2015, MNRAS, 453,
4444Zibetti S., 2008, in Davies J. I, Disney M. J., eds, Proc. IAU Symp. 244,
Dark Galaxies and Lost Baryons. Kluwer, Dordrecht, p. 176Zibetti S., White S. D. M., 2005, in Jerjen H., Binggeli B., Proc. IAU Colloq.
198, Near-fields Cosmology With Dwarf Elliptical Galaxies. CambridgeUniv. Press, Cambridge, p. 337
Zwicky F., 1951, PASP, 63, 61
S U P P O RT I N G IN F O R M AT I O N
Supplementary data are available at MNRAS online.
Figure A1. Dark matter volume density profile for G01–G06.Figure A2. Surface brightness profile in the V band for the wholegalaxy (black solid), the disc stars (blue dotted) and the bulge stars.Figure A3. The orbit taken by galaxies G01–G06. The initial inser-tion point is given by a brown diamond.
Please note: Oxford University Press is not responsible for thecontent or functionality of any supporting materials supplied bythe authors. Any queries (other than missing material) should bedirected to the corresponding author for the article.
MNRAS 467, 4501–4513 (2017)
Intracluster light in a Fornax-like cluster 4511
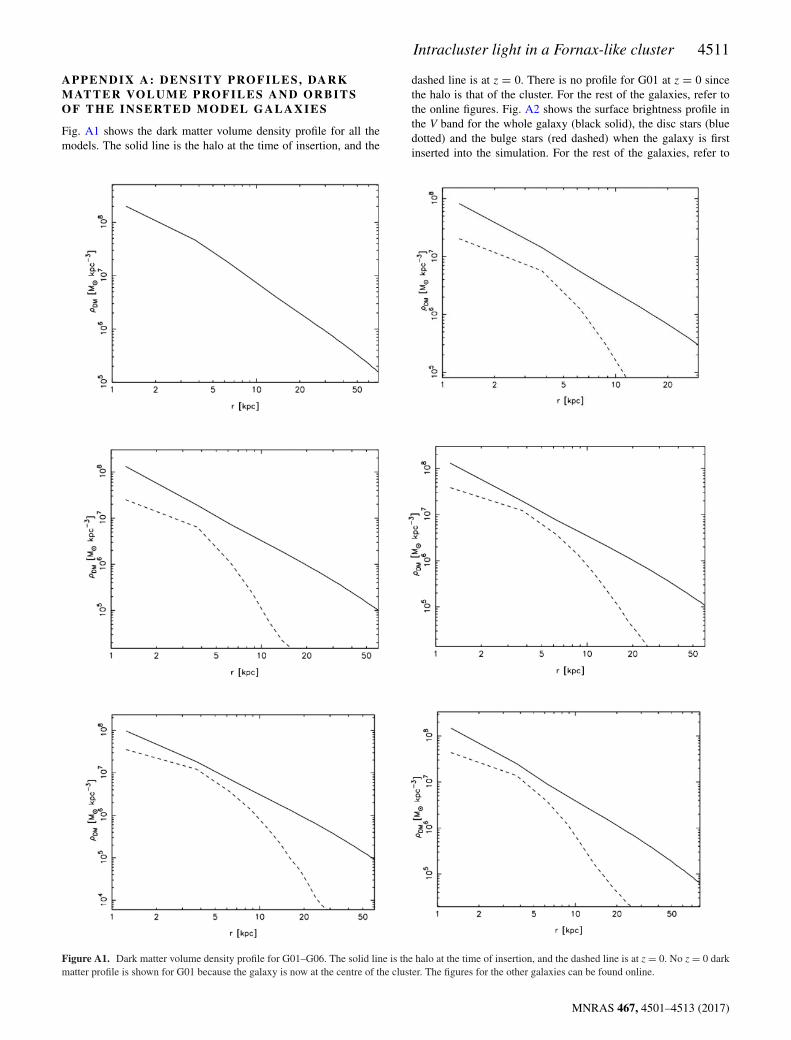
APPENDIX A : D ENSITY PROFILES, DARKMATTER VO LUME PROFILES AND ORBIT SO F T H E IN S E RT E D M O D E L G A L A X I E S
Fig. A1 shows the dark matter volume density profile for all themodels. The solid line is the halo at the time of insertion, and the
dashed line is at z = 0. There is no profile for G01 at z = 0 sincethe halo is that of the cluster. For the rest of the galaxies, refer tothe online figures. Fig. A2 shows the surface brightness profile inthe V band for the whole galaxy (black solid), the disc stars (bluedotted) and the bulge stars (red dashed) when the galaxy is firstinserted into the simulation. For the rest of the galaxies, refer to
Figure A1. Dark matter volume density profile for G01–G06. The solid line is the halo at the time of insertion, and the dashed line is at z = 0. No z = 0 darkmatter profile is shown for G01 because the galaxy is now at the centre of the cluster. The figures for the other galaxies can be found online.
MNRAS 467, 4501–4513 (2017)

4512 K. A. Harris et al.
Figure A2. Surface brightness profile in the V band for the whole galaxy (black solid), the disc stars (blue dotted) and the bulge stars (red dashed) when thegalaxy is first inserted into the simulation for G01–G06. The figures for the other galaxies can be found online.
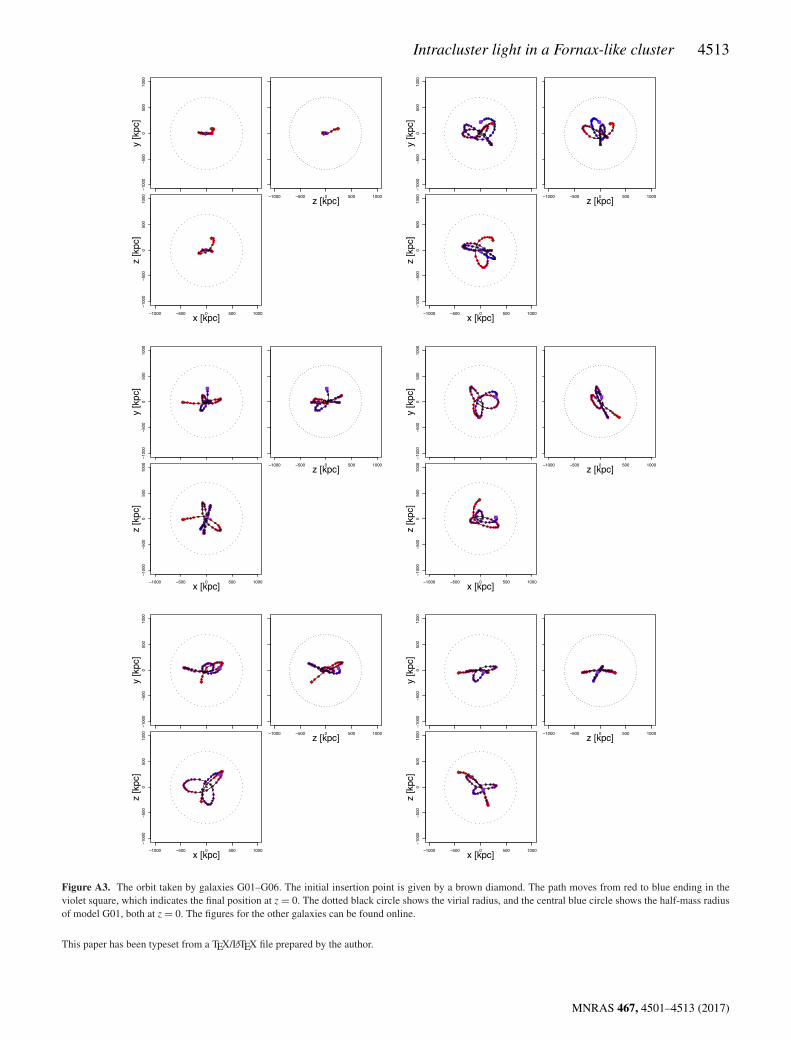
the online figures. Fig. A3 shows the orbit taken by that galaxy,with the galaxies moving from red to blue as time progresses. Theinitial insertion point is given by a brown diamond. The path movesfrom red to blue ending in the violet square, which indicates the
final position at z = 0. The dotted circle shows the cluster virialradius while the smaller solid circle in the centre shows the half-light radius of the cD galaxy at z = 0. For the rest of the galaxies,refer to the online figures.
MNRAS 467, 4501–4513 (2017)
Intracluster light in a Fornax-like cluster 4513
Figure A3. The orbit taken by galaxies G01–G06. The initial insertion point is given by a brown diamond. The path moves from red to blue ending in theviolet square, which indicates the final position at z = 0. The dotted black circle shows the virial radius, and the central blue circle shows the half-mass radiusof model G01, both at z = 0. The figures for the other galaxies can be found online.
This paper has been typeset from a TEX/LATEX file prepared by the author.
MNRAS 467, 4501–4513 (2017)