quantifying the potential benefits of automated …
TRANSCRIPT

1
QUANTIFYING THE POTENTIAL BENEFITS OF
AUTOMATED DATA ACQUISITION TECHNOLOGIES INTEGRATION IN CONSTRUCTION DATA MANAGEMENT
BASED ON BAYESIAN BELIEF NETWORK ANALYSIS
By
JINTAEK OCK
A THESIS PRESENTED TO THE GRADUATE SCHOOL OF THE UNIVERSITY OF FLORIDA IN PARTIAL FULFILLMENT
OF THE REQUIREMENTS FOR THE DEGREE OF MASTER OF SCIENCE IN BUILDING CONSTRUCTION
UNIVERSITY OF FLORIDA
2011

2
© 2011 Jintaek Ock

3
To my parents and wife for unconditional support and encouragement

4
ACKNOWLEDGMENTS
I would like to express my sincere gratitude to all people who encouraged me to
complete this study. The completion of this study would not have been accomplished
without their assistance and advice.
First and foremost, I would like to gratefully and sincerely thank my advisor and
chair of committee, Dr. R. Raymond Issa, for his guidance throughout my graduate
study with encouragement.
I also would like to express my gratitude to the co-chair of committee, Dr. Ian
Flood who inspired me to have interests about this research.
I am also grateful for the guidance of Dr. E. Douglas Lucas, supportive and
foundational member of my graduate committee who has encouraged my fascination to
focus on the research.
5
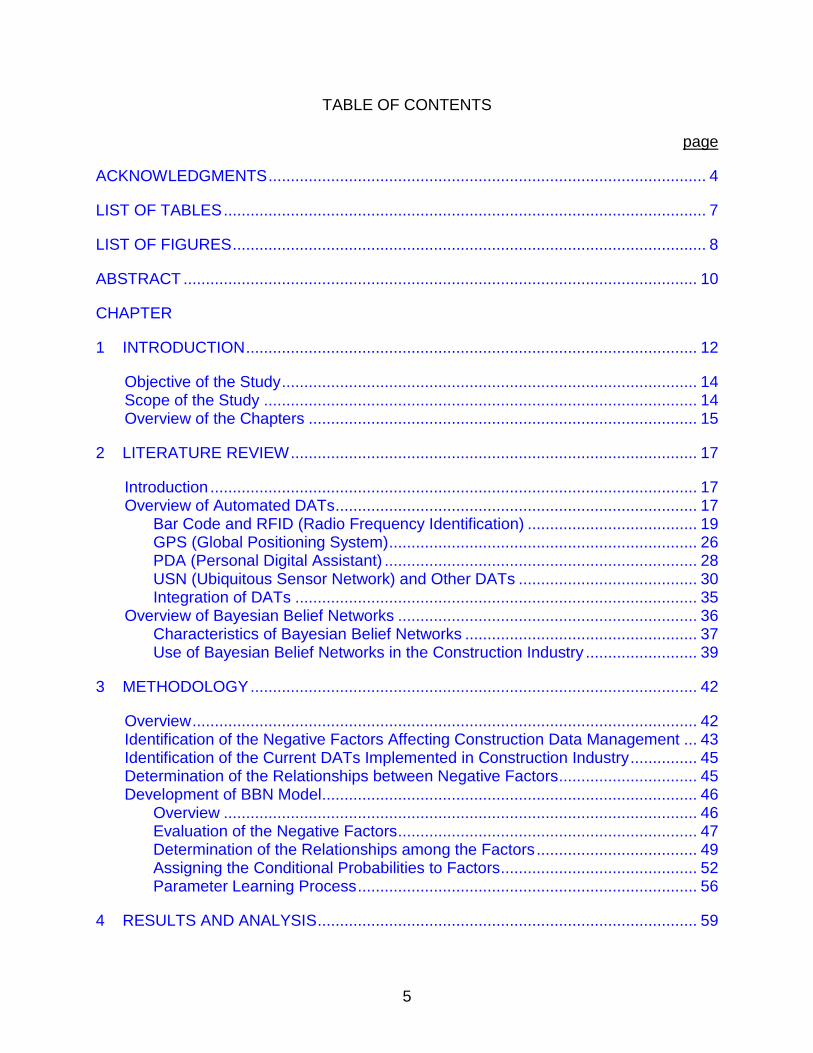
TABLE OF CONTENTS page
ACKNOWLEDGMENTS .................................................................................................. 4
LIST OF TABLES ............................................................................................................ 7
LIST OF FIGURES .......................................................................................................... 8
ABSTRACT ................................................................................................................... 10
CHAPTER
1 INTRODUCTION ..................................................................................................... 12
Objective of the Study ............................................................................................. 14 Scope of the Study ................................................................................................. 14
Overview of the Chapters ....................................................................................... 15
2 LITERATURE REVIEW ........................................................................................... 17
Introduction ............................................................................................................. 17
Overview of Automated DATs ................................................................................. 17 Bar Code and RFID (Radio Frequency Identification) ...................................... 19
GPS (Global Positioning System) ..................................................................... 26 PDA (Personal Digital Assistant) ...................................................................... 28
USN (Ubiquitous Sensor Network) and Other DATs ........................................ 30 Integration of DATs .......................................................................................... 35
Overview of Bayesian Belief Networks ................................................................... 36
Characteristics of Bayesian Belief Networks .................................................... 37 Use of Bayesian Belief Networks in the Construction Industry ......................... 39
3 METHODOLOGY .................................................................................................... 42
Overview ................................................................................................................. 42 Identification of the Negative Factors Affecting Construction Data Management ... 43
Identification of the Current DATs Implemented in Construction Industry ............... 45 Determination of the Relationships between Negative Factors ............................... 45 Development of BBN Model .................................................................................... 46
Overview .......................................................................................................... 46
Evaluation of the Negative Factors ................................................................... 47 Determination of the Relationships among the Factors .................................... 49 Assigning the Conditional Probabilities to Factors ............................................ 52 Parameter Learning Process ............................................................................ 56
4 RESULTS AND ANALYSIS ..................................................................................... 59

6
Overview .......................................................................................................... 59
Evaluations of the Survey ................................................................................. 59 Re-Organization of Dataset for Bayesian Belief Network (BBN) Analysis ........ 64
BBN Analysis for Large Companies Specialized in Resident Building ............. 65 BBN Analysis for Small Companies Specialized in Resident Building .............. 70
5 CONCLUSIONS ...................................................................................................... 75
6 DISCUSSIONS AND RECOMMENDATIONS ......................................................... 80
APPENDIX: THE SAMPLE OF SURVEY FORM .......................................................... 81
LIST OF REFERENCES ............................................................................................... 86
BIOGRAPHICAL SKETCH ............................................................................................ 91
7
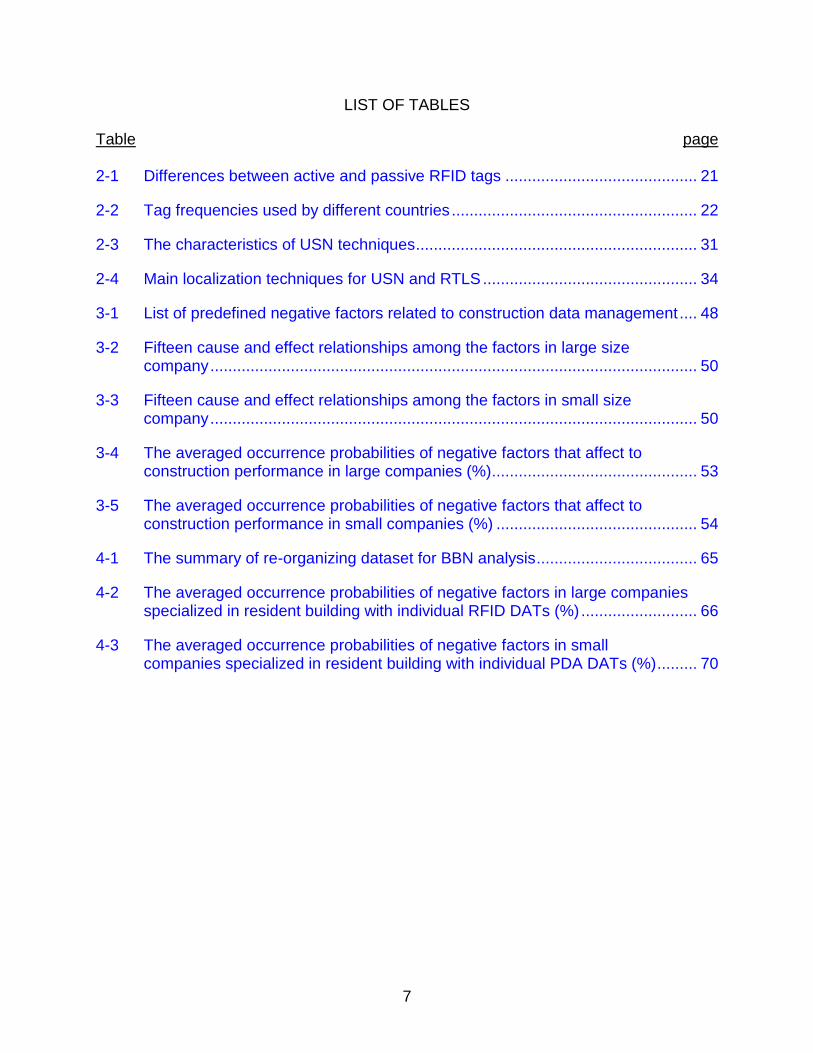
LIST OF TABLES
Table page 2-1 Differences between active and passive RFID tags ........................................... 21
2-2 Tag frequencies used by different countries ....................................................... 22
2-3 The characteristics of USN techniques ............................................................... 31
2-4 Main localization techniques for USN and RTLS ................................................ 34
3-1 List of predefined negative factors related to construction data management .... 48
3-2 Fifteen cause and effect relationships among the factors in large size company ............................................................................................................. 50
3-3 Fifteen cause and effect relationships among the factors in small size company ............................................................................................................. 50
3-4 The averaged occurrence probabilities of negative factors that affect to construction performance in large companies (%).............................................. 53
3-5 The averaged occurrence probabilities of negative factors that affect to construction performance in small companies (%) ............................................. 54
4-1 The summary of re-organizing dataset for BBN analysis .................................... 65
4-2 The averaged occurrence probabilities of negative factors in large companies specialized in resident building with individual RFID DATs (%) .......................... 66
4-3 The averaged occurrence probabilities of negative factors in small companies specialized in resident building with individual PDA DATs (%) ......... 70

8
LIST OF FIGURES
Figure page 2-1 Distribution of automated DATs depending on management types in
construction industry ........................................................................................... 18
2-2 Conceptual implementation of barcode with PDA integration for material management on construction site ....................................................................... 20
2-3 Automated Project Performance Control (APPC) by active RFID tag ................. 23
2-4 GPS data acquiring techonology (DAT) system (Hass 2000) ............................. 27
2-5 Data processing by PDA in construction job site (Kim et al. 2007) ..................... 29
2-6 Illustration of the intelligent lift toolkit concept for elevator and intelligent lift (Adapted from Cho et al. 2010) .......................................................................... 32
2-7 The concept of wireless localization techniques for USN and RTLS .................. 33
2-8 A simple belief network of construction activity................................................... 38
2-9 Automated process for integration of BBNs and computer simulations (Adapted from McCabe et al. 1998) .................................................................... 40
2-10 The conceptual BBN-based model for predicting the probability of construction delay (Luu et al. 2009) .................................................................... 41
3-1 Dynamic survey form used for this study. ........................................................... 44
3-2 The development of a BBN model procedure for this study. .............................. 47
3-3 The development of predefined negative factors that affect to construction performance in GeNIe Ver.2.0 ............................................................................ 48
3-4 The development of relationships among factors for large size company .......... 51
3-5 The development of relationships among factors for small size company .......... 52
3-6 The initial BBN development with probability of occurrence of each factors for large companies ................................................................................................. 55
3-7 The initial BBN development with probability of occurrence of each factors for small companies ................................................................................................. 56
3-8 The BBN model after parameter learning process for large companies ............. 57
3-9 The BBN model after parameter learning process for small companies ............. 58

9
4-1 The distribution of respondents’ working years................................................... 60
4-2 The distribution of companies’ specialties .......................................................... 60
4-3 The companies’ average annual revenue during past 5 years ........................... 61
4-4 The implementaion of DATs on the respondents’ construction projects ............. 62
4-5 The types of implementaed DATs in large construction companies ................... 62
4-6 The types of implementaed DATs in small construction companies ................... 63
4-7 The new developed BBN model for five respondents’ large companies specialized in resident building with individual RFID systems implementation ... 67
4-8 The change of F6 factor’s probability in the BBN analysis for five respondents’ large companies specialized in resident building with individual RFID systems implementation ............................................................................ 68
4-9 The change of F4 factor’s probability in the BBN analysis for five respondents’ large companies specialized in resident building with individual RFID systems implementation ............................................................................ 69
4-10 The new developed BBN model for six respondents’ small companies specialized in resident building with individual PDA systems implementation .... 72
4-11 The change of F1 and F2 factors’ probability in the BBN analysis for six respondents’ small companies specialized in resident building with individual PDA systems implementation ............................................................................. 73
4-12 The change of F1, F2, and F7 factors’ probability in the BBN analysis for six respondents’ small companies specialized in resident building with individual PDA systems implementation ............................................................................. 74
5-1 Different probabilities of construction performances depending on the applied types of DATs in large companies specializing in hig hrise residential building construction ........................................................................................................ 78
5-2 Different probabilities of construction performances depending on the applied types of DATs in small companies specializing in high rise residential building construction ........................................................................................................ 78

10
Abstract of Thesis Presented to the Graduate School of the University of Florida in Partial Fulfillment of the
Requirements for the Degree of Master of Science in Building Construction
QUANTIFYING THE POTENTIAL BENEFITS OF AUTOMATED DATA ACQUISITION TECHNOLOGIES INTEGRATION
IN CONSTRUCTION DATA MANAGEMENT BASED ON BAYESIAN BELIEF NETWORK ANALYSIS
By
Jintaek Ock
May 2011
Chair: R. Raymond Issa Cochair: Ian Flood Major: Building Construction
It is widely recognized that construction activities may be one of the most complex
industrial activities. Due to the complexity of construction activities, vast amounts of
data are generated from every construction project. The collection and analysis of
generated construction data are significant for contractors to be able to track the
schedule, duration, labor, materials, and costs of construction projects. Therefore,
adequate data management is required for successful project delivery.
Recently, as the size of construction projects is getting bigger and more
complicated, the improvement of data management methods is necessary in
construction activities. In today’s construction industry, use of IT (Information
Technology) is being emphasized to support these needs. Specifically, systems using
various automated DATs (Data Acquisition Technologies) such as Bar Code, GPS
(Global Positioning System), PDA (Personal Digital Assistant), RFID (Radio Frequency
Identification), and USN (Ubiquitous Sensor Network) are being developed to facilitate
data collection on construction sites.

11
In typical construction practices, manual data collecting system often cause
problems of delaying completion or overrun project costs. In general, inaccuracy and
inefficiency of data management leads to these problems. The integration of automated
DATs in construction data management enables the reduction of inaccuracies by
increasing the efficiency in data acquisition on construction sites, and it ultimately
results in productivity improvement. Automated DATs can now be employed in various
construction activities. For example, GPS and wireless technique can be used in
construction site management, or road construction; and RFID systems have great
capacity to control and monitor construction materials. Many studies highlight the
requirement of advanced DATs’ utilization in construction industries enabling us to
control time and cost for projects in an effort to meet the expected results.
Even though previous studies indicate that automated DATs have great benefits
for construction data management and enhance project performance, the actual impact
of integration of automated DATs on construction productivity has not been fully
investigated. This study identified and quantified the potential of integration of DATs on
construction site using Bayesian belief networks.

12
CHAPTER 1 INTRODUCTION
Typical construction processes require adequate project management to control
their execution. As the construction industry grows and projects get more complicated,
advanced project management practices need to be adapted and developed. For
successful construction delivery, productivity enhancement, risk management, cost
analysis, schedule management, and data management are regarded as crucial project
management practices. Of these management practices, data management is,
particularly, experiencing a quite advancement, with innovative development of
construction information management systems.
Effective construction data management plays a significant role in recording and
tracking all construction activities. Furthermore, collected data can be used to assess
the status of the project and to take corrective actions if needed. In spite of the
significance of data management in construction projects, manual or partially automated
data collecting procedures are used in construction sites. Manual data management
procedures are labor intensive, inaccurate, and error prone. The weaknesses in
manual data management practices cause a decrease in construction productivity, cost
overruns, and schedule delays. On the other hand, the automated data acquisition
technologies (DATs) for construction data management provide benefits for productivity
improvement, time saving, and efficiency for data collection on construction sites.
In practice, several of automated DATs such as Bar Code, Global Positioning
System (GPS), Personal Digital Assistant (PDA), Radio Frequency Identification (RFID),
3D scanning, and USN (Ubiquitous Sensor Network) are used on construction sites,
enabling contractors to track construction data. However, several limitations and
13
disadvantages for each DAT type prevent the development of automated data
management. Each DAT has its own characteristic and it can be utilized in limited
construction activities. In addition, the outputs from current DATs might not be
interoperable between different information technology (IT) platforms. Another limitation
of DATs is the installation costs and uncertainties of DATs applications. One of the
disadvantages of DATs is that specialized expertise may be required to operate certain
DAT applications, and excess data may cause additional processes to be needed.
Another problem in utilizing automated DATs is that there is no evidence of reliable DAT
systems in practice. Therefore, the characteristics of different automated DATs are
needed to be evaluated and analyzed in order to enhance their capabilities and to
overcome limitations, enabling the integration of DATs to be used in construction data
management.
In addition, even though the significance of each automated DAT is emphasized
by many researches and studies, the very limited studies have been just focused on
comprehensive explorations of automated DAT utilization in the construction industry.
In other words, previous studies about automated DATs are mainly focused on a
specific DAT for use by just a certain work group such as materials management,
quality management, and workers’ schedule monitoring. Therefore, comprehensive
analysis and perspective studies with comparison of DATs are required to advance the
development of automated DATs in the construction industry.
In this study, the characteristics of each automated DAT are investigated with
detailed literature reviews. Also, the advantages and disadvantages of each DAT are
described in detail. Then, the need for integration of automated DATs in construction

14
sites will be analyzed, and the potential of integration of DATs for construction data
management will be assessed using Bayesian belief network (BBN) analysis.
Objective of the Study
Since information systems were developed and introduced to the construction
industry, numerous efforts to apply state-of-the-art information technology to
construction field have been made. As a result, various kinds of automated DATs are
developed for construction projects. The use of automated DATs on construction sites
provides efficient management practices for control of material, schedule, cost, and
productivity. However, individual automated DATs currently used on construction sites
have limitations and disadvantages. Furthermore, small contractors have a tendency to
hesitate about utilizing DATs in their project because of installation cost and
uncertainties about DATs’ performance.
Based on these problems of automated DATs, this study aims to identify current
automated DATs’ development and trends in construction management through
detailed literature reviews and surveys. Subsequently, the potential benefits of the
integration of DATs are demonstrated in this study. In order to clarify the positive
factors for DATs’ integration on real construction sites, the potential benefits of DATs
will be evaluated and quantified using Bayesian belief network (BBN) analysis. In
addition, prospective approaches for DATs’ integrations and direction of future study will
be proposed in this study.
Scope of the Study
One of the main purposes of this study, latest DATs’ development status and
current utilization trends are introduced with literature reviews and case studies. In
order to provide the feasibility of current DATs’ integration, limited representative DATs,
15
which are Barcode, GPS, PDA, RFID, 3D scanning, and USN (Ubiquitous Sensor
Network), is proposed in this study.
Since the main objective of this study is to quantify the potential benefits of the
integration of DATs for construction data management, some mechanical fundamentals
and technical explanations are excluded from this study.
A survey for this study was distributed to Korean contractors because it is
considered that Korean firms have a great tendency to use IT in construction projects in
comparison with companies in other countries. The data generated from the survey and
literature reviews will be used as variables through the Bayesian belief network analysis
for this study.
Overview of the Chapters
The present study will address the importance of integration of DATs in
construction data management practices, and attempt to quantify the potential benefits
of DATs’ integration using Bayesian belief network analysis.
Chapter 2 presents a literature review about automated DATs in construction
industry. The reviews include the overview of each automated DAT’s characteristics
and its performances. Also, the characteristics of Bayesian belief network analysis are
presented in this section.
Chapter 3 describes the methodology of this study. The current data of automated
DATs’ use were collected by survey. In the survey, supplementary questionnaires were
given to respondents in order to verify the current DATs’ effects on construction
activities. The procedure and theory of Bayesian belief network analysis is also
discussed in this section.

16
Chapter 4 summarizes the results of this study, and outlines the data analysis from
the Bayesian belief network. Furthermore, the comparison of potential benefits of
automated DATs’ integration in between real construction sites and this study is
provided.
Chapter 5 provides the conclusions and recommendations based on the findings
from this study. The discussion of the possible ramification for DATs’ integration in real
construction practices is highlighted in this section.

17
CHAPTER 2 LITERATURE REVIEW
Introduction
This chapter discusses current and relevant automated DATs information and the
characteristics of Bayesian belief network analysis. First, an overview of automated
DATs and current use of each DAT’s introduction is included in this section. Second,
some examples of the integration of automated DATs and their potential benefits are
highlighted. Lastly, the characteristics and methodology for Bayesian belief network
analysis are summarized.
Overview of Automated DATs
Automated DATs have rapidly evolved with the development of IT. As a result, the
areas of automated DATs’ utilizations are being expanded to the construction industry,
and these can be applied to effective data management on construction projects.
During the past few decades, the effort to manually acquire and manage construction
data has been a major barrier to improving the effectiveness of construction
management (Nasir et al. 2010; Seo et al. 2010). However, implementation of recent
automated DATs in the construction industry can greatly improve the overall
construction management processes by enabling automatic data collection.
There are several representative DATs currently used on construction project sites
including Bar Codes, Global Positioning Systems (GPS), Personal Digital Assistants
(PDA), Radio Frequency Identification (RFID), USN (Ubiquitous Sensor Network), and
3D scanning (Seo and Jung 2008).
Seo et al. (2010) classified the distribution of representative DATs’ use based on
the type of project management used on construction project sites (see Figure 2-1).

18
This distribution was generated by the analysis of the frequency of DATs’ application
from previous studies. As shown in Figure 2.1, RFID and GPS are mostly used for
material and schedule management, respectively.
Figure 2-1. Distribution of automated DATs depending on management types in construction industry
When automated DATs are implemented on construction sites, labor-free and
accurate construction data can be easily collected. Therefore, controlling or tracking the
project status is more efficient, and it leads to productivity improvement.
However, each DAT has its limitation of suitability to track construction operations.
Thus, the limitations of each DAT application and the integration of DATs to alleviate
individual DAT’s limitations should be studied and analyzed (El-Omari and Moselhi
2009).
19
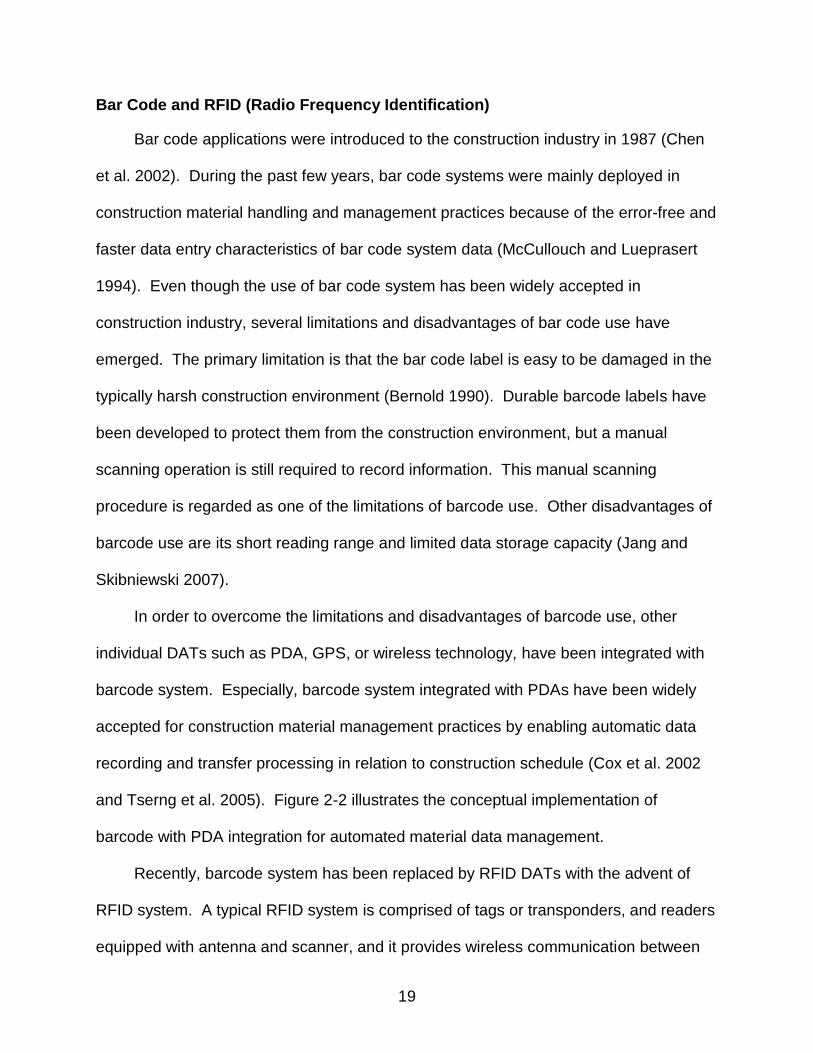
Bar Code and RFID (Radio Frequency Identification)
Bar code applications were introduced to the construction industry in 1987 (Chen
et al. 2002). During the past few years, bar code systems were mainly deployed in
construction material handling and management practices because of the error-free and
faster data entry characteristics of bar code system data (McCullouch and Lueprasert
1994). Even though the use of bar code system has been widely accepted in
construction industry, several limitations and disadvantages of bar code use have
emerged. The primary limitation is that the bar code label is easy to be damaged in the
typically harsh construction environment (Bernold 1990). Durable barcode labels have
been developed to protect them from the construction environment, but a manual
scanning operation is still required to record information. This manual scanning
procedure is regarded as one of the limitations of barcode use. Other disadvantages of
barcode use are its short reading range and limited data storage capacity (Jang and
Skibniewski 2007).
In order to overcome the limitations and disadvantages of barcode use, other
individual DATs such as PDA, GPS, or wireless technology, have been integrated with
barcode system. Especially, barcode system integrated with PDAs have been widely
accepted for construction material management practices by enabling automatic data
recording and transfer processing in relation to construction schedule (Cox et al. 2002
and Tserng et al. 2005). Figure 2-2 illustrates the conceptual implementation of
barcode with PDA integration for automated material data management.
Recently, barcode system has been replaced by RFID DATs with the advent of
RFID system. A typical RFID system is comprised of tags or transponders, and readers
equipped with antenna and scanner, and it provides wireless communication between

20
tags and readers. These fundamental characteristics of RFID technology are capable
of eliminating the limitations of barcode system. Unlike barcode technology, RFID
systems have the ability to identify and track materials and equipment without manual
recording operation. Furthermore, RFID systems have large storage capacity, wide
reading range, durability, and high level of security (Lee et al. 2006). In general, 64 to
32,768 bytes of data can be saved onto an RFID tag (Jaselskis and El-misalami 2003).
Figure 2-2. Conceptual implementation of barcode with PDA integration for material management on construction site
There are two types of RFID tags: active and passive. The tags use different
frequencies depending on which countries they are used in. Table 2-1 summarizes the
different characteristics between active and passive RFID tags and the different tag
frequencies used by different countries.

21
With the rapid development of active RFID tags technology, their suitability for use
in the construction industry is greatly advanced. As a result, the area of RFID DATs’
application has been expanded to various construction fields such as risk management,
waste management, material control process, labor management, and tower crane
development.
Table 2-1. Differences between active and passive RFID tags
Issues Active RFID tags Passive RFID tags
Power sources Internal Energy transferred from the reader
Power availability Continuous When it is in the field of the reader
Communication range Up to 300 feet Up to 40 feet
Data storage Large Small
Signal strength from tag to reader High Low
Signal strength from reader to tag Low High
Weight 120-130 g 6-54 g
Capabilities Read/Write Read only
Operational life 5-10 years Unlimited
Memory 2 MB Up to 16 kb
Cost ($) 15-50 0.10-4
Adapted from http://www.inlogic.com/rfid/passive_vs_active.aspx
For example, active RFID system tags, which are built with a wide range of
scanning capacity and internal battery, has been mostly used for material control
management on construction job sites (Goodrum et al. 2005). The active RFID tag is,
generally, capable of covering more than 1,000 feet of reading range (Lee et al. 2007).
Since active RFID systems have automatic data reading and recording capacity,
material control systems using RFID DAT are more advantageous to productivity

22
enhancement, rather than the use of integration of barcode with PDA for material
management in construction job sites (Navon and Berkovich 2005).
Table 2-2. Tag frequencies used by different countries
Frequencies Tags application areas Costs ($)
125-134 KHz USA, Canada, Japan, Europe 3 -10
13.56 MHz USA, Canada, Japan, Europe 0.5-5.00
433.05-434.79 MHz In most of USA and Europe and under consideration in Japan
-
865-868 MHz Europe -
866-869 and 923-969 MHz South Korea 0.75 and up
902-928 MHz USA 0.75 and up
952-954 MHz Japan (for passive tag after 2005) 0.75 and up
2400-2500 and 5.725-5.875 GHz USA, Canada, Japan, Europe -
Adapted from Qiu (2007)
Another RFID DAT application was developed for safety management in the
construction industry through the evaluation of past accident history. Chae and Yoshida
(2009) developed the prototype to estimate the working area for the prevention of
collision accidents. In this prototype, based on the record of past accidents, a defined
function is applied to the RFID reader system and active RFID tags work as a alarm
system if the estimation of working area is out of defined function (Chae and Yoshida
2009). This type of RFID DATs, referred to Automated Project Performance Control
(APPC), requires the evaluation of past information to establish desired performance.
On job sites, actual performance data are collected by RFID system, and the data are
compared to the desired performance. When deviation is detected, the construction
management should be analyzed (Navon 2007). Figure 2-3 illustrates a repetitive and
cyclic process of Automated Project Performance Control system by RFID DATs.
23
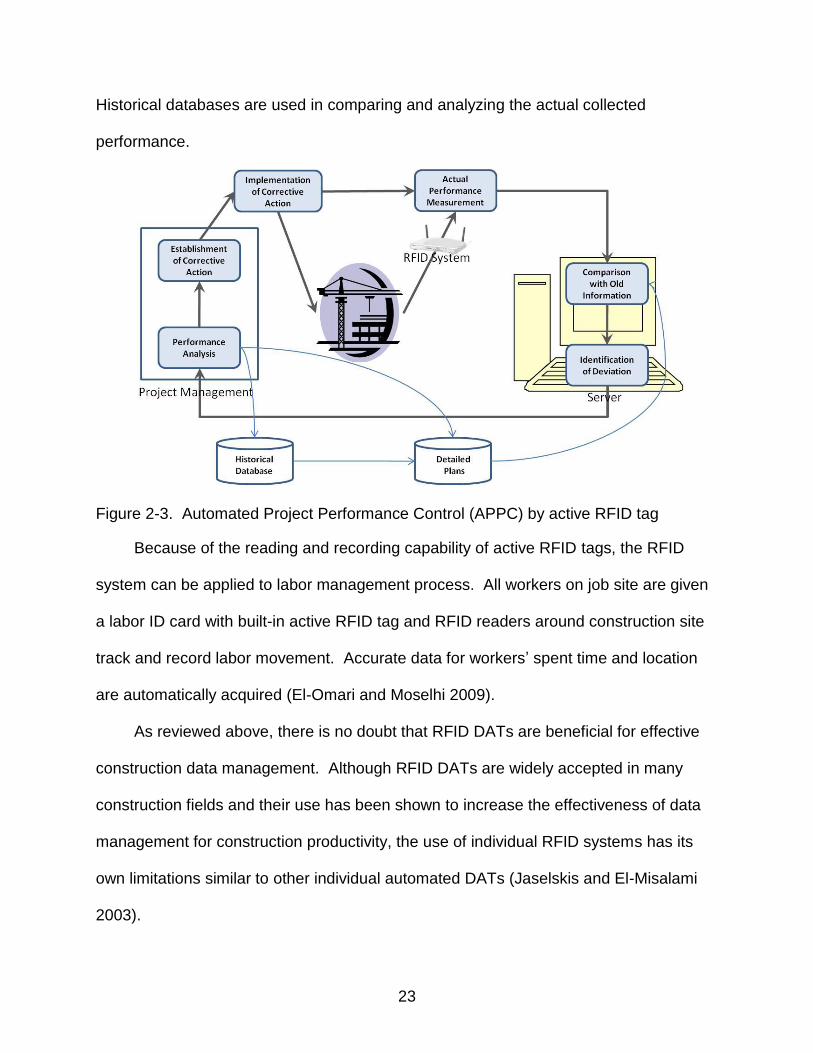
Historical databases are used in comparing and analyzing the actual collected
performance.
Figure 2-3. Automated Project Performance Control (APPC) by active RFID tag
Because of the reading and recording capability of active RFID tags, the RFID
system can be applied to labor management process. All workers on job site are given
a labor ID card with built-in active RFID tag and RFID readers around construction site
track and record labor movement. Accurate data for workers’ spent time and location
are automatically acquired (El-Omari and Moselhi 2009).
As reviewed above, there is no doubt that RFID DATs are beneficial for effective
construction data management. Although RFID DATs are widely accepted in many
construction fields and their use has been shown to increase the effectiveness of data
management for construction productivity, the use of individual RFID systems has its
own limitations similar to other individual automated DATs (Jaselskis and El-Misalami
2003).
24
Installation costs, lack of standardization, and relatively limited reading range are
considered as the main limitations of individual RFID use. Especially, in order to
overcome the limited reading range of current RFID tags, integration of RFID with other
location DATs has been proposed by many studies (Lee et al. 2007 and Chin et al.
2008).
The currently most used integration DAT is the RFID integrated with a GPS
system enabling it to acquire more accurate location data for material management.
Essentially, with the integration of RFID and GPS DAT in the material management
process, construction materials tagged with RFID tags can be automatically identified
and the exact location, even the distance from jobsite, can be simultaneously tracked
(Song et al. 2006). This ability presents the potential for effective material management,
and it can lead to productivity enhancement.
This integration of RFID with GPS also can be applied to the construction vehicle
tracking process in order to facilitate arranging for the arrival of materials just in time
and right quantity of materials to be delivered to construction jobsites (Lu et al. 2006).
Another prototype of RFID with GPS DAT application is the intelligent tower crane
operation framework as proposed by Han et al. (2004). Throughout their proposed
tower crane framework, accurate information about materials’ location is directly
transferred to the crane operator and workers on the job site, reducing idle time for
material delivery. The study identified that the tower crane operation equipped with
RFID and GPS increased construction productivity by 20%. (Han et al. 2004).
In addition to the integration of RFID with GPS, other automated DATs are
capable of integration with RFID systems and these provide more efficient data

25
collection process. For example, integrations of RFID with wireless DATs have the
potential to be implemented in various construction activities. The integration of DATs
based on the wireless internet environment enables construction manager to control
and monitor construction operation by real-time. A prototype for wireless automated
DATs’ integration is proposed by Lee et al. (2006), using RFID+USN (Ubiquitous
Sensor Network) technology. With this proposed framework, workers’ performance
data from construction site are easily collected by RFID+USN system, and construction
managers can identify workers’ location. More advanced integration of wireless
technology with RFID systems stimulate to development of real-time safety monitoring
system (Navon and Kolton 2007).
Another integration of RFID with other DAT may be the RFID+4D CAD model.
Since 4D CAD is providing a schedule managing function in addition to 3D CAD model,
the integration of RFID with 4D CAD is ideal for material management and schedule
control. Chin et al. (2008) developed the RFID+4D CAD integrated model for structural
steel work on high-rise buildings to identify productivity improvement. The developed
model was applied to an actual steel work job site to identify productivity improvement.
It was found that the RFID+4D CAD DATs offers more efficiency in process time in
structural steel work (Chin et al. 2008).
As reviewed above, the integration of RFID with other DATs provides more
efficiency for construction management, especially for material management, rather
than the use of individual RFID systems.

26
GPS (Global Positioning System)
GPS technology is regarded as one of the most popular DATs in the construction
industry. Automated GPS DAT is particularly useful for monitoring and controlling
earthmoving operations in road construction.
Navon and Shpatnitsky (2005) pointed out that manual data collection methods in
road construction involve lengthy and labor-intensive elements. They demonstrated
how automated GPS technology can improve monitoring and controlling data collection,
making timely and high data integration in road construction site. The project algorithm
model was developed to convert collected data to productivity, progress, and materials
consumption. They concluded that automated data collection systems with GPS
yielded more accurate outputs than manual system. Using a GPS system in road
construction increases production by 15-30%, increases profitability, dramatically
reduces staking costs, and improves quality control (Navon and Shpatnitsky 2005).
In addition to the use of GPS systems in road construction, they can be used in
geographical data collection systems. Lee and Han (2003) compared the performances
and productivities between traditional system and GPS employed geographical data
collecting system. A survey was conducted in this study, and they concluded that
significant productivity enhancements were detected through all site work activities
when a GPS system was used on the jobsite. Furthermore, the study indicated that the
site work equipments’ built-in GPS technology performed more accurately in cut and fill
operations, and data recording process was more efficient than traditional recording
systems (Lee and Han 2003).
The potential benefits of GPS DATs for material handling were described in a
study by Caldas et al. (2006). This study was focused on the pipe locating process in

27
an industrial construction project. In order to verify the feasibility of material data
acquisition, field trials were conducted. Caldas et al. (2006) concluded that the GPS
deployment in industrial projects significantly saved time on data collection, and caused
improvement of performance.
Typical GPS DAT consists of three subsystems, which are ground subsystems,
positioning subsystems, and onboard subsystems (Lee and Han 2003). Figure 2-3
shows a typical GPS DAT system. A ground subsystem, in general, provides geometric
data about the construction site with guidelines for construction equipment. Positioning
subsystems transfer the required position data to the system and an onboard
subsystem displays current position and required equipment functions.
Figure 2-4. GPS data acquiring techonology (DAT) system (Hass 2000)
In order to maximize the efficiency of GPS utilization in construction projects, the
adequate management of data collected by GPS is significant for successful
construction management. In general, automated DATs including GPS generate
enormous data volume (Seo et al. 2010). Therefore, data reduction processes for
manageable data volume are required to increase efficiency of data management.
28
Hildreth et al. (2005) proposed a procedure for data reduction to facilitate automated
data management. In order to improve the data management performance with data
reduction process, they conducted field test using GPS. The collected data were
analyzed with various statistical functions to identify critical data. Performing several
field tests with statistical analysis, the number of data records was reduced by more
than 95% (Hildreth et al. 2005).
The current GPS system, essentially, is ideal for positioning measurement.
However, the suitability of GPS system is limited to road construction or site survey.
Furthermore, the installation cost is relatively higher than other automated DATs’
installation cost. These drawbacks can be alleviated by the integrating GPS with other
DATs as previously described. Particularly, GPS systems are capable of being utilized
with RFID systems for application to material management process thus enhancing
accurate positioning measurement.
PDA (Personal Digital Assistant)
Since the mobile computing system was first introduced to public during the early
1990s, many efforts have been made to utilize PDA technologies for automated
construction data management processes. The main advantage of PDA DATs is that
the PDA enables construction workers to communicate each other. Also, the data
generated from the job site can be stored in a small size storage device, and then
transferred to the main office or to the supervisor without any documentation processes.
Due to the ease of data management with PDAs, PDA data recording systems are
rapidly being developed for the purpose of automated data management in the
construction industry.

29
Recently, the advent of high-speed wireless network systems has advanced the
development of PDA technology. In the wireless network environment, data collected
by PDA can be transferred to the main server in the office. Frequently, automatic
synchronizing software and web-integrated server system for PDA are used for
easiness of data transmittance (Kim et al. 2007). The process of data management by
PDA is illustrated in Figure 2-5.
Figure 2-5. Data processing by PDA in construction job site (Kim et al. 2007)
Although PDA systems have lots of benefits, there are several issues to be solved
for further PDA utilization in construction data management. Cox et al. (2002)
highlighted three problems related to usability and personal usage of PDA. One issue
to consider was the cost. The cost for purchase and maintenance of PDA for site
workers is not competitive in comparison with a manual system. Other problem of PDA
on construction sites is a shortage of workers with technical skill to operate the PDA.
The last issue to consider is that there are limited web based storage services to handle
the collected data (Cox et al. 2002). However, most of construction professionals
expect that these problems would be solved when PDA system is popularized in
construction industry. As a result, supplemental web monitoring services will be
developed to manage data generated from PDAs (Seo et al. 2010).

30
The PDA system also can be applied to labor management. Oh et al. (2004)
proposed the labor management system using PDA for estimating accurate labor costs.
They stressed that conventional workers’ record systems were not accurate and caused
overtime to be recorded. In order to improve labor management on the construction job
site, they utilized PDAs to track workers to investigate management performances.
With utilization of PDAs by workers, total labor costs were easily estimated, and each
worker’s time log was automatically stored to wireless accessible storage server
devices. Furthermore, the automated labor data collection system by PDA enabled
operators to manage the construction schedule (Oh et al. 2004).
USN (Ubiquitous Sensor Network) and Other DATs
With the recent rapid development and advancement of wireless technology,
advanced wireless techniques are being combined with RFID for effective construction
data management performance. As discussed previously, integrated RFID systems
with wireless technology have alleviated the limitation of individual RFID use. Since
USN is, recently, considered as one of the most advanced wireless techniques for
construction data management, the integration of RFID with USN is primary concerned
with increasing project data processing performance on large construction industry.
USN is defined as wireless data transmission technology using wireless data
communication systems with detecting sensors such as RFID (Lee et al. 2009). Zig-bee,
CDMA, Wi-Fi, and Bluetooth are considered as main USN techniques. Table 2-3
summarizes the characteristics of each USN technique.
Lee et al. (2009) noted that USN technology has the capability to apply to
automatic data management as a new intelligent system. For example, the

31
development of the integration of RFID+USN DAT is mainly focused on the capability of
automatic capturing and management of construction data without any input by humans.
Table 2-3. The characteristics of USN techniques
USN Technique Characteristic Advantages Disadvantages
Zig bee
- IEEE 802.15.4 standard - Combined with sensor - Ideal for large area sensor network
- Low cost - Low power operation - Easy to use
- Short range of data transmission - Sensitive to other signals
CDMA (Code Division Multiple Access)
- Enable to multiplex - Special coding scheme to each transmitter
- Accurate location measurement - Long range of data transmission - Error free recording
- High cost of implementation - Required for network infrastructure
Wi-Fi
- IEEE 802.11 standard - High speed internet network
- Wide range of wireless network - Stable network environment
- Not able to use during moving
Bluetooth
- Open wireless technology standard - 1:1 or 1:n data transmission
- Low cost
- Limited network extension - High power operation - Short range of data transmission
UWB (Ultra Wide Band)
- Wide range of frequency level - Low power operated
- High bandwidth communication - Accurate locating and tracking
- Short range of data transmission - Sensitive to other signals
An example of a new intelligent construction data management system using
RFID+USN was proposed by Cho et al. (2010). They pointed out that automatic

32
construction material locating measurement is significant in reducing waiting time for
material delivery in high rise building construction. The intelligent construction lift car
toolkit as shown in Figure 2-6 was implemented with USN technology. The gathered
information from RFID sensors also can be used for monitoring overall construction
status (Cho et al. 2010).
Figure 2-6. Illustration of the intelligent lift toolkit concept for elevator and intelligent lift (Adapted from Cho et al. 2010)
The RFID+USN DAT approach is most accepted in the material and labor
management area because it allows accurate location measurement on construction
sites. Recent advancements of USN technology have led to the use of the Real Time
Locating System (RTLS), which is an advancement of the data collecting system (Lee et
al. 2010). Through the deployment of RTLS on construction sites, operators are able to
collect accurate real-time construction data for material and safety management.
Both USN and RTLS technologies are required to adopt localization techniques in
order to identify objects within wireless networks. Figure 2-7 illustrates the concept of

33
the wireless localization technique. The main localization principles and advantages of
USN and RTLS are listed in Table 2-4.
Figure 2-7. The concept of wireless localization techniques for USN and RTLS
Among these principles, the Angle of Arrival (AOA) system is the most sensitive to
environmental conditions causing inaccurate data collection. The Received Signal
Strength Indication system (RSSI) frequently gathers erroneous data from sensors, so it
is not adequate for application to construction fields. The Time Difference of Arrival
(TODA) principle requires the time synchronizing process even though it offers accurate
data collection system. As compared with all these, the Time of Arrival (TOA) technique

34
provides the most precise data collection with a wide range of reading capabilities (Lee
et al. 2010).
Table 2-4. Main localization techniques for USN and RTLS
Localization Techniques
Process Advantage
AOA (Angle of Arrival)
The directional antennas arrays are used to measure the direction of the transmitted signal. The location of the RFID tag can be determined at the intersection of the two angled directional lines.
Location can be measured by only two readers
TOA (Time of Arrival)
The signal traveling time between a RFID tag and a specific reader is measured for calculating the distance. Once the transmission radii are measured, the location of the RFID tag can be determined using geometrical triangulation methods (intersection of three distance circles as shown in Figure 2-7b).
Most accurate positioning information can be measured
TDOA (Time Difference of Arrival)
Similar to TOA process. The time difference of arrival of the signal transmitted from readers is measured to determine the RFID tag location. (Figure 2-7c)
Fast time synchronization is available
RSSI (Received Signal Strength Indication)
The distance between a reader and a RFID tag can be estimated by calculating the attenuation of the emitted signal strength being received.
Possible for measuring 3D locating information with adequate software

35
Integration of DATs
As presented above, individual automated DATs such as RFID, GPS, and PDA
have their own limitations and disadvantages even though each DAT promotes
construction performance and data management. Furthermore, individual DATs are just
beneficial for a specific construction area. For example, RFID and PDA technologies
were mainly used in material tracking and labor management, respectively. In earth
work sites, the GPS system is dominant for construction data management (Giretti et al.
2009). For the purpose of overcoming these limitations to automated DATs’
independent use in certain areas, integrated DATs are crucial for effective construction
data management process.
Especially, the RFID system has the capability for combining with other DATs to
enhance construction data handling by automatic transmission (Choi 2004). For
instance, the representative RFID integration techniques are the RFID system
combined with GPS, PDA, 4D modeling, and USN. Other examples of DATs’
integration were proposed in the study by Omari and Moselhi (2009). They proposed
virtual DATs integration model is RFID combined with a 3D scanning system. This
integration of DAT is capable of capturing text and 3D graphical image data to report
construction progress.
Based on the literature reviews, this study has determined that the RFID
technologies and integration of RFID with other DATs are widely expected to improve
data management on construction projects. Moreover, it was also determined that
barcode systems are mostly replaced with the RFID technologies due to the
disadvantages of barcode systems. PDA technology is also widely applied to

36
construction jobsites to collect data. Another significant identification from the literature
review is that advanced sensor network data collecting systems, such as the RFID
system with USN or RTLS, have a great potential for advanced DATs’ development. In
closing, the approaches to new integration of DATs will lead future researches to
concentrate on the improvement of construction data management.
Overview of Bayesian Belief Networks
As reviewed above, several integrations of DATs are required to be developed and
to be accepted by the construction industry in order for effective construction data
management to be possible. One of the primary benefits of the integration of DATs is
that it has capability to overcome the limitation of independent or single DAT use on
construction site. For example, RFID system use enables automatic recording of
construction data, and it causes improvement in construction productivity and
reductions in labor cost and time. However, there is no valid procedure to transfer and
manage the data from an RFID system (Cho et al. 2010). In order to eliminate the
disadvantage of single RFID use, other DATs, such as GPS, PDA, USN and 4D CAD
are required to be integrated with the RFID system.
Although it is evident that integration of DATs improves construction productivity
and effective data management, some contractors have not deployed automated DATs
on their construction project because of the installation cost of DATs and uncertainties
about DATs’ performance (Seo et al. 2010).
The main purpose of this study is to quantify the potential benefits of the
integration of automated DATs, and to establish the development of methods for each
DAT’s evaluation. In this study, the Bayesian belief network, also referred to as

37
Bayesian network or belief network is employed to quantify the potential benefits of
automated DATs’ integration.
Characteristics of Bayesian Belief Networks
The Bayesian belief network (BBN) is a form of artificial intelligence that
incorporates uncertainty through probability theory and conditional dependence, and it
was first developed at Stanford University in the 1970s (McCabe et al. 1998). In other
words, a Bayesian belief network describes probabilistic relationships among a set of
variables by determining cause and effect relationship through graphical models (Luu et
al. 2009).
Since a Bayesian belief network constructs a cause and effect diagram, it is
considered as powerful tool for knowledge representation and reasoning under
uncertainty conditions (Cheng et al. 2002). The main advantages of Bayesian belief
network are summarized as follows;
Bayesian belief networks (BBNs) provide great flexibility in their capacity for accepting input and providing output.
BBNs have the ability to allow the value of a variable to be entered as a known input or to evaluate the likelihood of a variable as an output of the system
BBNs can readily calculate the probability of events before and after the introduction of evidence and update its diagnosis or prediction
Belief networks may be developed using expert opinion instead of requiring historical data
Belief networks also allows variables to be added or removed without significantly affecting the remainder of the network because modifications to the network may be isolated
Fundamentally, a Bayesian belief network consists of nodes, representing
variables of the domain, and arcs, which represent the relationships between the nodes

38
(McCabe et al. 1998). Figure 2-8 presents a simple belief network related to
construction activity. Child nodes are conditionally dependent upon their parent nodes.
Figure 2-8. A simple belief network of construction activity
BBNs are based on Bayes’ theorem, which follows from the basic conditional
probability relationship. Bayes’ rule can be simply expressed as follows;
AP
BPBAPABP
where P(A) is the probability of A, and P(A|B) is the probability of A given B has
occurred.
Specifically, a well designed BBN development requires following steps (Poole et
al. 1998):
Define the relevant variables.
Define the relationship between the variables.
Define the states of the variables. This step requires defining the detail level of the system.
Define the conditional probabilities of the relationships.
More specifically, BBN development consists of qualitative and quantitative parts
(van der Gagg 1996). The qualitative part of BBN, which is called structural learning, is

39
the graphical representation of independence (Lee et al. 2009). The main purpose of
this part is to identify significant causal factors applicable to the BBN analysis.
The quantitative part of the BBN, the so-called parameter learning, is the process
of finding dependence relations as joint conditional probability distributions among
variables using cause and effect relationships from the qualitative part to develop the
BBN model (Lee et al. 2009).
In the construction industry, the BBN can be a suitable methodology for project
risk management (Lee et al. 2009) and construction performance diagnostics (McCabe
et al. 1998).
Use of Bayesian Belief Networks in the Construction Industry
Due to the easiness of cause and effect calculation and identification in the BBN
model, BBNs can be used as a diagnostic tool in order to obtain the probabilities of
variable factors in construction performance.
McCabe et al. (1998) described the automated approach for the improvement of
construction operations integrating BBNs and computer simulation. The computer
simulation represents the construction operation whereas the BBNs provide expert
analysis of the performance of the operation (McCabe et al. 1998). Figure 2-9 shows
the prototype of the automated process. In this application, the BBN provided
diagnostic analysis of the simulated construction performance with the generation of
recommendations for remedial actions that can improve the performance.

40
Figure 2-9. Automated process for integration of BBNs and computer simulations (Adapted from McCabe et al. 1998)
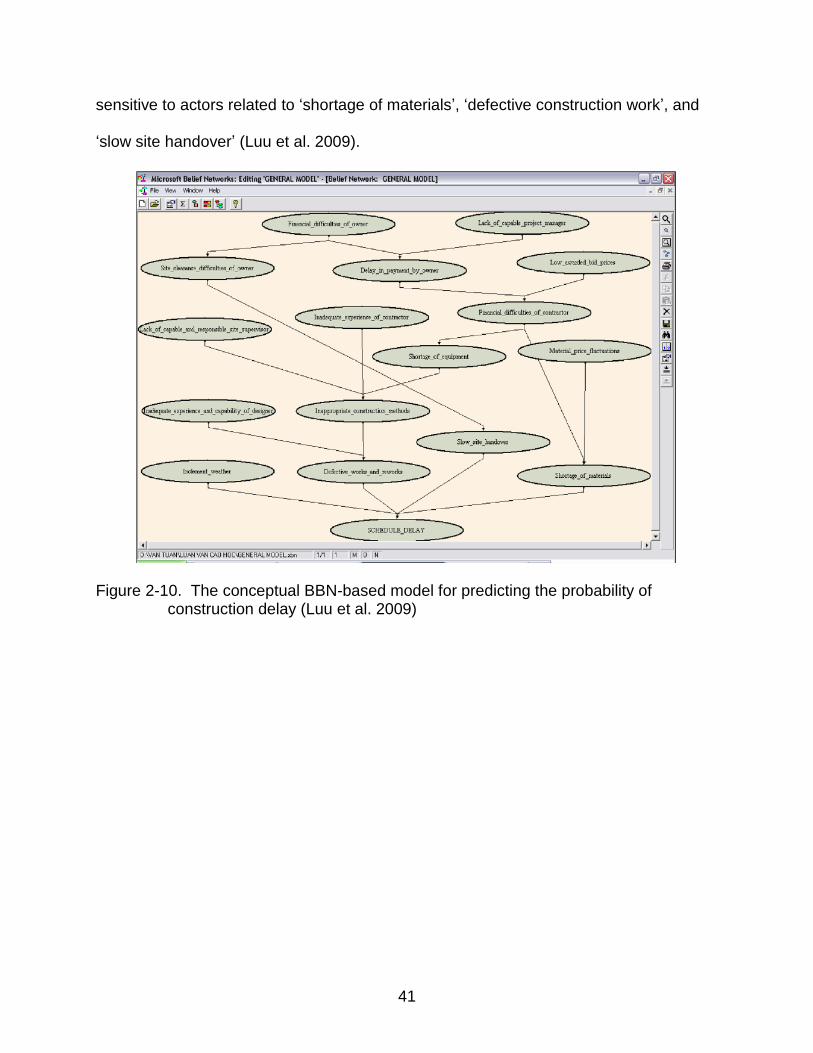
Luu et al. (2009) applied the BBNs to quantify the probability of construction
projects delays in Vietnam. In order to develop the BBNs, qualitative and quantitative
analysis were performed. For the requirement of qualitative analysis, factors were
identified through a survey questionnaire. For the quantitative part of the BBNs, the
cause and effect relationships among the factors were obtained through the use of
expert interviews (Luu et al. 2009). Then, they developed the BBN using the Microsoft
Belief Networks software, MSBNx (http://research.microsoft.com/en-
us/um/redmond/groups/adapt/msbnx/). The conceptual BBN model is shown in Figure
2-10. Through the BBN analysis, they concluded that construction delays are extremely
41
sensitive to actors related to ‘shortage of materials’, ‘defective construction work’, and
‘slow site handover’ (Luu et al. 2009).
Figure 2-10. The conceptual BBN-based model for predicting the probability of construction delay (Luu et al. 2009)

42
CHAPTER 3 METHODOLOGY
Overview
The main objective of this study is to look at current automated DATs development
and to quantify the potential benefits of the integration of automated DATs for effective
data management in the construction industry. In order to quantify the benefits of DATs,
Bayesian belief network analysis was used in this study. In order to identify the benefits
of DATs, the following steps were followed:
An evaluation of previous studies and literature reviews about automated DATs was conducted to collect information about the development history of DATs and to identify current trends of DATs use on construction projects.
The survey questionnaires were developed to obtain the data about current DAT uses and to identify the DAT use preferences in construction companies.
The dynamic survey form was created by Adobe LiveCycle Designer ES2 enabling web-based tracking with real time update, and the form was sent to upper level management personnel in each construction company
Construction companies in South Korea have a great tendency of using state-of-the art technologies’ on their construction projects (Seo et al. 2010). In order to obtain most current data about DATs, the respondents were randomly selected based on the list of 1000 Top Construction Companies of 2009 provided by the Construction Association of Korea.
The data collected from the survey were analyzed in detail.
In order to quantify the potential of automated DATs in the construction industry, the Bayesian belief network (BBN) model was developed using the data from the survey and literature reviews.
In the BBN model, changing the conditional probabilities of the negative factors was performed based on the survey results. This is also called reduction of negative factors.
Through the BBN model, the effects of the DATs’ integration with construction data management were evaluated by measuring the probability of the successful performance of a given task.

43
Identification of the Negative Factors Affecting Construction Data Management
In Chapter 2 of this study, published literatures were reviewed to identify negative
factors that affect construction data management practices. Of the observed risk
factors, the external factors which are not related to data management were not
considered for this study. Instead, the internal risk factors related to material, labor,
safe, schedule, and quality management were evaluated.
The survey was also conducted to identify the negative factors that prevent
effective data management in the current construction industry. Since the identified
factors from the survey would be used as variables in the BBN analysis and the
correlations of all factors are significant to develop the relationships of each variable in
the BBN model, each question of the survey was connected and correlated with other
questions which might be complicated and might cause respondents’ inconsistent
answers. Therefore, in order to obtain consistent and accurate survey results from the
respondents, an advanced survey method is required for the development of BBN
model.
Specifically, for obtaining accurate survey answers and for respondents’
convenience, a dynamic survey form was created using Adobe LiveCycle Designer
version of ES2.
With this dynamic survey form, respondents would be asked to answer to different
questions according to their previous choices. For example, the negative factors in
relation to construction data management were initially defined based on the literature
reviews and expert advice. The predefined negative factors were provided in Question
5 where the respondents were asked to choose all negative factors that affected their
construction performance and to rate the degree of the effects as either high effect,
44
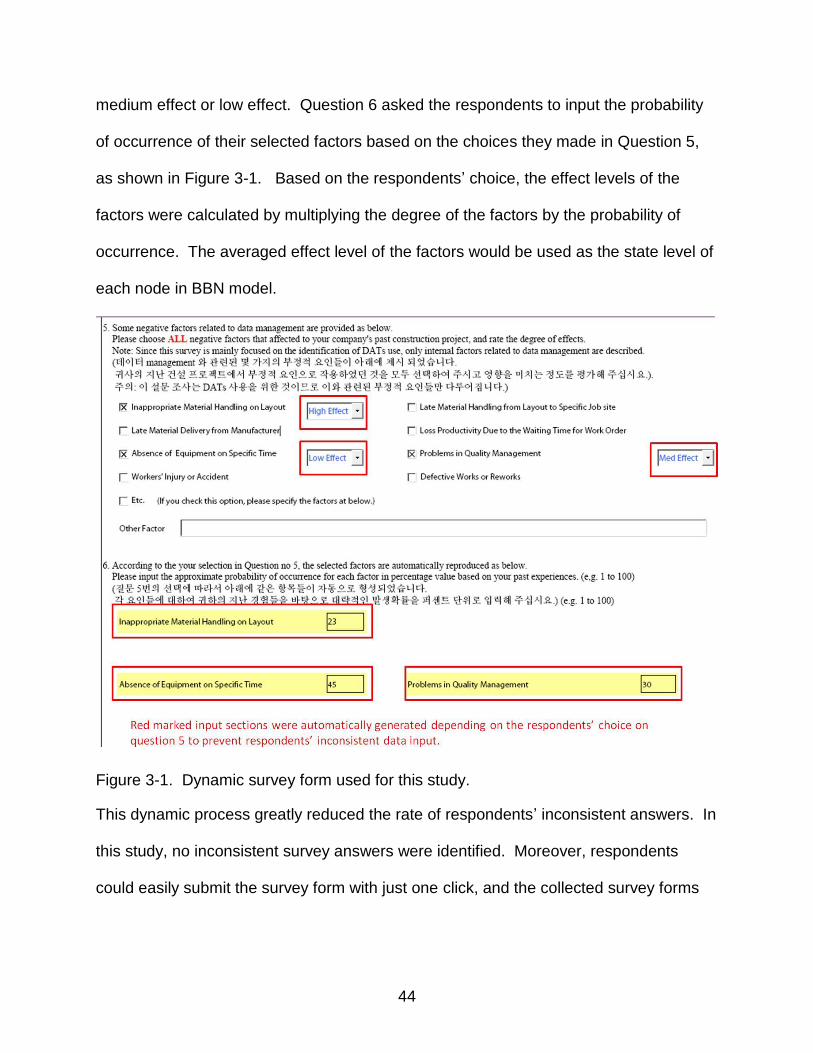
medium effect or low effect. Question 6 asked the respondents to input the probability
of occurrence of their selected factors based on the choices they made in Question 5,
as shown in Figure 3-1. Based on the respondents’ choice, the effect levels of the
factors were calculated by multiplying the degree of the factors by the probability of
occurrence. The averaged effect level of the factors would be used as the state level of
each node in BBN model.
Figure 3-1. Dynamic survey form used for this study.
This dynamic process greatly reduced the rate of respondents’ inconsistent answers. In
this study, no inconsistent survey answers were identified. Moreover, respondents
could easily submit the survey form with just one click, and the collected survey forms
45
were automatically stored and organized depending on distributor’s choice. The full
dynamic survey form is provided in Appendix A.
For this study, two hundred and twenty five respondents were randomly selected
from the list of the 1000 Top Construction Companies of 2009 provided by the
Construction Association of Korea. Seventy three responses were received,
representing a response rate of 32%.
Identification of the Current DATs Implemented in Construction Industry
In order to identify the current DATs implemented in construction companies,
published literature was reviewed according to the type of DATs and a survey was
conducted.
In the survey questionnaire, respondents were asked to answer whether DATs
were implemented on their projects or not. If respondents answered that they were
using DATs on their projects, the question asking the types of DATs that they
implemented would be automatically generated in the dynamic survey form. Similarly,
the question asking the reasons for their hesitation in DATs implementation would
appear if the respondents answered that DATs were not being used on their projects.
Determination of the Relationships between Negative Factors
As presented above, the relationships between factors are significant to develop
BBN model. Throughout the survey and literature reviews, the correlations of factors
were determined. The acquired relationships between factors would be represented as
arc in the BBN analysis model.
In the survey questionnaire, respondents were asked to rate the degree of
relationships between factors such as strong relationship, somewhat relationship, and

46
low relationship. According to the survey results, cause and effect relationships were
identified and ranked by averaged degree of relationships.
In this study, only the controllable internal factors which are related to the data
management were considered.
Development of BBN Model
Overview
Based on the results of survey and literature reviews, the Bayesian belief network
(BBN) was developed to quantify the potential benefits of integration of DATs in
construction industry. The qualitative and quantitative analysis phases are required to
develop a BBN model (Lee et al. 2009). The BBN development process for this study is
illustrated in Figure 3-2.
For the evaluation of the negative factors’ effects level, eight of predefined
negative factors based on literature reviews were provided to survey respondents.
Those are directly related to construction data management practices. The calculated
effect levels of factors were applied to the assigning the conditional probabilities to
factors.
The relationships of all factors were evaluated by survey results. All dataset for
identification of the relationships from survey were averaged and applied to a BBN
model to describe correlation of all factors.
Two BBNs models were constructed for large and small sized construction
companies to compare the integration of DATs effects. In this study, GeNIe Ver. 2.0
(http://genie.sis.pitt.edu/) was adopted for BBN analysis.

47
Figure 3-2. The development of a BBN model procedure for this study.
Evaluation of the Negative Factors
For the development of a BBNs model, the negative factors related to construction
data management were defined based on literature reviews. The predefined negative
factors are summarized in Table 3-1.

48
Table 3-1. List of predefined negative factors related to construction data management
Predefined Negative Factors Model Variables
Inappropriate material handling on layout F1
Late material handling from layout to specific job site F2
Late material delivery from manufacture F3
Loss productivity due to the waiting time for work order F4
Absence of equipments on specific time F5
Problems in quality management F6
Workers’ injury or accident F7
Defective works or reworks F8
These eight predefined negative factors were used as variables, referred to nodes,
for BBN model as shown in Figure 3-3. This procedure is known as qualitative analysis
for BBNs development.
Figure 3-3. The development of predefined negative factors that affect to construction performance in GeNIe Ver.2.0

49
Determination of the Relationships among the Factors
Determination of the relationships among the factors identified in the qualitative
analysis phase was performed through the survey. The determined relationships
represent the cause and effect of the factors.
In this study, two different relationships were determined based on the size of the
companies. The large size company is classified that the annual revenue for past year
was over $100 million. On the other hand, the company that the annual revenue was
below $100 million was classified as small company. Of the seventy three answered
respondents, twenty nine companies were classified as large size company, and forty
four responses were considered as small size company.
In addition, through the survey, respondents were asked to specify the
relationships among the eight factors with request for rating the degree of relationship.
In order to rank significant relationships among the factors, three degree of relationships
phase were provided to survey questionnaire. Each phase of degree was assigned with
constant number. That is ‘3 for strong relationship’, ‘2 for somewhat relationship’, and ‘1
for weak relationship’.
The survey answers were statistically analyzed to validate significant pairs of
factors by the size of company. Of the many possible pairs of factors, top of 15 pairs of
factors were determined to apply to BBN model.
Table 3-2 and Table 3-3 show the cause and effect relationships among the
factors in large size company and small size company, respectively. The model
variables encoding in Table 3-1 are used.

50
Table 3-2. Fifteen cause and effect relationships among the factors in large size company
Rank Relationships Mean Constant Value
1 F3 - F4 2.48
2 F2 - F3 2.21
3 F1 - F2 2.19
4 F2 - F4 2.05
5 F1 - F6 1.98
6 F4 - F7 1.98
7 F4 - F5 1.84
8 F2 - F6 1.51
9 F6 - F8 1.33
10 F4 - F8 1.18
11 F3 - F5 1.01
12 F5 - F6 0.99
13 F4 - F6 0.86
14 F1 - F8 0.85
15 F3 - F6 0.65
Table 3-3. Fifteen cause and effect relationships among the factors in small size company
Rank Relationships Mean Constant Value
1 F2 - F4 2.74
2 F3 - F4 2.36
3 F2 - F3 2.20
4 F6 - F8 2.14
5 F1 - F4 2.02
6 F5 - F8 1.87
7 F1 - F2 1.74
8 F2 - F6 1.59
9 F2 - F8 1.40
10 F1 - F5 1.19
11 F3 - F6 1.12
12 F3 - F8 1.00
13 F4 - F8 0.81
14 F7 - F8 0.62
15 F4 - F5 0.38

51
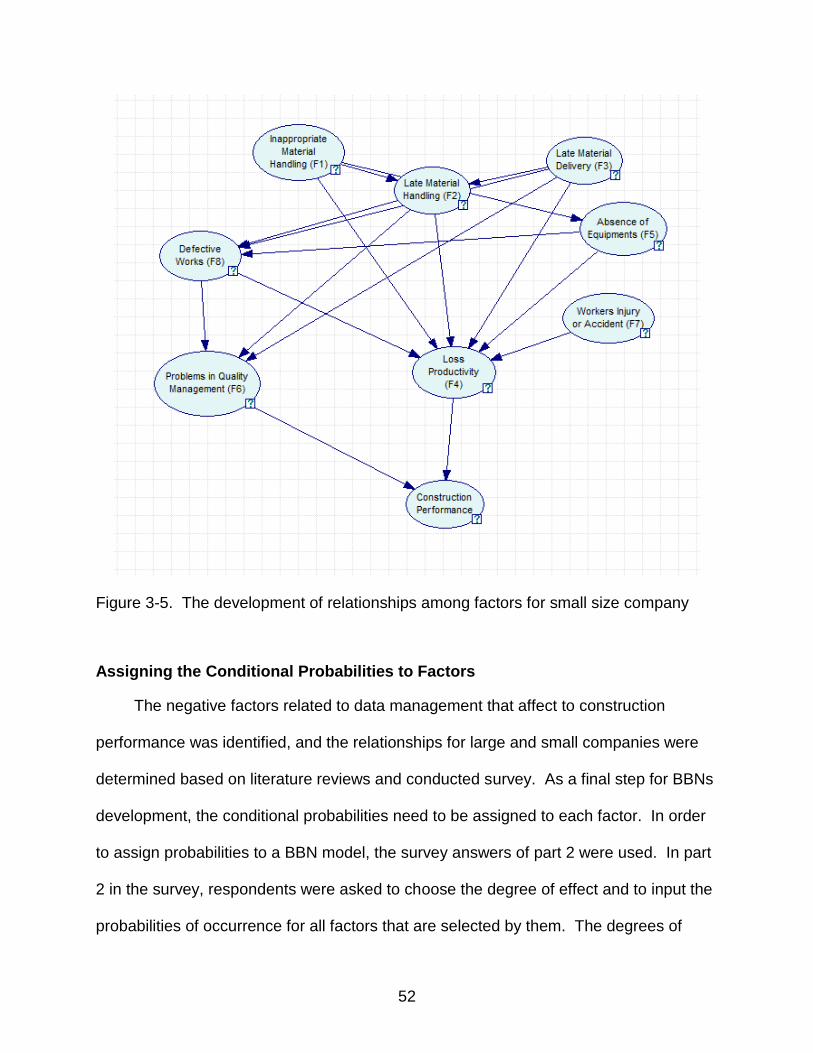
Based on the 15 determined cause and effect relationships among the factors, the
identified factors in Figure 3-3 was modified as shown Figure 3-4 and 3-5 for large and
small size company, respectively.
Two simple developed BBN models represent that construction performance is
mainly affected by the problems in quality management (F6) and loss productivity (F4).
In comparison with the relationships among the factors for large and small company, it
is found that the factor of problems in quality management (F6) in large company is
more affected by other factors than small company.
Figure 3-4. The development of relationships among factors for large size company
52
Figure 3-5. The development of relationships among factors for small size company
Assigning the Conditional Probabilities to Factors
The negative factors related to data management that affect to construction
performance was identified, and the relationships for large and small companies were
determined based on literature reviews and conducted survey. As a final step for BBNs
development, the conditional probabilities need to be assigned to each factor. In order
to assign probabilities to a BBN model, the survey answers of part 2 were used. In part
2 in the survey, respondents were asked to choose the degree of effect and to input the
probabilities of occurrence for all factors that are selected by them. The degrees of
53
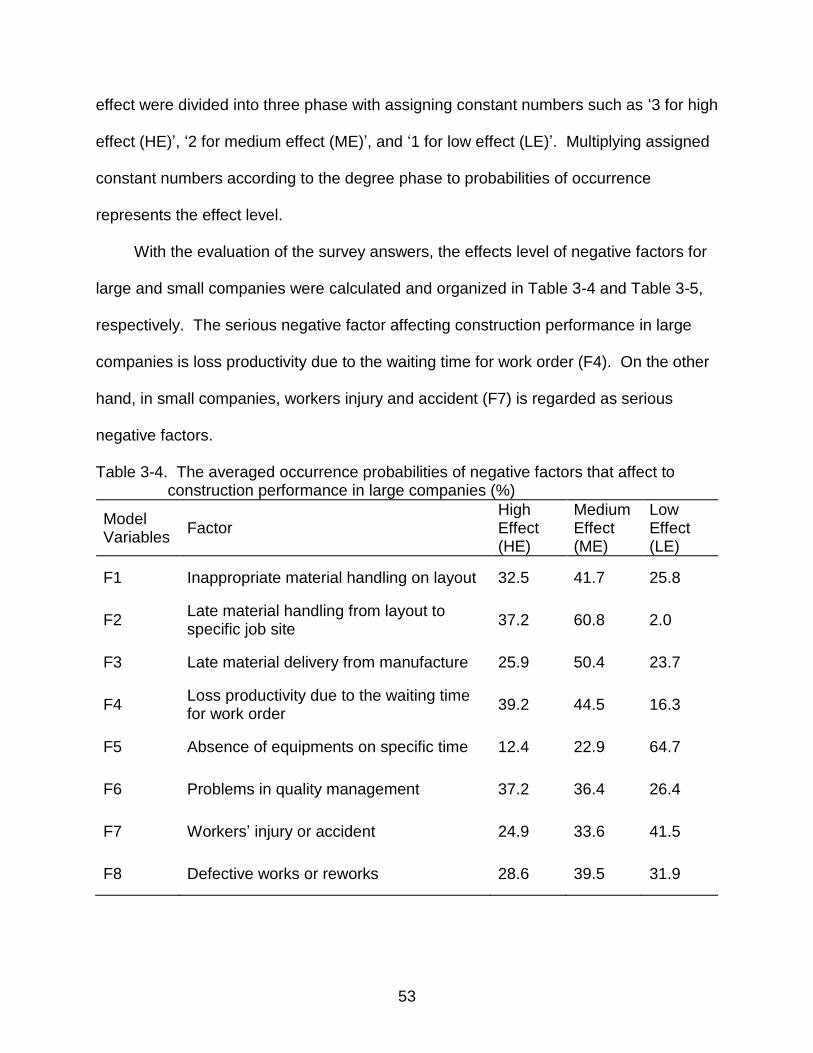
effect were divided into three phase with assigning constant numbers such as ‘3 for high
effect (HE)’, ‘2 for medium effect (ME)’, and ‘1 for low effect (LE)’. Multiplying assigned
constant numbers according to the degree phase to probabilities of occurrence
represents the effect level.
With the evaluation of the survey answers, the effects level of negative factors for
large and small companies were calculated and organized in Table 3-4 and Table 3-5,
respectively. The serious negative factor affecting construction performance in large
companies is loss productivity due to the waiting time for work order (F4). On the other
hand, in small companies, workers injury and accident (F7) is regarded as serious
negative factors.
Table 3-4. The averaged occurrence probabilities of negative factors that affect to construction performance in large companies (%)
Model Variables
Factor High Effect (HE)
Medium Effect (ME)
Low Effect (LE)
F1 Inappropriate material handling on layout 32.5 41.7 25.8
F2 Late material handling from layout to specific job site
37.2 60.8 2.0
F3 Late material delivery from manufacture 25.9 50.4 23.7
F4 Loss productivity due to the waiting time for work order
39.2 44.5 16.3
F5 Absence of equipments on specific time 12.4 22.9 64.7
F6 Problems in quality management 37.2 36.4 26.4
F7 Workers’ injury or accident 24.9 33.6 41.5
F8 Defective works or reworks 28.6 39.5 31.9

54
Table 3-5. The averaged occurrence probabilities of negative factors that affect to construction performance in small companies (%)
Model Variables
Factor High Effect (HE)
Medium Effect (ME)
Low Effect (LE)
F1 Inappropriate material handling on layout 29.9 52.6 17.5
F2 Late material handling from layout to specific job site
22.7 53.7 23.6
F3 Late material delivery from manufacture 32.1 49.2 18.7
F4 Loss productivity due to the waiting time for work order
19.5 62.7 17.8
F5 Absence of equipments on specific time 22.4 36.1 41.5
F6 Problems in quality management 22.4 57.6 20.0
F7 Workers’ injury or accident 33.9 39.2 26.9
F8 Defective works or reworks 29.5 41.4 29.1
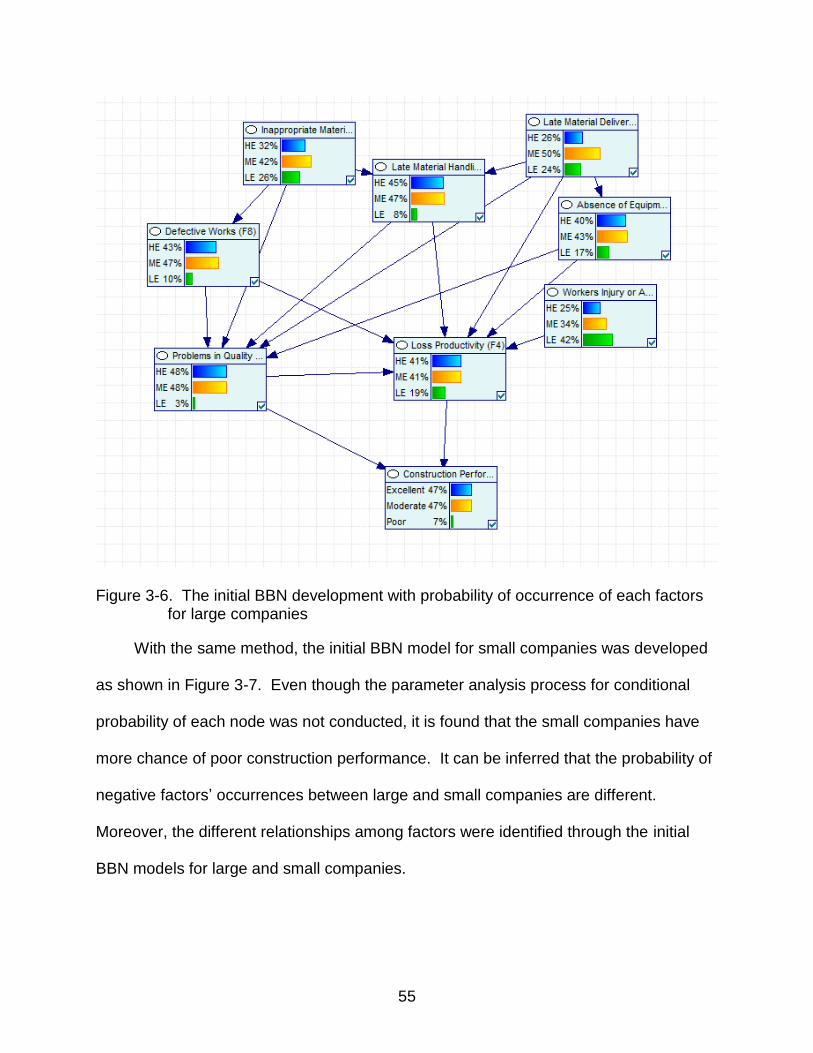
Figure 3-6 shows the initially developed BBN model which the factors’ probability
of occurrence for large companies (from Table 3-4) were applied to the model. In this
BBN model, the probability value of each node is different with the value from Table 3-4.
That is because the probability values in Table 3-4 are present the probability of each
factor that affects to construction performance. But during the development of BBN
model, each probability value from Table 3-4 was recalculated depending on the
relationships among the factors based on conditional probability. And, in the
construction performance nodes, each states was initially input by the probability of 33%
to easily track the probability changing after parameter learning process. Parameter
learning process in the GeNIe Ver.2.0 is used to calculate the conditional probability of
each factor nodes.
55
Figure 3-6. The initial BBN development with probability of occurrence of each factors for large companies
With the same method, the initial BBN model for small companies was developed
as shown in Figure 3-7. Even though the parameter analysis process for conditional
probability of each node was not conducted, it is found that the small companies have
more chance of poor construction performance. It can be inferred that the probability of
negative factors’ occurrences between large and small companies are different.
Moreover, the different relationships among factors were identified through the initial
BBN models for large and small companies.

56
Figure 3-7. The initial BBN development with probability of occurrence of each factors for small companies
Parameter Learning Process
In order to fully specify and represent the joint probability distribution in a BBN
model, parameter learning process is required. In the GeNIe Ver.2.0 application, the
parameter learning process function is included. Through this function, the conditional
probabilities of each node were automatically generated. Sometimes, parameter
learning process can be substituted by expert opinions (Luu et al. 2009).
57
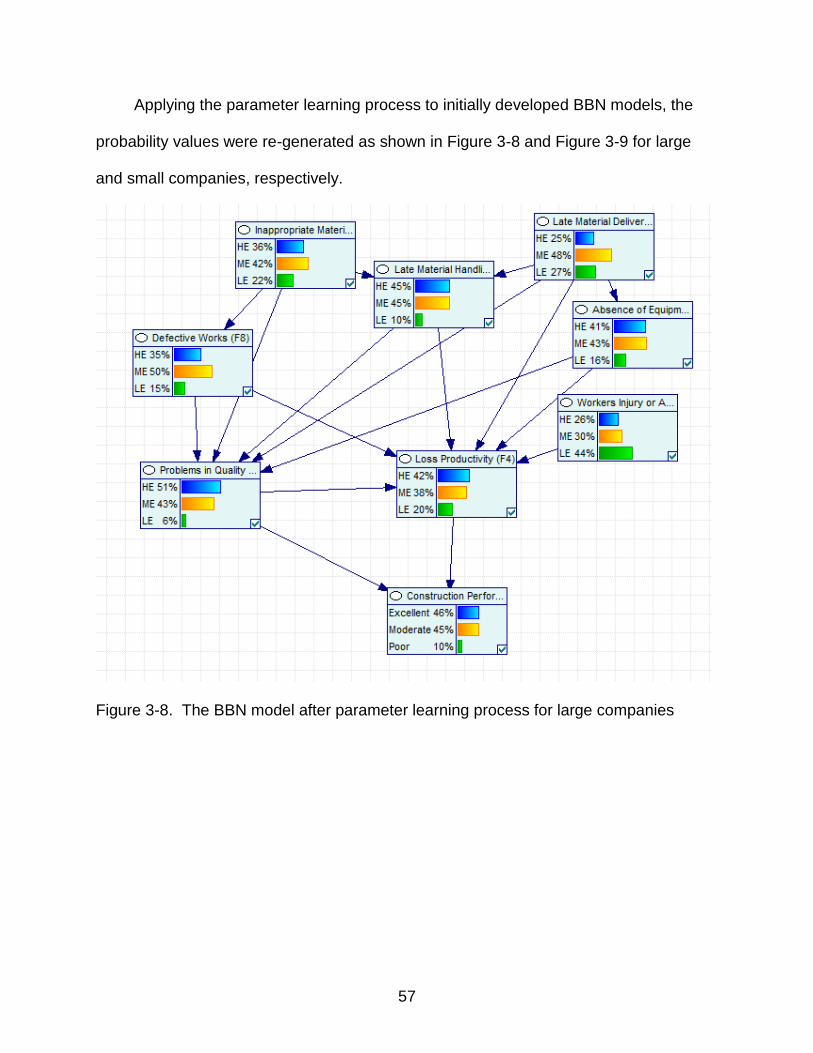
Applying the parameter learning process to initially developed BBN models, the
probability values were re-generated as shown in Figure 3-8 and Figure 3-9 for large
and small companies, respectively.
Figure 3-8. The BBN model after parameter learning process for large companies

58
Figure 3-9. The BBN model after parameter learning process for small companies

59
CHAPTER 4 RESULTS AND ANALYSIS
Overview
In this chapter, the evaluations of survey results are described, and the potential
benefits of DATs integration are quantified with estimation of the change of construction
performance occurrence probability according to the change of certain factors’
occurrence probability in previously developed BBN models for large and small sizes of
construction companies.
Evaluations of the Survey
The dynamic survey form was created for acquiring respondents’ consistent
answers. For this study, the developed dynamic survey forms were sent to two hundred
and twenty five respondents randomly selected from the lists of 1000 Top Construction
Company of 2009 provided by Construction Association of Korea. And seventy three
responses were received, representing a response rate of 32%.
Through the part 1 of survey questionnaire, the respondents working years, the
types of construction specialties of respondents were identified as shown in Figure 4-1
and Figure 4-2, respectively.
Furthermore, the responded companies were divided into large and small sized
companies based on the respondents’ annual revenue for past years. The large size
companies are classified that the companies’ annual revenue for past year were over
$100 million. And, the companies which the annual revenue is below than $100 million
were organized as small size companies in this study. Of the seventy three answered
respondents, twenty nine companies were classified as large size company, and forty
four responses were considered as small size company as shown Figure 4-3.

60
Figure 4-1. The distribution of respondents’ working years
Figure 4-2. The distribution of companies’ specialties
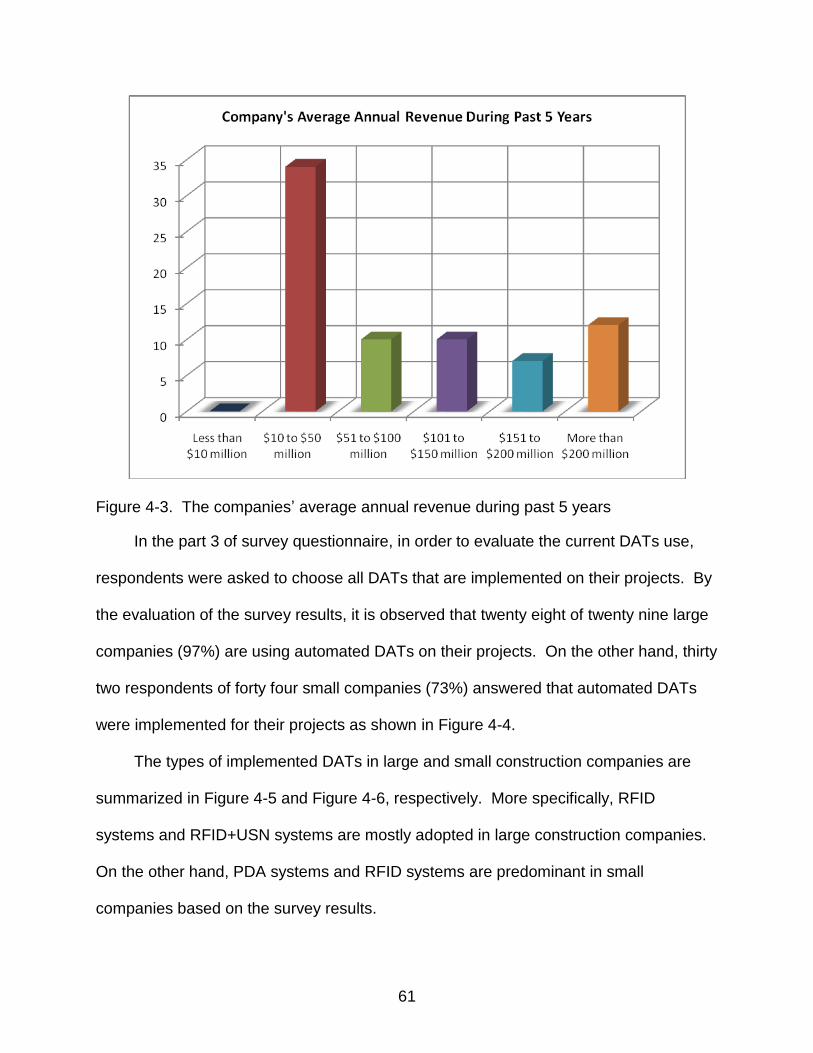
61
Figure 4-3. The companies’ average annual revenue during past 5 years
In the part 3 of survey questionnaire, in order to evaluate the current DATs use,
respondents were asked to choose all DATs that are implemented on their projects. By
the evaluation of the survey results, it is observed that twenty eight of twenty nine large
companies (97%) are using automated DATs on their projects. On the other hand, thirty
two respondents of forty four small companies (73%) answered that automated DATs
were implemented for their projects as shown in Figure 4-4.
The types of implemented DATs in large and small construction companies are
summarized in Figure 4-5 and Figure 4-6, respectively. More specifically, RFID
systems and RFID+USN systems are mostly adopted in large construction companies.
On the other hand, PDA systems and RFID systems are predominant in small
companies based on the survey results.

62
Figure 4-4. The implementaion of DATs on the respondents’ construction projects
Figure 4-5. The types of implementaed DATs in large construction companies

63
Figure 4-6. The types of implementaed DATs in small construction companies
In large and small construction companies, individual RFID systems are mostly
implemented for their projects. In the second place, RFID integrations with other DATs
and PDA systems are widely used in the projects. Based on these yielded results, the
fact that RFID system and integration of RFID with other DATs are popular in current
construction industry was validated.
Furthermore, the noticeable finding that PDA systems are widely accepted in large
and small construction companies was identified in this study. Especially, of thirteen
respondents who answered that any DATs are not used in the projects, nine
respondents (69%) answered that they are considering PDA integration system for their
projects, four respondents (31%) chose RFID integration systems for their projects.
With these evaluations, it can be inferred that the integration of PDA systems also have

64
a great potential to be developed in addition to the RFID integration systems. One of
the main reasons why PDA integration system is being considered to be implemented in
construction project is that widespread smart phone uses. Current smart phone
technologies are capable to replace the PDA functions. Moreover, the explosive
increasing smart phone uses may lead to reduce the equipment’s cost and it result in
the PDA DATs development in construction industry.
However, the remarkable difference of the types of DATs implementation between
large and small companies is observed through the evaluation of survey results. That is
the highly use rate of barcode system in small construction companies. Twenty two
(69%) of thirty two respondents in small companies answered that individual barcode
systems or integration barcode systems are still using on their projects, whereas three
(11%) of twenty eight respondents in large companies answered that barcode systems
are adopted on their projects.
Due to the high installation cost of RFID integration systems, the barcode systems
are still prevailed in small construction companies. In other words, barcode systems
may be more beneficial for some construction projects of small companies in terms of
the costs, rather than using RFID systems.
Re-Organization of Dataset for Bayesian Belief Network (BBN) Analysis
In order to identify and quantify the potential benefits of DATs integration in large
and small construction companies using BBN analysis, the dataset were re-organized
depending on the construction specialties in large and small companies. Specifically,
the companies, which are using only individual DATs on their projects, were selected for
quantifying the benefits of DATs integration. Of twenty eight respondents in large
companies, eleven answered that they are using individual DATs, whereas of thirty two

65
respondents in small companies, nineteen answered for individual DATs
implementation. The summarized re-organizations of results are described in Table 4-1.
Table 4-1. The summary of re-organizing dataset for BBN analysis
Size of companies
Specialties Implemented individual DATs
Number of respondents
Large companies
Resident building RFID system 5
Civil structure GPS system 3
Office building RFID system 3
Small companies
Office building RFID system 7
Resident building PDA system 6
Office building PDA system 4
Civil structure GPS system 2
With these re-organizing dataset, the averaged negative factors’ occurrence
probabilities were re-developed for BBN analysis. However, due to the insufficient data
answers caused by small numbers of respondents, certain negative factors’ occurrence
probabilities were not fully developed. As a result, total two (one for large companies
and one for small companies specialized in resident building) BBN models were
proposed in this study.
BBN Analysis for Large Companies Specialized in Resident Building
According to Table 4-1, five respondents indicated that individual RFID systems
are implemented on resident building projects in large companies. The averaged
negative factors’ occurrence probabilities for five respondents were identified as shown
in Table 4-2. In order to identify the differences of occurrence probabilities between five
respondents and all respondents in large companies, the estimated values of
probabilities from Table 3-4 were also shown in Table 4-2.
In the new developed negative factors’ occurrence probabilities for five
respondents, it was identified that F6 model variable, problems in quality management,

66
is mostly occurred in resident building project of large companies implemented
individual RFID system. On the other hand, all respondents in large companies
answered that F4 model variable, loss productivity due to the waiting time for work order,
is mostly occurred on their project.
Table 4-2. The averaged occurrence probabilities of negative factors in large companies specialized in resident building with individual RFID DATs (%)
Model Variables
Average of five respondents Average of all respondents in large companies (from Table 3-4)
High Effect (HE)
Medium Effect (ME)
Low Effect (LE)
High Effect (HE)
Medium Effect (ME)
Low Effect (LE)
F1 22.1 39.8 38.1 32.5 41.7 25.8
F2 26.4 62.6 11.0 37.2 60.8 2.0
F3 35.7 20.6 43.7 25.9 50.4 23.7
F4 38.2 41.5 20.3 39.2 44.5 16.3
F5 23.1 22.5 54.4 12.4 22.9 64.7
F6 49.2 31.9 18.9 37.2 36.4 26.4
F7 23.8 32.4 43.8 24.9 33.6 41.5
F8 30.7 38.1 31.2 28.6 39.5 31.9
These new developed factors’ probabilities were input to the previously developed
BBN model for large companies shown in Figure 3-6. After new data input procedure,
parameter learning process was conducted to develop conditional probabilities of all
factors for new BBN model.

67
New BBN model for large companies specialized in resident building with
implementation of individual RFID systems is developed as shown Figure 4-7.
Figure 4-7. The new developed BBN model for five respondents’ large companies specialized in resident building with individual RFID systems implementation
In order to quantify the potential benefits of DATs integration with new developed
model, two DATs integrations systems were suggested to this model based on the
literature reviews. According to the previous studies, this study assumes that the
RFID+4D CAD integration is ideal for quality management, and RFID+USN is beneficial
for reducing waiting time.
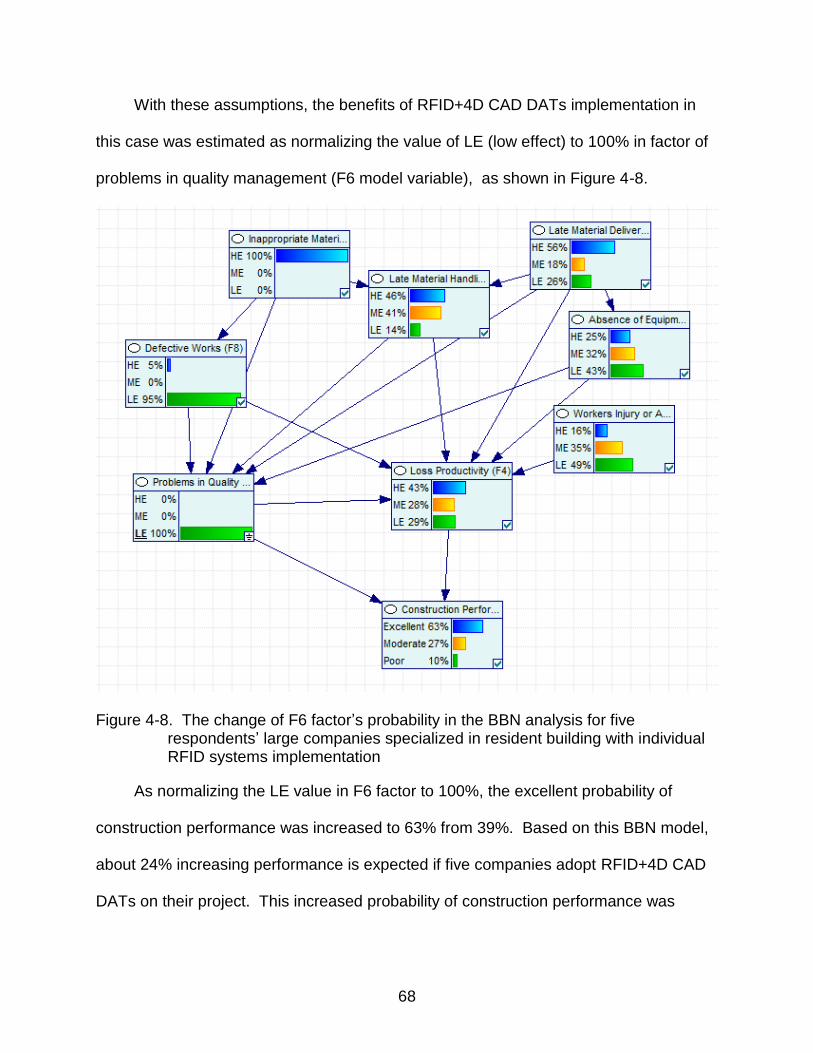
68
With these assumptions, the benefits of RFID+4D CAD DATs implementation in
this case was estimated as normalizing the value of LE (low effect) to 100% in factor of
problems in quality management (F6 model variable), as shown in Figure 4-8.
Figure 4-8. The change of F6 factor’s probability in the BBN analysis for five respondents’ large companies specialized in resident building with individual RFID systems implementation
As normalizing the LE value in F6 factor to 100%, the excellent probability of
construction performance was increased to 63% from 39%. Based on this BBN model,
about 24% increasing performance is expected if five companies adopt RFID+4D CAD
DATs on their project. This increased probability of construction performance was
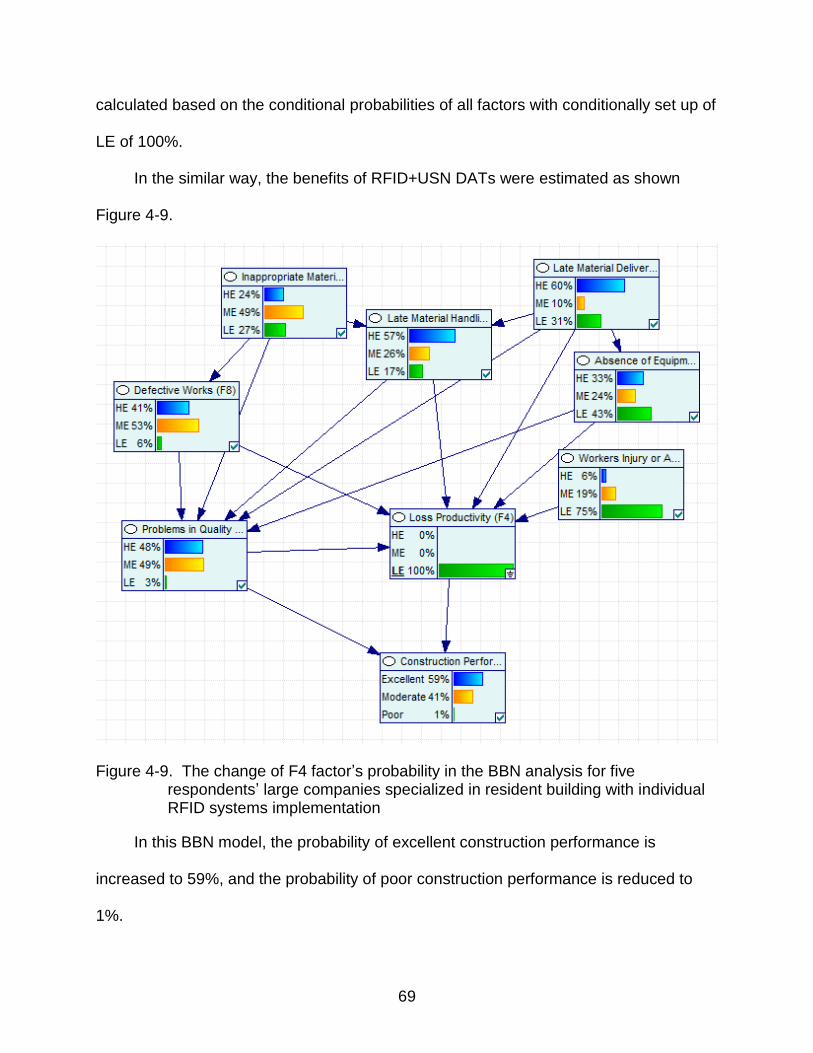
69
calculated based on the conditional probabilities of all factors with conditionally set up of
LE of 100%.
In the similar way, the benefits of RFID+USN DATs were estimated as shown
Figure 4-9.
Figure 4-9. The change of F4 factor’s probability in the BBN analysis for five respondents’ large companies specialized in resident building with individual RFID systems implementation
In this BBN model, the probability of excellent construction performance is
increased to 59%, and the probability of poor construction performance is reduced to
1%.

70
In comparison with the BBN model for implemented RFID+4D CAD system, the
probability of poor performance was dramatically reduced in this BBN model. Therefore,
it can be concluded that the minimizing the effect of F4 factor with RFID+USN
implementation will greatly reduce about 10% of poor construction performance in
residential building construction in large size companies.
BBN Analysis for Small Companies Specialized in Resident Building
According to Table 4-1, six respondents answered that individual PDA systems
are implemented on resident building projects in small companies. In the same way in
above, the averaged negative factors’ occurrence probabilities for six respondents were
identified as shown in Table 4-3.
Table 4-3. The averaged occurrence probabilities of negative factors in small companies specialized in resident building with individual PDA DATs (%)
Model Variables
Average of five respondents Average of all respondents in small companies (from Table 3-5)
High Effect (HE)
Medium Effect (ME)
Low Effect (LE)
High Effect (HE)
Medium Effect (ME)
Low Effect (LE)
F1 35.1 29.4 35.5 29.9 52.6 17.5
F2 27.6 31.5 40.9 22.7 53.7 23.6
F3 33.9 39.4 26.7 32.1 49.2 18.7
F4 15.2 51.0 33.8 19.5 62.7 17.8
F5 29.9 31.8 38.3 22.4 36.1 41.5
F6 10.3 21.4 68.3 22.4 57.6 20.0
F7 29.4 28.4 42.2 33.9 39.2 26.9
F8 18.6 34.7 46.7 29.5 41.4 29.1

71
In the new developed negative factors’ occurrence probabilities for six
respondents in small companies, it was identified that F1 model variable, inappropriate
material handling on layout, is mostly occurred in resident building project of large
companies implemented individual PDA system. Whereas, the occurrence probability
of F6 model variable, problems in quality management, was estimated at low level.
With these evaluations, it can be inferred that the PDA systems are beneficial for
quality management, especially for small companies.
With the same way on previous section, these new factors’ probabilities were
applied to the BBN model for small companies shown in Figure 3-7. After the process
of parameter learning, the conditional probabilities of all factors for new BBN model
were developed.
New BBN model for small companies specialized in resident building with
implementation of individual PDA systems is developed as shown Figure 4-10.
In order to quantify the potential benefits of DATs integration with new developed
BBN model for small companies implemented with individual PDA system, RFID+PDA
DATs integration was suggested to this model. Based on the literature reviews in the
chapter 2, this study assumes that the RFID+PDA integration is ideal for material and
labor management.
With the assumptions, the benefits of RFID+PDA DATs implementation in this
case was estimated as normalizing the value of LE (low effect) to 100% in the factor of
inappropriate material handling on layout (F1 model variable), and in the factor of late
material handling from layout to specific jot site (F2 model variable), as shown in Figure
4-11.

72
Figure 4-10. The new developed BBN model for six respondents’ small companies specialized in resident building with individual PDA systems implementation
As mentioned above, RFID+PDA integration system is also beneficial for the labor
management on construction sites. Recently, RFID+PDA systems are applied to the
workers’ safety management practices. Therefore, another assumption that is the
negative effect of workers’ injury or accident (F7 model variable) can be minimized with
the implementation of RFID+PDA integration is proposed for this study.
In addition to the normalizing of F1 and F2 factors at low effect level, the F7 factor
is also normalized at low effect level to identify the maximum potential benefits of
RFID+PDA integration in small companies. The result is shown in Figure 4-12.

73
Figure 4-11. The change of F1 and F2 factors’ probability in the BBN analysis for six respondents’ small companies specialized in resident building with individual PDA systems implementation
By adopting RFID+PDA integration in this BBN model for small companies, the
probability of excellent construction performance was increased to 47% from 41%.
Moreover, it was observed that the probability of poor performance was not relatively
improved.
However, after the normalizing F7 factors with RFID+PDA integration, the
probabilities were dramatically changed. First of all, the probability of excellent
performance was 5% more increased. And, the probability of poor performance of 2%
was estimated in the BBN model.

74
Figure 4-12. The change of F1, F2, and F7 factors’ probability in the BBN analysis for six respondents’ small companies specialized in resident building with individual PDA systems implementation

75
CHAPTER 5 CONCLUSIONS
The purpose of this study is to identify current automated data acquisition
techniques (DATs) and the integration of DATs for construction data management.
Furthermore, through Bayesian belief networks (BBNs) analysis, the potential benefits
of DATs integration are evaluated and quantified.
For these objectives of the study, previously published studies according to the
types of DATs were reviewed in detail. And, in order to identify current trends of DATs
implementation in construction industry, survey was conducted.
Based on the detailed literature reviews, this study finds that barcode, RFID, PDA,
and GPS systems were implemented in construction industry during past decades.
However, these individual DATs systems have own limitations and disadvantages to
improve construction data management practices. In order to overcome these
limitations and disadvantages of individual DATs, the integrations of DATs are widely
accepted in construction industry. Moreover, many studies indicated that the
integrations of DATs, especially integration RFID with other DATs, have capability to
enhance the data management.
Specifically, the numerous data generated from construction activities are valuable
resources to track and monitor construction performances. Also, adequate construction
data management is directly related to construction productivity, construction schedule,
and cost analysis. Although construction data management is significant for overall
construction activities, many construction companies still adopt individual DATs for their
projects due to the uncertainties and high installation costs of integration of DATs.

76
Under these conditions, this study attempted to quantify the potential benefits of
integration of DATs in real construction industry using BBNs analysis. BBN model is
supportive tool for decision making process with graphical outputs of cause and effects
among the factors.
In this study, one of the representative computer algorithm applications for BBN
analysis, GeNIe Ver. 2.0 was used for BBN analysis.
For the well development of BBN model, dynamic survey form, which is enabled
for respondents to input consistent answers in the suggested questions, was created.
Throughout the literature review, eight of the negative factors that affect construction
data management were predefined. The predefined negative factors were provided to
survey respondents to determine their occurrence probabilities on their past projects. In
the next step, respondents were asked to specify the relationships among the factors.
With the collected dataset, the frequency of the specified relationships of factors
was calculated. The top ranked fifteen relationships were selected to develop cause
and effects relationships for the BBN model.
Based on the determined relationships among the factors, two BBN models were
initially created for large and small construction companies. Specifically, the companies
that have more than $100 million of average annual revenue for the preceding 5 years
which were classified as large companies, and companies that have less than $100
million of average annual revenue, which were considered as small companies.
For the next step, the companies that had implemented individual DATs on their
project were identified depending on their size. A total of seven companies were
identified as the companies which are using individual DATs on their projects. Of the

77
seven companies, one large and one small company were selected to quantify the
potential benefits of the integration DATs through BBN analysis.
In the BBN analysis, the benefits of integration of DATs for construction data
management were estimated by calculating the probability of excellent construction
performance while changing the factors’ occurrence probabilities.
In the large companies for high rise residential building construction which are
implemented with individual RFID systems, two integrations of DATs such as RFID+4D
CAD and RFID+USN were applied to the BBN model to estimate the potential benefit of
integrated DATs for each. The results of the BBN analysis are shown in Figure 5-1.
With these results from the BBN model, it can be concluded that the integration of
DATs implementation in large companies for high rise building construction can improve
the construction data management resulting in a 20 - 24% increased construction
performance.
The BBN model was also used to quantify the benefits for small companies
constructing a high rise building with the implementation of an individual PDA system.
In this BBN model, RFID+PDA integration system was applied. Based on the results
shown in Figure 5-2 for the BBN analysis, it was determined that the implementation of
the RFID+PDA system in small companies improves material and labor data
management performance from 6-11%.

78
Figure 5-1. Different probabilities of construction performances depending on the
applied types of DATs in large companies specializing in hig hrise residential building construction
Figure 5-2. Different probabilities of construction performances depending on the
applied types of DATs in small companies specializing in high rise residential building construction

79
In comparison with the results from BBN analysis for large companies, the range
of performance improvement in small companies is relatively small. In other words, the
benefits of DATs integration for construction data management in large companies are
greater than in small companies. This finding is caused by the degree of relationships
among the factors. As construction projects become larger, the factors affecting
construction projects will become more complicated and will be impacted by many more
factors. Therefore, improvement of data management in the construction industry will
have a significant impact on construction project performances.
80
CHAPTER 6 DISCUSSIONS AND RECOMMENDATIONS
This study has presented a procedure to quantify the benefits of the integration of
DATs in the construction industry using Bayesian belief networks (BBNs) analysis. The
results of this study indicate that the integration of DATs on construction projects will
have the capability of improving construction performances. The approximate range of
probability for construction performance improvement was estimated to be 20 to 24%
for large companies and 6 to 11% for small companies. The results of this study are
similar to the findings from previous studies.
However, the procedure of this study has limitations. First, the quantified results in
this study were generated from BBN analysis based on the survey results. In other
words, the determined relationships among all factors were dependent on the
respondents’ view. Therefore, these values are not absolute values. Moreover, the
identified negative factors for this study were predefined based on previous studies.
Furthermore, the factors related to costs were not considered in this study.
Accordingly, future studies should be focused on the detailed evaluation of DATs
integration in actual construction practices with objective data collection. In addition,
other innovative procedures can be researched for identifying DATs effects on
construction practices.

81
APPENDIX A THE SAMPLE OF SURVEY FORM

82

83

84

85

86
LIST OF REFERENCES
Attoh-Okine, N. (2002). Probabilistic analysis of factors affecting highway construction
costs: a belief network approach. Canada Journal of Civil Engineering , 369-374.
Bernold, L. (1990). Testing barcode technology in construction environment. Journal of
Construction Engineering and Management , 643-655.
Caldas, C.H., Torrent, D.G., and Haas, C.T. (2006). Using global positioning system to
improve materials-locating processes on industrial projects. Journal of
Construction Engineering and Management , 741-749.
Chae, S. H., and Yoshida, T. (2010). Application of RFID technology to prevention of
collision accident with heavy equipment. Automation in Construction , 368-374.
Chen, Z., Li, H., and Wong, C.T.C. (2002). An application of bar-code system for
reducing construction wastes. Automation in Construction , 521-533.
Cheng, M.Y., and Chen, J.C. (2002). Integrating barcode and GIS for monitoring
construction progress. Automation in Construction , 23-33.
Chin, S.Y., Yoon, S.W., Choi, C.H., and Cho, C.Y. (2008). RFID+4D CAD for progress
management of structural steel works in high-rise buildings. Journal of
Computing in Civil Engineering , 74-89.
Cho, C.Y., Kwon, S.W., Shin, T.H., Chin, S.Y., and Kim, Y.S. (2010). A development of
next generation intelligent construction liftcar toolkit for vertical material
movement management. Automation in Construction, 14-27.
Cox, S., Perdomo, J., and Thabet, W. (2002). Construction field data inspection using
pocket PC technology. CIB w78 conference 2002 (pp. 1-8). International Council
for Research and Innovation in Building and Construction.
El-Omari, S., and Moselhi, O. (2009). Data acquisition from construction sites for
tracking purposes. Engineering, Construction and Architectural Management ,
490-503.
El-Omari, S., and Moselhi, O. (2009). Integrating Automated Data Acquisition
Technologies for Progress Reporting of construction projects. 26th International
Symposium on Automation and Robotics in Construction (ISARC 2009), (pp. 86-
94).
Ergen, E., Akinci, B., and Sacks, R. (2007). Tracking and locating components in a
precast storage yard utilizing radio frequency identification technology and GPS.
Automation in Construction , 354-367.

87
Giretti, A., Carbonari, A., Naticchia, B., and Grassi, M. (2009). Design and first
development of an automated real-time safety management system for
construction sites. Journal of Civil Engineering and Management , 325-336.
Goodrum, P.M., McLaren, M.A., and Durfee, A. (2006). The application of active radio
frequency identification technology for tool tracking on construction job sites.
Automation in Construction , 292-302.
Grau, D., Caldas, C.H., Haas, C.T., Goodrum, P.M., and Gong, J. (2009). Assessing the
impact of materials tracking technologies on construction craft productivity.
Automation in Construction , 903-911.
Han Y.W., Cho, H.H., Lee, Y.S., Kang, T.K., and Kim, J.S. (2004). A basic study on the
development of intelligent tower crane using IT. Korea Journal of Construction
Engineering and Management , 49-52.
Hildreth, J., Vorster, M., and Martinez, J. (2005). Reduction of Short-Interval GPS Data
for Construction operation analysis. Journal of Construction Engineering and
Management , 920-927.
Jang, M.S., Yoon, S.W., Chin, S.Y., and Kim, Y.S. (2004). Implementing radio
frequency identification in the curtainwall process management. Journal of the
Architectural Institute of Korea , 487-490.
Jang, W.S., and Skibniewski, M.J. (2008). A wireless network system for automated
tracking of construction materials on project sites. Journal of Civil Engineering
and Management , 11-19.
Jang, W.S., and Skibniewski, M.J. (2007). Wireless sensor technologies for automated
tracking and monitoring of construction materials utilizing ZigBee networks.
ASCE Construction Research Congress: The Global Construction Community.
Jaselskis, E.J., and El-Misalami, T. (2003). Implementing radio frequency identification
in the construction process. Journal of Construction Engineering and
Management , 680-688.
Kim, Y.S., Oh, S.W., Cho, Y.K., and Seo J.W. (2008). A PDA and wireless web-
integrated system for quality inspection and defect management of apartment
housing projects. Automation in Construction , 163-179.
Ko, C. (2010). RFID 3D location sensing algorithms. Automation in Construction , 588-
595.
88
Lee, E.C., Park, Y.T., and Jong, G.S. (2009). Large engineering project risk
management using a Bayesian belief network. Expert Systems with Applications ,
5880-5887.
Lee, J.H., Park, K.H., Yun, S.H., and Paek, J.H. (2006). A study on the reduction plan of
construction disaster using RFID/USN technology. Korea Journal of Construction
Engineering and Management , 605-608.
Lee, K.P., Lee, H.S., Park, M.S., Kim, H.S., and Baek Y.J. (2010). Development of
Real-Time Locating System for construction safety management . Korea Journal
of Construction Engineering and Management , 106-115.
Lee, N.S., Song, J.H., Yoon, S.W., Chin, S.Y., Kwon, S.W., and Kim, Y.S. (2006). An
application for tracking the location of material using RFID and wireless network
technology. Korea Journal of Construction Engineering and Management , 523-
528.
Lee, S.Y., and Han, S.W. (2003). Geospatial construction data collection using GPS.
KSCE Journal of Civil Engineering , 363-370.
Lee, W.J., Shin, T.H., Chin, S.Y., Yoon, J.S., Kwon, S.W., and Kim, Y.S. (2009). A
process reference model and information model development for RFID/USN
based construction supply chain management. Architectural Institute of Korea ,
147-158.
Lu, M., Chen, W., Shen, X., Lam, H.C., and Liu, J. (2007). Positioning and tracking
construction vehicles in highly dense urban areas and building construction sites.
Automation in Construction , 647-656.
Luu, V.T., Kim, S.Y., Tuan, N.V., and Ogunlana, S.O. (2009). Quantifying schedule risk
in construction projects using Bayesian belief networks. International Journal of
Project Management , 39-50.
McCabe, B. (1998). Belief networks in construction simulation. Proceedings of the 1998
Winter Simulation Conference, (pp. 1279-1286).
McCabe, B., AbouRizk, S.M., and Goebel, R. (1998). Belief networks for construction
performance diagnostics. Journal of Computing in Civil Engineering , 93-100.
McCullouch, B.G., and Lueprasert, K. (1994). 2D bar-code applications in construction.
Journal of Construction Engineering and Management , 739-752.
Moselhi, O., and Hassanein, A. (2003). Data acquisition and analysis for highway
construction using geographic information systems. Canada Journal of Civil
Engineering , 533-542.

89
Nasir, D., McCabe, B., and Hartono, L. (2003). Evaluating risk in construction–schedule
model (ERIC–S): Construction schedule risk model. Journal of Construction
Engineering and Management , 518-527.
Nasir, H., Haas, C.T., Young, D.A., Razavi, S.N., Caldas, C., and Goodrum, P. (2010).
An implementation model for automated construction materials tracking and
locating. Canada Journal of Civil Engineering , 588-599.
Navon, R. (2005). Automated project performance control of construction projects.
Automation in Construction , 467-476.
Navon, R. (2007). Research in automated measurement of project performance indicators. Automation in Construction , 176-188.
Navon, R., and Berkovich, O. (2006). An automated model for materials management
and control. Construction Management and Economics , 635-646.
Navon, R., and Kolton, O. (2007). Algorithms for automated monitoring and control of
fall hazards. Journal of Computing in Civil Engineering , 21-28.
Navon, R., and Shpantnitsky, Y. (2005). A model for automated monitoring of road
construction. Construction Management and Economics , 941-951.
Oh, S.W., Kim, Y.S., Lee, J.B., and Kim, H.S. (2004). Collection and utilization of the
construction labor information using PDA and Barcode. Korea Journal of
Construction Engineering and Management , 65-75.
Rebolj, D., Čuš Babič, N., and Podbreznik, P. (2008). Improving reliability of automated
construction activity tracking by using two independent on-site data collection
systems. Intelligent Computing in Engineering - ICE08, (pp. 479-486).
Seo. K.S., Park, J.S., and Jung, Y.S. (2010). Effective areas for DAT utilization in
construction projects. Korea Journal of Construction Engineering and
Management , 15-24.
Song, J.C., Haas, C.T., and Caldas, C.H. (2006). Tracking the location of materials on
construction job sites. Journal of Construction Engineering and Management ,
911-918.
Song, J.C., Hass, C.T., and Caldas, C.H. (2007). A proximity-based method for locating
RFID tagged objects. Advanced Engineering Informatics , 367-376.
Tserng, H.P., and Dzeng, R.J. (2005). Mobile construction supply chain management
using PDA and Bar codes. Computer-Aided Civil and Infrastructure Engineering ,
242-264.

90
Van Tol, A.A., and AbouRizk, S.M. (2006). Simulation modeling decision support
through belief networks. Simulation Modelling Practice and Theory , 614-640.
Wang, L. (2008). Enhancing construction quality inspection and management using
RFID technology. Automation in Construction , 467-479.

91
BIOGRAPHICAL SKETCH
Jintaek Ock was born in Seoul, Korea. He earned his B.E. degree in civil
engineering from Yonsei University in 2002. After graduation from university, he worked
in the environmental engineering field in the Seoul Metropolitan Government for 1 and
half year. In 2004, he started his graduate studies majoring in civil engineering at the
University of South Carolina, Columbia, and he earned master’s degree in 2007. During
his graduate studies he worked as research assistant for sustainable development
research.
In 2008, he was admitted to the M.E. Rinker, Sr. School of Building Construction of
the University of Florida, Gainesville, Florida. In May 2011, he will receive the M.S. in
Building Construction, and he will continue to pursue his Ph.D with specialization in
building construction at the University of Florida.