quantifying the value of hydropower in the electric grid · quantifying the value of hydropower in...
TRANSCRIPT

SANDIA REPORT SAND2011-1009 Unlimited Release Printed January 2011
Quantifying the Value of Hydropower in the Electric Grid:
Role of Hydropower in Existing Markets
Verne W. Loose Prepared by Sandia National Laboratories Albuquerque, New Mexico 87185 Sandia National Laboratories is a multi-program laboratory managed and operated by Sandia Corporation, a wholly owned subsidiary of Lockheed Martin Corporation, for the U.S. Department of Energy’s National Nuclear Security Administration under contract DE-AC04-94AL85000. Approved for public release; further dissemination unlimited.

i
Issued by Sandia National Laboratories, operated for the United States Department of Energy by Sandia Corporation. NOTICE: This report was prepared as an account of work sponsored by an agency of the United States Government. Neither the United States Government, nor any agency thereof, nor any of their employees, nor any of their contractors, subcontractors, or their employees, make any warranty, express or implied, or assume any legal liability or responsibility for the accuracy, completeness, or usefulness of any information, apparatus, product, or process disclosed, or represent that its use would not infringe privately owned rights. Reference herein to any specific commercial product, process, or service by trade name, trademark, manufacturer, or otherwise, does not necessarily constitute or imply its endorsement, recommendation, or favoring by the United States Government, any agency thereof, or any of their contractors or subcontractors. The views and opinions expressed herein do not necessarily state or reflect those of the United States Government, any agency thereof, or any of their contractors. Printed in the United States of America. This report has been reproduced directly from the best available copy. Available to DOE and DOE contractors from
U.S. Department of Energy Office of Scientific and Technical Information P.O. Box 62 Oak Ridge, TN 37831
Telephone: (865)576-8401 Facsimile: (865)576-5728 E-Mail: [email protected] Online ordering: http://www.osti.gov/bridge
Available to the public from
U.S. Department of Commerce National Technical Information Service 5285 Port Royal Rd Springfield, VA 22161
Telephone: (800)553-6847 Facsimile: (703)605-6900 E-Mail: [email protected] Online order: http://www.ntis.gov/help/ordermethods.asp?loc=7-4-0#online

ii
SAND2011-1009 Unlimited Release
Printed January 2011
Quantifying the Value of Hydropower in the Electric Grid:
Role of Hydropower in Existing Markets
Verne W. Loose
Sandia National Laboratories P.O. Box 5800
Albuquerque, NM 87185
Abstract
The electrical power industry is facing the prospect of integrating a significant addition of variable generation technologies in the next several decades, primarily from wind and solar facilities. Overall, transmission and generation reserve levels are decreasing and power system infrastructure in general is aging. To maintain grid reliability modernization and expansion of the power system as well as more optimized use of existing resources will be required. Conventional and pumped storage hydroelectric facilities can provide an increasingly significant contribution to power system reliability by providing energy, capacity and other ancillary services. However, the potential role of hydroelectric power will be affected by another transition that the industry currently experiences—the evolution and expansion of electricity markets. This evolution to market-based acquisition of generation resources and grid management is taking place in a heterogeneous manner. Some North American regions are moving toward full-featured markets while other regions operate without formal markets. Yet other U.S. regions are partially evolved. This report examines the current structure of electric industry acquisition of energy and ancillary services in different regions organized along different structures, reports on the current role of hydroelectric facilities in various regions, and attempts to identify features of market and scheduling areas that either promote or thwart the increased role that hydroelectric power can play in the future. This report is part of a larger effort led by the Electric Power Research Institute with purpose of examining the potential for hydroelectric facilities to play a greater role in balancing the grid in an era of greater penetration of variable renewable energy technologies. Other topics that will be addressed in this larger effort include industry case studies of specific conventional and hydro-electric facilities, systemic operating constraints on hydro-electric resources, and production cost simulations aimed at quantifying the increased role of hydro.

iii
ACKNOWLEDGMENTS The author is particularly indebted to Brendan Kirby for his meticulous reading of and comment on early drafts of this report. The document is immeasurably improved as a result of his care and attention. Abraham Ellis provided invaluable comments on organization and on technical aspects of the electric system about which the author had only limited understanding. Ben Karlson and Joe Williams also contributed valuable insights and comments on a recent draft.
DOE SPONSORS Jacques Beaudry-Losique Program Manager Wind and Water Power Program Michael Reed Chief Engineer Wind and Water Power Program Alejandro Moreno Technology Leader Wind and Water Power Program Hoytt Battey Market Acceleration Wind and Water Power Program Samantha Quinn Project Monitor Wind and Water Power Program Michael Hahn Project Officer Golden Field Office Tim Ramsey Project Engineer Golden Field Office Lindsay Buffum Project Engineer Navarro Justin Wild Procurement Asst Navarro
PROJECT MANAGER Electric Power Research Institute Thomas Key
STUDY TEAM Brendan Kirby Consultant Brendan Kirby
Cascade Consulting Partners Tom Guardino
Charlie Clark Group Charlie Clark
Electric Power Research Institute Daniel Brooks Alberto Del Rosso Karen Ryan Forsten Thomas Key Lindsey Rogers Aidan Tuohy
HDR-DTA Stephen Brown Ron Grady Rick Jones Rick Miller
Hydro Performance Processes Inc. Patrick March
LCG Consulting Pushkar Chhajed Rajat Deb Sidart Deb Lielong Hsue Srinivas Jampani
Oak Ridge National Laboratory Boualem Hadjerioua Brennan Smith Michael Starke
Sandia National Laboratories Abraham Ellis Benjamin Karlson Verne Loose Joseph Williams
iv
Table of Contents
1 The Evolving North American Electricity Industry Structure ........................................................1
1.1 Background ............................................................................................................................1
1.2 Configuration of the North American Transmission Grid .....................................................1
1.3 Three Business Models ..........................................................................................................3
1.3.1 ISO/RTO with Formal Markets .........................................................................................4 1.3.2 Pure Traditional Scheduling Area ......................................................................................5 1.3.3 Mixed Business Model among NERC Regional Entities ..................................................5
1.4 An Important Distinction Regarding Business Model Incentives .........................................5
1.5 NERC Electric Grid Reliability Standards ............................................................................6
1.6 Acquisition of Ancillary Services to Meet NERC Standards ................................................7
2 Grid Operations in Areas with Formal Markets ............................................................................10
2.1 Evolution of Ancillary Service Markets in North America .................................................10
2.2 Ancillary Services Market Design .......................................................................................11
2.2.1 Handling of Ancillary Services Products in Market Areas ..............................................12 3 Grid Operations in Regions Operated Without Formal Markets ..................................................17
3.1 Florida Reliability Coordinating Council ............................................................................17
3.2 The SERC Reliability Corporation ......................................................................................17
3.3 Ancillary Services Provision in Areas Lacking Formal Markets ........................................17
3.3.1 Regulation ........................................................................................................................18 3.3.2 Contingency Reserves ......................................................................................................18
4 Grid Operations in Regions with Hybrid Business Models ..........................................................19
4.1 WECC Organization ............................................................................................................19
4.2 Regional Reliability Centers ................................................................................................20
4.2.1 Role of Regional Reliability Centers ...............................................................................20 4.3 The CAISO within WECC ...................................................................................................21
4.4 Some of the “Seam” Issues ..................................................................................................21
4.4.1 Contingency Reserve Tracking ........................................................................................21 4.4.2 Energy Price Caps in CAISO and WECC .......................................................................21
4.5 Ancillary Services in WECC ...............................................................................................22
4.5.1 Regulation ........................................................................................................................22 4.5.2 Contingency Reserves ......................................................................................................22
4.6 Southwest Power Pool .........................................................................................................22
4.6.1 Regulation ........................................................................................................................22 4.6.2 Contingency Reserves ......................................................................................................23
5 Current Contributions of Hydro ....................................................................................................24
5.1 National Metrics Reflecting Use of Hydro Facilities ..........................................................24
5.2 Hydro Contributions to Generation by ISO/RTO ................................................................26
5.2.1 What is the Full Value Contribution of Hydro? ...............................................................29 5.3 Hydro Contributions to Ancillary Services..........................................................................29

v
5.4 Case Studies of Glen Canyon Dam ......................................................................................30
5.4.1 Bureau of Reclamation Study ..........................................................................................30 5.4.2 Argonne National Laboratory Study ................................................................................31 5.4.3 Financial Results of Simulations .....................................................................................32
5.5 Observations on the Studies .................................................................................................32
6 Increasing the Value Contribution of Hydro .................................................................................34
6.1 The Eastern Wind Integration and Transmission Study (EWITS) ......................................34
6.1.1 Key Study Findings..........................................................................................................35 6.1.2 Discussion of Study Results ............................................................................................36
6.2 Western Wind and Solar Integration Study .........................................................................36
6.2.1 Key Findings of the Study ...............................................................................................37 7 Summary and Concluding Observations .......................................................................................40
Figures
Figure 1-1: Interconnections of the North American Electricity Grid ...................................................2 Figure 1-2: Transmission System configuration in the Contiguous U.S. ..............................................2 Figure 1-3: NERC's Regional Entities and Balancing Area Authorities ...............................................3 Figure 1-4: Electric Industry Business Models in North America ........................................................4 Figure 1-5: Integration of Balancing Standards in Market and Non-Market Areas ..............................8 Figure 2-1: January 2006 Five-minute and Hourly Prices, CAISO .....................................................15 Figure 2-2: Daytime-Nighttime prices for Ancillary Services in Four ISOs .......................................16 Figure 3-1: Regional Reliability coordination Areas within WECC ...................................................20 Figure 5-1: California ISO Hydroelectric Megawatt Hours as a Percentage of Total Energy 2005-
2009 ..............................................................................................................................................26 Figure 5-2: ISO-NE Hydroelectric Energy Produced as a Percentage of Total Energy Produced,
2005-2009 .....................................................................................................................................27 Figure 5-3: Midwest ISO Hydroelectric Megawatts as a Percentage of Total Capacity 2005-2009 ...27 Figure 5-4: NYISO Hydroelectric Renewables Megawatt Hours as a Percentage of Total Energy
2005-2009 .....................................................................................................................................27 Figure 5-5: NYISO Non-Hydroelectric Renewable Megawatt Hours as a Percentage of Total
Energy 2005-2009 ........................................................................................................................28 Figure 5-6: PJM Hydroelectric Megawatt Hours as a Percentage of total Energy 2005-2009 ............28 Figure 5-7: SPP Hydroelectric Megawatt Hours as a Percentage of Total Energy 2005-2009 ...........28 Figure 6-1: EWITS Study Process .......................................................................................................35 Figure 6-2: System Cost by Scenario and Cost Component ................................................................36
Tables
Table 2-1: Summary Table of Market Areas and Their Features ........................................................14 Table 3-1: Conventional Hydro Capacity, Net Generation, and Capacity Factor by NERC Region ..25 Table 3-2: Nameplate Capacity of Pumped Storage Facilities by NERC Region ...............................25

vi
Abbreviations and Acronyms
$/MWh Price (or cost) per megawatt hour AC Alternating Current AESO Alberta Electric System Operator AGC Automatic Generator Control AS Ancillary Services BA Balancing Authority BES Bulk Electric System BPA Bonneville Power Administration CAISO California Independent System Operator DA Day-ahead DC Direct Current DCS Disturbance Control Standard DOE Department of Energy EIA Energy Information Administration ERCOT Electric Reliability Council of Texas ERO Electric Reliability Organization EWITS Eastern Wind Integration and Transmission Study FERC U.S. Federal Energy Regulatory Commissions FPC Federal Power Commission FRCC Florida Reliability Coordinating Council FRR Frequency Responsive Reserve FRS Frequency Response Standard IESO Independent Electricity System Operator (Ontario) IRC Instantaneous Reserve Checks ISN Interregional Security Network ISO Independent System Operator HVDC High Voltage Direct Current ISO-NE Independent System Operator - New England LADWP Los Angeles Department of Water and Power LLC Limited Liability Company LMP Locational Marginal Price L-T Long-term MAIN Mid-America Interconnected Network MISO Midwest Independent System Operator, Inc. MORC Minimum Operating Reliability Criteria MRO Midwest Reliability Organization MSSC Most Severe Single Contingency MW Megawatts (1,000,000 watts) NREL National Renewable Energy Laboratory NBSO New Brunswick System Operator NERC North American Electric Reliability Corporation NPCC Northeast Power Coordinating Council, Inc. NYISO New York Independent System Operator OR Operating Reserve QSE Qualified Supplier Entity RFC ReliabilityFirst Corporation RFP Request for Proposal

vii
RT Real time RTO Regional Transmission Organization RUC Residual Unit Commitment SCADA Supervisory Control and Data Acquisition SCUC Security constrained unit commitment SERC SERC Reliability Corporation SMUD Sacramento Municipal Utility District SP Spinning Reserve SPP Southwest Power Pool TMNSR Ten Minute Non Spinning Reserve TNM Texas Nodal Market TMOR Thirty Minute Operating Reserve USBR United States Bureau of Reclamation WAPA Western Area Power Administration WECC Western Electricity Coordinating Council

1
1 The Evolving North American Electricity Industry Structure
1.1 Background
U.S. Federal Energy Regulatory Commission (FERC) Orders 888 and 889—landmark orders promulgated in the mid-1990s–initiated the impetus to fundamental restructuring of the electrical power system. The basic thrust of these orders was to institute “open access” to the transmission grid and to generally introduce competition into the generation of electricity. The current mixed organizational status of the industry is a result of the variable response to these FERC orders by different regions of the country and their respective stakeholders; this partially evolved state denotes a dynamic transition to a future in which access to formal wholesale markets could expand across the United States. Generally, states in the Western and Southern U.S. regions have maintained their status as “rate of return” regulated utilities with an obligation to serve customers within a region, where the region is more-or-less coincident with state boundaries. In contrast to the supply side where markets are becoming more prevalent, the demand side of the industry remains one in which, for the most part, retail electricity prices are established administratively by Public Utility Commissions in each state.
1.2 Configuration of the North American Transmission Grid
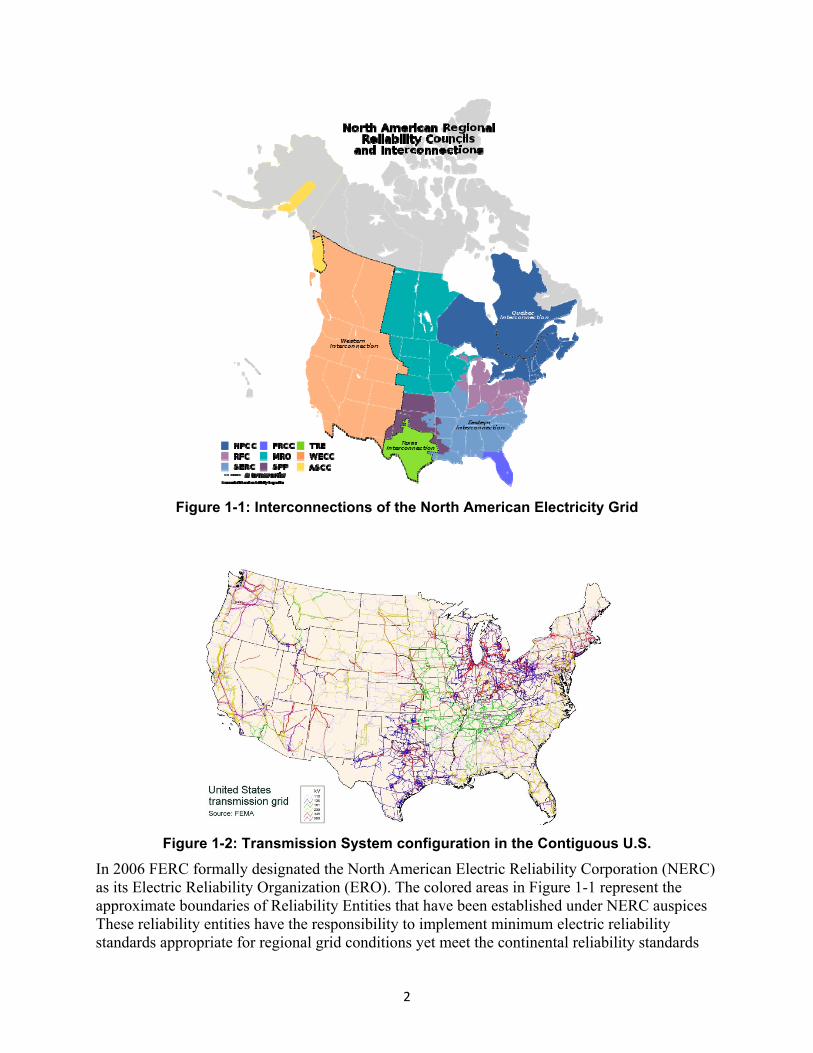
Figure 1-1 displays the four physical interconnections that comprise the North American electricity grid: the Western, Eastern, Quebec, and Texas Interconnections. The four interconnections are only weakly connected with each other through a handful of HVDC stations (Quebec is fairly strongly connected with the eastern interconnection through DC ties). Within each of these major blocks the electrical grid is more tightly interconnected but differences between each remain. For example, the transmission system in the west is relatively sparse and consists of long lines connecting major generation hubs to large population centers. The major transmission lines in the U.S. portion of the Western Interconnection are configured in a large “circular” network or “loop”, as shown in Figure 1-2. This allows a relative handful of phase shifting transformers to control flows on the loop. On the other hand, the transmission system in the Eastern Interconnection is much denser and is more web-like in structure with no single dominant continuous transmission path. The lack of transmission infrastructure along the sparsely populated seams of the Eastern and Western Interconnections is clearly noticeable in Figure 1-1. The configuration of the transmission system is a reflection of how the power system evolved over time and present demand density (population) and location of generation. For example, most of the western states are relatively sparsely populated and provide the generation capacity for the large demand sink on the west coast, mostly in California. Peak load in California in 2005 was about 37 percent of the total WECC peak load, and relies heavily on imports from the northwest and desert southwest regions. The transmission system is built to make these large transfers possible.
2
Figure 1-1: Interconnections of the North American Electricity Grid
Figure 1-2: Transmission System configuration in the Contiguous U.S.
In 2006 FERC formally designated the North American Electric Reliability Corporation (NERC) as its Electric Reliability Organization (ERO). The colored areas in Figure 1-1 represent the approximate boundaries of Reliability Entities that have been established under NERC auspices These reliability entities have the responsibility to implement minimum electric reliability standards appropriate for regional grid conditions yet meet the continental reliability standards

3
set by NERC1. The basic unit of operations in North America is the Balancing Area (BA) operated by a Balancing Area Authority (BAA). ISOs and RTOs are typically BAAs. BAs are responsible for supporting interconnection frequency under normal and contingency conditions, as well as managing power and energy interchange with other BAs. Figure 1-3 displays a map showing the structure of NERC’s Regional Entities and the numerous BAs within each. In recent years, there is a trend of consolidation of BAs in some regions of the Eastern Interconnection. Responsibility for generation reserves is often shared across several BAs through Reserve Sharing Groups. Finally, transmission planners and transmission operators, which include RTOs and ISOs, are responsible for planning and operating the transmission system to maintain the reliability of the grid by maintaining system voltage and flows within equipment limits, under normal and contingency conditions. Regional coordination among BA operators and transmission operators are coordinated by regional Reliability Coordinators.
Figure 1-3: NERC's Regional Entities and Balancing Area Authorities2
1.3 Three Business Models
The exchange of electricity products occurs through various market structures that overlay physical and operational organization of the grid discussed in the previous section. A map
1 “Reliability Standards for the Bulk Electric Systems of North America.” Available at: www.nerc.com. 2 This map is available at the NERC website: http://www.nerc.com/fileUploads/File/AboutNERC/maps/NERC_Regions_BA.jpg It was current as of August 1, 2007. There may have been changes, particularly in the Midwest ISO where 23 balancing authorities were replaced with one, the MISO. The SPP area will undergo a similar change in the near future as they consolidate their ISO/RTO.

4
delineating the areas of the North American Continent governed by formal markets for generation resource acquisition is shown in Figure 1-4 which also distinguishes areas wherein bilateral transactions approaches to generation resource acquisition govern. In this document, areas that operate under the bilateral transaction paradigm are referred to as Traditional Scheduling Areas. Generally, formal markets operate in conjunction with an Independent System Operator (ISO) or Regional Transmission Organization (RTO). The large white area in the southeastern United States contains the SERC and FRCC Regions which have no formal markets, ISOs, or RTOs. The Western Interconnection represents a mix of the two approaches since it contains two ISOs (the California ISO and the Alberta ISO) with formal markets, while the rest of the Western Interconnection functions under the bilateral transaction paradigm.
1.3.1 ISO/RTO with Formal Markets
The colored areas in Figure 1-4 represent the geographic coverage of independent system operators and regional transmission organizations. These entities manage grid operations within their territories and also operate markets through which energy, ancillary services, and capacity resources are procured.3 Seven ISOs operate at the present time in the U.S. (one of them extends operations into Canada) and three in Canada. Like all Transmission Service Providers, ISOs are required to file Open Access Transmission Tariffs (OATTs) with the Federal Energy Regulatory Commission (FERC). OATTs define and implement market definitions and operations and specify details of accounting and settlement procedures. Market participants within these areas must file substantial technical and financial paperwork with the ISO, have their generation assets tested and approved to meet the technical engineering standards required to implement NERC reliability standards, and demonstrate that they are financially sound. Individual generator owners operating in formal markets bid their services pursuant to a financial incentive as opposed to an obligation to serve load.
Figure 1-4: Electric Industry Business Models in North America4
3 The ISO-NE implemented a capacity market during 2010. The purpose of this market is to send longer term price signals to market participants to balance longer-term supply and demand to maintain system reliability. The ISO-NE market was an auction-style market in which both supply and demand resources bid to receive capacity payments. 4 Source: ISO/RTO Council. http://www.isorto.org/site/c.jhKQIZPBImE/b.2604471/k.B14E/Map.htm

5
1.3.2 Pure Traditional Scheduling Area
The SERC Reliability Corporation and the Florida Reliability Coordinating Council are both comprised of utilities that have more-or-less maintained the status they had before the recent decade of restructuring in the electricity sector. They are regulated by state public utility regulatory authorities as well as by FERC and have an obligation to serve the load within their defined territory. They schedule energy and power transactions, and coordinate operations as well as system expansion planning to maintain grid reliability following the same NERC criteria. Entities may engage in bi-lateral trades with other adjacent utilities in order to meet their obligations. No formal markets exist in these traditional scheduling areas.
1.3.3 Mixed Business Model among NERC Regional Entities
The mixed business model is characteristic of the WECC, MRO, NPCC, and RFC in that each of these NERC Regional Entities contains a combination of market and non-market areas within its boundaries. The WECC represents a mixed model due to the presence of formal markets under the California Independent System Operator (CAISO) and Alberta Electric System Operator (AESO) with the balance governed by a system very much like that in the southeast. The presence of formal markets in WECC, particularly the CAISO market, presents opportunities and obligations to generation asset owners whose assets exist outside of the CAISO borders. They are still used to meet load serving obligation within their Balancing Areas, but they now also can bid their assets into the California market.
As the competitive business model continues to expand into or influence non-market areas, change will continue to take place. This variety of physical, operational and market organization structures makes it difficult to generalize about the methods, procedures, and effects of hydro generation participation now and in the future. The same can be said for the integrating large amounts of variable generation capacity into the existing capacity mix. However, one ameliorating factor tending to simplify this otherwise complex situation is that fundamental economic behavior driven by cost minimization provides a common foundation that underlies the behavior of participants in both market and non-market segments of the industry.
1.4 An Important Distinction Regarding Business Model Incentives
In an environment where retail electricity prices are established through an administrative process and wholesale prices are not established through open markets, Balancing Authorities will make an effort to minimize electricity production cost (including generation under their direct control and transfers from other BAs) to serve the load at any given time. Accordingly, the entity will deploy that grouping of generation, transfers and required transmission resources that represents the minimum cost of meeting the load. In the electrical power industry this process is commonly referred to as “economic dispatch”. A “stack” of resources is created by calculating the cost per unit of output for various operating circumstances for each of the generating units on the system. This establishes a “merit order” based on cost per unit of output. Generating units are ranked from lowest to highest cost per unit output and are dispatched in successive order of higher cost per unit of output as load increases, and in reverse order for load decreases.
In contrast, an owner of generation assets in a market area where wholesale prices are transparently established (even if retail prices remain administratively determined) will compete to serve some portion of the load, generally over a wider geographic area, by bidding the services
6
of its generation assets into the market, according the best advantage of the facilities under its ownership. Such an entity does not have the obligation to serve the load, and may, indeed, withhold its generation assets from service if the entity perceives economic or financial gain from so doing (fixed costs exceed marginal prices). Such an entity can be portrayed as a profit maximizing entity. The element that brings these two different structures into alignment is that, mathematically, cost minimization (as in the case of the monopoly operator) is a necessary condition for profit maximization. The market business model is somewhat more flexible and permits new entrants and thereby stimulates competition.
Thus cost minimization can be achieved with both business models. Among the advantages of organized markets is the possibility that costs may be minimized over a larger service territory with a wider variety of technologies, and costs of generation possibly leading to a situation in which the overall cost of service in the market area is lower than it would be in a smaller territory. This discussion provides a significant insight into one of the important issues behind the current project. Namely, the value that a specific generator of a specific technology type provides to the grid is determined by the next best alternative generator in the merit order. Intrinsic features of the generator or the technology are expected to be expressed in the cost per unit of output or the owner’s bid for providing services from the generator.
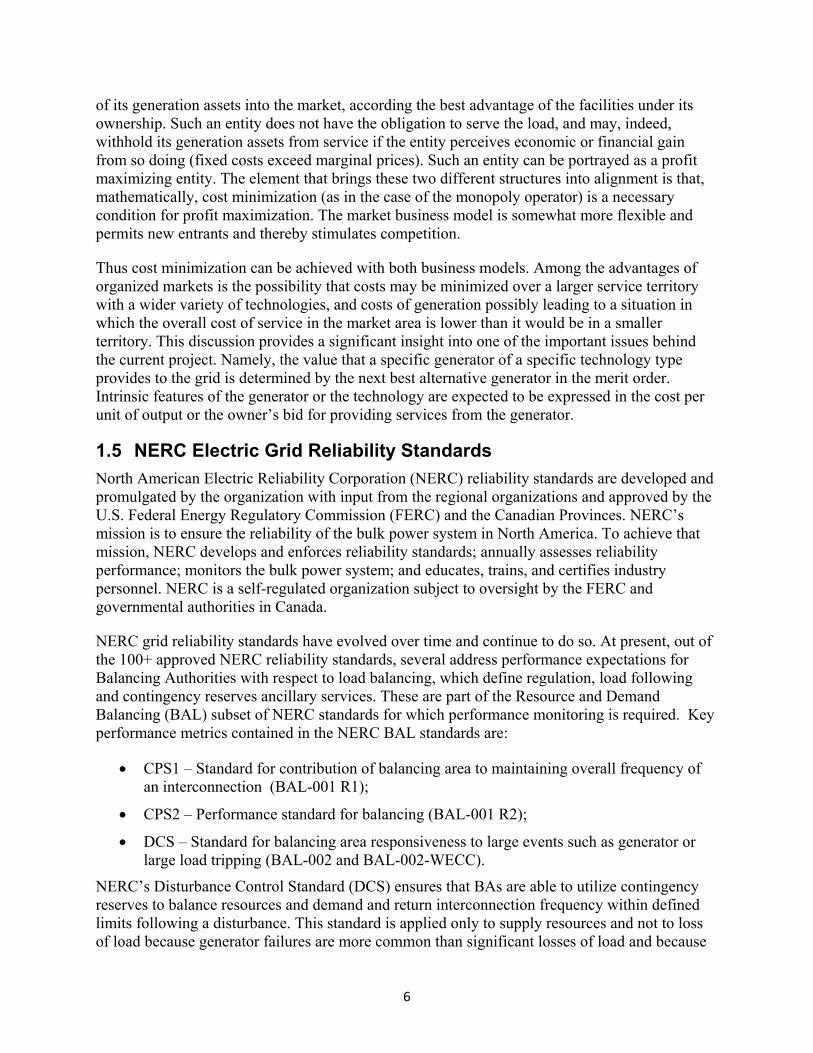
1.5 NERC Electric Grid Reliability Standards
North American Electric Reliability Corporation (NERC) reliability standards are developed and promulgated by the organization with input from the regional organizations and approved by the U.S. Federal Energy Regulatory Commission (FERC) and the Canadian Provinces. NERC’s mission is to ensure the reliability of the bulk power system in North America. To achieve that mission, NERC develops and enforces reliability standards; annually assesses reliability performance; monitors the bulk power system; and educates, trains, and certifies industry personnel. NERC is a self-regulated organization subject to oversight by the FERC and governmental authorities in Canada.
NERC grid reliability standards have evolved over time and continue to do so. At present, out of the 100+ approved NERC reliability standards, several address performance expectations for Balancing Authorities with respect to load balancing, which define regulation, load following and contingency reserves ancillary services. These are part of the Resource and Demand Balancing (BAL) subset of NERC standards for which performance monitoring is required. Key performance metrics contained in the NERC BAL standards are:
CPS1 – Standard for contribution of balancing area to maintaining overall frequency of an interconnection (BAL-001 R1);
CPS2 – Performance standard for balancing (BAL-001 R2);
DCS – Standard for balancing area responsiveness to large events such as generator or large load tripping (BAL-002 and BAL-002-WECC).
NERC’s Disturbance Control Standard (DCS) ensures that BAs are able to utilize contingency reserves to balance resources and demand and return interconnection frequency within defined limits following a disturbance. This standard is applied only to supply resources and not to loss of load because generator failures are more common than significant losses of load and because

7
contingency reserve activation isn’t normally necessary in loss of load situations. Control Performance Standard (CPS1) requires a minimum contribution of the BA to maintaining overall frequency of the interconnection. CPS2 is a balancing performance standard and requires Balancing Areas to have sufficient regulating reserves to meet the performance requirement. Both CPS1 and CPS2 are statistical metrics related to Area Control Error (ACE) and frequency.
At present, NERC is considering a change to these standards with a new set of BAL standards (BAL-007 through Bal-011) covering the following aspects:
Balance of Resources and Demand;
Frequency and Area Control Error;
Actions to Return Frequency to within Frequency Trigger Limits;
Frequency Bias Settings, and
Frequency Limits.
These new proposed standards are a major change from the existing CPS and DCS performance metrics that exist today. Of note, a new Balancing Authority ACE limit (BAAL) standard would replace CPS2 and would require entities to maintain interconnection scheduled interchange within a certain tolerance that changes as a function of frequency. The basic idea is that, as frequency deviates from the schedule (normally 60 Hz) ACE deviations in the counter-productive direction would be more restrictive. The proposed new BAL standards are designed to prevent unwarranted load shedding and to prevent frequency-related cascading collapse of the interconnected grid. While NERC is conducting BAAL field trials in the Eastern and Western Interconnections, the new standards have not been formally adopted.
Frequency response is not a standalone product in any of the ISOs in the U. S., but it is a system reliability requirement enforced through NERC. Frequency response is a function of system inertia and fast response of loads and generators. NERC defines frequency response5 as an automatic and sustained change in the power consumption or output of a device that occurs within 5-30 seconds of and is in a direction to oppose a change in the Interconnection frequency. All large generators have speed governors that provide the automated response to frequency changes. Frequency response performance is considered a key indicator of the general resilience of an interconnected system to generation loss events. Similarly, there are standards that address voltage regulation and black-start capability, which are considered ancillary services. Standards for voltage control and black start capability are not discussed in this report.
1.6 Acquisition of Ancillary Services to Meet NERC Standards
Ancillary services are services provided by generators, control equipment and system operators to support the delivery of power and energy across the grid. Ultimately, these services are required to ensure that reliability and service quality comply with performance metrics established by NERC and other reliability organizations. For example, a portion of the NERC reliability standards references performance metrics for regulation and contingency response.
5 Frequency response or primary frequency control is the term used by Balancing Areas. The physics and engineering of the interconnected grid provide three sources of frequency response: i. inertia of rotating synchronous equipment (with some from induction motors); ii. autonomous governor response or the equivalent from invertors; and iii., AGC response.

8
Other standards define performance requirements for voltage and reactive power (var) control. These metrics provide the foundation for definitions of ancillary service products.
Balancing Authorities maneuver the output of generation resources under their control and acquire grid support services as needed so that the supply and demand for electricity is balanced; NERC performance standards must be met no matter how the particular BA is structured. Each BA has rules for acquiring grid support resources that reflect the particular organizational structure in that area. Market settlement time determines how often a Balancing Area can re-optimize the output of generating resources under their control. Bi-lateral contracts are the mechanism through which a majority of electricity flows, even in the restructured electricity markets. A great deal of effort goes into attempting to determine the current and future relationship between the supply of, and demand for, electric energy. The more closely these two independent factors can be balanced in the smallest increment of time, the less need there is for ancillary services.
The Schematic in Figure 1-5 indicates how the NERC reliability requirements integrate within the operation of an interconnected system, and are procured as ancillary services in market and non-market areas.
End User
Loads
Regulation Forecast
VAR Requirements
Contingency Reserves
And/or Generators
& DR
Balancing Area
Forecast
Errors
AS Supplier
Deviations
For Market Areas
Markets for Regulation and
Contingency Reserves – Bids
and Actual
For Non‐market Areas
Unit Commitments and
Economic Dispatch from BAA
and/or Bi‐lateral Agreements
NERC Reliability
Performance
Standards
CPS1
CPS2
DCS
WECC Voltage Stability
Efficiency of Markets
Minimization of non‐
market system costs
Change in
system
reliability
and AS
cost
Figure 1-5: Integration of Balancing Standards in Market and Non-Market Areas6
The process starts with the preparation of an ancillary services forecast of system requirements such as regulation, contingency reserves, voltage/var capability, etc., based on the system needs and the particular market product defined for each Balancing Area. In market areas, generators use that forecast to develop their bids and present them in the ancillary services markets. In non-
6 This figure has been re-drawn and adapted from a figure appearing in “Functional/Design Specification and Data Requirements.” Consortium for Electric Reliability Technology Solutions (CERTS). Reliability Adequacy Tool for Ancillary Services, Version 0.91, April 2000.
9
market areas, operating entities take ancillary services needs into account to make unit commitment decisions. Any errors in the forecast or operational discrepancies between actual quantity delivered and bid quantity promised could impact market efficiencies, cost of energy, and compliance with NERC’s system performance standards.
Design of ancillary services products was established by FERC as a few groupings that have key elements in common; regional variation in design nevertheless persists due to regional considerations. Three functional categories of ancillary services (AS) can be identified—regulation (up and down), reserve products (spinning, non-spinning, replacement), and others (black start, voltage support).
Regulation – Regulation is generation capacity capable of maneuvering up and/or down within a short time frame (seconds to minutes) to ensure that Area Control Error (ACE) complies with NERC CPS2. ACE is caused by continuous fluctuations of and generation (renewables, but also conventional), which flow on tie lines to deviate from scheduled levels. Regulation is deployed through Automatic Generation Control (AGC).
Reserve Products – Reserve products are generation capacity (and sometimes load) set aside to deal with loss of generation or transmission contingencies. Requirements for short-term (spinning or fast-starting) and noon-spinning reserves are established system-wide, and are carried by individual BAs or reserve-sharing groups. The requirements are based on compliance with NERC’s CPS1 and DCS reliability standards.
Voltage Control and Black Start Capability – Voltage control is a service needed to maintain voltages within equipment tolerances during normal as well as contingency conditions. Voltage control support is provided by generators, but also by static var devices (SVC, capacitors, and reactors) and other voltage regulators. Black-start capability is the ability of a generator to energize the grid starting from a black-out state, to initiate the sequential recovery of service. Black-start capable plants are fitted with small diesel generators to energize plant auxiliary equipment (feed-water and fuel pumps, controls, etc) without relying on the grid.
These products generally constitute less than 2% of the equivalent energy cost of an MWh of load served.7 Despite their relatively small value, AS are necessary to deliver the overall quality and consistency of service electric customers in the United States enjoy.
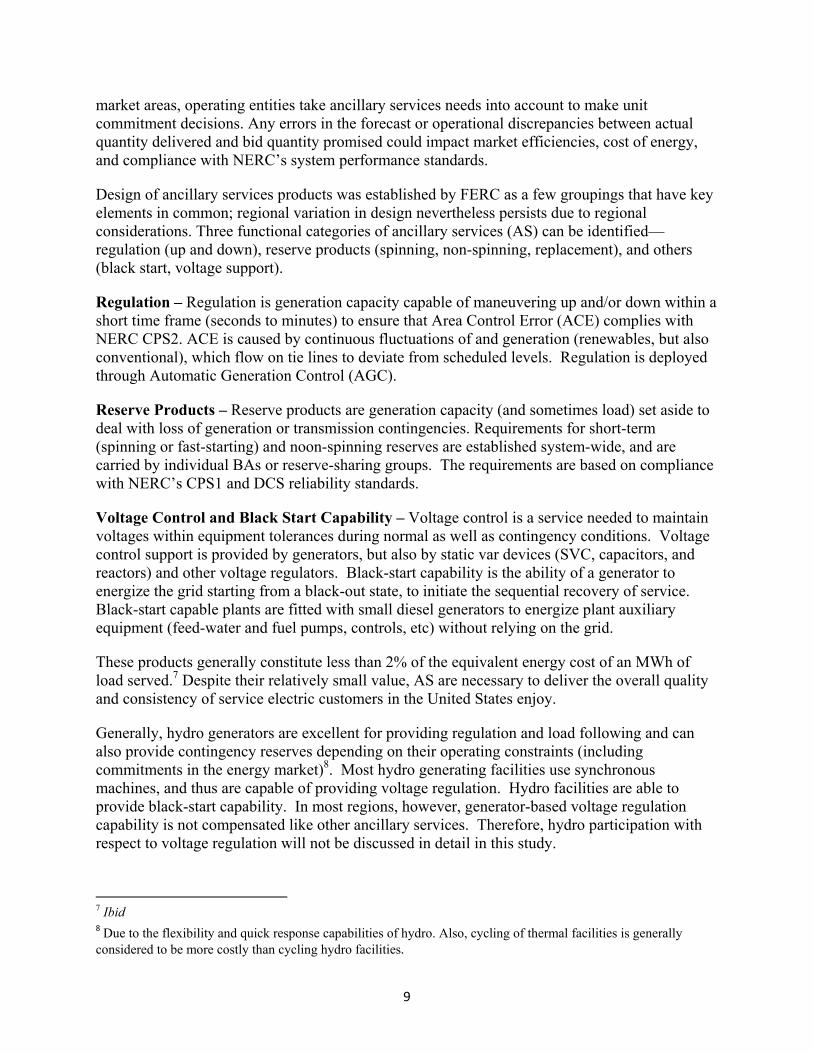
Generally, hydro generators are excellent for providing regulation and load following and can also provide contingency reserves depending on their operating constraints (including commitments in the energy market)8. Most hydro generating facilities use synchronous machines, and thus are capable of providing voltage regulation. Hydro facilities are able to provide black-start capability. In most regions, however, generator-based voltage regulation capability is not compensated like other ancillary services. Therefore, hydro participation with respect to voltage regulation will not be discussed in detail in this study.
7 Ibid 8 Due to the flexibility and quick response capabilities of hydro. Also, cycling of thermal facilities is generally considered to be more costly than cycling hydro facilities.

10
2 Grid Operations in Areas with Formal Markets The organizational and technical advances that have resulted in the present stage of evolution of wholesale markets for electrical energy are complex. In particular, the integration of day-ahead planning markets with real time markets and the use of optimization techniques to perform simultaneous unit scheduling and commitment of capacity, energy, ancillary services, and congestion are features that have increased the functioning of markets9. The integration of all markets and the use of constrained optimization—referred to as security constrained unit commitment (SCUC)—is becoming the norm in most organized markets but its use is not unique to market environments; power pools and some vertically integrated utilities have been using these techniques for decades. This form of system planning and pricing is much more complicated than the uniform price auctions that were the initial instantiation of markets best exemplified by the Power Exchange of the California ISO, one of the first electricity markets to be established in the U.S. Most formally organized market areas in the U.S. have transitioned from zonal to nodal systems. In zonal systems power system management software calculated locational marginal prices for generators within established zones whereas nodal system software calculates locational marginal prices for every bus (node) in the system.
2.1 Evolution of Ancillary Service Markets in North America
In the traditional regulated utility business model, a single load serving entity (LSE) is granted exclusive right to provide electricity service to customers within that territory. The cost of electricity represents the “bundled” cost of the energy and all of the services required to deliver the energy. In return for this exclusive right the single entity agrees to provide the service for prices set through a regulatory process (as opposed to retail market) and to maintain the capacity and energy resources to perform that function. Delivery of the service must meet certain standards of quality, reliability, and stability. Each regulated utility is responsible for acquiring and deploying the resources necessary to accomplish these objectives. Electric industry “restructuring” led to “unbundling” of the services required to generate and transmit electrical energy. In ISO/RTO areas, control of the transmission grid is relinquished to an independent system operator (ISO) or regional transmission operator (RTO), and markets were devised as a means of procuring the resources necessary to supply the demand for electric energy and to keep the grid in a stable and reliable operating condition. In non ISO/RTO areas control of the transmission system is functionally unbundled from the generation market functions by FERC requirement. Smooth functioning of markets necessitated clear and explicit definitions of the services (often referred to as products) to be traded in the markets. FERC established the basic ancillary services when it introduced restructuring. While the basic services are fairly uniformly defined across the continent there are regional differences in specific implementations. These differences persist today; but change in market design is resulting in emergence of a more consistent model, although differences will likely persist due to regional differences in systems and historical operating practices. As we review the different market designs in use by ISOs across the country and the distinct methods of resource allocation in the regulated utility cases, it is worthwhile bearing in mind the close relationship between profit maximization and cost minimization discussed earlier in this report.
9 Ibid

11
2.2 Ancillary Services Market Design10
A series of specific market design elements were identified that make it possible to compare and contrast the features of the organized market areas as to how their bidding, operational, and settlement procedures differ, and therefore how these differences affect pricing and performance.
Cascading Procurement – Ancillary services have a hierarchical nature in that response time is inversely related with quality—the shorter the response time the higher the quality of the AS product.11 This feature allows unused bids to cascade down to lower quality products where new bids can be entered; this effectively expands the available supply of the product.
AS Pricing – Virtually all markets are uniform price auctions meaning that the market is cleared and settled in such a way that all participants receive the marginal bid price. Some markets prohibit price reversal that might result from cascading procurement (New York Independent System Operator [NYISO]) whereas others have adapted other mechanisms to avoid price reversal (PJM opportunity cost adder).
Co-Optimization – Simultaneous clearing, dispatching, and pricing of energy supply, reserves, and ancillary services bids while minimizing production costs and operating reserve costs while enforcing multiple security constraints. Most of the ISO/RTO organizations perform joint optimization in at least some of the markets and a few in all of the markets.
Constraint-based Pricing – Bids in AS markets contain two components—an availability component and an opportunity cost bid. Some markets require bidders to include opportunity costs in their bid (CAISO) while others add the opportunity cost as part of the SCUC solution based on the marginal market clearing bid (PJM). In the new CAISO SCUC system a locational AS clearing price is determined as a zonal rather than nodal price reflecting the fact that a contingency may occur in a zone but it isn’t possible to predict exactly where in the zone that contingency will occur.
Bid Submission - The process of bid submission varies from one ISO to another with most, but not all, markets using one bid submission for each market.
Number of markets/settlements – Here again there is significant variation among the different markets with most using multiple markets and settlements. Most ISOs use day-ahead (DA) and real-time (RT) as categories. Four ISOs—CAISO, ERCOT (Electric Reliability Council of Texas), Midwest Independent System Operator, Inc. (MISO), and NYISO—use specific AS markets. PJM uses a RT market for procuring AS. The Independent System Operator - New England (ISO-NE) has a 30-minute forward reserve product in the day-ahead (DA) market.
10 This section relies significantly on Isemonger, Alan G., “The Evolving Design of RTO Ancillary Service Markets,” Energy Policy, 37 (2009) 150-157.
11 While this is true for most generators it is not true for energy limited storage, many responsive loads, and some emissions limited generation. These resources cannot be successfully included in ancillary service and energy co-optimization.

12
Intertie Provision of ASs – This criterion makes it clear that markets are structured to address topological issues of the system. For example, one unique aspect of the California situation is that some of the CAISO reserves can be held in a neighboring control area with generator owners having the capability to bid these reserves into the CAISO market where they clear just as internal reserves. If there is need to dispatch these reserves they are called from the neighboring control area. Another unique aspect is that certain units outside the CAISO market area are attached to dynamically scheduled interties allowing these generation resources external to the CAISO footprint to provide regulation and five-minute imbalance energy.
Cost Allocation – Most ISOs allocate the cost of providing reserves and regulation to the load based on load ratio share. This is recognized as somewhat inefficient because, for regulation, a volatile load imposes greater costs on the system than an equivalent quantity of a stable load. In the opinion of some researchers, cost allocation should be based on the principle of cost causation.12
Scarcity Pricing
Scarcity pricing is currently used only in the ISO markets that have integrated systems in which prices are determined in all markets simultaneously within the optimizations. It can be used in segregated markets but requires separate rules for each market. Scarcity pricing allows shortages in the energy markets to roll over to the AS markets with prices increasing as it solves.
2.2.1 Handling of Ancillary Services Products in Market Areas
Regulation
The regulation product is defined by most ISOs as the ramp rate of a generator per minute typically with 5-10 minutes defining the period of time permitted for ramping to the agreed rate. The NYISO, PJM, and ISO-NE define a single regulation product that incorporates both up and down regulation that requires generators providing this product to move within a band of the normal operating rate, plus or minus the ramp capability (ramp rate per minute times 5 minutes). ERCOT and the CAISO have separate regulation products for up and down. One additional unique feature is the mileage payment provided by the ISO-NE. The logic is that regulation reserves should be compensated for quick response and the distance the power travels, thereby providing additional incentive to the more effective units.
As noted, due to the physics and engineering nature of frequency response (by-product of inertia), ISOs in the U. S. treat frequency response as a portion of other market-acquired products as follows:
PJM – Frequency Response is acquired along with Regulation in the Market Based Regulation market. Resources bidding in this market must be electrically within the PJM RTO.
12 Hirst, E. and B. Kirby, “Allocating costs of ancillary services: contingency reserves and regulation”, June 2003. Available at: http://www.consultkirby.com/ files/Tm2003-152_Allocate_Res_Reg_Cost.pdfS. Hirst, E. and B. Kirby, “Creating competitive markets for ancillary services,” Available at: http://www.ornl.gov/sci/btc/apps/Restructuring/con448.pdfS, p.25.

13
ERCOT – ERCOT acquires frequency response both from its Regulation Products (up and down are separate) and also from its Responsive Reserve Product.
CAISO – Frequency Response is acquired together with the Regulation product.
NYISO – Frequency Response is acquired together with the Regulation Product.
MISO – Frequency Responsive Reserve is defined as Regulating Reserve and Spinning Reserve.
ISONE – Frequency Response is acquired along with the Regulation product in the market.
AESO – Frequency Response is acquired along with Regulating Energy.
IESO - Frequency Responsive Reserve is provided as part of the Regulation Product wherein response times vary between tens of seconds to a few minutes.
Contingency Reserves
Technical requirements specifying the reserve product are set by a combination of reliability organizations such as NERC, WECC, and the ISO tariffs that are approved by FERC. The minimum quantity of reserves required by an ISO is specified by reliability organizations. Two categories of reserves are typically designated—spinning and non-spinning reserves. The difference between the two is that spinning reserves are already synchronized to the grid and can be frequency responsive while non-spinning reserves are not. Reserve products are usually specified as the capacity that can be delivered in ten minutes. ISO-NE, ERCOT, and NYISO also have a thirty-minute response reserve product.
Comparing and Contrasting the Areas with Formal, Multilateral Markets13
Table 2-1, which contains a summary of the market features listed and briefly described in this section, provides a ready comparison that distinguishes the differences among and between the various market areas. Appendix A contains a somewhat more detailed presentation of the NERC standard for grid reliability including definitions of response times and rates for standard ancillary services products. Appendix B contains a compilation of unique features of ancillary services products for each ISO and scheduling area.
13This table is due to A.S. Isemonger who kindly granted permission for its inclusion in this report.

14
Table 2-1: Summary Table of Market Areas and Their Features
Feature/Market ISO‐NE NYISO PJM MISO ASM
ERCOT nodal
CAISO nodal
Cascading Procurement
Yes Yes Yes Yes Yes Yes
Constraint‐based Pricing
Yes Yes Yes Yes Yes Yes
Co‐optimization DA/RT DA/RT DA DA/RT DA DA/RT
AS Settlements LT/RT DA/RT DA/RT DA/RT DA/RT DA/RT
Intertie provision
No No No No No Yes
Regulation Products
Single Single Single Single Up/down Up/down
Reserves SP/NS/30 SP/NS/30 Supp/Sync‡ SP/NS SP/NS* SP/NS*
AS Scarcity Pricing
Yes Yes Likely Yes Probably Not†
Anticipated
AS from Load No No Yes No Yes NS only
Notes to Table: LT=long-term; RT=real time; DA=day-ahead; Single=single product as opposed to dual product with separate up and down; SP=spinning (synchronized or responsive) reserve. NS=non-spinning reserve; 30=30-minute replacement reserve; Replacement=ERCOT has a capacity product requiring energy bid submissions.
*ERCOT and CAISO have Residual Unit Commitment (RUC) products that are capacity payments requiring bid submission in other markets. †ERCOT has an energy only market that has an outcome similar to scarcity pricing. ‡Synchronized reserves in PJM are similar to spinning reserves and are procured in RT. Supplemental reserve is PJM’s only DA product.
Table 2-1 demonstrates a great deal of similarity in the features and market characteristics that have been adopted by most of the ISOs. ERCOT transitioned to a nodal system from its zonal system on December 1, 2010. California has already implemented its Market Redesign and Technology Upgrade (MRTU) that transitioned from a zonal to a nodal system. California is further distinguished by the fact that the CAISO is the only ISO to permit AS to be provided from outside balancing areas. Control areas hold reserves for one another for a price, of course. The CAISO allows up to 50% of its spinning and non-spinning reserves to be held in neighboring control areas. The CAISO is further differentiated in that certain units outside of the ISO’s footprint are permitted to provide regulation via dynamically scheduled interties, rendering these resources effectively the same as internal resource. This complicates pricing of ancillary services because transmission line capacity must be reserved for delivery which means that AS competes with energy for the limited capacity on the line.
All of the ISOs operate five-minute markets. What this means is market participants submit bids in both the day-ahead and real-time markets in five-minute increments somewhat in advance of the hour-ahead. All three markets are cleared: day-ahead hourly, hour-ahead hourly, and the five-minute markets with a marginal price for each segment. The bids can be in the form of a schedule of MW with associated prices or could be for a single price, whatever is preferred by

15
the generator. Some five-minute markets are cleared every five minutes but settled at the hourly average price and output. NYISO settles each five minutes. Data indicates significantly more volatility of five-minute from hourly prices and from day-ahead prices as shown in Figure 2-1.
A more extensive discussion of economic incentives provided by the variability within integrated energy markets can be found in a paper by Kirby and Milligan. The authors study the relationship between prices in the hourly and sub-hourly energy markets and find that, “. . .if sufficient ramping capability is available from units on the margin of the energy market, then there is no additional need for a ramping service—it is provided as a by-product of the energy market.”14
Figure 2-1: January 2006 Five-minute and Hourly Prices, CAISO15
14 Kirby, B., and M. Milligan, “Examination of Capacity and Ramping Impacts of Wind Energy on Power Systems.” National Renewable Energy Laboratory Technical Report NREL/TP-500-42872. July 2009. 15 Source: “Market Performance Report, January 2006” California ISO, February 22, 2006.
16
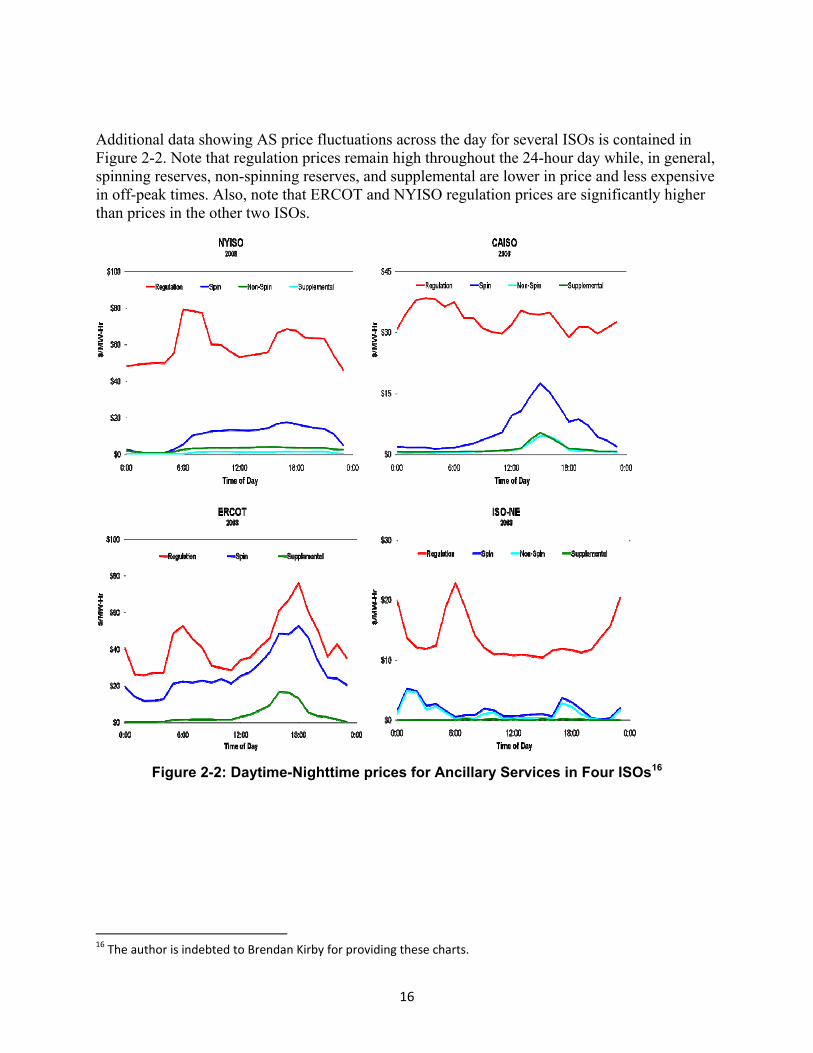
Additional data showing AS price fluctuations across the day for several ISOs is contained in Figure 2-2. Note that regulation prices remain high throughout the 24-hour day while, in general, spinning reserves, non-spinning reserves, and supplemental are lower in price and less expensive in off-peak times. Also, note that ERCOT and NYISO regulation prices are significantly higher than prices in the other two ISOs.
Figure 2-2: Daytime-Nighttime prices for Ancillary Services in Four ISOs16
16 The author is indebted to Brendan Kirby for providing these charts.

17
3 Grid Operations in Regions Operated Without Formal Markets
Two areas within the Continental U.S. operate the grid through a traditional organization structure based in large part on bi-lateral agreements between generation asset owners to support each other in the achievement of the same grid reliability standards that market areas are required to achieve. They do this through a hierarchical structure based on balancing areas very similar to those in the market areas. A difference is that in areas without formal markets the balancing areas are smaller and more numerous. Figure 1-4 shows the two main areas of the U.S. that currently have no formal markets; these are the southeast where the Florida Reliability Coordinating Council (FRCC) and the SERC Reliability Corporation (SERC) are the regional entities.
3.1 Florida Reliability Coordinating Council
The FRCC is the designated Reliability Coordinator for the region and performs this function through an agent, the Florida Power & Light investor-owned, publicly regulated electric utility in the state of Florida. This arrangement is a traditional bundled structure wherein the utility is the generation and transmission asset owner and, as the Reliability Coordinator’s agent, is responsible to the FRCC for the maintenance of reliability standards as set out by the FRCC and ultimately by NERC.
The FRCC Reliability Process identifies three primary functions—the Real Time Operating Function, the Operations Planning Function, and the State Capacity Emergency Coordination Function. The RC has the responsibility and authority to perform real-time operating actions as necessary to maintain the reliability of the Bulk Electric System (BES) in the FRCC region, to perform operations planning actions as necessary to maintain reliability, and has the responsibility and authority to direct State Capacity Emergency Coordination actions as necessary to implement the FRCC generation Capacity Shortage Plan.
3.2 The SERC Reliability Corporation
The Southeast Reliability Corporation is a non-profit corporation responsible for promoting and improving the reliability, adequacy, and critical infrastructure of the bulk power supply systems in all or portions of sixteen central and southeastern states. SERC serves as a regional entity with delegated authority from NERC for the purpose of proposing and enforcing reliability standards in particular regions of the country by entering into delegation agreements with regional entities. SERC is one of eight regional entities with delegated authority from NERC; the regional entities and all members of NERC work to safeguard the reliability of the bulk power systems throughout North America.
3.3 Ancillary Services Provision in Areas Lacking Formal Markets
Within geographic areas in which grid reliability is managed according to traditional methods ancillary services must be delivered to the grid along with energy in order to achieve the required grid performance standards. Generation asset owners in these areas may consider such services as part of their general obligation to meet load with the required performance.

18
3.3.1 Regulation
SERC – The Southeast Reliability Council is organized traditionally and each BA would obtain frequency responsive reserve from resources located within its boundary area or from within the rest of the footprint area.
FRCC – The Florida Reliability Coordinating Council is also organized traditionally and would obtain frequency responsive reserve from within each BA or, as permitted, from outside a given BA but still within the footprint of the FRCC.
3.3.2 Contingency Reserves
Each BA is expected to meet contingency obligations based on the largest single contingency within the BA. This could be met through generation resources internal to the BA or entities within the BA could enter reserve sharing pools to combine resources in an effort to achieve greater efficiency.
19
4 Grid Operations in Regions with Hybrid Business Models The Western Electricity Coordinating Council (WECC) is the largest of the NERC regions in terms of square miles of geography. The WECC area, outside of CAISO and AESO, also contains no formal markets but, by virtue of CAISO and AESO, is somewhat of a hybrid.17As indicated by the map in Figure 1-1 the WECC encompasses the entire area of ten western states (New Mexico, Arizona, Colorado, Utah, Wyoming, California, Nevada, Idaho, Oregon, and Washington) and most of Montana. It also includes two Canadian provinces (Alberta and British Columbia), and a small portion of the Mexico’s Baja California. Excluding California, the WECC area is the largest geographic area that does not have organized formal, wholesale markets for trading electricity. WECC is unique in that it represents a mixed business model that combines the features of traditional grid scheduling, via bilateral cooperation of participating utilities, together with centralized grid scheduling. For these reasons and also the detailed simulation modeling of the WECC that is being performed in this study, more detail on the organization and structure of WECC and the CAISO is presented.
The California Independent System Operator (CAISO) operates the grid and formal energy markets serving large parts of California. Exceptions are the service territories of the Los Angeles Department of Water and Power, the Sacramento Municipal Utility District, and some other smaller municipal utilities, co-operatives, and irrigation districts. The Alberta Electric System Operator (AESO) in Canada also operates a formal market.18 Interesting seam issues result from the fact that a significant portion of the load in California is met with the use of generation resources from outside California’s borders. This combined structure is labeled a “mixed” business model.
4.1 WECC Organization
Within the WECC, but outside most areas of California and Alberta, utilities operate on the traditional regulated public utility business model. They are required to serve the load, in turn for which they have an exclusive service territory. Retail electricity rates are regulated by public utility commissions, as is the generation capacity expansion plan. Day-to-day operations are coordinated within the utility organizations using utility-owned generation assets, but also by trading with neighbors and purchasing energy from Independent Power Producers.
Outside CAISO and AESO but within the WECC19, member utilities are organized into BAAs as shown on the map in Error! Reference source not found. In order to meet its load responsibly each BAA is expected to marshal the resources it owns directly or has obtained from a Merchant Generator via an Interconnection Agreement the parties have signed. In addition, output from generation assets outside the BA can be obtained by a bilateral agreement between the entities concerned. Each BAA will have a control room wherein system condition data is continuously acquired and monitored. This includes information on all of the online generation facilities and 17 Note that the MRO is the NERC regional entity for the Midwest ISO or MISO. 18 System resources in British Columbia and Alberta are considered part of the generation asset base in the UPLAN model and will be incorporated within the simulation exercises. 19 The Sacramento Municipal Utility District (SMUD) and the Los Angeles Department of Water and Power (LADWP) are organized as municipal utilities and are not included in the CAISO-governed territory.

20
the condition of transmission facilities it controls. Generally speaking, operations at a BAA control room would be governed by a combination of good business practice, electrical and mechanical engineering protocols, protection of valuable capital equipment, NERC, FERC, and other reliability oversight organizations’ standards.
4.2 Regional Reliability Centers
In an interconnected grid, physics and mechanical problems can occur in remote locations beyond the boundaries of a particular balancing authority’s area that can have implications for continued stable operation of the transmission grid. Accordingly, there is need for coordination between balancing areas. NERC has established Reliability Coordinators as the entities with reliability responsibility and a broad geographic scope. In the current structure of the WECC this is provided by one Reliability Center with two office locations that cover the entirety of WECC grid operations. Either of the two offices is fully capable of performing all reliability coordination functions. Operations guidelines followed in each of these offices are provided through a combination of NERC Policy 9 on Security Coordinator Procedures, and the WECC Regional Reliability Plan. Figure 3-1 displays the current Reliability Coordination Areas.
Figure 3-1: Regional Reliability coordination Areas within WECC
4.2.1 Role of Regional Reliability Centers
The Regional Reliability Plan defines the roles and responsibilities of each of the centers and provides the procedures by which they must operate and establishes the standards to which they must operate. Basically, this plan adopts the standards established by NERC in its Security Process Task Force recommendations, first published in 1996 and as amended subsequently. The WECC Regional Reliability Plan (Plan) describes how the WECC complies with the recommendations contained in the NERC report. The Plan originally designated a Reliability Coordinator for each of the four different sub-regions of WECC but during implementation in 1998 the Rocky Mountain and Desert Southwest Reliability Coordinators were combined. As stated above subsequently the three offices were reduced to two. All employees became WECC
21
employees. Facilities were moved from collocation with BAs to stand-alone facilities. The two centers operate as a single RC responsible for all of WECC and back each other up.
4.3 The CAISO within WECC
The key focus of interest for modeling purposes of the operation of the CAISO existing within WECC is the differences of the two independent entities and how, given these differences, they interact. The fundamental difference between the two areas is the difference in incentives that governs how the two areas function. The CAISO markets promote competition between generation asset owners who are therefore compensated based on value of service delivered. In the rest of the WECC the basis for deployment of the assets is cost of production with generation asset owners compensated based on cost of service delivered. Furthermore, given that California is supply constrained, meaning that demand or load cannot be met under certain conditions only with generation resources located within the CAISO footprint; asset owners outside California are simultaneously operating under both incentive structures. This is the explanation for why the CAISO—unique among ISOs—allows external generation asset owners to bid into their ancillary services markets. It’s a matter of necessity.
4.4 Some of the “Seam” Issues
4.4.1 Contingency Reserve Tracking
Business rules in WECC require that the G-FC Energy Product Code (NERC e-Tag) clearly identify the entity responsible for contingency resources associated with an energy import or export as either the source or sink BA. The CAISO relies on the “unit contingent” orNERC e-Tag as the primary determinant for identification of any imports designated as firm energy without reserves; this assures that the CAISO complies with the applicable NERC and WECC Standards, and procures the requisite contingency reserves to maintain grid reliability. The G-FC Energy Product Code serves as a “proxy” for firm imports that do not carry reserves until CAISO software can be modified, tested, and deployed to use the new Contingency Reserve Tracking data field; this data field enables validation and proper accounting for the contingency reserves obligation for imports that do not carry reserves. It is possible that the software may have already been deployed so that this is no longer an issue.
4.4.2 Energy Price Caps in CAISO and WECC
On May 20, 2010 FERC issued an order initiating a proceeding to investigate the price cap in the WECC outside the CAISO. FERC’s concern is aimed at eliminating the potential for market distortions that might arise from a difference in the energy bid caps in the two areas. The CAISO energy bid cap rose to $750/MWh on April 1, 2010, and will rise to $1,000/MWh on April 1, 2011. The Current energy bid cap in the WECC spot market is $400/MWh. While it was acknowledged that the price caps in the two markets operate somewhat differently—the CAISO cap is a “hard” cap and the WECC is “soft”. The “soft” cap means that market participants can make transactions above the cap but such transactions are subject to justification and refund. FERC conducted a preliminary review of the price cap in the WECC and found that it may no longer be just and reasonable. The Commission reiterated that California is important to trade

22
and reliability in the west and, furthermore, interdependent markets necessitate consistent caps in the CAISO and the rest of WECC.20
4.5 Ancillary Services in WECC
4.5.1 Regulation
WECC is in the process of defining a Frequency Responsive Reserve (FRR) criterion and is currently collecting data to aid in development of the standard. The proposal likely will have it be a subset of spinning reserve and define the standard on a NERC “category C” event21. The proposal is to share the total WECC FRR obligation among the respective BAs proportional to a BA’s load and generation.
4.5.2 Contingency Reserves
The reserve requirement for WECC is usually described as that sufficient to cover the largest credible event or 5 percent of the load served by hydro and wind and 7 percent of the load served by thermal generation, whichever is larger. The responsibility for demonstrating compliance with the reserve requirement is accounted for at the level of load serving entities which may include reserve sharing pool arrangements between two or more such entities. If reserve sharing pools exist it is this entity that must demonstrate compliance. Spinning reserves and non-spinning reserves (up to 50 percent of the reserve requirement for the latter) are eligible to be accounted towards the requirement. Nothing precludes individual BAs or Reserve Sharing Groups from carrying more Contingency Reserve than the WECC Board interpretation of the WECC Standard Operating Reserve.
4.6 Southwest Power Pool
Currently the Southwest Power Pool (SPP) is a hybrid of a type somewhat different from the WECC in that the SPP is in transition to a complete formal market structure; currently however, there is only an energy market implemented while ancillary services markets are planned for the future. The ancillary services market will have regulation reserves, spinning reserves, and supplemental reserves products.
In the current structure each entity responsible in a BA (usually a utility) decide on which generation it needs to run to meet its load and provide the support services needed to meet grid reliability standards. This approach is similar to other areas where formal markets are not in effect. However, the SPP energy market does provide an additional option to acquire generation resources so each entity in a BA can now self-supply, purchase generation in the energy market or make a bi-lateral deal with another adjacent entity (utility).
4.6.1 Regulation
Regulation is part of the spinning reserve product; all resources providing spin must be synchronized and be frequency responsive. SPP currently operates with 17 BAs and does not
20 Troutman Sanders LLP, Washington Energy Report: “FERC Initiates an Inquiry into Spot Market Energy Price
Caps in WECC” June 18, 2010. 21 A NERC category C event involves a frequency below the Low Frequency Trigger Limit for more than five minutes.

23
operate any ancillary services markets. SPP has plans to operate as a single BA and establish ancillary services markets along with a five minute energy market.
4.6.2 Contingency Reserves
Spinning reserves must be synchronized and frequency responsive. Supplemental reserves must be capable of meeting the overall reliability performance standards and are judged to be capable of such by each entity responsible within each BA.

24
5 Current Contributions of Hydro22 In order to make the claim for having increased the contribution of hydro, there is a requirement to document the current and recent past contribution of hydro—to provide a benchmark for what that contribution has been. That is the focus of this section. This section also presupposes the establishment of some metric or metrics that define what is meant by the contribution of hydro. Does this phrase refer to the amount of energy generated by hydro? Does it refer to the amount of different ancillary service products provided by hydro? Does it refer to the profitability that hydro owners obtain from their asset? Or does it refer to some other metric not mentioned? These questions will be addressed in the next section.
5.1 National Metrics Reflecting Use of Hydro Facilities
Reference to Energy Information Administration (EIA) historical data indicates that, in aggregate for the contiguous 48 states, hydro-electric facilities produced 5.9% of total net generation23 (MWh). Net summer capacity of the hydro-electric facilities that produced this quantity of net generation was approximately 9.9% of net summer installed capacity (MW) of the electric system of the contiguous 48 states.24. These data further show that the net generation contributed by pumped storage was a negative 6.3 million MWh. Net generation data for the year 2009 shows that hydro contributed approximately 10% of that for all generation technologies.25
Regional data shows that the relative importance of hydro facilities varies from region to region. Hydro provides the largest percentage of total net generation in the WECC. This is due largely to the numerous and very large hydro facilities on the Columbia River in the Pacific Northwest. For many years electricity from these facilities has been so cheap that a preponderance of electricity consumers in Seattle and Portland utilize electricity to provide space heating. Other regions where hydro is important include the Middle Atlantic and the Mountain region.
Net generation data are published by the EIA for all U.S. generation facilities; one of the variables collected for generation facilities is the NERC region in which the plant is located. This data has been sorted in order to identify the hydro (conventional and pumped storage) facilities, NERC region, and net generation for 2008. These data are shown in Table 3-1.Using the NERC region and plant name combination, hydro nameplate capacity data was extracted from another EIA data file for 2008. Net Generation and nameplate capacity data for conventional hydro are displayed for each NERC region. Using this historical data and assuming that hydro capacity has a 100% availability factor and a conventional hydro annual capacity factor for each region has 22 In this report any reference to hydro-electric energy includes both conventional hydro (impoundment and run-of-
river) and pumped storage unless a specific modifier is used to refer to one or the other. 23 Net generation is the algebraic sum of gross generation minus plant use. For pumped storage hydro, pumping is
considered plant use. Net summer capability is the steady hourly output which generating equipment is expected to supply to system load exclusive of auxiliary power as demonstrated by tests at the time of summer peak demand.
24 The Energy Information Administration’s (EIA) “Electric Power Annual” is the source for the aggregate figures referenced in this section. This report is available at http://www.eia.gov/cneaf/electricity/epa/epa_sum.html#one.
25 Generation by prime mover, fuel type, and much more is available at: http://www.eia.doe.gov/cneaf/electricity/page/eia906_920.html

25
been calculated. This could be interpreted as a potential upper bound estimate of the capacity factor. It is an upper bound estimate because of the likelihood that hydroelectric capacity does not, in fact, have a 100% availability factor. Hydro plants operate under significant legal and regulatory constraints and thus are unlikely to be 100% available. Note that the WECC contains by far the largest amount of capacity, and obtains the largest quantity of net generation from its hydro facilities as compared with all the other areas. However, it ranks third in terms of the capacity factor obtained from hydro facility operations. It is noteworthy that the NPCC achieves such a high capacity factor. It is noteworthy that for the WECC area, conventional hydro accounts for 23.6% of total nameplate generation capacity.
Table 3-1: Conventional Hydro Capacity, Net Generation, and Capacity Factor by NERC Region
NERC Region
Nameplate Capacity (MW)
Net Generation 000 (MWh)
Capacity Factor
WECC 49,359.3 167,599 38.8 SERC 13,001.0 24,456 21.5 NPCC 6,548.7 35,990 62.7 MRO 3,224.4 7,123 25.2 RFC 2,842.6 8,684 34.8 SPP 2030.2 8,565 48.2 TRE 493.2 694 16.1 FRCC 85.7 206 27.5
Table 3-2 displays similar data for pumped storage plants by region. This table does not contain a capacity factor calculation for these plants because it is more difficult to calculate pumped storage facility utilization. Net generation for the NPCC, RFC, and SERC regions was negative, while SPP and WECC had slightly positive net generation for their pumped storage facilities. This indicates that some SPP and WECC pumped storage facilities also have significant water inflows (rivers) feeding the reservoirs so they may not be purely pumped storage facilities.
Table 3-2: Nameplate Capacity of Pumped Storage Facilities by NERC Region
NERC Region
Nameplate Capacity (MW)
WECC 4,369.2SERC 8,369.0NPCC 2,811.0MRO 0.0RFC 3948.1SPP 449.4TRE 0.0FRCC 0.0

26
The United States Bureau of Reclamation (USBR) operates sixty federal dams in the Rocky Mountain west, California, and Pacific Northwest. Data for these sixty facilities indicate that approximately half of them have been used in the past to provide spinning and non-spinning reserve, replacement reserve, and regulation or load following. More than half have been used to provide black start, and most have provided voltage support in the past. Unfortunately data is not available to determine how much any of these facilities have been used to provide these ancillary services.26 USBR also publishes rolling ten-year net generation data for each of its sixty facilities all located within the footprint of the WECC. These data have been compiled and for the period 1999-2009, the most recent period for which the data is available. The ten-year average net generation for all of these facilities is 57.4 million MWh.
5.2 Hydro Contributions to Generation by ISO/RTO
The ISO/RTO organizations have combined to produce a report reflecting the results of their operations over the past five years, 2005-2009. That report was issued in response to a review undertaken by the U.S. Government Accountability Office (GAO) in 2008. The GAO recommended that FERC work with ISOs/RTOs, stakeholders and other interested parties to standardize measures that track the performance of ISO/RTO operations and markets and report the performance results to the Congress and the public. A variety of metrics are included in the report. Of pertinence to this project is the reporting of hydro generation by ISO over the five-year time horizon of the report. Figures 5-1 through 5-7 in this section are taken from that report.27 The charts make it clear that hydroelectric generation varies significantly, not only by ISO but also across time for a given ISO.
Figure 5-1: California ISO Hydroelectric Megawatt Hours as a Percentage of Total Energy
2005-2009
26 Bureau of Reclamation data is available at: http://www.usbr.gov/ The date are shown in a table to be found in Appendix B at the end of this report. 27 “2010 ISO/RTO Metrics Report.” Produced collaboratively by the CAISO, ISO-NE, MISO, NYISO, PJM Interconnection, and SPP. December 7, 2010. Available at: http://www.isorto.org/atf/cf/%7B5B4E85C6-7EAC-40A0-8DC3-003829518EBD%7D/2010%20ISO-RTO%20Metrics%20Report.pdf

27
Figure 5-2: ISO-NE Hydroelectric Energy Produced as a Percentage of Total Energy
Produced, 2005-2009
Figure 5-3: Midwest ISO Hydroelectric Megawatts as a Percentage of Total Capacity 2005-
2009
The NYISO hydroelectric chart includes renewables generation mostly from wind. In order to properly interpret the chart the growth of wind generation is included.
Figure 5-4: NYISO Hydroelectric Renewables Megawatt Hours as a Percentage of Total
Energy 2005-2009

28
Figure 5-5: NYISO Non-Hydroelectric Renewable Megawatt Hours as a Percentage of Total Energy 2005-2009
Figure 5-6: PJM Hydroelectric Megawatt Hours as a Percentage of total Energy 2005-2009
Figure 5-7: SPP Hydroelectric Megawatt Hours as a Percentage of Total Energy 2005-
2009

29
5.2.1 What is the Full Value Contribution of Hydro?
Examining the historical data leads to the conclusion that hydro facilities represent about ten percent of electric generating capacity and produce about ten percent of net generation in the U.S. By one criterion it could be concluded that hydro facilities have contributed to generation in proportion to their capacity. Furthermore, one could conclude that hydro operators have, in the past, operated their hydro and other generation assets according to criteria that served the needs and requirements of the time. However, acknowledging that the electric power business environment is changing, is it possible that hydro facilities might produce more value by changing the mode of operation to take advantage of some of the major changes that have already taken place and others that are currently evolving? Noteworthy changes are introduction of wholesale electric power markets and the introduction of new generation technologies with characteristics that potentially increase the value of features of hydro facilities. The potential for increasing the value contribution of hydro may be there but demonstrating this potential requires data and careful analysis. And it requires these in the context of each facility and possibly in the context of facilities that are related to it either through the grid system or through a watershed. Examination of a case study will make this clearer.
5.3 Hydro Contributions to Ancillary Services
Aggregate national data covering all regions of the country do not provide sufficient detail to demonstrate objectively the contributions that hydro facilities make to meeting requirements for ancillary services. The Bureau of Reclamation binary data shown in Appendix B do demonstrate objectively that many of the hydro facilities within their system in the western U.S. have been used in the past to provide all of the various ancillary services. Thus, the potential for greater participation by hydro in ancillary services provision is certainly evident. The case studies below demonstrate further that there is potential for increasing the revenues hydro facilities can receive by adjusting their operation to recognize the varying time-value of kilowatt hours of electricity. It’s quite likely that case studies being conducted by others on the project team will also demonstrate the potential to increase revenue streams to hydro by more optimal management. Thus it should be possible to generalize from this evidence the potential for nation-wide improvement in the contributions from and revenues to hydro facilities.
Provision of ancillary services requires power plants to possess a certain degree of dynamic flexibility. Some generation technologies possess this dynamic flexibility but, for fossil plants in particular, they must be operated below their design-rated capacity in order to have the room to increase output. This may result in inefficient operation, waste of fuel, and increased pollution. Hydro facilities are the most efficient source of ancillary services because of their good dynamic flexibility and may earn a substantial profit if ancillary services are purchased in a competitive market. For hydro facilities the direct cost of energy generation is close to zero. But the amount of water that can be used for generation is limited for conventional and pumped storage hydro plants; thus generation bids for hydro must be based on the opportunity cost of water usage which depends on particular parameters of the hydro project including generation and ancillary services production capability, flow and reservoir constraints, inflow, and expectations of future energy and ancillary services prices. In most formal market areas energy and ancillary services prices are jointly determined so that the market prices for the two products are interdependent. Models are available to support calculation of economically optimal bids from hydro facilities for such markets, making it possible for and providing incentives to hydro operators to

30
participate in such markets.28 The authors apply their model to realistic situations and find that participation in ancillary services markets can increase or decrease the water opportunity cost (shadow price) depending on water availability. However, hydro units with water availability translating to a capacity factor of 0.6 increases the value of existing generating capacity by 25% and nearly double the value of incremental generating capacity.
5.4 Case Studies of Glen Canyon Dam
5.4.1 Bureau of Reclamation Study
A USBR study of Glen Canyon Dam shows the potential gain from pursuing different operating regimes. 29 This study utilized detailed reservoir data for the Glen Canyon Dam to construct a “representative water year focusing on a short-run analysis approach.” The representative water year included monthly releases of water from the dam and end-of-month reservoir elevations.
Harpman examines two regimes for operating the dam, one in which strict adherence is maintained to hourly ramp rates, flow minima and maxima, and the daily change in flow; the other regime adapts the dam operations to changing demand for and price of electricity, yet results in the same amount of water released and energy generated during the year. In short, this study examines the difference in outcomes due to alternative options governing the timing of water releases for energy generation. Under the restricted operations case, more energy is generated during off-peak periods, and under the adaptive management regime, more energy is generated during peak demand periods. The difference in value of the energy sold under the two regimes amounts to over $5 million dollars over the course of the year simulated, based on energy prices as shown on the NYMEX energy commodity market. This incremental revenue represents an approximately 6.7 percent increase over the “historical” revenue the plant would generate employing the base case operating regime.
The possibility that repeated ramping of the turbine-generator sets, as required in a load following operating regime, leads to increased wear and tear and therefore maintenance costs were not examined in this study. The author mentions that differential costs of the evaluated operating regimes examined are substantially mitigated by the assumption that each strategy results in the same quantity of water released and the same physical quantity of electric power to be produced over a period of time. The only variation in either of these two simulations concerned the timing of releases of water and electrical power production. The flow regime tested against the base case fluctuated in response to energy prices but did not specifically address the provision of ancillary services to the market.
28 See for example, Perekhodtsev, Dimitri and Lester Lave, “Efficient Bidding for Hydro Power Plants in Markets
for Energy and Ancillary Services.” Center for Energy and Environmental Policy Research, Sloan School of Management, MIT. June 2006.
29 Harpman, David A., “Glen Canyon Dam, Colorado River Storage Project, Arizona: The short-Run Economic Cost
of Environmental constraints on Hydropower Operations.” Report Number EC-97-02. U.S. Bureau of Reclamation, Policy Analysis Office, Denver, Colorado. Available at: http://mysite.du.edu/~dharpman/glenpage2.htmhttp://mysite.du.edu/~dharpman/glenpage2.htm

31
5.4.2 Argonne National Laboratory Study
Context of the Study
A more recent study of Glen Canyon Dam using a more detailed, longer-term data series reached similar general conclusions as the study described above.30 This more recent study documented the financial results of actual, but nevertheless experimental releases of water from the reservoir that took place over the course of the years 1997-2005. These releases were scheduled to support scientific investigations of the effects of the releases on various environmental criteria downstream from the Glen Canyon Dam. This study, therefore, was based on the actual results of operation of the dam according to five different regimes designed to address non-power, non-market objectives. The authors then compared the actual revenues from sales of electric power attributable to each of these operating regimes to the actual power production revenues during the time it was operated in a financially more optimal mode prior to the year 1996.
The following experimental releases were actually carried out at the dam during 1997-2005:
Non-Native Fish Suppression Flow
Habitat Maintenance Flow
Low Summer Steady Flow
Aerial Photography Steady Flow
Beach/Habitat-building Flow
The definitions of these experiments are fairly self-explanatory. Financial impacts were computed as the difference in the value of Glen Canyon Dam energy production between two simulated operating scenarios as follows:
A “Baseline” Scenario that assumed compliance with Record of Decision (ROD) operating criteria including the experimental releases that actually took place during the study period;31
A “Without Experiments” scenario that assumed ROD operating criteria but that no experimental releases took place.
Ancillary Services
This study demonstrates that hydro facilities can be used to provide ancillary services even in the presence of operating constraints. Study authors decided that the Glen Canyon Dam would provide regulation and spinning reserves during the “Without Experiments” and the “Baseline” scenarios except that during experimental releases it was assumed that another facility provided these services. The authors state that Glen Canyon Dam is well-suited to providing regulation
30 Veselka, T. D., et al “Financial Analysis of Experimental Releases Conducted at Glen Canyon Dam during Water
Years 1997 through 2005”. Western Area Power Administration, April 2010. 31 The Record of Decision refers to the decision of the Interior Department Secretary in 1996 regarding future
operations of the Glen Canyon Dam. He announced that the facility would be operated under minimum low fluctuating flows which were given specificity in the form of minimum and maximum periodic releases and release ramp rates.

32
because one of its turbines is always on-line and any sudden decreases in load will not reduce generation below technical or regulatory minima. Glen Canyon Dam can provide regulation down service at zero opportunity cost so long as the release rate is greater than the minimum release rate. The authors of the study assume the provision of a 40 MW level of regulation down service because the ROD minimum flow requirement is always significantly greater than 40 MW.
To provide regulation up service, the dam and power plant must be operating below maximum capability in order to respond rapidly to need for increased generation. For the Glen Canyon Dam the authors calculate a 200 MW capability to provide regulation up service without incurring opportunity cost. Based on conversations with the Western Area Power Administration who markets the power from the Glen Canyon Dam, a regulation up and down commitment of 40 MW can be provided.
The authors also assume that the Glen Canyon Dam provides spinning reserves where the service requirement in the facility must be synchronized to the system and ready to take immediate load within ten minutes and run for at least two hours. Again, based on personal communications with the staff of WAPA, a spinning reserve level of 80 MW can be provided by the Glen Canyon Dam. This assumption is reasonable as reported by the authors because under most hydrologic conditions the exception criteria spelled out in the ROD permit this level of service to be provided at little or no opportunity cost. In other words, the ROD release regulations require that the power plant at Glen Canyon Dam be operated significantly below its physical capability.
5.4.3 Financial Results of Simulations
The authors provide a summary table showing the changes in revenues from the sale of electricity for the “Baseline” scenario (“with experiments”) normalized against the sales of electricity in the “without experiments” case for each of the water years (October 1- September 30) from 1997 to 2005. The cost of the experiments in terms of reduced revenues from electricity sales was $11.9 million in nominal terms over the nine year study period. The authors observe that, for the most part, the difference in revenues between the two cases has mainly to do with the timing of sales of electricity. Adhering to experimental flows resulted in the generation of relatively more electricity when its price was comparatively low—shifting sales from peak periods to off-peak periods. This is the same general conclusion reached in the Bureau of Reclamation study reported above.
5.5 Observations on the Studies
These two case studies provide a clear indication that there is an optimal strategy for operating a hydroelectric facility. Both of the studies examined a specific facility within a system of interconnected hydroelectric facilities and took care to model the system configuration and the extent of their mutual interdependence. However, optimality can only be judged in relationship to some specific goal. Both studies referenced a financially optimal strategy in which the facility was assumed to be operated to generate the largest monetary revenue. That is one objective and is the one that a private operator would likely employ for operation of the facility. But is this the best objective?

33
Many of the hydroelectric facilities, particularly those in the western states within the footprint of the WECC, were built with multiple objectives in mind. To the extent that benefit-cost studies were performed to justify the dams, such studies were as inclusive of as many “values” as could be included among the benefits of the facilities. Primary purposes for building these facilities were typically irrigation and flood control together with power production and recreational values leading to the conclusion that these were indeed multi-purpose facilities. From this perspective it’s not surprising that operating regimes for the facilities have sacrificed in favor of a broader range of “values”.32
That many of these “values” are not traded in markets and therefore do not have market-determined prices attached to them doesn’t necessarily make them less valuable than “values” (electricity) that do have market-determined prices. While the financially optimal strategy for a private operator (if such an entity were to operate the Glen Canyon Dam) might be to pursue the “without experiments” strategy, for a publicly-owned facility sacrificing $11.9 million over the course of nine years to achieve other objectives might possibly be economically optimal.
Another perspective on hydroelectric facilities is that at the same time that electricity prices are reflecting growing demand against a slower growing capacity, the value of water is also increasing, particularly, but not exclusively in the arid, mountain west. This reflects the competition for water among its many uses.
Finally, several more minor points about the studies are worth noting, particularly in the context of the use of hydro facilities in a more flexible operational context. Both studies did not actually examine the (possibly) increased costs of maintenance and operation that may result from cycling the turbine-generator sets in the manner of load following and provision of ancillary services. While inclusion of such costs is unlikely to significantly alter the optimal financial strategy it would be likely to alter the net returns from such a strategy.
Neither study optimized the supply of energy and ancillary services within the physical capabilities of the plants.
32 A large and growing literature in resource and environmental economics deals with methods of valuing non-
market resources including “option” and “existence” values that include the value of the option to use the resource in the future and the value of knowing that the resource exists.

34
6 Increasing the Value Contribution of Hydro Several recent studies have investigated high penetrations of renewable generation technologies—mostly wind turbines—and have analyzed strategies for offsetting the increase in net-load variability and uncertainty that this would introduce into reliability management of the interconnected electrical grid. The link between renewable energy technologies (primarily wind and solar) and hydro facilities and operations is the possible capability of hydro facilities to cycle in such a way as to offset the increase in net-load variability and uncertainty that results with high wind and solar generation penetration. The assumption is that hydro facilities would be able to provide a more valued service to the grid than the manner in which they have historically been used and that hydro facilities would, accordingly, be compensated more for this service. Further, greater compensation, should it occur, would then provide the economic impetus for more hydro facilities to be developed.
This is a matter of great concern to the industry and these investigations provide some insight into the capability and potential of hydro to increase the value of its contribution to generation and ancillary services markets and possibly to increased revenue flows as a result. Two key studies, both commissioned by the Department of Energy (DOE) through the National Renewable Energy Laboratory (NREL), have focused on integration of significant new wind electrical generation capacity. The first of these studies focused on the Eastern Interconnection while the latter focused on a major portion of the Western Interconnection. The Eastern Interconnection study was initiated first and, at that time, was the first of its kind in terms of scope, scale, and process. The Western Interconnection study was initiated somewhat later and both studies released findings and reports during 2010.33
6.1 The Eastern Wind Integration and Transmission Study (EWITS)34
The study utilized meso scale atmospheric modeling to generate ten minute wind speeds at wind turbine hub height on a 2kM grid spacing for most of the U.S. portion of the Eastern Interconnection.35 Wind speed data was converted to ten minute time series of potential wind plant MW output. Sites constituting a total of 700 GW of wind energy capacity in the eastern U.S. were selected for analysis within the wind integration study. These sites were identified using high spatial and temporal resolution meteorological models and large quantities of data covering three historical years, 2004-2006. The time series wind data was synchronized with actual load data to facilitate accurate power system modeling. Three scenarios were developed involving 20% wind energy penetration (high capacity onshore, hybrid with offshore, and local with aggressive offshore); a fourth scenario involved 30% energy penetration with aggressive offshore and onshore sites. These scenarios were developed and sited using the information provided by the meso scale modeling. These scenarios/sites then became the subject of the remainder of the modeling process. 33 Another study conducted by the European associations of transmission system operators with the European Commission is also on the scale and scope of these two studies for portions of the North American grid. 34 Eastern Wind Integration and Transmission Study: Executive Summary and Project Overview. Prepared for the National Renewable Energy Laboratory by EnerNex Corporation. January 2010. Both the executive summary and full reports can be found at: http://www.nrel.gov/wind/systemsintegration/ewits.html 35 Most of SERC was excluded because of low on‐shore wind resource potential.

35
The study process is depicted graphically in Figure 6-1 the core of which is the production cost simulations that are conducted for a full future year on the assumption of hypothetical load and generation forecasts.
Figure 6-1: EWITS Study Process36
The study uses a security constrained unit commitment and economic dispatch production cost model to run hourly power system operational simulations using the transmission overlays (developed for the study) for each scenario and the wind plant outputs and actual load data for 2004-2006. Sub-hourly variability and ancillary service requirements were included through statistical analysis and reserve requirements. Basically the model uses the wind generation at each injection point closest to the wind facility and dispatches non-wind generation for each market region while solving at the model node for the locational marginal price. The model first solves the unit commitment to determine which generation units will be used and then dispatches each of the units hourly according to how much generation is required to meet the load. This simulation is performed over the entire study region and the wind plant and load time series data capture geographic diversity.
6.1.1 Key Study Findings
In general the study concludes that all scenarios considered are technically feasible given the required additions to transmission capacity. Without the additional transmission capacity, wind curtailments would be required for all of the scenarios. Wind integration costs are manageable with large operating pools but would require changes to markets and tariffs. The additional
36 Ibid, p. 18.

36
transmission helps reduce the impacts of wind variability thereby also reducing integration costs, increases the reliability of the electrical grid and makes it possible to more efficiently use all generation resources, not just wind resources. While the most aggressive expansions of the grid add significantly to costs they are judged to make up a relatively small portion of annualized costs for the scenarios studied. Figure 6-2 presents a summary of the costs by scenario showing the major cost components for each.
Figure 6-2: System Cost by Scenario and Cost Component
6.1.2 Discussion of Study Results
The generation expansion portion of the study did not deploy additional hydro “. . . and hydro facilities as options because they were not economically competitive with the conventional resources under the assumptions applied to the analysis.”37 Perhaps it is the case that hydro facilities’ contributions to wind integration were not examined in more depth because the Eastern Interconnect simply has less hydro capacity (as a proportion of total capacity) than exists in the WECC.
6.2 Western Wind and Solar Integration Study38
The Western Wind and Solar Integration Study (WWSIS) was conducted more-or-less simultaneously with the EWITS, its “sister” study, and under very similar contractual arrangements. The WWSIS focused on a major portion of the WECC grid often referred to as the West Connect region which includes virtually all of Wyoming, Colorado, Arizona, and Nevada, and most of New Mexico. High penetrations of wind and solar generation were also modeled in the remainder of the U.S. portion of WECC. Because western weather patterns are more amenable to solar power this technology was also included in the WWSIS study along with wind energy technology. Also, because hydro facilities play a more important role in western energy generation, the WWSIS study included a component analysis that focused specifically on hydro 37 Eastern Wind Integration and Transmission Study. Prepared for the National Renewable Energy Laboratory by EnerNex Corporation. P. 96. 38 Western Wind and Solar Integration Study. Prepared for the National Renewable Energy Laboratory by GE Energy. May 2010. Both the executive summary and full reports are available at: http://www.nrel.gov/wind/systemsintegration/wwsis.html

37
operations and investigated the role that could be played by hydro assets, likely a reflection of the existence of a larger percentage of hydro capacity in the WECC.
The two studies are technically similar in approach in that they both developed three years of high resolution wind output data that was time-synchronized with historic load data and used security constrained unit commitment and economic dispatch production cost modeling as a means of comparing scenarios. Scenarios are constructed with similar modeling procedures to define the wind and solar potential in particular regions. Similar assumptions about the operations of are made with both studies modeling sub-hourly dispatch and scheduling over a broad geographic area. Other differences include the modeling of both wind and solar in WWSIS but only wind in EWITS and more attention to the role of hydro facilities in WWSIS. A separate, companion study focusing strictly on the potential for hydro to assist in the integration was conducted.
6.2.1 Key Findings of the Study
A study of this scope and scale clearly will have many findings; of most pertinence to this study is the modeling of, observations about, and findings with respect to hydro facilities, providing rationale for focus on this topic. Wind forecasting was used to improve the unit commitment and economic dispatch of all conventional generation. Hydro facilities were assumed to meet minima and maxima of monthly power output levels.
Output patterns shift somewhat but major changes in hydro operation were avoided. A base case (no wind) and the wind penetration cases were compared directly; wind forecasts did not seem to cause significant hydro up or down ramps.
Then the authors examined the benefits of wind forecasting for hydro scheduling. They use spot price duration curves for hydro for the various renewable penetration levels as compared to when hydro is scheduled on load alone to show that the spot prices don’t vary that much even for the higher penetration levels.
Hydro spot prices for scheduling hydro net of wind do not vary significantly nor do they vary much from the spot prices for scheduling hydro on load.
The effects of scheduling hydro before renewables was then investigated using total system operating costs differences as a metric; costs increase for all three penetration levels as compared with scheduling hydro after renewable. While differences are fairly small for the ten and 20 percent penetration cases they climb to over $200 million for the 30% case.
There are advantages to use wind forecasts to improve hydro scheduling.
A case study comparison of operations at Glen Canyon dam based on recent historical data shows that nameplate capacity and maximum generation are very sensitive to head behind the dam. These data are used to show that available capacity at Glen Canyon is currently well below its historical maximum due to low levels of Lake Powell. To reflect realistic constraints on hydro facilities simulations were run in which all hydro facilities in the model were set to generate the same monthly energy as in the base cases. Nameplate capacities of all plants were reduced to this value with the result that there was no spinning reserve support from these facilities. For each of these simulations, a base case compared with each of the renewable penetration cases, showed operating costs were higher with the “flat” hydro assumptions.

38
Restricting the flexibility of hydro (no spinning reserve service) adds significantly to total system operating costs
Restricting the flexibility of hydro actually increases the value of renewables because the no-wind case with flat hydro results in shortages and higher use of peaking units.
The companion study conducted further investigations to obtain a more complete picture of the potential hydropower role and provide a more robust foundation for the findings from the main study.39 A number of the questions addressed as well as the analysis methodology are directly pertinent to the present project. Among the most pertinent questions addressed are:
What is the effect of major renewable penetration on hydro operations?
How do the wind scenario build outs affect hydro generation dispatch?
What is the value of hydropower as a balancing resource?
What is the value of participation in wind integration to hydro asset owners?
Three renewable penetration scenarios were investigated; as the penetration level increased very little change in hydro generation pattern was observed at the system level. Nevertheless, at certain larger hydro plants, their use increased as the penetration level increased. The use of hydro flexibility was found to increase at each of the two larger plants investigated in detail. The greatest differences in hydro operations occurred during the spring months when high winds occur in the west leading to full use of the storage and flexibility of hydro facilities.
Several different scenarios for siting the renewable facilities involved different combinations of in-area and out-of-area locations. As more of the new renewable projects were located in remote regions outside of the study footprint, less of the flexibility of hydro was needed due to the lower variability of net load. This led to changes in operations at the plants as between different scenarios of build-out strategies.
The focus among hydro advocates today is the capability of hydro to provide added value by acting as a counter-balance to the variability of renewable energy technologies. Simulations were conducted to test this proposition by severely restricting the flexibility and reserve capabilities. This resulted in significant increases in total production cost for the WECC thereby demonstrating the cost-reducing potential in the hydro facilities. A valuable insight was gained when comparing revenue value for hydro at the lower penetration level for the whole WECC system. Total revenue losses for this scenario were about $3.5 billion (revenue value declined due to restrictions on the flexibility of hydro), but at the higher penetration levels wind resources are able to provide sufficient generation such that hydro flexibility is less valuable in the system with the result that value losses decline as compared with the low penetration scenario. The more wind resources that are introduced, the lower the average cost of a MWh on the system. The effect on ancillary services was not addressed in the study.
To test the proposition that hydro units could increase value by participating in wind integration simulations were run on the assumption that hydro served load before renewable generation was introduced. This required any variability introduced by renewable to be served by gas-fired units
39 “Western Wind and Solar Integration Study: Hydropower Analysis.” Prepared for National Renewable Energy laboratory, National Wind Technology Center; prepared by Dr. Tom Acker and Mr. Carson Pete, Department of Mechanical Engineering, Northern Arizona University. Draft. October 2010.

39
that also have the flexibility to ramp up and down but generally carry a higher production cost than hydro. Indeed, at the higher penetration levels particularly, total system costs increased as expected demonstrating the value of flexible hydro.
The study briefly described is the broadest-scoped study of the effects of introducing significant additional renewable capacity into the electric grid that has been conducted to date in the U.S. It has the additional feature of a close examination of the effects of this investment strategy on hydro facilities and on how hydro can help ease the transition into this new future. While it has valuable insights into the role that hydro could perform, that role may be restricted by site-specific requirements on how much hydro flexibility is actually available. Modeling requirements typically required general specification of operating rules for facilities and most models cannot deal effectively with the types of operating constraints that pertain to hydro. Whether hydro can play a larger role in the new grid future may depend on the willingness of hydro facility operators to operate their facilities to provide the maximum amount of flexibility to the power system.

40
7 Summary and Concluding Observations This report has presented a survey of the approaches to generation resource acquisition in practice in different regions around the U.S., including background information helpful to greater understanding of the approaches, their similarities and distinctions. The survey encountered a situation in which the organizational structure is in a state of partial transition which has been represented as differences in business models. The end goal of all the various procedures and practices for resource acquisition and grid reliability management in effect around the Country is common, leading to the possibility that the different approaches result in different efficiencies which may result in economic pressures to continue the evolution. The structure evolved during the writing of this report (ERCOT transitioned to a nodal from a zonal system in December 2010) and is likely to continue to evolve, likely rendering some of this report obsolete.
Review of the status of the transition from deliberative planning of grid reliability management to implementation of formal market mechanisms was generation technology independent in that only limited references to specific technologies was made where required by specific provisions (e.g., the WECC specification of contingency reserve portion based on hydro capacity). Nevertheless, it is understood that the focus of the project in on the current and possible future (increased) contribution of hydro facilities. Toward that end, effort was expended to quantify the current contributions of hydro by applying national metrics and data to reflect it use. It was found that data for this quantification effort was severely lacking except at the most aggregate levels. No data was found to express the contributions of all hydro facilities to ancillary services versus generation. Case study information did shed some light on this issue but was not the focus of the effort. Recent aggregated renewables integration studies on the one hand, more or less dismissed the role of hydro in balancing the grid, while the other limited the contribution. Evidence was found that many hydro units in the WECC had at some time contributed to all of the ancillary service categories. The author judges the evidence to suggest that the potential for hydro to contribute more certainly exists whether it can be realized will require changes.
It is an inescapable fact that many of the hydro facilities that exist today, particularly those in the western U.S., were built as multi-purpose projects using public capital and managed by public authorities to serve many perceived needs including flood control, irrigation and drinking water supply, and recreation. Case studies examined suggested that even respecting these other uses, more can be obtained from hydro facilities in their electricity generating role. This is hopeful.
In areas governed by non-market acquisition of generation resources incentives for increasing the role of hydro need strengthening. In planning simulation models of such areas the concept of minimizing the cost of system-wide total cost of meeting a hypothetical and exogenously-specified load forecast is notional at best to entities charged with the responsibility of managing hydro resources. In contrast, in market areas the incentives are apparent. Data is accessible on the prices for energy and ancillary services of different qualities at different times of the day, week, month, and year.
Markets emerge in response to perceived needs and requirements. Therefore as grid reliability management and markets become more sophisticated needs that previously went unidentified may become more evident. Thus it may be the case that flexibility in response time and ramp rate that appears to be an advantage of hydro facilities may become generalized enough that a market for flexibility or for the parameters of flexibility may arise. This has been suggested in recent literature.
41
References “Energy and Ancillary Services Market Operations,” PJM Interconnection, June 23, 2010. Available at:
http://www.pjm.com/
“Midwest ISO Ancillary Services in the Midwest ISO Markets,” April 26, 2006. Available at: http://www.midwestiso.org/home
“NERC Integration of Variable Generation Task Force.” Available at: http://www.nerc.com/filez/ivgtf.html-
Abi-Samra, N. Ancillary Services Measurement Handbook. Electric Power Research Institute Report, Number 1004011, December 2001.
Acker, Tom and Carson Pete. “WWSIS: Analysis on Hydropower PSH Operations,” Northern Arizona University, Flagstaff, AZ, August 19, 2010.
Acker, Tom and Carson Pete. “WWSIS: Update on Hydropower Analysis,” Northern Arizona University, Flagstaff, AZ, June 21, 2010.
Alvarado, Al and Karen Griffin. “Revised Methodology to Estimate the Generation Resource Mix of California Electricity Imports,” California Energy Commission, Electricity Analysis Division, Electricity Analysis Office, April 12, 2007.
Awad, Mohamed, et al. “Economic Assessment of Transmission Upgrades: Application of the California ISO Approach.” IEEE Xplore Digital Library, October 18, 2006. Digital Object Identifier: 10.1109/pes.2006.1709178. Available at: http://ieeexplore.ieee.org/xpls/abs_all.jsp?arnumber=1709178&tag=1
Baldick, Ross and Martin L. Baughman. “An Oligopoly Simulation of a Restructured ERCOT: Will Future Prices be Competitive?” The Electricity Journal, Vol. 16, No. 3, PP. 59-71, April 2003.
Blair, Nate, et al. “Renewable Energy and Efficiency Modeling Analysis Partnership (REMAP): An Analysis of How Different Energy Models Addresses a Common High Renewable Energy Penetration Scenario in 2025.” National Renewable Energy Laboratory Technical Report, Number NREL/TP-6A2-45656, September 2009.
Bonneville Power Administration. “Challenge for the Northwest: Protecting and Managing an Increasingly Congested Transmission System,” April 2006.
Bushnell, James B., et al. “Vertical Arrangements, Market Structure, and Competition: An Analysis of Restructured Electricity Markets,” NBER Working Paper Series, Working Paper 13507, October 2007. Available at: http://www.nber.org/papers/w13507
California ISO: http://www.caiso.com/

42
Cook, Jim and Jim Walsh. “Optimization of Hydro-Power Plants for Generation.” Informal paper. February 2008. Available at: www.ighem.org/Paper2008/02.pdf.
Edwards, Brian K. The Economics of Hydroelectric Power, Edward Elgar, Northampton, USA, 2003.
ERCOT: http://nodal.ercot.com/
ERCOT: http://www.ercot.com/
Eastern Wind Integration and Transmission Study: Executive Summary and Project Overview. Prepared for the National Renewable Energy Laboratory by EnerNex Corporation. January 2010.
Eastern wind Integration and Transmission Study. Prepared for the National Renewable Energy Laboratory by EnerNex Corporation. January 2010.
Federal Energy Regulatory Commission. “Integration of Variable Energy Resources.” Notice of Inquiry, issued by the Federal Register, January 21, 2010.
Florida Reliability Coordinating Council, Inc. “Regional Process for Determination of Most Severe Single Contingency,” October 1, 2009. Available at https://www.frcc.com/default.aspx
Florida Reliability Coordinating Council, Inc. “Contingency Reserve Policy.” April 1, 2010. Available at https://www.frcc.com/default.aspx
Forsund, Finn R. Hydropower Economics, Springer, 2007.
GE Energy. “Western Wind and Solar Integration Study.” Report prepared for The National Renewable Energy Laboratory, May 2010.
Harpman, David A. “Glen Canyon Dam, Colorado River Storage Project: The Short-Run Economic cost of Environmental Constraints on Hydropower Operations.” Bureau of Reclamation Report, Number EC-97-02, June 1997.
Harpman, David A. and Aaron J. Douglas. The State of the Colorado River Ecosystem in Grand Canyon. Chapter 10, “Status and Trends of Hydropower Production at Glen Canyon Dam,” edited by Steven P. Gloss, Jeffrey E. Lovich, and Theodore S. Melis, U.S. Geological Survey Circular 1282. November 25, 2009.
Harvey, Scott M., Susan L. Pope, and William W. Hogan. “Comments on the California ISO MRTU LMP Market Design.” Report prepared for the California Independent system Operator, Cambridge, Massachusetts, February 23, 2005.
Hirst, E. and B. Kirby, “Allocating the Costs of Ancillary Services: Contingency Reserves and Regulation,” The Electricity Journal. Volume 16, Issue 10, December 10, 2003. Available at: http://www.sciencedirect.com/science?_ob=ArticleURL&_udi=B6VSS-4B3NS73-8&_user=6086598&_coverDate=12/31/2003&_rdoc=1&_fmt=high&_orig=search&_origin=search&_sort=d&_docanchor=&view=c&_searchStrId=1461052207&_rerunOrigin=google&_acct=C000059

43
129&_version=1&_urlVersion=0&_userid=6086598&md5=9df8a00e71663c5ec8c83fcb4ed6f1ec&searchtype=a
Hirst, E. and B. Kirby.”Creating competitive markets for ancillary services,” Available at: http://www.ornl.gov/sci/btc/apps/Restructuring/con448.pdfS, p.25.
Hirst, Eric and Brendan Kirby. “Electric-Power Ancillary Services,” Oak Ridge National Laboratory Report Number ORNL/CON-426, Oak ridge, February 1996.
Hogan, William M. “Electricity Market Restructuring: Successful Market Design.” Paper prepared for the NECPUC Conference, Rockport, Maine, June 12, 2006.
Hogan, William W. “Electricity Market Reform: Right and Wrong Paths.” Presentation to Association of Power Exchanges Conference, October 13, 2009.
Hogan, William W. “Resource Adequacy Mandates and Scarcity Pricing.” Informal working paper dated February 23, 2006, prepared at the request of PPL Corporation in connection with the FERC proceedings on the Reliability Pricing Model proposal for PJM Interconnection.
http://www.energylegalblog.com/archives/2010/05/25/2848 - Note: The previous URL references an article that explains the WECC price cap is a “soft” cap while the CAISO maintains a “hard” cap.
http://www.troutmansandersenergyreport.com/2010/05/ferc-initiates-an-inquiry-into-spot-market-energy-price-caps-in-wecc/ - Note: The previous URL references an article that discusses the issue of differential WECC and CAISO energy bid caps.
http://www.wecc.biz/documents/2005/News/WECC_RCC_RFIP_10-25-05.pdf - Note: The previous URL contains the invoicing information for CAISO to pay WECC dues.
http://www.wecc.biz/Standards/Interpretations/Forms/AllItems.aspx
IESO. “Market Rules for the Ontario Electricity Market,” December 2009.
Isemonger, Alan G. “The Evolving Design of RTO Ancillary Service Markets,” Energy Policy, 37 (2009) 150-157.
ISO New England. “2005 Wholesale Markets Plan”, November 30, 2004.
ISO New England. “Wholesale Markets Plan,” March 01, 2004.
ISO New England. “2006 Update: Wholesale Markets Plan,” September 2005.
ISO New England. “2007 Update: Wholesale Markets Plan,” October 2006.
ISO/RTO Council. Available at: http://www.isorto.org/site/c.jhKQIZPBImE/b.2604471/k.B14E/Map.htm
ISO-New England. Available at: http://www.iso-ne.com/
Kirby, Brendan J. and John D. Kueck. “Spinning Reserve from Pump Load.” Report to the California Department of Water Resources, ORNL Report Number ORNL/TM-2003/99.
44
Kirby, Brendan. “Ancillary Services: Technical and Commercial Insights.” Report prepared for Wartsila, July 2007.
Kirby, B., and M. Milligan, “Examination of Capacity and Ramping Impacts of Wind Energy on Power Systems.” National Renewable Energy Laboratory Technical Report NREL/TP-500-42872. July 2009.
Perekhodtsev, Dimitri and Lester Lave, “Efficient Bidding for Hydro Power Plants in Markets for Energy and Ancillary Services.” Center for Energy and Environmental Policy Research, Sloan School of Management, MIT. June 2006.
London Economics. “Structure and Performance of Six European Wholesale Electricity Markets in 2003, 2004, and 2005.” Report prepared by London Economics in association with Global Energy Decisions, February 2007.
March, Patrick, and Paul Wolff. “Optimization-Based Hydro Performance Indicator.” Proceedings of WaterPower XIII, July 2003.
Midwest ISO. “Midwest Independent Transmission System Operator: Ancillary Services Market Business Rules, Final Version,” February 6, 2007. Available at: http://www.midwestiso.org/home
Milligan, M. and B. Kirby. “Analysis of Sub-Hourly Ramping Impacts of Wind Energy and Balancing Area Size.” National Renewable Energy Laboratory Conference Paper NREL/CP-500-43434, June 2008.
New York Independent System Operator. Ancillary Services Manual, October 2009. Available at: http://www.nyiso.com/public/index.jsp
North American Electric Reliability Corporation. “Reliability Standards for the Bulk Electric Systems of North America.” Available at: http://www.nerc.com/page.php?cid=2|20
North American Electric Reliability Council. “Frequency Response Standard Whitepaper.” Prepared by the Frequency Task Force of the NERC Resources Subcommittee, April 6, 2004.
Ontario ISO: http://www.ieso.ca/
Ortolano, Leonard, et al. “Grand Coulee Dam and the Columbia Basin Project, USA.” Prepared for the World Commission on Dams, November 2000.
Perekhodtsev, Demitri and Lester Lave. “Efficient Bidding for Hydro Power Plants in Markets for Energy and Ancillary Services.” Center for Energy and Environmental Policy Research. Report Number 06-003. January 2006.
Rangel, Luiz Fernando. “Competition Policy and Regulation in Hydro-Dominated Electricity Markets,” Energy Policy, Volume 36, January 2008.
Reliability Coordinating Council, Inc. “Reliability Process for the FRCC Bulk Electric System.” Florida, July 28, 2010.

45
Singh, Harry. “Auctions for Ancillary Services,” Decision Support Systems, Volume 24, Number 3-4, January 1999.
Southeast Reliability Corporation: http://serc1.org/Application/HomePageView.aspx
Southwest Power Pool: http://www.spp.org/
Suul, Jon Are, Kjetil Uhlen and Tore Undeland. “Variable Speed Pumped Storage Hydropower for Integration of Wind Energy in Isolated Grids—Case Description and Control Strategies.” Paper presented at Nordic Workshop on Power and Industrial Electronics, June 2008.
Unger, Gustaf and Hans-Jakob Luthi, “Power Portfolio Optimization and the Importance of Operational Flexibility.” Swiss Federal Institute for Technology, Institute for Operations Research, December 13, 2002. Available at: http://www.ifor.math.ethz.ch/research/financial_engineering/publications_fe
Veselka, T.D., et al. “Financial Analysis of Experimental Releases Conducted at Glen Canyon Dam during Water Years 1997 through 2005.” Argonne National Laboratory Report Number ANL/DIS-10-7, April 2010.
Western Electricity Coordinating Council, “2009 Power Supply Assessment.” October 1, 2009.
Western Electricity Coordinating Council, “Transmission Expansion Planning Policy Committee, 2009 Study Program Results Report,” January 26, 2010.
Western Electricity Coordinating Council, “Electricity Markets and Variable Generation Integration,” Whitepaper of the Variable Generation Subcommittee Marketing Workgroup. January 6, 2011
Western Wind and Solar Integration Study. Prepared for the National Renewable Energy Laboratory by GE Energy. May 2010.
Western Wind and Solar Integration Study: Hydropower Analysis. Prepared for National Renewable Energy laboratory, National Wind Technology Center; prepared by Dr. Tom Acker and Mr. Carson Pete, Department of Mechanical Engineering, Northern Arizona University. Draft. October 2010.
Wolak, Frank A. “Designing Competitive Electricity Markets for Latin American Countries. Paper prepared for the First Meeting of the Latin American Competition Forum, Paris: 7-8 April, 2003.

46

47
Appendix A - NERC Standard Definitions of Reliability Pertinent to Ancillary Services
Regulation
4 secs – 5 mins
Balancing
4 secs – 5 mins
Spinning Synchronized Reserve
10 mins – 105 mins
Non-spinning, non-synchronized Reserve
10 mins – 105 mins
Cleared in the hourly day-ahead market.
Defined as the amount of AGC)-capable reserve sufficient to provide normal regulating margin.
QSE’s or LSE bid a two-part bid price including a no-load bid and an energy bid in$/MWh for a specific amount of capacity.
Regulation is used to correct for frequency response, to match actual interchange and scheduled interchange within required limits, and to control flows on transmission lines.
For most ISOs regulation is supplied by resources located within the metered electrical boundaries of the ISO (except CAISO);
No requirement on a BA to carry a set amount of regulating reserve; however, a BA is required to carry sufficient spinning reserve, immediately responsive to AGC to provide sufficient regulating margin to allow the BA to meet NERC control performance criteria.
Balancing Energy Service is used to minimize the net energy deployed for system control and to reduce zonal congestion.
Cleared in the hourly day-ahead market.
QSEs or LSEs bid a two-part bid price including a no-load bid and an energy bid in $/MWh for a specific amount of capacity.
Synchronized Reserve can be converted fully into energy or load within 10 minutes of a dispatch request.
Must be provided by equipment electrically synchronized to the system.
Synchronized Reserve and Regulation are jointly optimized in market clearing to minimize the total cost of supplying energy, regulation, and synchronized reserves.
Resources cannot be committed for both synchronized and regulation during the same hour.
Load following energy and non-spin reserves will be deployed as practicable and, if necessary, to minimize the use of the 10-minute reserves.
Regulating Reserves in excess of requirement may be used for spinning reserves.
Cleared in the hourly day-ahead market.
Non-Synchronized Reserve can be fully converted into energy or load that can be delivered to or removed from the system within 10 minutes of a dispatch request.
Can be provided by equipment not electrically synchronized to the system.
Suppliers of generation may submit availability bids.
Off -line generation resources are able to be loaded or Interruptible Load resources must be removed within the DCS recovery period.
Resources that generally qualify in this category are currently shutdown hydro, pumped hydro, aero derivative combustion turbines, reciprocating engine plants, and interruptible demand resources.
Market participants have the option to self-supply or to purchase from market.

48
Regulation
4 secs – 5 mins
Balancing
4 secs – 5 mins
Spinning Synchronized Reserve
10 mins – 105 mins
Non-spinning, non-synchronized Reserve
10 mins – 105 mins
Dispatched through a BA’s energy management system every 4 seconds (some entities allow slight deviation from 4-second response.
Regulation service is priced on the basis of the marginal bid adjusted for opportunity cost of energy that the specific resource might forgo if required to provide service. It is adjusted for regulation demand curves to ensure that the price paid is no greater than that indicated by the demand curve.
Market participants have the option to self-supply or to purchase from market.
Operating Reserve: Spinning Reserve must be fully restored within 90 minutes from the end of the DCS recovery period, 15-minutes from the initial event. Ten-minute spinning and non-spinning OR must be provided by resources available within 10 minutes of the contingency to restore the supply/ demand balance. Ten-minute spinning OR can be offered by generators that are actually synchronized to the power grid.
A BA must have documentation that it maintained at least 100% of minimum spinning contingency reserve required, based upon data averaged over each clock hour. The exception would be within the first 105 minutes following an event requiring the activation of contingency reserves.
Market participants have the option to self-supply or to purchase from market.

49
Appendix B - Unique Features and Definitions of Ancillary Services Products by ISO and Scheduling Area
ISO Regulation
4 secs – 5 mins
Balancing Energy
4 secs – 5 mins
Synchronized, spinning Reserve
10 mins – 105 mins
Non-synchronized, non-spinning Reserve
10 mins – 105 mins
Supplemental Operating
PJM40 Regulation is a single market product supplied by self-scheduled resources or purchased in the regulation market;
Regulation units must be prequalified and meet standards;
Regulation for each control zone is supplied from resources within that zone.
Regulation market cleared simultaneously with synchronized reserve and energy market.
For hydro units having no energy bids a substitute opportunity cost is based on an average LMP at the unit bus for the
Uses synchronized resources through AGC (automatic generator control) to achieve real power balance and meet NERC standard.
Synchronized Market Clearing is a joint optimization between regulation, synchronized reserves, and energy designed to minimize total cost.
Tier 1 resources are on-line following economic dispatch and able to ramp from current output level, including load capable of reducing within 10 minutes.
Tier 2 resources are synchronized and operating at a point that deviates from economic dispatch, including generators operating in condensing mode as well as dispatchable load with controls in place to
PJM is planning to add the 10-minute, non-synchronized reserves into the existing ancillary service market in 2010.
Supplemental, 30-minute reserves are cleared in a day-ahead scheduling reserve market;
40 Scarcity pricing is implemented. Scarcity pricing is triggered when demand exceeds supply bids. Trigger is violation of minimum requirements for the AS
region or sub-region. When scarcity pricing is triggered, prices of AS will rise automatically to the values determined by the Scarcity Reserve Demand Curves (Regulation up, spinning and non-spinning reserves).

50
ISO Regulation
4 secs – 5 mins
Balancing Energy
4 secs – 5 mins
Synchronized, spinning Reserve
10 mins – 105 mins
Non-synchronized, non-spinning Reserve
10 mins – 105 mins
Supplemental Operating
appropriate off-peak or peak period.
Regulation resources are offer-capped at the lesser of cost-based or market-based regulation offer price.
Demand resources are limited to 25% of regulation requirement.
automatically drop.
ERCOT (TNM) 41
Regulation up and down constitute two separate market products.
The MW requirement for each daily hour is determined monthly. The quantity of MWs procured is based on the amount historically deployed and the amount of time in which regulation service was exhausted.
Resources must be qualified to provide regulation.
No evidence of price caps on regulation.
Balancing energy service bids (up and down are separate products) must be specific to congestion zone, a resource, a ramp rate, and service time period. Awarded for each 15-minute interval
ERCOT is going to a nodal market December 1, 2010 with 5-minute market for SCED but settlement will still be for 15-minute intervals.
Price cap of $2,250/ MW for energy.
Demand-side resources can provide up to 50% of this MW requirement.
Responsive Reserve Service may be provided from:
Unloaded on-line generation resources,
Resources controlled by high- set under-frequency relays, or
Direct Current (DC) tie-line response. The DC tie-line response must be fully deployed within 15 seconds on the ERCOT System after
Non-spinning reserve service is a 30-minute product provided by :
Off-line Generation Resource capacity, or
Reserved capacity from on-line generation resources, or
Loads acting as a resource capable of being interrupted within 30 minutes and capable of running (or being interrupted) at a specified output level for at least 1 hour.
,41 Scarcity pricing mechanism is in place.
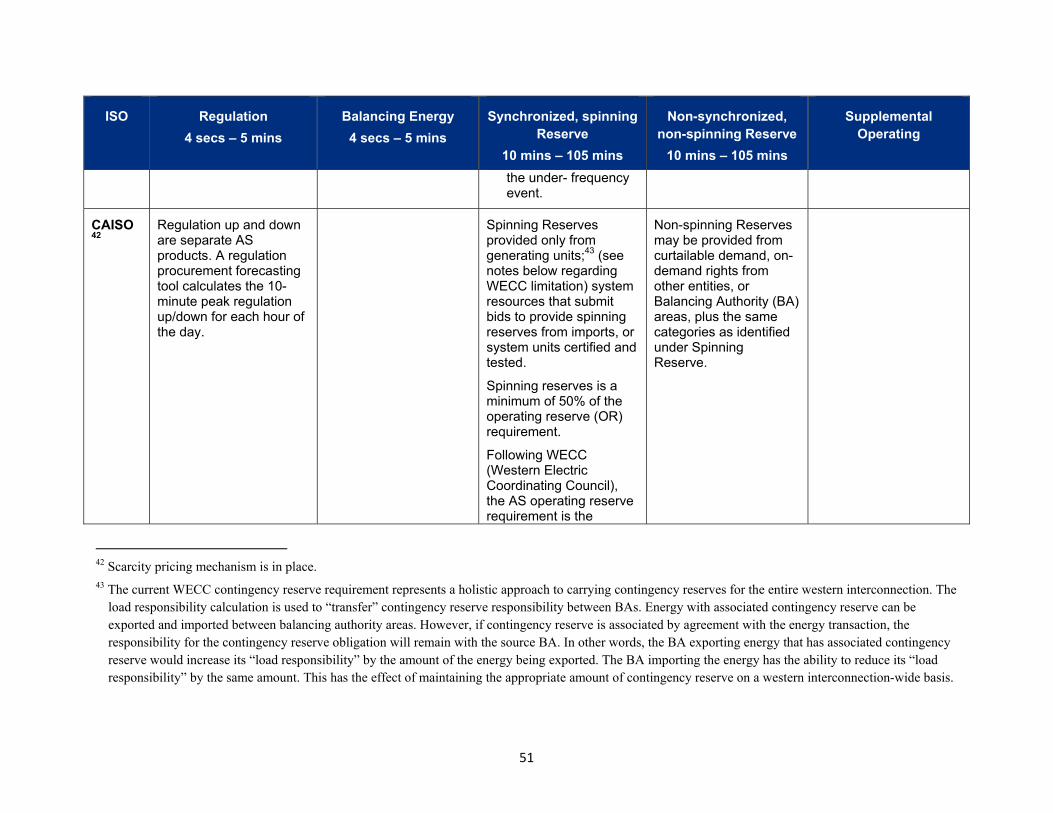
51
ISO Regulation
4 secs – 5 mins
Balancing Energy
4 secs – 5 mins
Synchronized, spinning Reserve
10 mins – 105 mins
Non-synchronized, non-spinning Reserve
10 mins – 105 mins
Supplemental Operating
the under- frequency event.
CAISO42
Regulation up and down are separate AS products. A regulation procurement forecasting tool calculates the 10-minute peak regulation up/down for each hour of the day.
Spinning Reserves provided only from generating units;43 (see notes below regarding WECC limitation) system resources that submit bids to provide spinning reserves from imports, or system units certified and tested.
Spinning reserves is a minimum of 50% of the operating reserve (OR) requirement.
Following WECC (Western Electric Coordinating Council), the AS operating reserve requirement is the
Non-spinning Reserves may be provided from curtailable demand, on-demand rights from other entities, or Balancing Authority (BA) areas, plus the same categories as identified under Spinning Reserve.
42 Scarcity pricing mechanism is in place. 43 The current WECC contingency reserve requirement represents a holistic approach to carrying contingency reserves for the entire western interconnection. The
load responsibility calculation is used to “transfer” contingency reserve responsibility between BAs. Energy with associated contingency reserve can be exported and imported between balancing authority areas. However, if contingency reserve is associated by agreement with the energy transaction, the responsibility for the contingency reserve obligation will remain with the source BA. In other words, the BA exporting energy that has associated contingency reserve would increase its “load responsibility” by the amount of the energy being exported. The BA importing the energy has the ability to reduce its “load responsibility” by the same amount. This has the effect of maintaining the appropriate amount of contingency reserve on a western interconnection-wide basis.

52
ISO Regulation
4 secs – 5 mins
Balancing Energy
4 secs – 5 mins
Synchronized, spinning Reserve
10 mins – 105 mins
Non-synchronized, non-spinning Reserve
10 mins – 105 mins
Supplemental Operating
greater of :
Most severe single contingency
Sum of 5% of load responsibility served by hydro + 7% of remaining load responsibility
Additional reserves are procured to cover interruptible imports and on-demand obligations minus firm exports.
NYISO
Regulation includes balancing resources and load as well as frequency response services.
Regulation is adjusted for regulation demand curves to ensure that the price paid is no greater than that indicated by the demand curve.
Regulation service is provided by qualified market participants who voluntarily submit bids to provide the service.
Payments to providers of regulation service are based on actual
The NYISO is responsible for providing energy imbalance service; it includes:
Internal energy imbalance under the NYISO services tariff, addressed through real-time market and settlement;
Internal energy imbalance taking services under the open- access transmission tariff that pays the NYISO the greater of 150%
Synchronized Operating Reserve. Suppliers of generation and demand side bidders may submit availability bids.
Demand side bids may also be submitted if their supply conditions meet the reserve category requirements.
At least one-half of the 10-minute contingency reserve must be from spinning reserves.
The 10-minute operating reserve requirement shall be greater than or equal to the largest single
Non-synchronized Ten-Minute Operating Reserve: The remainder of the 10- minute contingency reserve may be composed of non- synchronized resource capacity.
Demand side bids may also be submitted if their supply conditions meet the reserve category requirements.
The 10- minute contingency reserve requirement is the greater of the capacity losses caused by the most severe
30-minute spinning reserves are provided by synchronized generators and qualified demand side resources within the NY control area.
30-minute non-spinning reserves are provided by generators and demand side resources where the demand response is provided by a local generator.

53
ISO Regulation
4 secs – 5 mins
Balancing Energy
4 secs – 5 mins
Synchronized, spinning Reserve
10 mins – 105 mins
Non-synchronized, non-spinning Reserve
10 mins – 105 mins
Supplemental Operating
performance in response to signals from the ISO.
Energy, Regulation, and Operating Reserves are co-optimized in a real-time commitment process that minimizes costs.
of the LMP at the delivery point or $100/MWh;
External energy imbalance--the difference between scheduled and actual flows between the NY control area and other control areas. It is implemented under NERC inadvertent energy guidelines.
contingency
Demand side resources can bid synchronous or non-synchronous services, but not both.
contingency, or the largest energy loss caused by the cancellation of an interruptible energy purchase from another system.
Demand side resources can bid synchronous or non-synchronous services, but not both.
MISO
Regulation resources must be pre-qualified and can be
Committed internal market generation
External pseudo-tied market generation;
Committed “behind the meter” generators or controllable loads that respond to MISO instructions
Available external asynchronous resources
External asynchronous resources may offer
On-line generation and qualified responsive load resources are able to be loaded within the DCS recovery period.
A BA must carry 40% of their contingency reserve requirement as “Operating Reserve. Eligible spin resources are the same as for regulation with the addition of interruptible load that will respond to instructions from the MISO.
Offer price cap of $100/MWh
Supplemental reserve is contingency reserve not classified as spinning reserve.
Supplemental resources must be qualified
Offer price cap of $100/MWh

54
ISO Regulation
4 secs – 5 mins
Balancing Energy
4 secs – 5 mins
Synchronized, spinning Reserve
10 mins – 105 mins
Non-synchronized, non-spinning Reserve
10 mins – 105 mins
Supplemental Operating
energy, regulation, and contingency reserve.
Regulation resources must supply the system for a continuous duration of 60 minutes.
Offer price cap of $500/MWh
ISO-NE Regulation is acquired through a real-time, formal market from resources electrically connected to NE Control Area, responsive to AGC, and capable of meeting minimum performance standards as set out in procedures.
Regulation clearing price determined in real time market rather than in day-ahead market. Generator’s actual response to regulation signals sent by the ISO is used to determine settlement amounts (mileage payment).
Energy and AS markets are co-optimized.
The energy market has an offer cap of $1,000
Ten-Minute Spinning Reserve (TMSR) is provided with resources already synchronized and capable of achieving claimed ramp rate and capacity within 10 minutes.
Ten-Minute Non-Spinning Reserve (TMNSR) is provided using resources not currently synchronized.
Commitments for TMNSR are acquired through the Forward Reserve for delivery in real-time.
Commitments for 30-minute reserves are acquired through the Forward Reserve Market. This market is held four times yearly two months in advance of the Forward Reserve Procurement Period.
Forward reserves market is locational, allows for bilateral trading and demand response participation.

55
ISO Regulation
4 secs – 5 mins
Balancing Energy
4 secs – 5 mins
Synchronized, spinning Reserve
10 mins – 105 mins
Non-synchronized, non-spinning Reserve
10 mins – 105 mins
Supplemental Operating
per MWh.
WECC WECC does not operate formal markets outside of those operated by the CAISO.
Must meet NERC Control Performance Criteria.
WECC is focused on interpretation of reliability criteria, not energy market products.
Contingency Reserve is spin and non-spin reserve sufficient to meet the NERC Disturbance Control Standard (DCS) and is the greater of :
The loss of generating capacity resulting from the most severe single contingency, or
The sum of 5% of the load responsibility served by hydro generation and 7% of the load responsibility served by thermal.
A BA may carry Spinning Reserve equivalent to 50% of its Contingency Reserve obligation.
Non-FRR contingency reserve does not have to be synchronized to the grid.
For generation-based reserves, an off-line resource must be able to be synchronized to the grid and generate up to its awarded non-spinning reserve capacity within 10 minutes.
Acceptable types of non-spinning reserve (non-FRR contingency reserve) :
Load which can be interrupted within 10 minutes of notification
Interruptible exports
On-demand rights from other BAs
Spinning reserve in

56
ISO Regulation
4 secs – 5 mins
Balancing Energy
4 secs – 5 mins
Synchronized, spinning Reserve
10 mins – 105 mins
Non-synchronized, non-spinning Reserve
10 mins – 105 mins
Supplemental Operating
excess of requirement
Off-line generation that qualifies as non-spinning reserve
SERC Standard NERC rules apply
Standard NERC rules apply
Standard NERC rules apply
Standard NERC rules apply
Standard NERC rules apply
SPP AS markets not in place yet are in the planning stages.
Regulating Reserve will be separated into two products.
An Energy Imbalance Market was launched in 2007. Market participants may purchase the service from the transmission provider or can make bilateral arrangements.
Spinning reserve allocated to any generating unit shall not exceed the amount of capacity increase that will be realized by prime-mover governor action due to a drop in frequency to 59.5 Hertz (less than or equal to 16.7% of unit capability at a 5% droop setting). At least half of the contingency reserve shall be spinning reserve.
Responsive load cannot provide spinning reserve.
Non-spin/Supplemental Reserves are called Ready Reserves in Southwest Power Pool (SPP). Ready reserve is that amount of operating capacity or the equivalent, some or all of which, may not be connected to the interconnected network but which can be connected and fully applied to meet the NERC requirements.
IESO
Regulation Service is obtained from generators on the basis of an RFP (request for proposal) and contracting process that requires meeting pre-qualification
The IESO administers markets for 10-minute spinning reserve
Ten minutes operating reserve is based on the largest single
The IESO administers markets for 10-minute non-spinning reserves.
The IESO administers markets for 30-minute supplemental reserve
In addition, the IESO procures 30-minute

57
ISO Regulation
4 secs – 5 mins
Balancing Energy
4 secs – 5 mins
Synchronized, spinning Reserve
10 mins – 105 mins
Non-synchronized, non-spinning Reserve
10 mins – 105 mins
Supplemental Operating
standards and specifications.
Terms and conditions of the contract include:
A minimum overall ramp rate requirement for Ontario is 50 MW/minute.
Payments comprise fixed and variable cost components.
Settlement basis is the lesser of the amount of regulation service scheduled or the amount delivered.
contingency with 25% Supplied by spinning reserves.
10-minute contingency reserve is the equivalent of the largest first contingency loss that could occur under a given IESO-controlled grid configuration.
IESO is also part of a shared activation of reserve group with PJM, NYISO, NBSO (New Brunswick System Operator), and ISO-NE (Independent System Operator-New England).
reserves based on half of the largest second contingency that could occur under a given IESO-controlled grid operating configuration.
FRCC Standard NERC rules apply
Standard NERC rules apply
Standard NERC rules apply
Notes
WECC - The current WECC contingency reserve requirement represents a holistic approach to carrying contingency reserves for the entire western interconnection. The load responsibility calculation is used to “transfer” contingency reserve responsibility between BAs. Energy with associated contingency reserve can be exported and imported between balancing authority areas. However, if contingency reserve is associated by agreement with the energy transaction, the responsibility for the contingency reserve obligation will remain with the source BA. In other words, the BA exporting energy that has associated contingency reserve would increase its “load responsibility” by the amount of the energy being exported. The BA importing the energy has the ability to reduce its “load responsibility” by the same amount. This has the effect of maintaining the appropriate amount of contingency reserve on a western interconnection-wide basis.

58
Appendix C: Ancillary Services Utilization of Bureau of Land Management Hydro-electric Facilities
Hydro Facility State Spin Non-Spin Replacement Reg/Load Following
Black Start
Voltage Support
Alcova WY Yes Yes Yes Yes No Yes Anderson Ranch ID Yes Yes Yes Yes Yes Yes Big Thompson CO No No No No No No Black Canyone ID Yes Yes Yes Yes Yes Yes Blue Mesa CO Yes Yes Yes Yes No Yes Boise Mesa ID No No No No No No Boysen WY No No No No No Yes Buffalo Bill WY No No No No No Yes Canyon Ferry MT Yes Yes Yes No Yes Yes Chandler WA No No No No No Yes Crystal CO Yes Yes Yes Yes Yes Yes Davis AZ Yes Yes Yes Yes Yes Yes Deer Creek UT No No No No Yes Yes Elephant Butte NM No No No No Yes Yes Estes CO Yes Yes No Yes Yes Yes Flaming Gorge UT Yes Yes Yes Yes Yes Yes Flatiron CO Yes Yes Yes Yes Yes Yes Folsom CA Yes Yes Yes Yes Yes Yes Fonteneel WY Yes Yes Yes Yes Yes Yes Fremont Canyon WY Yes Yes Yes Yes No Yes Glen Canyone AZ Yes Yes Yes Yes Yes Yes Glendo WY No No Yes No No Yes Grand Coulee WA Yes Yes Yes Yes Yes Yes Green Mountain CO No No No No Yes Yes Green Springs OR No No No No No Yes Guernsey WY No No No No No Yes Heart Mountain WY No No No No No Yes Hoover AZ Yes Yes Yes Yes Yes Yes Hungry Horse MT Yes Yes Yes Yes Yes Yes Judge Francis Carr CA Yes Yes Yes Yes No Yes

59
Keswick CA No No No No Yes Yes Kortes WY Yes Yes Yes Yes Yes Yes Lewiston CA No No No No Yes No Lower Molina CO No No No No Yes Yes Marys Lake CO No No No No Yes Yes McPhee CO No No No No Yes Yes Minidoka ID No No No No Yes Yes Morrow Point CO Yes Yes Yes Yes Yes Yes Mount Elbert CO Yes Yes Yes Yes Yes Yes New Melones CA Yes Yes Yes Yes Yes Yes Nimubs CA No No No No No Yes O'Neil CA No No No No No No Palisades ID Yes Yes Yes Yes Yes Yes Parker AZ Yes Yes Yes No No Yes Pilot Butte WY No No No No No No Pole Hill CO No No No No Yes Yes Roza WA No No No No No Yes San Luis CA No No No No No No Seminoe WY Yes Yes Yes Yes No Yes Shasta CA Yes Yes Yes Yes Yes Yes Shoshone WY No No No No No No Spirit Mount WY No No No No No No Spring Creek CA Yes Yes Yes Yes No Yes Stampede CA No No No No No Yes Towaoc CO No No No No Yes Yes Trinity CA Yes Yes Yes Yes No Yes Upper Molina CO No No No No Yes Yes Yellowtail MT Yes Yes Yes Yes Yes Yes

60
Distribution John Barnes Exelon Generation 300 Exelon Way Kennett Square, PA 19348
Hoyt Battey Office of Wind and Water Power Technologies EE-2B Forrestal Building U.S. Department of Energy 1000 Independence Ave. SW Washington, DC 20585
Jacques Beaudry-Losique Office of Wind and Water Power Technologies EE-2B Forrestal Building U.S. Department of Energy 1000 Independence Ave. SW Washington, DC 20585
Gregory Brinkman National Renewable Energy Laboratory 1617 Cole Blvd. Golden, CO 80401
Daniel Brooks Electric Power Research Institute 942 Corridor Park Blvd. Knoxville, TN 37932
Curt Brown Denver Federal Center 6th & Kipling Bldg. 67 Denver, CO 80225
Stephen Brown HDR-DTA 20 Cody Lane Fairmont, WV 26554
Tom Butler Tennessee Valley Authority 1101 Market Street, SP 5D Chattanooga, TN 37402
Peter Calic Manitoba Hydro 360 Portage Avenue Winnipeg, MB, R3C 0G8 Canada
Gregory Carrington Chelan County PUD PO Box 1231 Wanatchee, WA 98807
Pushkar Chhajed LCG Consulting 4962 El Camino Real Suite 112 Los Altos, CA 94022
Charlie Clark Charlie Clark Group 163 Park Avenue Palo Alto, CA 94306
Scott Cotner US Army Corps of Engineers PO Box 2946 Portland OR 97208
Rajat Deb LCG Consulting 4962 El Camino Real Suite 112 Los Altos, CA 94022

61
Sidart Deb LCG Consulting Suite 112 4962 El Camino Real Los Altos, CA 94022
Alberto Del Rosso Electric Power Research Institute 942 Corridor Park Blvd. Knoxville, TN 37932
Doug Dixon Electric Power Research Institute 942 Corridor Park Blvd. Knoxville, TN 37932
Abraham Ellis Sandia National Laboratories P.O. Box 5800 MS 1033 Albuquerque, NM 87185
Dick Fisher Voith Hydro 754 Ensminger Drive Jacobus, PA 17407
Scott Flake Sacramento Municipal Utility District 6301 S Street Sacramento, CA 95817
Karen Ryan Forsten Electric Power Research Institute 942 Corridor Park Blvd. Knoxville, TN 37932
Kevin Frank Voith Hydro PO Box 712 York, PA 17405
Brian French Brookfield 200 Donald Lynch Blvd Suite 300 Marlborough, MA 01752
William Fru Brookfield 480 Blvd de la Cité Gatineau, Quebec J8T 8R3
Qingqei Fu Brookfield 200 Donald Lynch Blvd Suite 300 Marlborough, MA 01752
Ken Gaddis Tennessee Valley Authority 1101 Market Street, SP 5D Chattanooga, TN 37402
John Gasper Argonne National Laboratory 955 L’Enfant Plaza SW Suite 6000 Washington, DC 20024
Carol Goolsby Duke Energy PO Box 1006 MS EC11-J Charlotte, NC 28201
Ron Grady HDR-DTA 400 S. Tryon Street Suite 2401 Charlotte, NC 28285
Andrew Grassell Chelan County PUD PO Box 1231 Wanatchee, WA 98807

62
Tom Guardino Cascade Consulting Partners 240 E. 15th Street Eugene, OR 97401
Boualem Hadjerioua Water Resource Group Oak Ridge National Laboratory Oak Ridge, TN 37831-6036
Michael Hahn U.S. Department of Energy Golden Field Office 1617 Cole Blvd. Golden, CO 80401
Dave Hartman U.S. Bureau of Reclamation 6th & Kipling Bldg. 67 Denver, CO 80225
Sam Holman Duke Energy PO Box 1006 MS EC11-J Charlotte, NC 28201
Leilong Hsue LCG Consulting 4962 El Camino Real Suite 112 Los Altos, CA 94022
Kirk Hudson Chelan County PUD PO Box 1231 Wanatchee, WA 98807
Paul Jacobson Electric Power Research Institute 14820 View Way Court Glenleg, MD 21737
Srinivas Jampani LCG Consulting 4962 El Camino Real Suite 112 Los Altos, CA 94022
Mark Jones Bonneville Power Administration PGF-6 PO Box 3621 Portland, OR 97208
Rick Jones HDR-DTA 2379 Gateway Oaks Drive Suite 200 Sacramento, CA 95833
Roberta Kankus Exelon Generation Suite 340 300 Exelon Way Kennett Square, PA 19348
Benjamin Karlson Sandia National Laboratories P.O. Box 5800 MS 1124 Albuquerque, NM 87185
Thomas Key Electric Power Research Institute 942 Corridor Park Blvd. Knoxville, TN 37932
Brendan Kirby B. Kirby Consulting 2307 Laurel Lake Road Knoxville, TN 37932
Jiri Koutnik Voith Hydro Holding GmbH & Co. KG Alexanderstr. 11 89522 Heidenheim, Germany

63
Coby Leber Voith Hydro PO Box 712 York, PA 17405
Greg Lewis Duke Energy Mail Stop EC 11B PO Box 1006 Charlotte, NC 28201-1006
Jenny Lui New York Power Authority 123 Main Street White Plains, NY 10601
Peter Ludwig New York Power Authority 123 Main Street White Plains, NY 10601
Patrick March Hydro Performance Processes Inc. 3205 Knobdale Road Nashville, TN 37214
Andrew Martinez National Renewable Energy Laboratory 1617 Cole Blvd. Golden, CO 80401-3305
Kerry McCalman U.S. Bureau of Reclamation 6th & Kipling Bldg. 67 Denver, CO 80225
Rick Miller HDR-DTA 400 S. Tryon Street Suite 2401 Charlotte, NC 28285
Alejandro Moreno Office of Wind and Water Power Technologies EE-2B Forrestal Building U.S. Department of Energy 1000 Independence Ave. SW Washington, DC 20585
Rich Mueller New York Power Authority PO Box 191 Marcy, NY 13403
Tom Murphy Bonneville Power Administration 3206 NE 42nd Avenue Portland, OR 97213
Chris Namovicz U.S. Department of Energy Electric Information Agency 1000 Independence Ave., SW Washington, DC 20585
Patrick O’Connor BCS Incorporated 8920 Stephen Road Suite 200 Laurel, MD 20723
Samantha Quinn Office of Wind and Water Power Technologies EE-2B Forrestal Building U.S. Department of Energy 1000 Independence Ave. SW Washington, DC 20585
Tim Ramsey U.S. Department of Energy Golden Field Office 1617 Cole Blvd. Golden, CO 80401
Dan Rastler U.S. Department of Energy Golden Field Office 1617 Cole Blvd. Golden, CO 80401
64
Michael Reed Office of Wind and Water Power Technologies EE-2B Forrestal Building U.S. Department of Energy 1000 Independence Ave. SW Washington, DC 20585
Lindsey Rogers Electric Power Research Institute 942 Corridor Park Blvd. Knoxville, TN 37932
David Sabo U.S. Bureau of Reclamation 6th & Kipling Bldg. 67 Denver, CO 80225
Kamau Sadiki U. S. Army Corps of Engineers HQ 441 G Street NW Washington, DC 20314
Michael Sale M.J. Sale & Associates 704 Potter Falls Road Wartburg, TN 37887
Ed Schild Puget Sound Energy MS PS-095 PO Box 97034 Bellevue, WA 98009-9734
Arthur Seki HECO PO Box 2750 CPP21-NR Honolulu, HI 96840
Walter Short National Renewable Energy Laboratory 1617 Cole Blvd. Golden, CO 80401-3305
Brennan Smith Water Resource Group Oak Ridge National Laboratory Oak Ridge, TN 37831-6036
Richard Smith AmerenUE 1901 Chouteau Ave. St Louis, MO 63103
Alan Soneda Pacific Gas and Electric Company PO Box 770000 Mail Code N11E San Francisco, CA 94177
Michael Starke Oak Ridge National Laboratory PO Box 2008 MS6070 Oak Ridge, TN 37831-6070
Dave Stewart Exelon Generation 300 Exelon Way Kennett Square, PA 19348
Alvin Thoma Pacific Gas and Electric Company PO Box 770000 Mail Code N11E San Francisco, CA 94177
Phillip Thompson AmerenUE Osage Power Plant 617 River Road Lake Ozark, MO 65049
Lew Thurber Bonneville Power Administration PO Box 3621 Portland, OR 97208

65
Wayne Todd Bonneville Power Administration PO Box 3621 Portland, OR 97208
Aidan Tuohy Electric Power Research Institute 942 Corridor Park Blvd. Knoxville, TN 37932
Tom Veselka Argonne National Laboratory 9700 S. Cass Avenue Argonne, IL 60439
Daryl Williams Tennessee Valley Authority 1010 Reservation Road CTR 2RM Muscle Shoals, AL 3566
Joseph Williams Sandia National Laboratories P.O. Box 5800 MS 1124 Albuquerque, NM 87185
Sean Wright Electric Power Research Institute 9958 West 87th Avenue Arvada, CO 80005
Jiankang Zhu New York Power Authority MS WPO 6-E 123 Main Street White Plains, NY 10601
Technical Library, 9536 (Electronic)
MS 1124 Wind Library, 6333 (5)
