quantitative analysis. quantitative / formal methods objective measurement systems graphical methods...
TRANSCRIPT
QuantitativeAnalysis
Quantitative / Formal Methods
• objective measurement systems
• graphical methods
• statistical procedures
why bother?• description
– esp. of populations– ex: average height of people in room
• inference– describe populations on the basis of samples– test hypothesis about populations – estimate levels of uncertainty associated with
inferential description
• exploratory analysis– pattern searching/recognition
– “data mining”
• evaluate strength of patterning…
“Patterning”
• patterning = departures from randomness
• strength of patterning = ?
degree of departure from randomness…
• “how likely is it that observed patterning could have occurred by chance??”
• this is a statistical question…
• “is the patterning strong enough to either require or support an explanatory argument??”
• this is usually an anthropological question…
basic vocabulary
• case• variable• data matrix• attribute
• aggregation• stratification• accuracy• precision
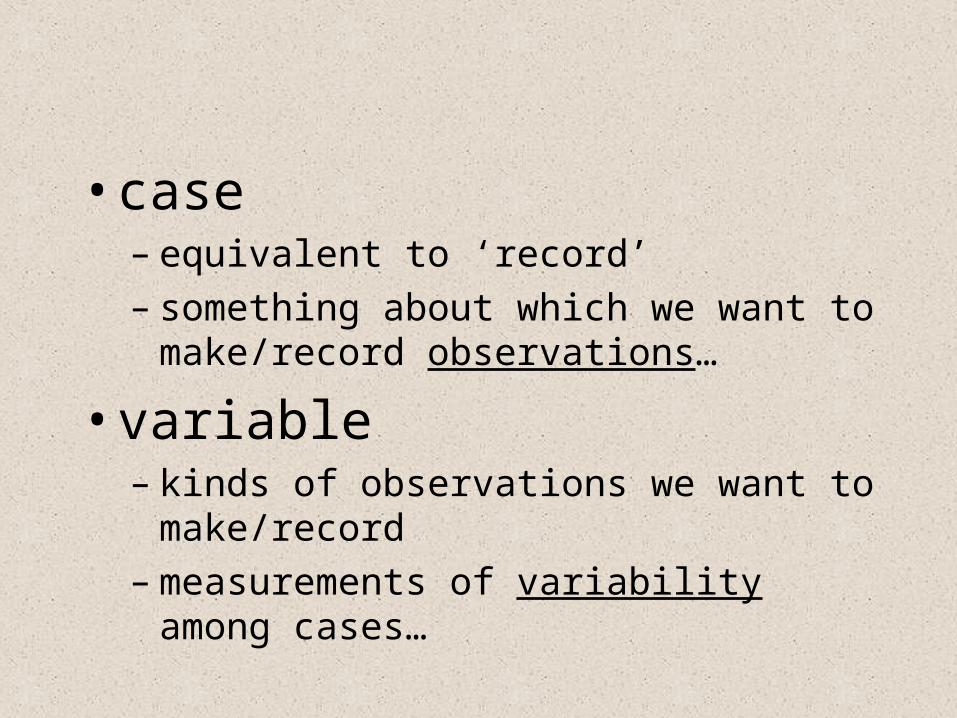
• case– equivalent to ‘record’– something about which we want to make/record
observations…
• variable– kinds of observations we want to make/record– measurements of variability among cases…
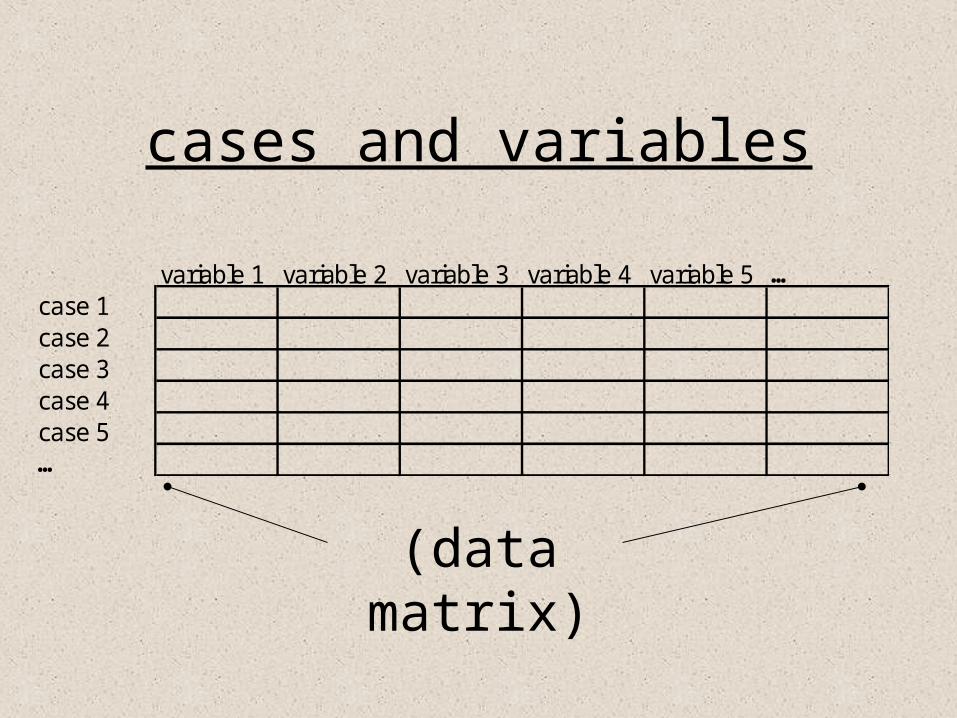
cases and variables
variable 1 variable 2 variable 3 variable 4 variable 5 …case 1case 2case 3case 4case 5…
(data matrix)

• attribute– the intersection between cases and variables– i.e., an observation about a specific case with
reference to a specific variable– ex.
• “elk”
• “strongly agree”
• “plain-ware”
– also called ‘value’, or ‘variable state’
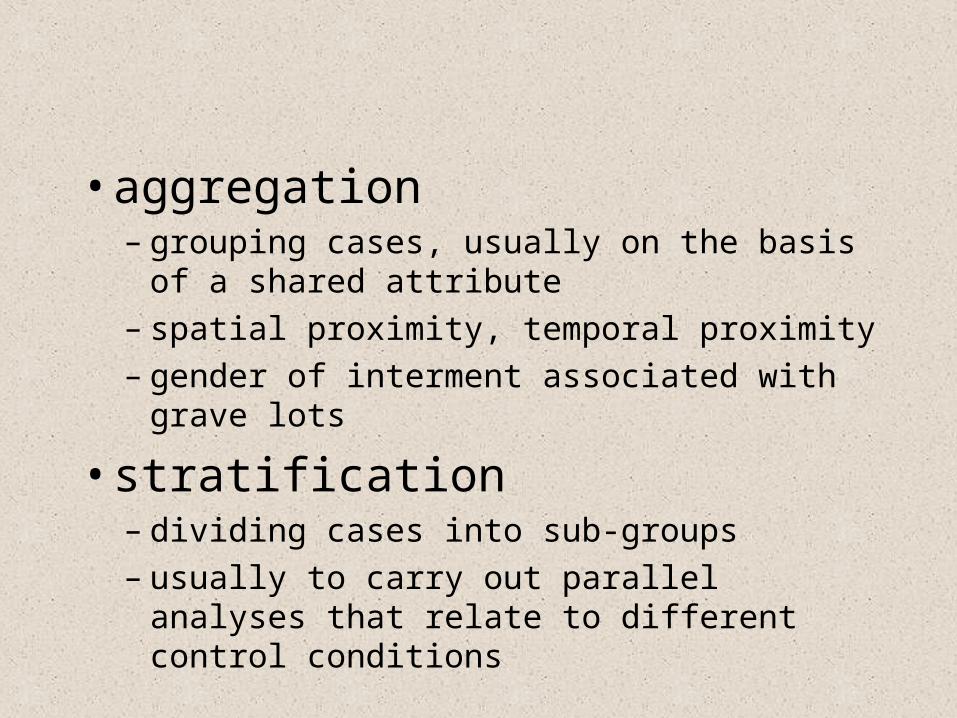
• aggregation– grouping cases, usually on the basis of a shared
attribute– spatial proximity, temporal proximity– gender of interment associated with grave lots
• stratification– dividing cases into sub-groups– usually to carry out parallel analyses that relate
to different control conditions
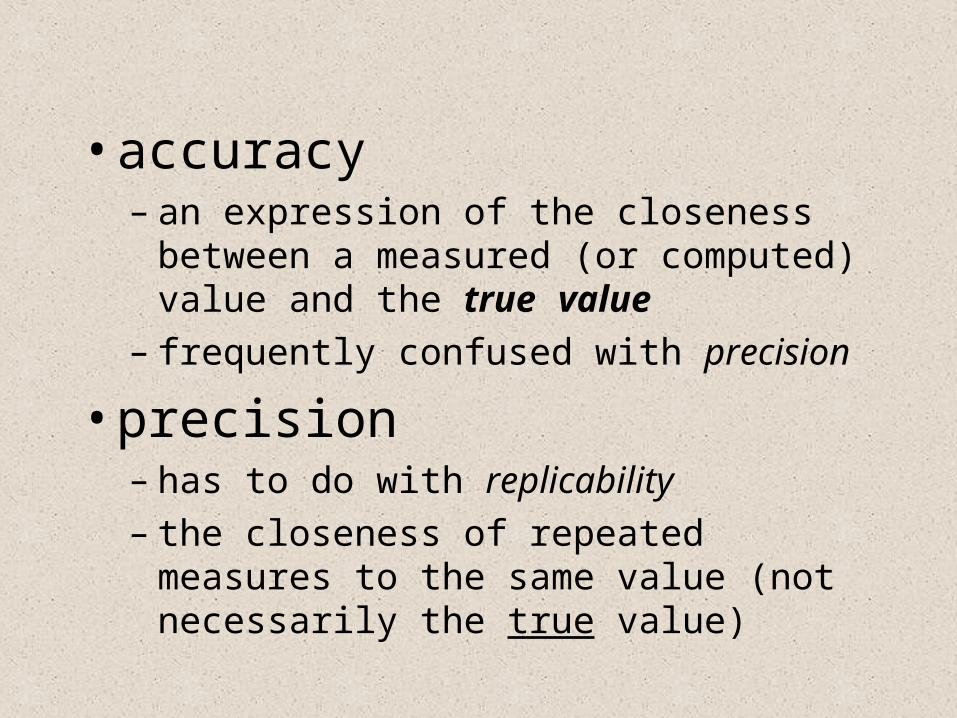
• accuracy– an expression of the closeness between a
measured (or computed) value and the true value
– frequently confused with precision
• precision– has to do with replicability– the closeness of repeated measures to the same
value (not necessarily the true value)
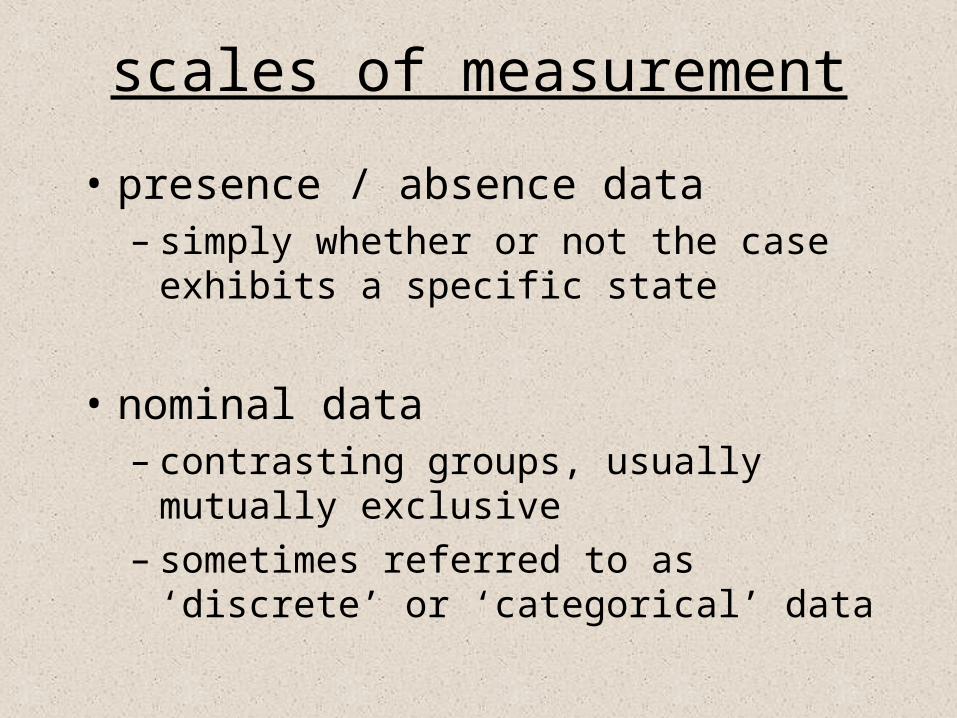
scales of measurement
• presence / absence data– simply whether or not the case exhibits a
specific state
• nominal data– contrasting groups, usually mutually exclusive– sometimes referred to as ‘discrete’ or
‘categorical’ data
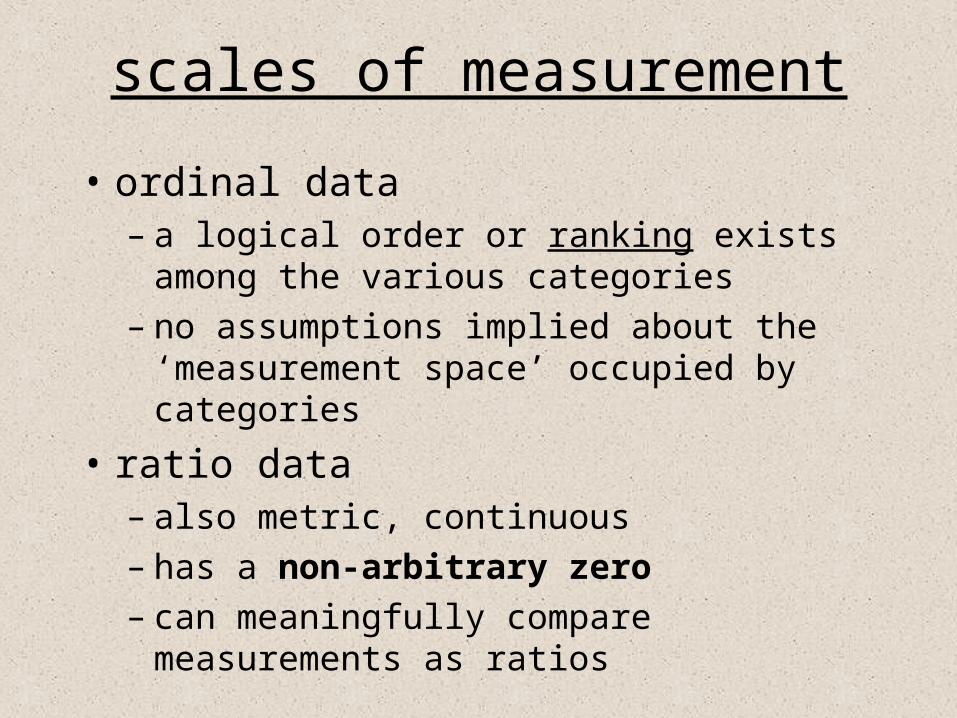
scales of measurement
• ordinal data– a logical order or ranking exists among the
various categories– no assumptions implied about the
‘measurement space’ occupied by categories
• ratio data– also metric, continuous– has a non-arbitrary zero– can meaningfully compare measurements as
ratios
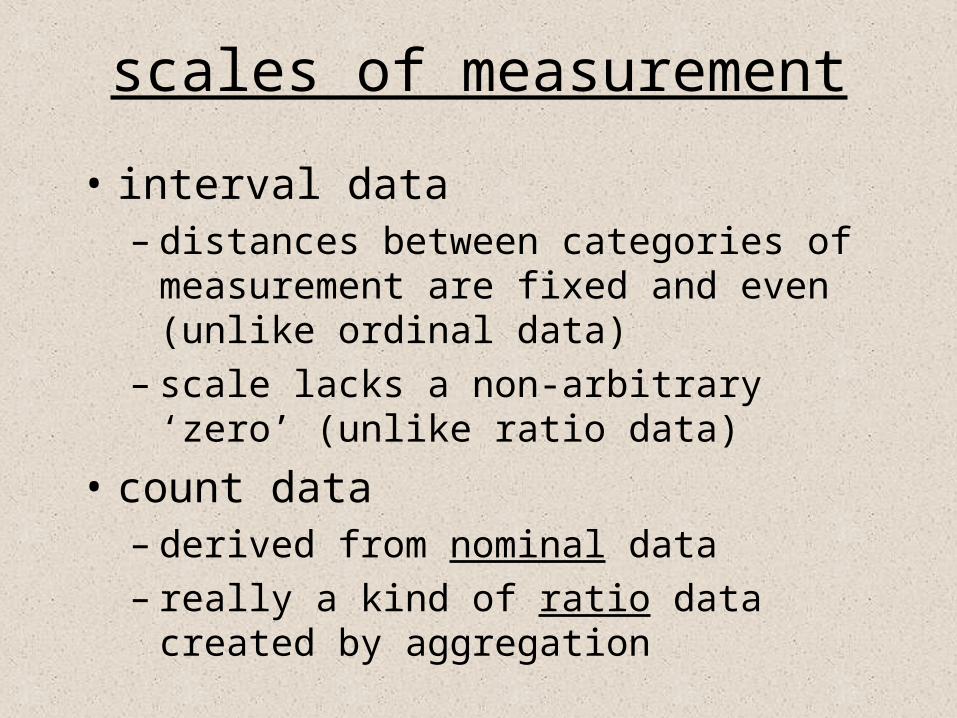
scales of measurement
• interval data– distances between categories of measurement
are fixed and even (unlike ordinal data)– scale lacks a non-arbitrary ‘zero’ (unlike ratio
data)
• count data– derived from nominal data– really a kind of ratio data created by
aggregation
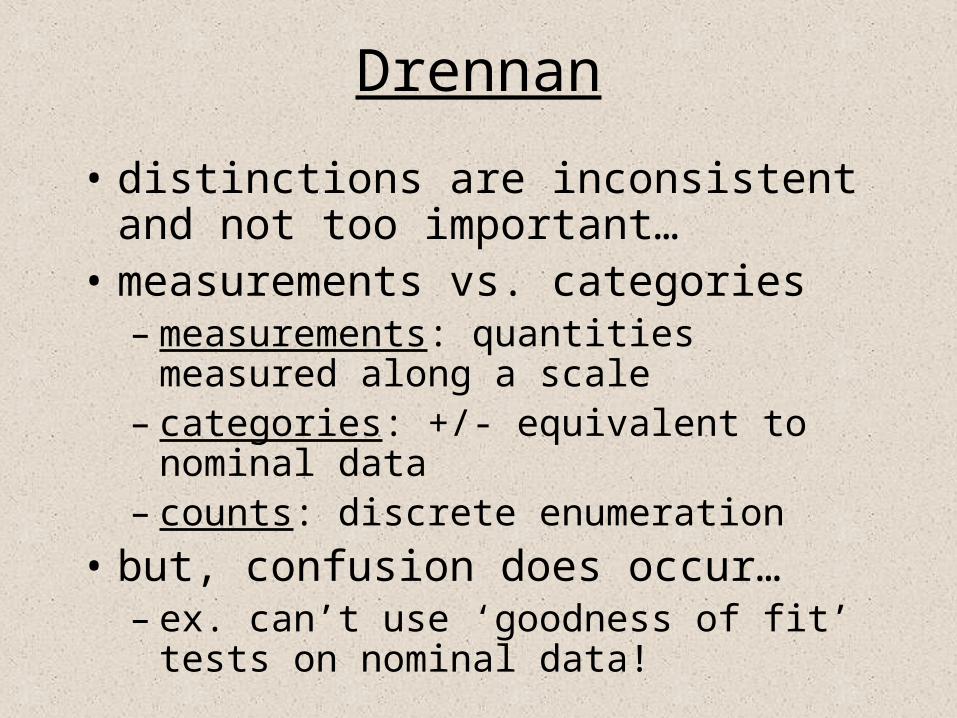
Drennan
• distinctions are inconsistent and not too important…
• measurements vs. categories– measurements: quantities measured along a
scale– categories: +/- equivalent to nominal data– counts: discrete enumeration
• but, confusion does occur…– ex. can’t use ‘goodness of fit’ tests on nominal
data!
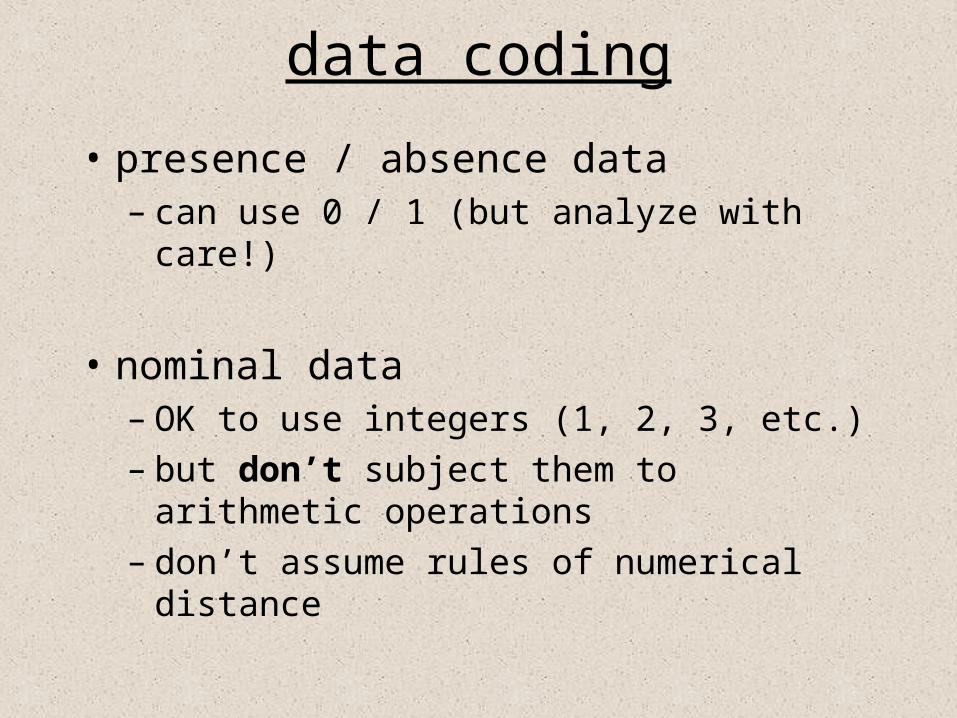
data coding
• presence / absence data– can use 0 / 1 (but analyze with care!)
• nominal data– OK to use integers (1, 2, 3, etc.)– but don’t subject them to arithmetic operations– don’t assume rules of numerical distance
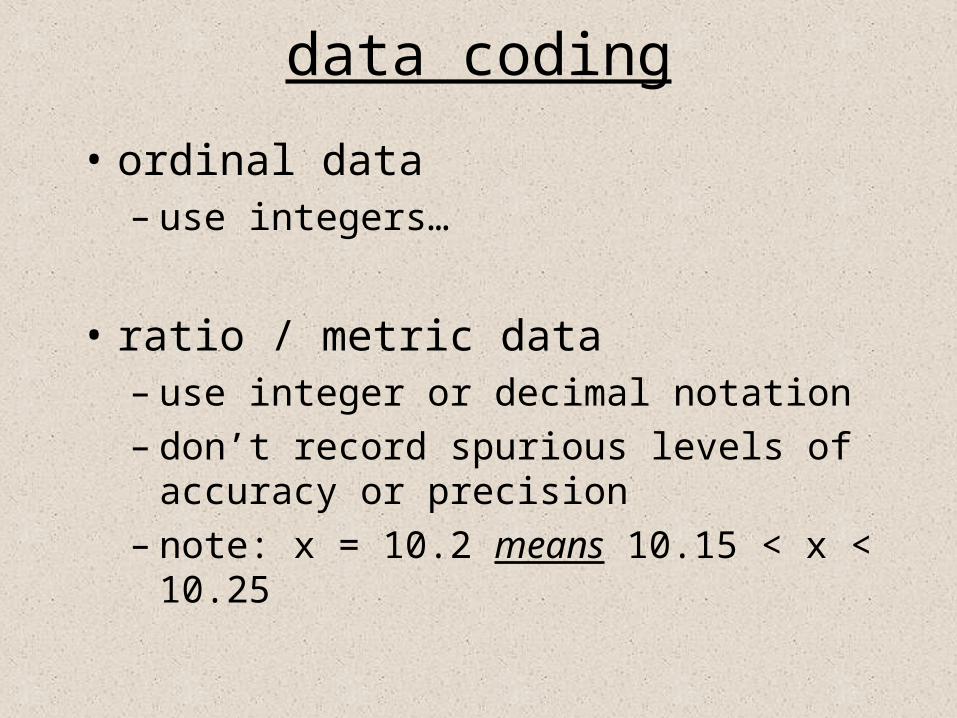
data coding
• ordinal data– use integers…
• ratio / metric data– use integer or decimal notation– don’t record spurious levels of accuracy or
precision– note: x = 10.2 means 10.15 < x < 10.25
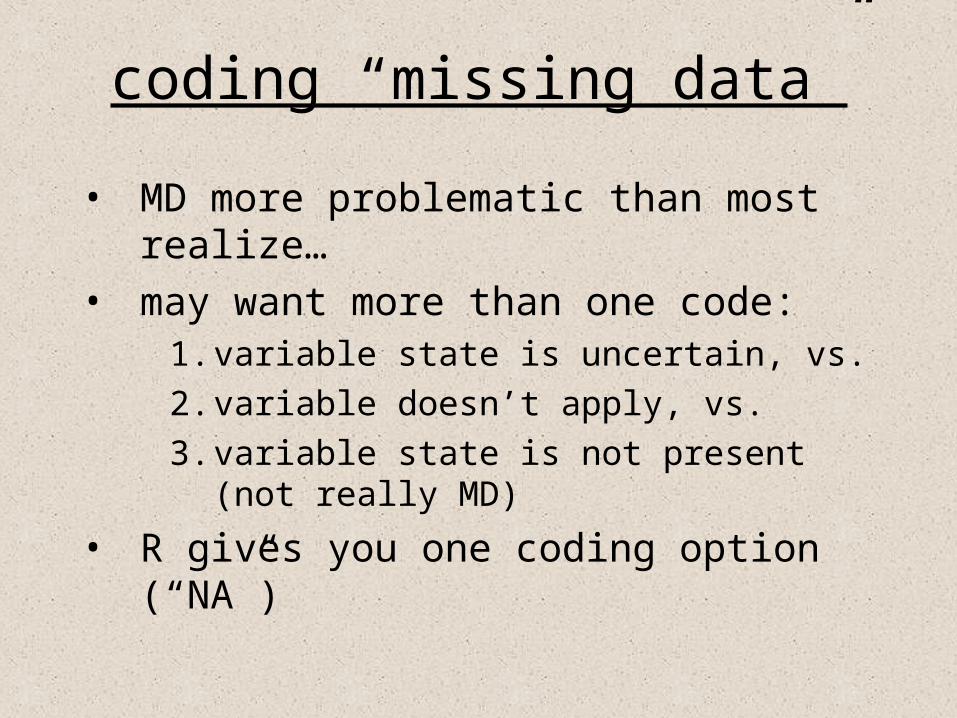
coding “missing data”
• MD more problematic than most realize…
• may want more than one code:1. variable state is uncertain, vs.
2. variable doesn’t apply, vs.
3. variable state is not present (not really MD)
• R gives you one coding option (“NA”)
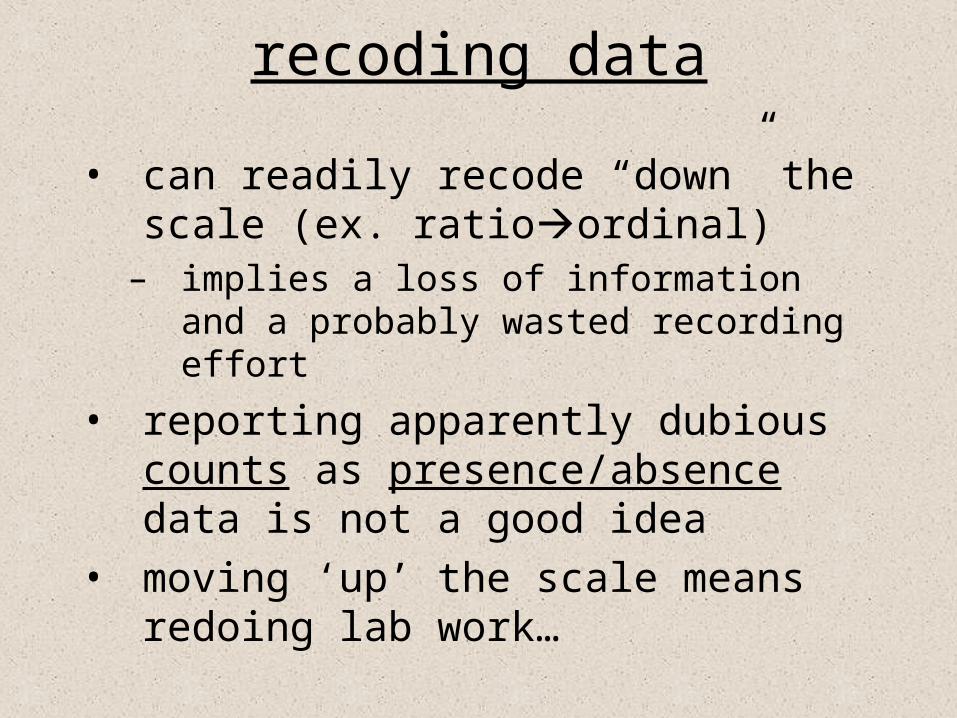
recoding data
• can readily recode “down” the scale (ex. ratioordinal)
– implies a loss of information and a probably wasted recording effort
• reporting apparently dubious counts as presence/absence data is not a good idea
• moving ‘up’ the scale means redoing lab work…
data management
• three main options for electronic storage of data:
– spreadsheet– statistics package– database
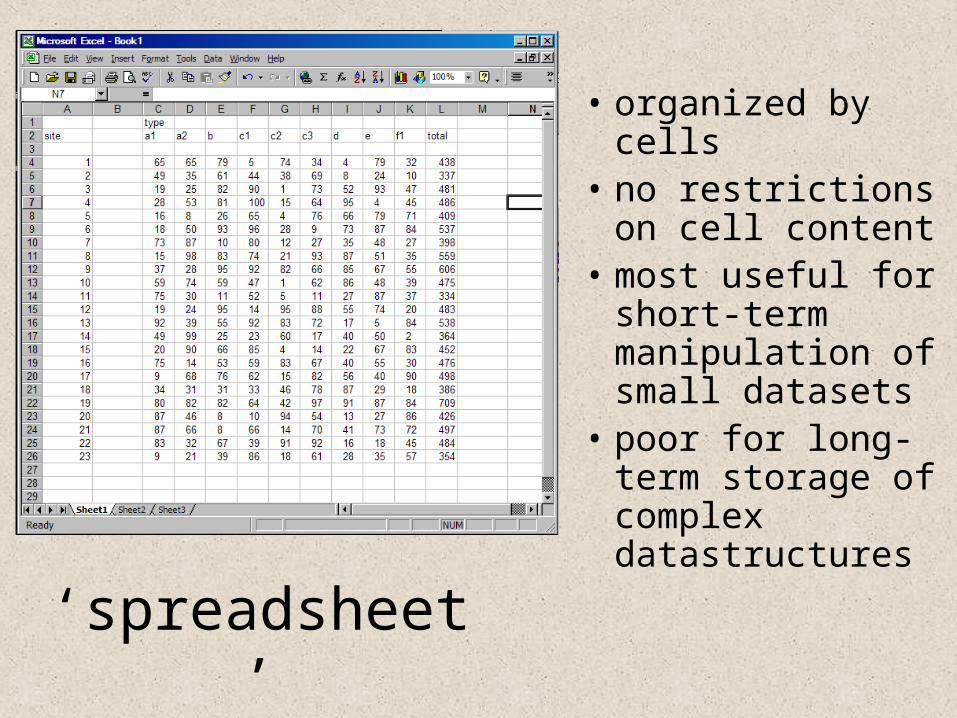
• organized by cells• no restrictions on
cell content• most useful for
short-term manipulation of small datasets
• poor for long-term storage of complex datastructures‘spreadsheet’
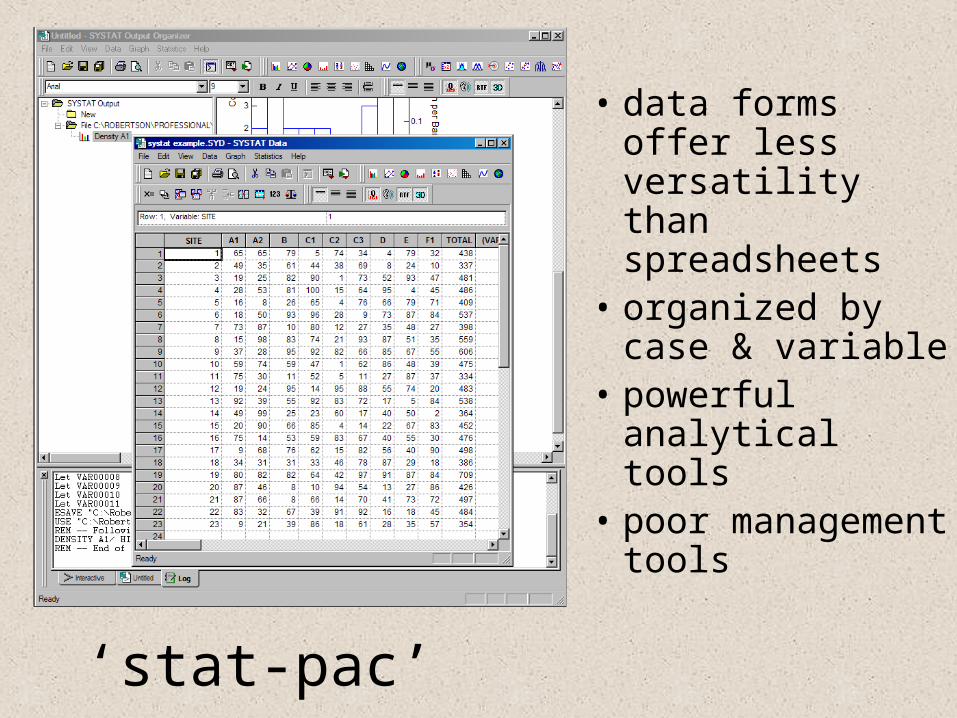
• data forms offer less versatility than spreadsheets
• organized by case & variable
• powerful analytical tools
• poor management tools
‘stat-pac’
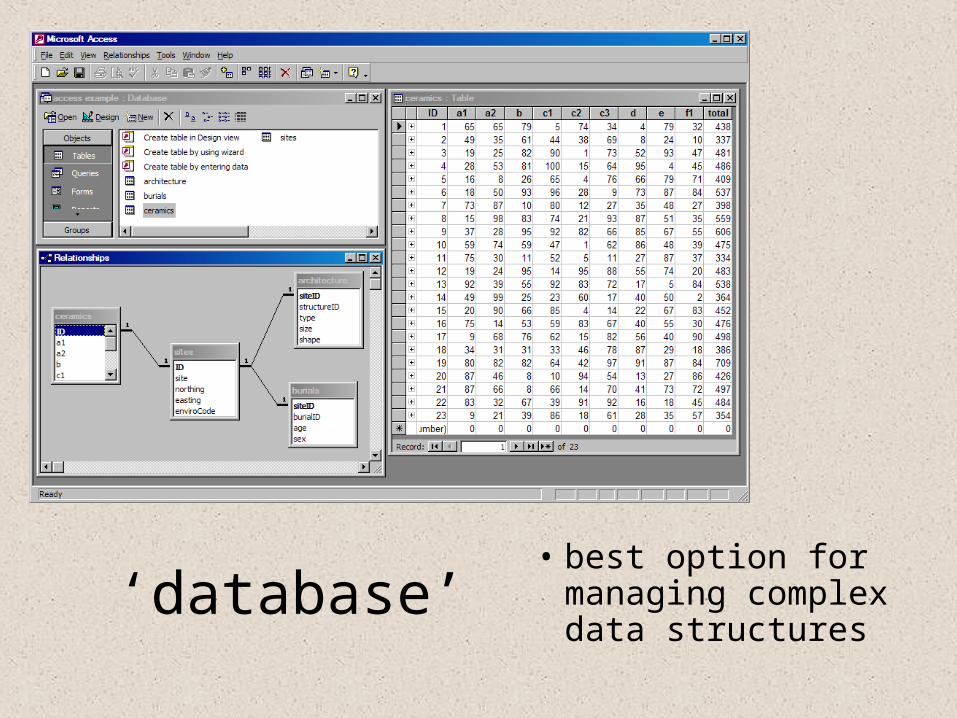
• best option for managing complex data structures
‘database’
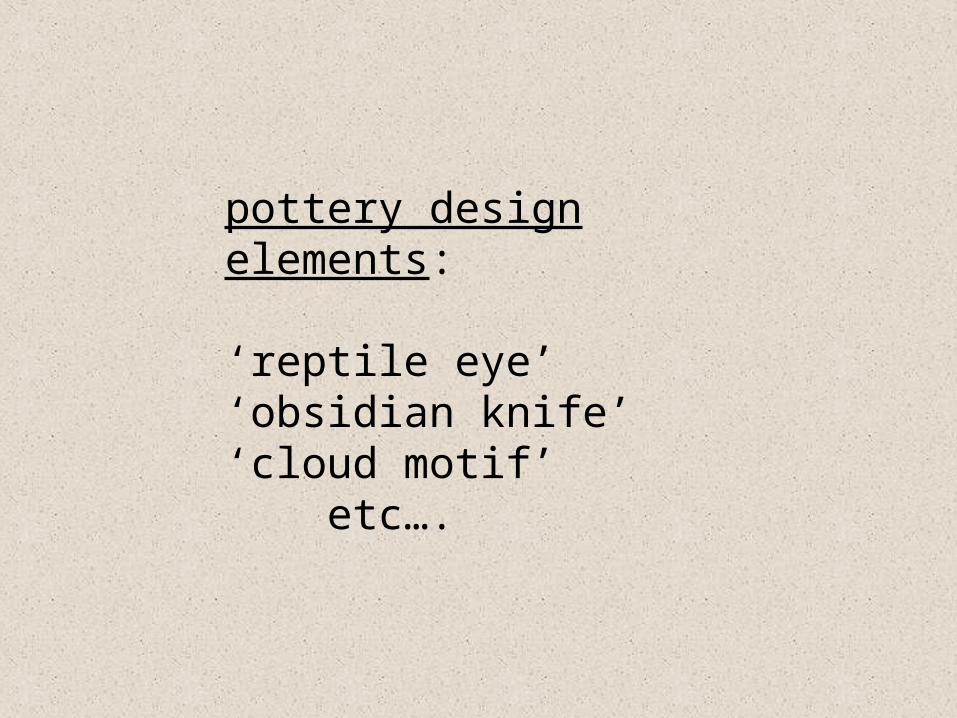
pottery design elements:
‘reptile eye’‘obsidian knife’‘cloud motif’ etc….
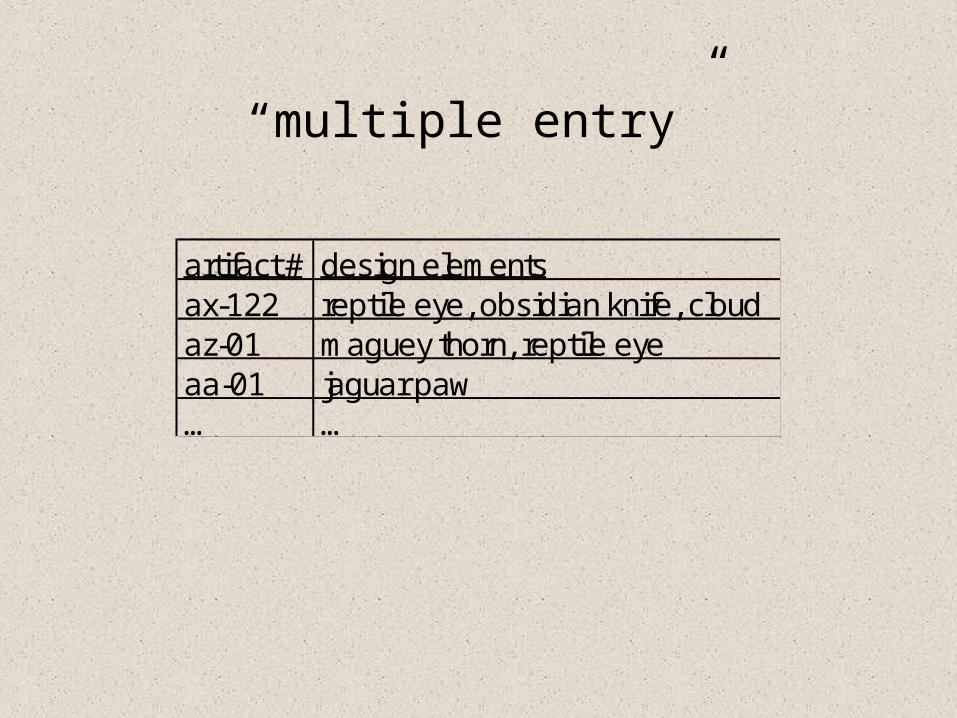
artifact # design elementsax-122 reptile eye, obsidian knife, cloudaz-01 maguey thorn, reptile eyeaa-01 jaguar paw… …
“multiple entry”
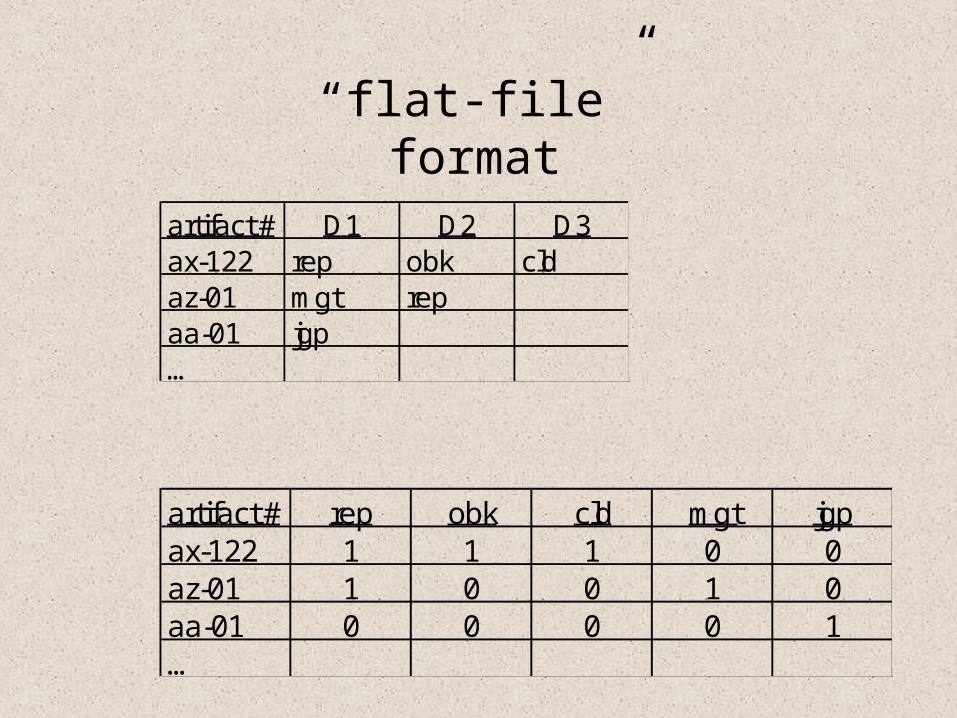
“flat-file” format
artifact # D1 D2 D3ax-122 rep obk cldaz-01 mgt repaa-01 jgp…
artifact # rep obk cld mgt jgpax-122 1 1 1 0 0az-01 1 0 0 1 0aa-01 0 0 0 0 1…
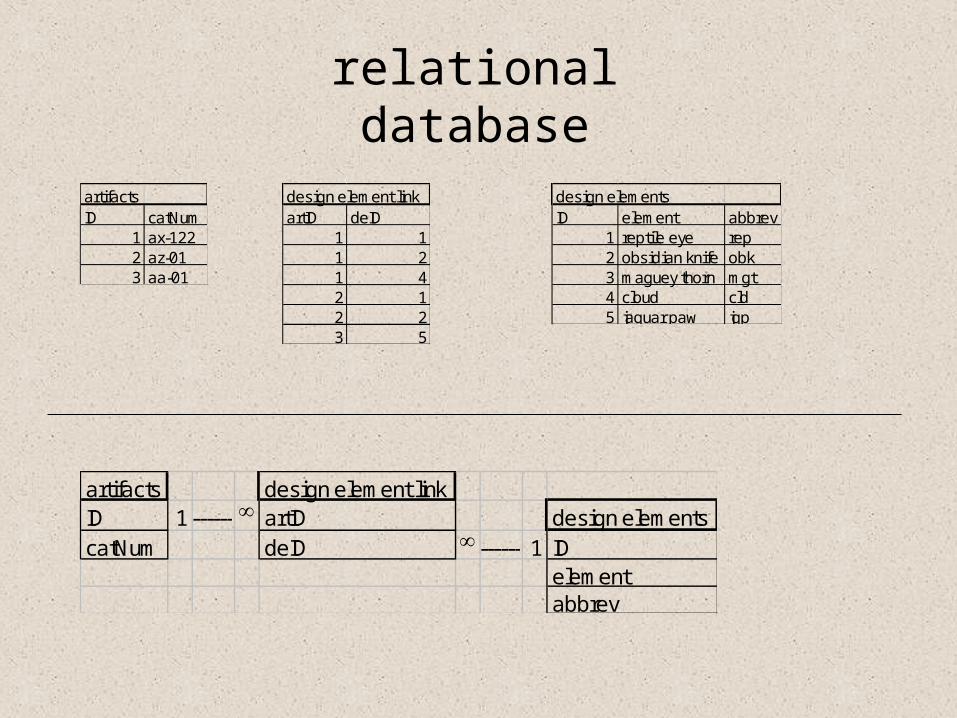
artifactsID catNum
1 ax-1222 az-013 aa-01
design element linkartID deID
1 11 21 42 12 23 5
design elementsID element abbrev
1 reptile eye rep2 obsidian knife obk3 maguey thorn mgt4 cloud cld5 jaguar paw jgp
artifacts design element linkID 1------------- artID design elementscatNum deID -------------1 ID
elementabbrev
relational database
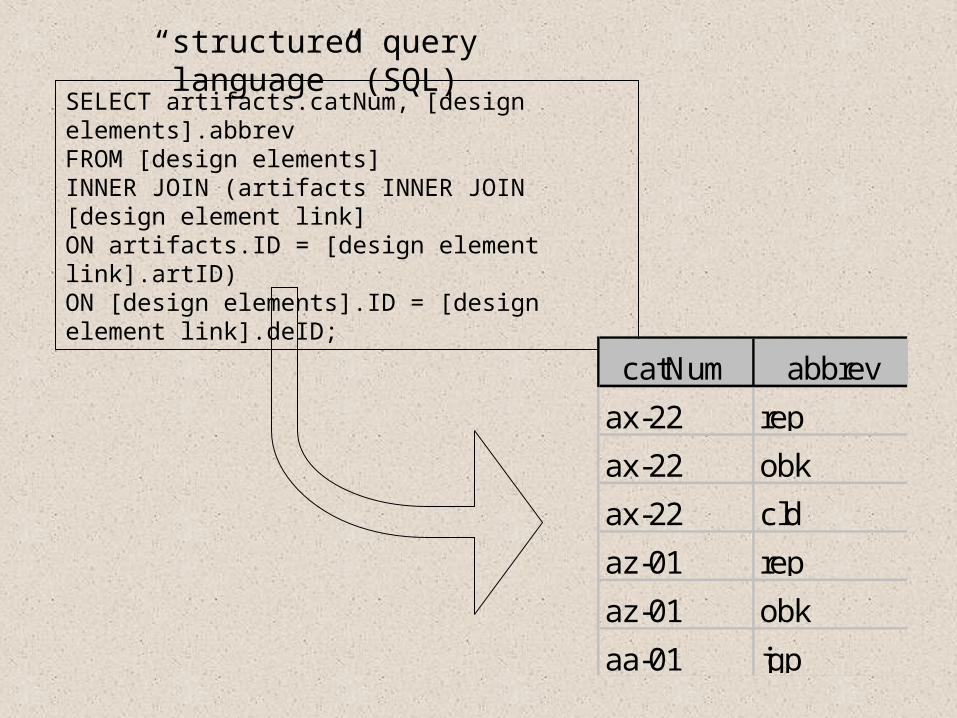
SELECT artifacts.catNum, [design elements].abbrevFROM [design elements] INNER JOIN (artifacts INNER JOIN [design element link] ON artifacts.ID = [design element link].artID) ON [design elements].ID = [design element link].deID;
catNum abbrev
ax-22 rep
ax-22 obk
ax-22 cld
az-01 rep
az-01 obk
aa-01 jgp
“structured query language” (SQL)